UNITED STATES
SECURITIES AND EXCHANGE
COMMISSION
Washington, D.C. 20549
FORM 6-K
REPORT OF FOREIGN
PRIVATE ISSUER
PURSUANT TO RULE 13A-16 OR 15D-16
UNDER THE SECURITIES
EXCHANGE ACT OF 1934
For the month of May 2024
Commission File Number 001-39966
New Found Gold Corp.
(Translation of Registrant’s
name into English)
1600
- 595 Burrard Street Vancouver, BC
Canada V7X 1L4
(Address of principal
executive office)
Indicate by check mark whether the registrant
files or will file annual reports under cover of Form 20-F or Form 40-F:
Form 20-F ¨
Form 40-F x
INCORPORATION BY REFERENCE
Exhibits 99.1 and 99.2 of this Form 6-K are
incorporated by reference as additional exhibits to the registrant’s Registration Statement on Form F-10 (File No. 333- 266285).
DOCUMENTS
INCLUDED AS PART OF THIS REPORT
SIGNATURES
Pursuant to the requirements
of the Securities Exchange Act of 1934, the registrant has duly caused this report to be signed on its behalf by the undersigned, thereunto
duly authorized.
| |
New Found Gold Corp. |
| |
|
|
| Date: May 9, 2024 |
By: |
/s/ Michael Kanevsky |
| |
|
Name: |
Michael Kanevsky |
| |
|
Title: |
Chief Financial Officer |
Exhibit 99.1

CONDENSED INTERIM FINANCIAL STATEMENTS
FOR THE THREE MONTHS ENDED
MARCH 31, 2024 AND 2023
(Unaudited - Expressed in Canadian Dollars)
New Found Gold Corp.
Condensed Interim Statements of Financial
Position
(Unaudited - Expressed in Canadian Dollars)
| | |
Note | | |
March 31,
2024
$ | | |
December 31,
2023
$ | |
| ASSETS | |
| | | |
| | | |
| | |
| Current assets | |
| | | |
| | | |
| | |
| Cash | |
| | | |
| 50,252,203 | | |
| 53,884,809 | |
| Amounts receivable | |
| | | |
| 115,500 | | |
| - | |
| Interest receivable | |
| 7 | | |
| 76,761 | | |
| 75,322 | |
| Sales taxes recoverable | |
| | | |
| 1,972,364 | | |
| 3,299,646 | |
| Investments | |
| 5 | | |
| 3,290,838 | | |
| 3,596,592 | |
| Prepaid expenses and deposits | |
| | | |
| 1,308,436 | | |
| 1,519,157 | |
| Total current assets | |
| | | |
| 57,016,102 | | |
| 62,375,526 | |
| | |
| | | |
| | | |
| | |
| Non-current assets | |
| | | |
| | | |
| | |
| Exploration and evaluation assets | |
| 3 | | |
| 9,095,587 | | |
| 9,093,187 | |
| Investment in Kirkland Lake Discoveries Corp. | |
| 6 | | |
| 2,461,386 | | |
| 2,861,250 | |
| Property and equipment | |
| 4 | | |
| 7,673,794 | | |
| 7,638,608 | |
| Secured notes | |
| 7 | | |
| 2,553,200 | | |
| 2,454,300 | |
| Right-of-use assets | |
| | | |
| 135,121 | | |
| 156,622 | |
| Other assets | |
| | | |
| 97,528 | | |
| - | |
| Total non-current assets | |
| | | |
| 22,016,616 | | |
| 22,203,967 | |
| | |
| | | |
| | | |
| | |
| Total Assets | |
| | | |
| 79,032,718 | | |
| 84,579,493 | |
| LIABILITIES | |
| | | |
| | | |
| | |
| Current liabilities | |
| | | |
| | | |
| | |
| Accounts payable and accrued liabilities | |
| 9,11 | | |
| 5,450,827 | | |
| 6,492,354 | |
| Flow-through share premium | |
| 8 | | |
| 9,019,410 | | |
| 12,426,322 | |
| Lease liabilities | |
| | | |
| 68,628 | | |
| 88,958 | |
| Total current liabilities | |
| | | |
| 14,538,865 | | |
| 19,007,634 | |
| Lease liabilities | |
| | | |
| 68,951 | | |
| 68,839 | |
| Total non-current liabilities | |
| | | |
| 68,951 | | |
| 68,839 | |
| | |
| | | |
| | | |
| | |
| Total liabilities | |
| | | |
| 14,607,816 | | |
| 19,076,473 | |
| | |
| | | |
| | | |
| | |
| EQUITY | |
| | | |
| | | |
| | |
| Share capital | |
| 10 | | |
| 301,797,225 | | |
| 290,244,029 | |
| Reserves | |
| 10 | | |
| 35,305,967 | | |
| 34,755,069 | |
| Deficit | |
| | | |
| (272,678,290 | ) | |
| (259,496,078 | ) |
| Total equity | |
| | | |
| 64,424,902 | | |
| 65,503,020 | |
| | |
| | | |
| | | |
| | |
| Total Liabilities and Equity | |
| | | |
| 79,032,718 | | |
| 84,579,493 | |
NATURE
OF OPERATIONS AND GOING CONCERN (Note 1)
COMMITMENTS (Notes 3 and 8)
CONTINGENCY (Note 14)
SUBSEQUENT EVENTS (Note 16)
These condensed interim financial statements are
authorized for issue by the Board of Directors on May 9, 2024. They are signed on the Company’s behalf by:
| “Collin Kettell” |
, Director |
| “Douglas Hurst” |
, Director |
The
accompanying notes are an integral part of these condensed interim financial statements.
New Found Gold Corp.
Condensed Interim Statements of Loss and Comprehensive Loss
(Unaudited - Expressed in Canadian Dollars,
except share amounts)
| | |
| | |
Three months ended March 31, | |
| | |
Note | | |
2024
$ | | |
2023
$ | |
| Expenses | |
| | | |
| | | |
| | |
| Corporate development and investor relations | |
| 11 | | |
| 221,703 | | |
| 356,920 | |
| Depreciation | |
| 4 | | |
| 214,618 | | |
| 250,600 | |
| Exploration and evaluation expenditures | |
| 3, 11 | | |
| 14,161,263 | | |
| 21,646,785 | |
| Office and sundry | |
| | | |
| 202,891 | | |
| 188,116 | |
| Professional fees | |
| | | |
| 381,692 | | |
| 624,478 | |
| Salaries and consulting | |
| 11 | | |
| 542,832 | | |
| 624,114 | |
| Share-based compensation | |
| 10,11 | | |
| 550,898 | | |
| 530,247 | |
| Transfer agent and regulatory fees | |
| | | |
| 189,638 | | |
| 157,586 | |
| Travel | |
| | | |
| 47,766 | | |
| 79,367 | |
| Loss from operating activities | |
| | | |
| (16,513,301 | ) | |
| (24,458,213 | ) |
| Other income (expenses) | |
| | | |
| | | |
| | |
| Settlement of flow-through share premium liability | |
| 8 | | |
| 3,406,912 | | |
| 5,454,592 | |
| Foreign exchange gain (loss) | |
| | | |
| 69,740 | | |
| (5,779 | ) |
| Loss from equity investment | |
| 6 | | |
| (399,864 | ) | |
| - | |
| Part XII.6 tax | |
| 8 | | |
| (288,567 | ) | |
| - | |
| Revaluation of secured notes | |
| 7 | | |
| 38,753 | | |
| - | |
| Interest expense | |
| | | |
| (7,076 | ) | |
| (6,672 | ) |
| Interest income | |
| | | |
| 816,945 | | |
| 875,174 | |
| Unrealized losses on investments | |
| 5 | | |
| (305,754 | ) | |
| (1,911,445 | ) |
| Total | |
| | | |
| 3,331,089 | | |
| 4,405,870 | |
| Loss and comprehensive loss for the period | |
| | | |
| (13,182,212 | ) | |
| (20,052,343 | ) |
| Loss per share – basic and diluted ($) | |
| 12 | | |
| (0.07 | ) | |
| (0.11 | ) |
| Weighted average number of common shares outstanding – basic and diluted | |
| 12 | | |
| 187,534,833 | | |
| 175,377,526 | |
The
accompanying notes are an integral part of these condensed interim financial statements.
New Found Gold Corp.
Condensed Interim Statements of Cash Flows
(Unaudited - Expressed in Canadian Dollars)
| | |
Three months ended March 31, | |
| | |
2024
$ | | |
2023
$ | |
| Cash flows from operating activities | |
| | | |
| | |
| Loss for the period | |
| (13,182,212 | ) | |
| (20,052,343 | ) |
| Adjustments for: | |
| | | |
| | |
| Depreciation | |
| 214,618 | | |
| 250,600 | |
| Loss from equity investment | |
| 399,864 | | |
| - | |
| Interest income | |
| (76,761 | ) | |
| - | |
| Interest expense | |
| 7,076 | | |
| 6,672 | |
| Revaluation of secured notes | |
| (38,753 | ) | |
| - | |
| Foreign exchange (gain) on secured notes | |
| (60,147 | ) | |
| - | |
| Unrealized foreign exchange (gain) | |
| (16,222 | ) | |
| - | |
| Settlement of flow-through share premium liability | |
| (3,406,912 | ) | |
| (5,454,592 | ) |
| Share-based compensation | |
| 550,898 | | |
| 530,247 | |
| Unrealized losses on investments | |
| 305,754 | | |
| 1,911,445 | |
| | |
| (15,302,797 | ) | |
| (22,807,971 | ) |
| Change in non-cash working capital items: | |
| | | |
| | |
| (Increase) in amounts receivable | |
| (115,500 | ) | |
| (45,450 | ) |
| Decrease (increase) in prepaid expenses and deposits | |
| 210,721 | | |
| (8,807 | ) |
| Decrease (increase) in sales taxes recoverable | |
| 1,327,282 | | |
| (2,719,163 | ) |
| (Increase) in other assets | |
| - | | |
| (32,306 | ) |
| (Decrease) increase in accounts payable and accrued liabilities | |
| (1,263,845 | ) | |
| 299,470 | |
| Net cash (used in) operating activities | |
| (15,144,139 | ) | |
| (25,314,227 | ) |
| | |
| | | |
| | |
| Cash flows from investing activities | |
| | | |
| | |
| Interest received on secured notes | |
| 75,322 | | |
| - | |
| Expenditures on claim staking and license renewals | |
| (2,400 | ) | |
| (2,400 | ) |
| Purchases of property and equipment | |
| (122,500 | ) | |
| (643,225 | ) |
| Net cash (used in) investing activities | |
| (49,578 | ) | |
| (645,625 | ) |
| | |
| | | |
| | |
| Cash flows from financing activities | |
| | | |
| | |
| Issuance of common shares in prospectus offering | |
| 11,878,079 | | |
| - | |
| Share issue costs | |
| (289,038 | ) | |
| - | |
| Lease principal payments | |
| (37,449 | ) | |
| (32,475 | ) |
| Lease interest payments | |
| (7,076 | ) | |
| (6,672 | ) |
| Net cash generated from (used in) financing activities | |
| 11,544,516 | | |
| (39,147 | ) |
| | |
| | | |
| | |
| Effect of exchange rate fluctuations on cash held | |
| 16,595 | | |
| - | |
| Net (decrease) in cash | |
| (3,649,201 | ) | |
| (25,998,999 | ) |
| Cash at beginning of period | |
| 53,884,809 | | |
| 82,165,273 | |
| Cash at end of period | |
| 50,252,203 | | |
| 56,166,274 | |
SUPPLEMENTAL DISCLOSURE WITH RESPECT TO CASH
FLOWS (Note 13)
The
accompanying notes are an integral part of these condensed interim financial statements.
New Found Gold Corp.
Condensed Interim Statements of Changes in
Equity
(Unaudited - Expressed in Canadian Dollars,
except share amounts)
| |
|
Share
capital |
|
|
Reserves |
|
|
|
|
|
|
|
| |
|
Number
of
shares |
|
|
Amount
$ |
|
|
Equity
settled
share-based
payments
$ |
|
|
Warrants
$ |
|
|
Deficit
$ |
|
|
Total
equity
$ |
|
| Balance at December 31,
2022 |
|
|
175,377,526 |
|
|
|
229,632,005 |
|
|
|
33,443,292 |
|
|
|
3,918 |
|
|
|
(179,605,315 |
) |
|
|
83,473,900 |
|
| Share-based compensation |
|
|
- |
|
|
|
- |
|
|
|
530,247 |
|
|
|
- |
|
|
|
- |
|
|
|
530,247 |
|
| Total comprehensive
loss for the period |
|
|
- |
|
|
|
- |
|
|
|
- |
|
|
|
- |
|
|
|
(20,052,343 |
) |
|
|
(20,052,343 |
) |
| Balance at March 31, 2023 |
|
|
175,377,526 |
|
|
|
229,632,005 |
|
|
|
33,973,539 |
|
|
|
3,918 |
|
|
|
(199,657,658 |
) |
|
|
63,951,804 |
|
| Issued pursuant to acquisition of
exploration and evaluation assets |
|
|
39,762 |
|
|
|
203,979 |
|
|
|
- |
|
|
|
- |
|
|
|
- |
|
|
|
203,979 |
|
| Issued in prospectus offering Share issue costs |
|
|
11,277,224 |
|
|
|
78,986,588 |
|
|
|
- |
|
|
|
- |
|
|
|
- |
|
|
|
78,986,588 |
|
| Flow-through share premium |
|
|
- |
|
|
|
(15,295,500 |
) |
|
|
- |
|
|
|
- |
|
|
|
- |
|
|
|
(15,295,500 |
) |
| Share issue costs |
|
|
- |
|
|
|
(3,517,377 |
) |
|
|
- |
|
|
|
- |
|
|
|
- |
|
|
|
(3,517,377 |
) |
| Stock options exercised |
|
|
178,500 |
|
|
|
234,334 |
|
|
|
(102,704 |
) |
|
|
- |
|
|
|
- |
|
|
|
131,630 |
|
| Share-based compensation |
|
|
- |
|
|
|
- |
|
|
|
880,316 |
|
|
|
- |
|
|
|
- |
|
|
|
880,316 |
|
| Total comprehensive
loss for the period |
|
|
- |
|
|
|
- |
|
|
|
- |
|
|
|
- |
|
|
|
(59,838,420 |
) |
|
|
(59,838,420 |
) |
| Balance at December 31, 2023 |
|
|
186,873,012 |
|
|
|
290,244,029 |
|
|
|
34,751,151 |
|
|
|
3,918 |
|
|
|
(259,496,078 |
) |
|
|
65,503,020 |
|
| Issued in prospectus offering |
|
|
2,561,690 |
|
|
|
11,878,079 |
|
|
|
- |
|
|
|
- |
|
|
|
- |
|
|
|
11,878,079 |
|
| Share issue costs |
|
|
- |
|
|
|
(324,883 |
) |
|
|
- |
|
|
|
- |
|
|
|
- |
|
|
|
(324,883 |
) |
| Share-based compensation |
|
|
- |
|
|
|
- |
|
|
|
550,898 |
|
|
|
- |
|
|
|
- |
|
|
|
550,898 |
|
| Total comprehensive
loss for the period |
|
|
- |
|
|
|
- |
|
|
|
- |
|
|
|
- |
|
|
|
(13,182,212 |
) |
|
|
(13,182,212 |
) |
| Balance at March 31, 2024 |
|
|
189,434,702 |
|
|
|
301,797,225 |
|
|
|
35,302,049 |
|
|
|
3,918 |
|
|
|
(272,678,290 |
) |
|
|
64,424,902 |
|
The
accompanying notes are an integral part of these condensed interim financial statements.
New Found Gold Corp.
Notes to the Condensed Interim Financial Statements
For the three months ended March 31, 2024 and 2023
(Unaudited - Expressed in Canadian Dollars Unless Otherwise Noted)
| 1. | NATURE OF OPERATIONS AND GOING CONCERN |
New Found Gold Corp. (the “Company”)
was incorporated on January 6, 2016, under the Business Corporations Act in the Province of Ontario. On June 23, 2020, the Company
continued as a British Columbia corporation under the Business Corporations Act in the Province of British Columbia. The Company’s
registered office is located at Suite 3500, The Stack, 1133 Melville Street, Vancouver, British Columbia V6E 4E5.
The
Company is a mineral exploration company engaged in the acquisition, exploration and evaluation of resource properties with a focus on
gold properties located in Newfoundland and Labrador, Canada. The Company’s exploration and evaluation assets presently have
no proven or probable reserves, and on the basis of information to date, it has not yet determined whether these properties contain economically
recoverable resources. The recoverability of amounts shown for exploration and evaluation assets are dependent upon the existence of economically
recoverable reserves or the Company’s ability to recover the value of exploration and evaluation assets through their sale, the
ability of the Company to obtain necessary financing to complete the development of those reserves and upon future profitable production.
These financial statements have been
prepared assuming the Company will continue on a going-concern basis and do not include adjustments to amounts and classifications of
assets and liabilities that might be necessary should the Company be unable to continue operations. The ability of the Company to continue
as a going concern depends upon its ability to develop profitable operations and to continue to raise adequate financing. As at March 31,
2024, the Company had an accumulated deficit of $272,678,290 and shareholders’ equity of $64,424,902. In addition, the Company has
a working capital surplus, calculated as current assets less current liabilities, of $42,477,237, consisting primarily of cash, and negative
cash flow from operating activities of $15,144,139 for the three months ended March 31, 2024.
Management is actively targeting sources
of additional financing through alliances with financial, exploration and mining entities, or other business and financial transactions
which would assure continuation of the Company’s operations and exploration programs. In order for the Company to meet its liabilities
as they come due and to continue its operations, the Company is solely dependent upon its ability to generate such financing. These items
give rise to material uncertainties that cast significant doubt as to the Company’s ability to continue as a going concern.
These condensed interim financial statements were approved
by the Board of Directors of the Company on May 9, 2024.
| 2. | MATERIAL ACCOUNTING POLICY INFORMATION |
The principal accounting policies applied
in the preparation of these financial statements are set out below.
| a) | Statement of compliance |
The
Company’s condensed interim financial statements have been prepared in accordance with International Financial Reporting Standards
(“IFRS”), as applicable to interim financial reports including International Accounting Standards 34 “Interim Financial
Reporting” issued by the International Accounting Standards Board (“IASB”).
New Found Gold Corp.
Notes to the Condensed Interim Financial Statements
For the three months ended March 31, 2024 and 2023
(Unaudited - Expressed in Canadian Dollars Unless Otherwise Noted)
| 2. |
MATERIAL ACCOUNTING POLICY INFORMATION (continued) |
| a) | Statement of compliance (continued) |
These condensed interim financial statements
do not include all the information and note disclosures required by IFRS for annual financial statements and should be read in conjunction
with the annual financial statements for the year ended December 31, 2023, which have been prepared in accordance with IFRS as issued
by the IASB.
The policies applied in these condensed
interim financial statements are the same as those applied in the most recent annual financial statements and were consistently applied
to all the periods presented.
These condensed interim financial statements
are expressed in Canadian dollars and have been prepared on a historical cost basis except for financial instruments classified as subsequently
measured at fair value. In addition, these financial statements have been prepared using the accrual basis of accounting, except for cash
flow information.
Certain comparative figures have been
reclassified to conform to the current period presentation.
| c) | Significant Accounting Estimates and Judgments |
The preparation of these condensed interim
financial statements requires management to make certain estimates, judgments and assumptions that affect the reported amounts of assets
and liabilities at the date of the financial statements and reported amounts of expenses during the reporting period. Actual outcomes
could differ from these estimates.
In
preparing these condensed interim financial statements, the Company applied the critical judgments and estimates disclosed in Note
2 of its audited financial statements for the year ended December 31, 2023.
| d) | Initial application of standards, interpretations and amendments to standards and interpretations in
the reporting period |
The
IASB issued certain new accounting standards or amendments that are mandatory for accounting periods on or after January 1, 2024,
including amendments to IAS 1 “Classification of Liabilities as Current
or Non-Current”, amendments to IFRS 16 “Leases”, and amendments to IAS 7 “Statement of Cash Flow” and IFRS
7 “Financial Instruments Disclosures”. The effect of such new accounting standards or amendments did not have a material impact
on the Company and therefore the Company did not record any adjustments to the financial statements.
| e) | New and amended IFRS standards not yet effective |
Certain
new accounting standards or interpretations have been published that are not mandatory for the current period and have not been early
adopted. These standards and interpretations are not expected to have a material impact on the Company’s financial statements, except
for IFRS 18 “Presentation and Disclosure in Financial Statements”.
IFRS 18 includes requirements for all
entities applying IFRS for the presentation and disclosure of information in financial statements and has an effective date of January 1,
2027. The effects of the adoption of IFRS 18 on the Company’s financial statements have not yet been determined.
New Found Gold Corp.
Notes to the Condensed Interim Financial Statements
For the three months ended March 31, 2024 and 2023
(Unaudited - Expressed in Canadian Dollars Unless Otherwise Noted)
| 3. |
EXPLORATION AND EVALUATION ASSETS |
The schedules
below summarize the carrying costs of acquisition costs and exploration expenditures incurred to date for each exploration and evaluation
asset that the Company is continuing to explore as at March 31, 2024 and December 31, 2023:
| |
|
Newfoundland |
|
| Three
months ended March 31, 2024 |
|
Queensway(i)
$ |
|
|
Other
$ |
|
|
Total
$ |
|
| Exploration and evaluation assets |
|
|
|
|
|
|
|
|
|
|
|
|
| Balance as at December 31, 2023 |
|
|
9,014,478 |
|
|
|
78,709 |
|
|
|
9,093,187 |
|
| Additions: |
|
|
|
|
|
|
|
|
|
|
|
|
| Claim staking and license renewal costs |
|
|
2,400 |
|
|
|
- |
|
|
|
2,400 |
|
| Balance as at March
31, 2024 |
|
|
9,016,878 |
|
|
|
78,709 |
|
|
|
9,095,587 |
|
| |
|
|
|
|
|
|
|
|
|
|
|
|
| Exploration and evaluation expenditures |
|
|
|
|
|
|
|
|
|
|
|
|
| Cumulative exploration expense - December 31,
2023 |
|
|
215,285,192 |
|
|
|
574,857 |
|
|
|
215,860,049 |
|
| Assays |
|
|
2,605,635 |
|
|
|
- |
|
|
|
2,605,635 |
|
| Drilling |
|
|
5,946,537 |
|
|
|
- |
|
|
|
5,946,537 |
|
| Environmental studies |
|
|
355,144 |
|
|
|
- |
|
|
|
355,144 |
|
| Geochemistry |
|
|
103,927 |
|
|
|
- |
|
|
|
103,927 |
|
| Geophysics |
|
|
256,074 |
|
|
|
- |
|
|
|
256,074 |
|
| Imagery and mapping |
|
|
28,409 |
|
|
|
69 |
|
|
|
28,478 |
|
| Metallurgy |
|
|
220,676 |
|
|
|
- |
|
|
|
220,676 |
|
| Office and general |
|
|
206,081 |
|
|
|
- |
|
|
|
206,081 |
|
| Other |
|
|
687,809 |
|
|
|
- |
|
|
|
687,809 |
|
| Permitting |
|
|
100,956 |
|
|
|
- |
|
|
|
100,956 |
|
| Property taxes, mining leases and rent |
|
|
81,466 |
|
|
|
- |
|
|
|
81,466 |
|
| Reclamation |
|
|
196,577 |
|
|
|
- |
|
|
|
196,577 |
|
| Salaries and consulting |
|
|
2,694,021 |
|
|
|
- |
|
|
|
2,694,021 |
|
| Seismic survey |
|
|
117,583 |
|
|
|
- |
|
|
|
117,583 |
|
| Supplies and equipment |
|
|
433,064 |
|
|
|
- |
|
|
|
433,064 |
|
| Travel and accommodations |
|
|
241,135 |
|
|
|
- |
|
|
|
241,135 |
|
| Trenching |
|
|
1,600 |
|
|
|
- |
|
|
|
1,600 |
|
| Exploration cost recovery |
|
|
(115,500 |
) |
|
|
- |
|
|
|
(115,500 |
) |
| |
|
|
14,161,194 |
|
|
|
69 |
|
|
|
14,161,263 |
|
| Cumulative exploration expense – March
31, 2024 |
|
|
229,446,386 |
|
|
|
574,926 |
|
|
|
230,021,312 |
|
New Found Gold Corp.
Notes to the Condensed Interim Financial Statements
For the three months ended March 31, 2024 and 2023
(Unaudited - Expressed in Canadian Dollars Unless Otherwise Noted)
| 3. |
EXPLORATION AND EVALUATION ASSETS (continued) |
| |
|
Newfoundland |
|
|
|
|
| Three months ended March 31,
2023 |
|
Queensway(i)
$ |
|
|
Other
$ |
|
|
Ontario
$ |
|
|
Total
$ |
|
| Exploration and evaluation assets |
|
|
|
|
|
|
|
|
|
|
|
|
|
|
|
|
| Balance as at December 31, 2022 |
|
|
8,616,693 |
|
|
|
47,916 |
|
|
|
272,000 |
|
|
|
8,936,609 |
|
| Additions: |
|
|
|
|
|
|
|
|
|
|
|
|
|
|
|
|
| Claim staking and license renewal costs |
|
|
2,400 |
|
|
|
- |
|
|
|
- |
|
|
|
2,400 |
|
| Balance as at March 31, 2023 |
|
|
8,619,093 |
|
|
|
47,916 |
|
|
|
272,000 |
|
|
|
8,939,009 |
|
| |
|
|
|
|
|
|
|
|
|
|
|
|
|
|
|
|
| Exploration and evaluation expenditures |
|
|
|
|
|
|
|
|
|
|
|
|
|
|
|
|
| Cumulative exploration expense - December 31,
2022 |
|
|
121,302,318 |
|
|
|
539,998 |
|
|
|
3,428,034 |
|
|
|
125,270,350 |
|
| Assays |
|
|
3,076,329 |
|
|
|
50 |
|
|
|
- |
|
|
|
3,076,379 |
|
| Drilling |
|
|
10,434,259 |
|
|
|
- |
|
|
|
- |
|
|
|
10,434,259 |
|
| Environmental studies |
|
|
213,144 |
|
|
|
- |
|
|
|
- |
|
|
|
213,144 |
|
| Geochemistry |
|
|
248,815 |
|
|
|
- |
|
|
|
- |
|
|
|
248,815 |
|
| Geophysics |
|
|
209,436 |
|
|
|
- |
|
|
|
- |
|
|
|
209,436 |
|
| Imagery and mapping |
|
|
40,033 |
|
|
|
- |
|
|
|
- |
|
|
|
40,033 |
|
| Metallurgy |
|
|
15,756 |
|
|
|
- |
|
|
|
- |
|
|
|
15,756 |
|
| Office and general |
|
|
238,206 |
|
|
|
- |
|
|
|
144 |
|
|
|
238,350 |
|
| Permitting |
|
|
13,493 |
|
|
|
- |
|
|
|
- |
|
|
|
13,493 |
|
| Property taxes, mining leases and rent |
|
|
86,673 |
|
|
|
- |
|
|
|
2,123 |
|
|
|
88,796 |
|
| Reclamation |
|
|
252,027 |
|
|
|
- |
|
|
|
- |
|
|
|
252,027 |
|
| Salaries and consulting |
|
|
2,706,338 |
|
|
|
9,714 |
|
|
|
8,000 |
|
|
|
2,724,052 |
|
| Seismic survey |
|
|
2,580,660 |
|
|
|
- |
|
|
|
- |
|
|
|
2,580,660 |
|
| Supplies and equipment |
|
|
1,185,869 |
|
|
|
- |
|
|
|
480 |
|
|
|
1,186,349 |
|
| Technical reports |
|
|
55,025 |
|
|
|
- |
|
|
|
- |
|
|
|
55,025 |
|
| Travel and accommodations |
|
|
315,352 |
|
|
|
309 |
|
|
|
- |
|
|
|
315,661 |
|
| Exploration cost recovery |
|
|
(45,450 |
) |
|
|
- |
|
|
|
- |
|
|
|
(45,450 |
) |
| |
|
|
21,625,965 |
|
|
|
10,073 |
|
|
|
10,747 |
|
|
|
21,646,785 |
|
| Cumulative exploration expense – March
31, 2023 |
|
|
142,928,283 |
|
|
|
550,071 |
|
|
|
3,438,781 |
|
|
|
146,917,135 |
|
| (i) | Queensway Project – Gander, Newfoundland |
As at March 31, 2024, the Company
owned a 100% interest in 96 (December 31, 2023 – 96) mineral licenses including 6,659 claims (December 31, 2023 –
6,659 claims) comprising 166,475 hectares of land (December 31, 2023 – 166,475) located near Gander, Newfoundland. The project
rights were acquired by map staking mineral licenses and making staged payments in cash and common shares of the Company from 2016 through
2022 under ten separate option agreements, of which nine are completed. The Queensway Project carries various net smelter return (“NSR”)
royalties ranging from 0.4% to 2.5% and include buy-back provisions that allows the Company, at its option, to reduce the NSR by making
lump-sum payments ranging from $250,000 to $1,000,000 to the holders of the royalties. The total cost of the NSR’s if the Company
were to exercise all of its buy-back rights is $5,250,000 resulting in NSR’s ranging from 0.4% to 1.5% for the mineral licenses
subject to an NSR royalty.
New Found Gold Corp.
Notes to the Condensed Interim Financial Statements
For the three months ended March 31, 2024 and 2023
(Unaudited - Expressed in Canadian Dollars Unless Otherwise Noted)
3. EXPLORATION
AND EVALUATION ASSETS (continued)
On November 2,
2022, the Company entered into a definitive property option agreement to acquire a 100% interest in five mineral licenses located in Gander,
Newfoundland. Under the terms of this agreement, the Company may exercise the option by issuing an aggregate of 487,078 common shares
in the capital of the Company and making aggregate cash payments of $2,350,000 to the optionors as follows:
| · | $200,000 (paid) and 39,762 common shares (issued) on the later of (i) staking confirmation date as
defined in the Option Agreement and (ii) the receipt of the TSX-Venture Exchange’s approval; |
| · | $200,000 (paid) and 39,762 common shares on or before November 2, 2023 (issued); |
| · | $250,000 and 69,583 common shares on or before November 2, 2024; |
| · | $300,000 and 89,463 common shares on or before November 2, 2025; |
| · | $600,000 and 129,224 common shares on or before November 2, 2026; and |
| · | $800,000 and 119,284 common shares on or before November 2, 2027. |
4. PROPERTY
AND EQUIPMENT
| | |
Property
and
Buildings | | |
Computer
Equipment | | |
Geological
Equipment
and Other
Facilities | | |
Vehicles | | |
Office
Furniture
and
Equipment | | |
Total | |
| | |
$ | | |
$ | | |
$ | | |
$ | | |
$ | | |
$ | |
| Cost | |
| | | |
| | | |
| | | |
| | | |
| | | |
| | |
| Balance at December 31, 2022 | |
| 6,192,912 | | |
| 93,498 | | |
| 1,547,454 | | |
| 779,888 | | |
| 30,148 | | |
| 8,643,900 | |
| Additions | |
| 172,344 | | |
| 46,395 | | |
| 763,576 | | |
| 190,230 | | |
| 8,205 | | |
| 1,180,750 | |
| Disposals | |
| - | | |
| (3,401 | ) | |
| - | | |
| (34,795 | ) | |
| - | | |
| (38,196 | ) |
| Balance at December 31, 2023 | |
| 6,365,256 | | |
| 136,492 | | |
| 2,311,030 | | |
| 935,323 | | |
| 38,353 | | |
| 9,786,454 | |
| Additions | |
| - | | |
| - | | |
| 211,072 | | |
| - | | |
| - | | |
| 211,072 | |
| Balance at March 31, 2024 | |
| 6,365,256 | | |
| 136,492 | | |
| 2,522,102 | | |
| 935,323 | | |
| 38,353 | | |
| 9,997,526 | |
| | |
| | | |
| | | |
| | | |
| | | |
| | | |
| | |
| Accumulated Depreciation | |
| | | |
| | | |
| | | |
| | | |
| | | |
| | |
| Balance at December 31, 2022 | |
| 141,526 | | |
| 43,789 | | |
| 787,598 | | |
| 403,561 | | |
| 412 | | |
| 1,376,886 | |
| Depreciation | |
| 271,505 | | |
| 42,327 | | |
| 228,621 | | |
| 244,312 | | |
| 7,379 | | |
| 794,144 | |
| Disposals | |
| - | | |
| (567 | ) | |
| - | | |
| (22,617 | ) | |
| - | | |
| (23,184 | ) |
| Balance at December 31, 2023 | |
| 413,031 | | |
| 85,549 | | |
| 1,016,219 | | |
| 625,256 | | |
| 7,791 | | |
| 2,147,846 | |
| Depreciation | |
| 69,399 | | |
| 10,426 | | |
| 44,016 | | |
| 50,127 | | |
| 1,918 | | |
| 175,886 | |
| Balance at March 31, 2024 | |
| 482,430 | | |
| 95,975 | | |
| 1,060,235 | | |
| 675,383 | | |
| 9,709 | | |
| 2,323,732 | |
| | |
| | | |
| | | |
| | | |
| | | |
| | | |
| | |
| Carrying Amount | |
| | | |
| | | |
| | | |
| | | |
| | | |
| | |
| At December 31, 2023 | |
| 5,952,225 | | |
| 50,943 | | |
| 1,294,811 | | |
| 310,067 | | |
| 30,562 | | |
| 7,638,608 | |
| At March 31, 2024 | |
| 5,882,826 | | |
| 40,517 | | |
| 1,461,867 | | |
| 259,940 | | |
| 28,644 | | |
| 7,673,794 | |
New Found Gold Corp.
Notes to the Condensed Interim Financial Statements
For the three months ended March 31, 2024 and 2023
(Unaudited - Expressed in Canadian Dollars Unless Otherwise Noted)
5. INVESTMENTS
The Company classifies its investments
at fair value through profit or loss. Realized gains and losses on disposal of investments and unrealized gains and losses in the fair
value of investments are reflected in profit or loss in the period in which they occur.
Investments consist of the following
as at March 31, 2024 and December 31, 2023:
| | |
March 31, 2024 | | |
December 31, 2023 | |
| | |
$ | | |
$ | |
| Equities held (i) | |
| 3,057,138 | | |
| 3,408,092 | |
| Warrants held (ii) | |
| 233,700 | | |
| 188,500 | |
| Total Investments | |
| 3,290,838 | | |
| 3,596,592 | |
(i) Equities held
The Company held the following equities
as at March 31, 2024 and December 31, 2023:
| | |
Quantity | | |
Cost
$ | | |
Fair Value
March 31, 2024
$ | |
| Exploits Discovery Corp. | |
| 13,229,466 | | |
| 8,462,704 | | |
| 859,916 | |
| Labrador Gold Corp. | |
| 12,555,556 | | |
| 8,850,000 | | |
| 2,197,222 | |
| Long Range Exploration Corporation | |
| 5,000,000 | | |
| 500,000 | | |
| - | |
| Total Equities | |
| | | |
| 17,812,704 | | |
| 3,057,138 | |
| | |
Quantity | | |
Cost
$ | | |
Fair Value
December 31, 2023
$ | |
| Exploits Discovery Corp. | |
| 13,229,466 | | |
| 8,462,704 | | |
| 1,587,536 | |
| Labrador Gold Corp. | |
| 12,555,556 | | |
| 8,850,000 | | |
| 1,820,556 | |
| Long Range Exploration Corporation | |
| 5,000,000 | | |
| 500,000 | | |
| - | |
| Total Equities | |
| | | |
| 17,812,704 | | |
| 3,408,092 | |
Investments in Exploits Discovery Corp.
and Labrador Gold Corp. represent investments in public companies that are quoted on an active exchange and are measured using the quoted
market price of these companies.
Long
Range Exploration Corporation is a private company without observable market prices for its common shares and is measured at its
estimated fair value based on valuation techniques that use inputs derived by management and is considered Level 3 in the fair value hierarchy
(Note 15).
(ii) Warrants held
The Company held the following
warrants as at March 31, 2024 and December 31, 2023:
| | |
Quantity | | |
Cost
$ | | |
Fair Value
March 31, 2024
$ | |
| Maritime Resources Corp. (1) | |
| 15,324,571 | | |
| 174,500 | | |
| 233,700 | |
| Total Warrants | |
| | | |
| 174,500 | | |
| 233,700 | |
New Found Gold Corp.
Notes to the Condensed Interim Financial Statements
For the three months ended March 31, 2024 and 2023
(Unaudited - Expressed in Canadian Dollars Unless Otherwise Noted)
5. INVESTMENTS
(continued)
(ii) Warrants held (continued)
| | |
Quantity | | |
Cost
$ | | |
Fair Value
December 31, 2023
$ | |
| Maritime Resources Corp. (1) | |
| 15,324,571 | | |
| 174,500 | | |
| 188,500 | |
| Total Warrants | |
| | | |
| 174,500 | | |
| 188,500 | |
(1)
Each warrant is exercisable into one common share of Maritime Resources Corp. at a price of
$0.07 per warrant until August 14, 2025, subject to extension to August 14, 2026 in the event that the Initial Maturity Date
of the notes is extended to the Extended Maturity Date as defined in Note 7.
Warrants that do not have a quoted market
price are valued using a Black-Scholes option pricing model using assumptions including risk free interest rate, expected dividend yield,
expected volatility, and expected remaining life of the warrant, which are supported by observable market conditions.
An analysis of investments including
related gains and losses for the three months ended March 31, 2024 and 2023 is as follows:
| | |
Three months ended March 31, | |
| | |
2024
$ | | |
2023
$ | |
| Investments, beginning of period | |
| 3,596,592 | | |
| 7,501,155 | |
| Unrealized losses on investments | |
| (305,754 | ) | |
| (1,911,445 | ) |
| Investments, end of period | |
| 3,290,838 | | |
| 5,589,710 | |
6. INVESTMENT
IN KIRKLAND LAKE DISCOVERIES CORP.
The
investment in Kirkland Lake Discoveries Corp. represents 32.29% of the issued and outstanding common shares of KLDC at the time
of closing and as at March 31, 2024. The companies have a director and officer in common, being Denis Laviolette, Director and President,
who was appointed to the board of KLDC at the time of closing. The Company also exercised its right to nominate two additional directors
to the board of directors of Kirkland Lake Discoveries Corp. Based on assessments of the relevant facts and circumstances, primarily,
the Company's ownership interests, board representation and ability to influence operating, strategic and financing decisions, the Company
concluded that it continues to have significant influence over KLDC, and as a result has accounted for it as an investment in an associate
since the acquisition of its ownership interest on May 25, 2023.
New Found Gold Corp.
Notes to the Condensed Interim Financial Statements
For the three months ended March 31, 2024 and 2023
(Unaudited - Expressed in Canadian Dollars Unless Otherwise Noted)
6. INVESTMENT
IN KIRKLAND LAKE DISCOVERIES CORP. (continued)
The
following tables illustrate the summarised financial information of the Company’s investment in KLDC as at March 31,
2024 and December 31, 2023 on a 100% basis and reflecting adjustments made by the Company, including fair value adjustments made
at the time of acquisition and adjustments for differences due to accounting policies:
| | |
March 31, 2024
$ | | |
December 31, 2023
$ | |
| Summarised Statement of Financial Position | |
| | | |
| | |
| Current assets | |
| 3,413,328 | | |
| 4,601,136 | |
| Non-current assets | |
| 4,582,328 | | |
| 4,583,769 | |
| Current liabilities | |
| (371,745 | ) | |
| (322,453 | ) |
| Non-current liabilities | |
| - | | |
| - | |
| Net Assets | |
| 7,623,911 | | |
| 8,862,452 | |
| The Company’s ownership interest | |
| 32.29 | % | |
| 32.29 | % |
| Share of Kirkland Lake Discoveries Corp.’s net assets | |
| 2,461,386 | | |
| 2,861,250 | |
| | |
Three months ended
March 31, 2024
$ | |
| Summarised Statement of Loss and Comprehensive Loss | |
| | |
| Net loss and comprehensive loss for the period | |
| (1,238,542 | ) |
| Share of Kirkland Lake Discoveries Corp.’s loss for the three months ended March 31, 2024 | |
| (399,864 | ) |
The
Company performs an impairment indicator assessment on its investment in KLDC at each period end. The assessment is based on the
review of recent share price history, industry statistics and assessment of the current market conditions. At March 31, 2024, there
are no indicators of impairment of the Company’s investment in KLDC. During the year ended December 31, 2023, the Company recognized
an impairment of its equity investment of $1,000,237 which was included in the statement of loss and comprehensive loss for the year.
The
following table illustrates the movement in investment in associate for the period from May 25, 2023 to March 31, 2024:
| Net Carrying amount – May 25, 2023 | |
$ | 4,657,482 | |
| Share of loss from operations of associate during the period | |
| (795,995 | ) |
| Impairment of equity investment | |
| (1,000,237 | ) |
| Net Carrying amount – December 31, 2023 | |
$ | 2,861,250 | |
| Share of loss from operations of associate during the period | |
| (399,864 | ) |
| Net Carrying amount – March 31, 2024 | |
$ | 2,461,386 | |
The
estimated fair value of the Company’s investment in KLDC is $3,290,438 as at March 31, 2024 (December 31, 2023
- $2,861,250) based on the quoted market price of its common shares on the TSX Venture exchange.
New Found Gold Corp.
Notes to the Condensed Interim Financial Statements
For the three months ended March 31, 2024 and 2023
(Unaudited - Expressed in Canadian Dollars Unless Otherwise Noted)
7. SECURED NOTES
On August 14, 2023, the Company
participated in a brokered note offering completed by Maritime Resources Corp. (“Maritime”) consisting of the issuance of
non-convertible senior secured notes (the “Notes”) and common share purchase warrants. The Notes mature on August 14,
2025 (the “Initial Maturity Date”).
The Notes bear interest at a rate equal
to the Secured Overnight Financing Rate (“SOFR”) plus 6% per annum, payable quarterly in arrears. The Initial Maturity Date
of the Notes can be extended to August 14, 2026 (the “Extended Maturity Date”) at the election of Maritime subject to
the approval of holders of at least 65% of the principal amount of the Notes then outstanding.
The Notes are secured by a general security
interest over Maritime and rank senior to all existing and future indebtedness of Maritime.
Based on the business model in which
the secured notes are held and the characteristics of their contractual cash flows, the secured notes are classified as a financial instrument
at fair value through profit and loss ("FVTPL") in accordance with IFRS 9 “Financial Instruments”.
The issuance of the Notes included a
40% warrant coverage resulting in the Company receiving 15,324,571 warrants (“Warrants”). These warrants were classified by
the Company as investments at FVTPL (Note 5).
The Company has allocated the gross
investment of US$1,960,000 (CAD$2,638,500) to the Notes and warrants based on their respective fair values at initial recognition. At
the time of issuance, the fair value of the Notes was CAD$2,464,000 (US$1,830,300) and the fair value of the warrants was CAD$174,500
(US$129,700).
The
following table illustrates the movement in the Company’s secured notes for the period from August 14, 2023 to March 31,
2024:
| Secured notes at August 14, 2023 | |
$ | 2,464,000 | |
| Revaluation of secured notes | |
| 33,599 | |
| Foreign exchange loss | |
| (43,299 | ) |
| Secured notes at December 31, 2023 | |
$ | 2,454,300 | |
| Revaluation of secured notes | |
| 38,753 | |
| Foreign exchange gain | |
| 60,147 | |
| Secured notes at March 31, 2024 | |
$ | 2,553,200 | |
During the three months ended March 31,
2024, the Company recognized $76,761 of interest income on the secured notes (March 31, 2023 – $Nil), all of which was included
in interest receivable at March 31, 2024 and collected subsequent to March 31, 2024.
New Found Gold Corp.
Notes to the Condensed Interim Financial Statements
For the three months ended March 31, 2024 and 2023
(Unaudited - Expressed in Canadian Dollars Unless Otherwise Noted)
8. FLOW-THROUGH
SHARE PREMIUM
| | |
Issued
November 25,
2021
$ | | |
Issued
December 14,
2022
$ | | |
Issued
November 6,
2023
$ | | |
Total
$ | |
| Balance at December 31, 2022 | |
| 5,563,350 | | |
| 14,500,000 | | |
| - | | |
| 20,063,350 | |
| Liability incurred on flow-through shares issued | |
| - | | |
| - | | |
| 15,295,500 | | |
| 15,295,500 | |
| Settlement of flow-through share premium liability on expenditures incurred | |
| (5,563,350 | ) | |
| (14,500,000 | ) | |
| (2,869,178 | ) | |
| (22,932,528 | ) |
| Balance at December 31, 2023 | |
| - | | |
| - | | |
| 12,426,322 | | |
| 12,426,322 | |
| Settlement of flow-through share premium liability on expenditures incurred | |
| - | | |
| - | | |
| (3,406,912 | ) | |
| (3,406,912 | ) |
| Balance at March 31, 2024 | |
| - | | |
| - | | |
| 9,019,410 | | |
| 9,019,410 | |
Flow-through share arrangements entitle
the holder of the flow-through share to a 100% tax deduction in respect of qualifying Canadian exploration expenses as defined in the
Income Tax Act, Canada (“Qualifying CEE”).
During
the three months ended March 31, 2024, the Company incurred $12,474,803 (three months ended March 31, 2023 – $20,779,400)
in Qualifying CEE and amortized a total of $3,406,912 (three months ended March 31, 2023 – $5,454,592) of its flow-through
share premium liabilities.
The flow-through share premium liability
does not represent a cash liability to the Company and is to be fully amortized to the statement of loss and comprehensive loss pro-rata
with the amount of qualifying expenditures that will be incurred.
During
the three months ended March 31, 2024, the Company incurred $288,567 (three months ended March 31, 2023 – $Nil)
in Part XII.6 tax in respect of unspent flow-through proceeds renounced in year 1 under the Look-Back Rules, in accordance with the
Income Tax Act of Canada. As at March 31, 2024, the Company must spend another $33,025,621 of Qualifying CEE by December 31,
2024 to satisfy its remaining current flow-through share premium liability of $9,019,410.
| 9. | ACCOUNTS PAYABLE AND ACCRUED LIABILITIES |
| | |
March 31, 2024
$ | | |
December 31, 2023
$ | |
| Accounts payable and accrued liabilities | |
| 4,068,769 | | |
| 5,207,323 | |
| Reclamation provision(1) | |
| 1,382,058 | | |
| 1,285,031 | |
| Accounts payable and accrued liabilities, end of period | |
| 5,450,827 | | |
| 6,492,354 | |
(1)
Provincial laws and regulations concerning environmental protection affect the Company’s exploration and operations.
Under current regulations, the Company is required to meet performance standards to minimize the environmental impact from its activities
and to perform site restoration and other reclamation activities. The Company’s reclamation provision is based on known requirements.
New Found Gold Corp.
Notes to the Condensed Interim Financial Statements
For the three months ended March 31, 2024 and 2023
(Unaudited - Expressed in Canadian Dollars Unless Otherwise Noted)
| 9. | ACCOUNTS PAYABLE AND ACCRUED
LIABILITIES (continued) |
The breakdown
of the Company’s reclamation provision is as follows:
| | |
March 31, 2024
$ | | |
December 31, 2023
$ | |
| Balance, beginning of period | |
| 1,285,031 | | |
| 1,411,293 | |
| Additions to reclamation provision | |
| 114,047 | | |
| 1,327,278 | |
| Change in estimate | |
| (3,427 | ) | |
| 2,687 | |
| Reclamation costs incurred | |
| (13,593 | ) | |
| (1,456,227 | ) |
| Balance, end of period | |
| 1,382,058 | | |
| 1,285,031 | |
The Company has estimated that the reclamation
obligations are current costs and as such considers the present value of the provision at March 31, 2024 to be equal to the total
future undiscounted cash flows to settle the provision for reclamation, being $1,382,058 (December 31, 2023 - $1,285,031). Additions
to the reclamation provision are included in the total amount of exploration and evaluation expenditures in the condensed interim statement
of loss and comprehensive loss.
| 10. | SHARE CAPITAL AND RESERVES |
Authorized Share Capital
At March 31, 2024, the authorized
share capital comprised an unlimited number of common shares. The common shares do not have a par value. All issued shares are fully paid.
Details of Common Shares Issued During
the Three Months Ended March 31, 2024
| | |
Three months ended
March 31, 2024 | | |
Three months ended
March 31, 2023 | |
| | |
Number of shares | | |
Gross
proceeds | | |
Number of shares | | |
Gross
proceeds | |
| ATM program | |
| 2,561,690 | | |
$ | 11,878,079 | | |
| - | | |
$ | - | |
| Total | |
| 2,561,690 | | |
$ | 11,878,079 | | |
| - | | |
$ | - | |
In
August 2022, the Company filed a prospectus supplement to its short form base shelf prospectus, pursuant to which the Company may,
at its discretion and from time-to-time, sell common shares of the Company for aggregate gross proceeds of up to US$100,000,000. The sale
of common shares is to be made through “at-the-market distributions” ("ATM"), as defined in the Canadian Securities
Administrators’ National Instrument 44-102 Shelf Distributions, directly on the TSX Venture Exchange and the NYSE American
stock exchange. During the three months ended March 31, 2024, the Company sold 2,561,690 (three months ended March 31, 2023
- Nil) common shares of the Company under the ATM program at an average price of $4.64 (three months ended March 31, 2023 –
$Nil) for gross proceeds of $11,878,079 (2023 - $Nil) or net proceeds of $11,553,196 (2023 - $Nil), and paid an aggregate commission of
$279,188 (2023 - $Nil). At March 31, 2024, the Company has completed $37,408,094 of the ATM program.
Details
of Common Shares Issued During the Year Ended December 31, 2023
On
November 6, 2023, the Company completed a bought-deal prospectus offering of 7,725,000 flow-through common shares at a price
of $7.25 per common share for gross proceeds of $56,006,250. The Company paid share issuance costs of $2,977,254 in cash of which $2,357,908
was paid to the underwriters. The premium received on the flow-through shares issued was determined to be $15,295,500.
New Found Gold Corp.
Notes to the Condensed Interim Financial Statements
For the three months ended March 31, 2024 and 2023
(Unaudited - Expressed in Canadian Dollars Unless Otherwise Noted)
| 10. | SHARE CAPITAL AND RESERVES
(continued) |
On
November 2, 2023, the Company issued 39,762 common shares with a value of $203,979 pursuant to the acquisition of exploration
and evaluation assets in accordance with the terms of certain property option agreements (Note 3).
During the year ended December 31,
2023, 178,500 stock options were exercised at a weighted average exercise price of $0.74 per share for gross proceeds of $131,630.
Share Purchase Option Compensation
Plan
The Company has a share purchase option
plan (the “Plan”) approved by the Company’s shareholders that allows it to grant share purchase options, subject to
regulatory terms and approval, to its officers, directors, employees and service providers. The Plan is based on the maximum number of
eligible shares not exceeding 10% in the aggregate and 5% with respect to any one optionee of the Company’s outstanding common shares
in any twelve-month period. If outstanding share purchase options are exercised or expire, and/or the number of issued and outstanding
common shares of the Company increases, then the share purchase options available to grant under the Plan increase proportionately.
The exercise price and vesting terms
of each share purchase option is set by the Board of Directors at the time of grant. Share purchase options granted are subject to a four-month
hold period and exercisable for a period determined by the Board of Directors which cannot exceed ten years.
The continuity of share purchase options
for the three months ended March 31, 2024 is as follows:
| Expiry date | |
Exercise
Price | | |
Outstanding
December
31, 2023 | | |
Granted | | |
Exercised | | |
Cancelled/
Forfeited/
Expired | | |
Outstanding
March
31,
2024 | | |
Exercisable
March
31,
2024 | |
| December 17, 2024 | |
$ | 0.50 | | |
| 1,725,000 | | |
| - | | |
| - | | |
| - | | |
| 1,725,000 | | |
| 1,725,000 | |
| April 18, 2025 | |
$ | 1.00 | | |
| 100,000 | | |
| - | | |
| - | | |
| - | | |
| 100,000 | | |
| 100,000 | |
| May 23, 2025 | |
$ | 1.075 | | |
| 75,000 | | |
| - | | |
| - | | |
| - | | |
| 75,000 | | |
| 75,000 | |
| August 11, 2025 | |
$ | 1.40 | | |
| 1,125,000 | | |
| - | | |
| - | | |
| - | | |
| 1,125,000 | | |
| 1,125,000 | |
| September 3, 2025 | |
$ | 2.07 | | |
| 50,000 | | |
| - | | |
| - | | |
| - | | |
| 50,000 | | |
| 50,000 | |
| October 1, 2025 | |
$ | 2.15 | | |
| 25,000 | | |
| - | | |
| - | | |
| - | | |
| 25,000 | | |
| 25,000 | |
| December 31, 2025 | |
$ | 4.10 | | |
| 5,305,000 | | |
| - | | |
| - | | |
| - | | |
| 5,305,000 | | |
| 5,305,000 | |
| April 29, 2026 | |
$ | 6.79 | | |
| 962,875 | | |
| - | | |
| - | | |
| (12,750 | ) | |
| 950,125 | | |
| 927,250 | |
| May 17, 2026 | |
$ | 8.62 | | |
| 200,000 | | |
| - | | |
| - | | |
| - | | |
| 200,000 | | |
| 200,000 | |
| September 27, 2026 | |
$ | 8.70 | | |
| 125,000 | | |
| - | | |
| - | | |
| - | | |
| 125,000 | | |
| 106,250 | |
| November 26, 2026 | |
$ | 8.04 | | |
| 47,500 | | |
| - | | |
| - | | |
| - | | |
| 47,500 | | |
| 33,250 | |
| January 4, 2027 | |
$ | 8.98 | | |
| 22,500 | | |
| - | | |
| - | | |
| - | | |
| 22,500 | | |
| 15,750 | |
| August 19, 2027 | |
$ | 5.75 | | |
| 340,000 | | |
| - | | |
| - | | |
| - | | |
| 340,000 | | |
| 254,500 | |
| September 8, 2027 | |
$ | 5.00 | | |
| 20,000 | | |
| - | | |
| - | | |
| - | | |
| 20,000 | | |
| 20,000 | |
| December 27, 2027 | |
$ | 5.68 | | |
| 2,156,250 | | |
| - | | |
| - | | |
| (6,250 | ) | |
| 2,150,000 | | |
| 1,932,500 | |
| February 20, 2029 | |
$ | 4.59 | | |
| - | | |
| 200,000 | | |
| - | | |
| - | | |
| 200,000 | | |
| 100,000 | |
| | |
| | | |
| 12,279,125 | | |
| - | | |
| - | | |
| (19,000 | ) | |
| 12,460,125 | | |
| 11,994,500 | |
| Weighted average exercise price $ | |
| | | |
| 3.97 | | |
| 4.59 | | |
| - | | |
| 6.42 | | |
| 3.98 | | |
| 3.91 | |
Weighted average contractual remaining life (years) | |
| | | |
| 2.25 | | |
| 5.00 | | |
| - | | |
| - | | |
| 2.05 | | |
| 1.98 | |
New Found Gold Corp.
Notes to the Condensed Interim Financial Statements
For the three months ended March 31, 2024 and 2023
(Unaudited - Expressed in Canadian Dollars Unless Otherwise Noted)
| 10. | SHARE CAPITAL AND RESERVES
(continued) |
The continuity of share purchase options
for the three months ended March 31, 2023 is as follows:
| Expiry date | |
Exercise
Price | | |
Outstanding
December
31, 2022 | | |
Granted | | |
Exercised | | |
Cancelled/
Forfeited/
Expired | | |
Outstanding
March
31, 2023 | | |
Exercisable
March
31, 2023 | |
| September 30, 2023 | |
$ | 0.40 | | |
| 150,000 | | |
| - | | |
| - | | |
| - | | |
| 150,000 | | |
| 150,000 | |
| December 17, 2024 | |
$ | 0.50 | | |
| 1,725,000 | | |
| - | | |
| - | | |
| - | | |
| 1,725,000 | | |
| 1,725,000 | |
| April 18, 2025 | |
$ | 1.00 | | |
| 100,000 | | |
| - | | |
| - | | |
| - | | |
| 100,000 | | |
| 100,000 | |
| May 23, 2025 | |
$ | 1.075 | | |
| 75,000 | | |
| - | | |
| - | | |
| - | | |
| 75,000 | | |
| 75,000 | |
| August 11, 2025 | |
$ | 1.40 | | |
| 1,125,000 | | |
| - | | |
| - | | |
| - | | |
| 1,125,000 | | |
| 1,125,000 | |
| September 3, 2025 | |
$ | 2.07 | | |
| 75,000 | | |
| - | | |
| - | | |
| - | | |
| 75,000 | | |
| 75,000 | |
| October 1, 2025 | |
$ | 2.15 | | |
| 25,000 | | |
| - | | |
| - | | |
| - | | |
| 25,000 | | |
| 25,000 | |
| December 31, 2025 | |
$ | 4.10 | | |
| 5,305,000 | | |
| - | | |
| - | | |
| - | | |
| 5,305,000 | | |
| 5,305,000 | |
| April 29, 2026 | |
$ | 6.79 | | |
| 1,258,625 | | |
| - | | |
| - | | |
| (261,000 | ) | |
| 997,625 | | |
| 907,625 | |
| May 17, 2026 | |
$ | 8.62 | | |
| 200,000 | | |
| - | | |
| - | | |
| - | | |
| 200,000 | | |
| 200,000 | |
| September 27, 2026 | |
$ | 8.70 | | |
| 125,000 | | |
| - | | |
| - | | |
| - | | |
| 125,000 | | |
| 68,750 | |
| November 26, 2026 | |
$ | 8.04 | | |
| 55,000 | | |
| - | | |
| - | | |
| (3,375 | ) | |
| 51,625 | | |
| 22,000 | |
| January 4, 2027 | |
$ | 8.98 | | |
| 24,375 | | |
| - | | |
| - | | |
| (1,875 | ) | |
| 22,500 | | |
| 9,000 | |
| August 19, 2027 | |
$ | 5.75 | | |
| 340,000 | | |
| - | | |
| - | | |
| - | | |
| 340,000 | | |
| 197,500 | |
| September 8, 2027 | |
$ | 5.00 | | |
| 20,000 | | |
| - | | |
| - | | |
| - | | |
| 20,000 | | |
| 10,000 | |
| December 27, 2027 | |
$ | 5.68 | | |
| 2,257,500 | | |
| - | | |
| - | | |
| (12,000 | ) | |
| 2,245,500 | | |
| 1,833,750 | |
| | |
| | | |
| 12,860,500 | | |
| - | | |
| - | | |
| (278,250 | ) | |
| 12,582,250 | | |
| 11,828,625 | |
| Weighted average exercise price $ | |
| | | |
| 4.01 | | |
| - | | |
| - | | |
| 6.77 | | |
| 3.95 | | |
| 3.80 | |
| Weighted average contractual remaining
life (years) | |
| | | |
| 3.24 | | |
| - | | |
| - | | |
| - | | |
| 2.99 | | |
| 2.90 | |
The table below summarizes the weighted
average fair value of share purchase options granted:
| | | |
Three months ended March 31, | |
| | | |
2024 | | |
2023 | |
| Weighted average: | | |
| | | |
| | |
| Fair
value of share purchase options granted | | |
$ | 3.07 | | |
| - | |
Options were priced based on the Black-Scholes
option pricing model using the following weighted average assumptions to estimate the fair value of options granted:
| | |
Three months ended March 31, | |
| | |
2024 | | |
2023 | |
| Risk-free interest rate | |
| 3.58 | % | |
| - | |
| Expected option life in years | |
| 5 | | |
| - | |
| Expected share price volatility(i) | |
| 81.26 | % | |
| - | |
| Grant date share price | |
$ | 4.59 | | |
| - | |
| Expected forfeiture rate | |
| Nil | | |
| - | |
| Expected dividend yield | |
| Nil | | |
| - | |
| (i) | The expected share price volatility is based on the average historical share price of comparable companies
over the life of the option. |
New Found Gold Corp.
Notes to the Condensed Interim Financial Statements
For the three months ended March 31, 2024 and 2023
(Unaudited - Expressed in Canadian Dollars Unless Otherwise Noted)
11. RELATED
PARTY BALANCES AND TRANSACTIONS
All transactions with related parties
have occurred in the normal course of operations and on terms and conditions that are similar to those of transactions with unrelated
parties and are measured at the amount of consideration paid or received. A summary of the Company’s related party transactions
with corporations having similar directors and officers is as follows:
| | |
Three months ended March 31, | |
| | |
2024
$ | | |
2023
$ | |
| Amounts paid to EarthLabs Inc. (i) for exploration and evaluation | |
| 4,500 | | |
| 4,500 | |
| Amounts paid to Notz Capital Corp. (ii) for corporate development and investor relations | |
| 43,585 | | |
| - | |
| (i) | EarthLabs Inc. is a related entity having the following common director and officer to the Company: Denis
Laviolette, Director and President. |
| (ii) | Notz Capital Corp. is a related entity of the Executive Chairman and Chief Executive Officer. |
There are no ongoing contractual commitments
resulting from these transactions with related parties.
There were no amounts payable to these
related parties as at March 31, 2024 or December 31, 2023.
Key management personnel compensation
Key management personnel include those
persons having authority and responsibility for planning, directing and controlling the activities of the Company as a whole. The Company
has determined that key management personnel consist of executive and non-executive members of the Company’s Board of Directors
and corporate officers.
| | |
Salaries and
Consulting
$ | | |
Share-based
compensation
$ | | |
Three months
ended March 31, 2024
$ | |
| Executive Chairman and Chief Executive Officer | |
| 97,200 | | |
| - | | |
| 97,200 | |
| President | |
| 68,040 | | |
| - | | |
| 68,040 | |
| Chief Financial Officer | |
| 29,160 | | |
| - | | |
| 29,160 | |
| Chief Operating Officer | |
| 63,180 | | |
| - | | |
| 63,180 | |
| Chief Development Officer | |
| 84,240 | | |
| 33,478 | | |
| 117,718 | |
| Non-executive directors | |
| 54,000 | | |
| - | | |
| 54,000 | |
| Total | |
| 395,820 | | |
| 33,478 | | |
| 429,298 | |
| | |
Salaries and
Consulting
$ | | |
Share-based
compensation
$ | | |
Three months
ended March 31, 2023
$ | |
| Executive Chairman and Chief Executive Officer | |
| 97,200 | | |
| - | | |
| 97,200 | |
| President | |
| 68,040 | | |
| - | | |
| 68,040 | |
| Chief Financial Officer | |
| 29,160 | | |
| - | | |
| 29,160 | |
| Chief Operating Officer | |
| 63,180 | | |
| - | | |
| 63,180 | |
| Chief Development Officer | |
| 84,240 | | |
| 82,917 | | |
| 167,157 | |
| Non-executive directors | |
| 54,000 | | |
| - | | |
| 54,000 | |
| Total | |
| 395,820 | | |
| 82,917 | | |
| 478,737 | |
New Found Gold Corp.
Notes to
the Condensed Interim Financial Statements
For the three
months ended March 31, 2024 and 2023
(Unaudited
- Expressed in Canadian Dollars Unless Otherwise Noted)
| 11. | RELATED
PARTY BALANCES AND TRANSACTIONS (continued) |
As
at March 31, 2024, there was $26,877 payable to key management personnel in respect of key management compensation and expense
reimbursements included in accounts payable and accrued liabilities (December 31, 2023 - $18,888). The amounts are unsecured, non-interest
bearing and without fixed terms of repayment. Under the terms of their management agreements, certain officers of the Company are entitled
to 18 months of base pay in the event of their agreements being terminated without cause.
| 12. | BASIC AND DILUTED LOSS PER COMMON SHARE |
| | |
Three months ended
March 31, | |
| | |
2024 | | |
2023 | |
| Loss attributable to common shareholders ($) | |
| 13,182,212 | | |
| 20,052,343 | |
| Weighted average number of common shares outstanding | |
| 187,534,833 | | |
| 175,377,526 | |
| Loss per share attributed to common shareholders | |
$ | 0.07 | | |
$ | 0.11 | |
Diluted loss per share did not include
the effect of 12,460,125 (three months ended March 31, 2022 - 12,582,250) share purchase options as they are anti-dilutive.
| 13. | SUPPLEMENTAL DISCLOSURE WITH RESPECT TO CASH FLOWS |
| | |
Three months
ended
March 31, | |
| | |
2024
$ | | |
2023
$ | |
| Non-cash investing and financing activities: | |
| | | |
| | |
| Right-of-use assets and liabilities | |
| 17,231 | | |
| 17,232 | |
| Property and equipment included in accounts
payable and accrued liabilities | |
| 88,572 | | |
| 5,200 | |
| Share issuance costs included in accounts payable and accrued liabilities | |
| 45,695 | | |
| - | |
| Other assets included in accounts payable and accrued liabilities | |
| 97,528 | | |
| - | |
| Cash paid for income taxes | |
| - | | |
| - | |
| Cash paid for interest | |
| 7,076 | | |
| 6,672 | |
| Cash received for interest | |
| 815,506 | | |
| 875,174 | |
Claims and Legal Proceedings
On November 15, 2019, ThreeD Capital
Inc. (“ThreeD”) and 1313366 Ontario Inc. (“131” and together with ThreeD, the “Plaintiffs”) each entered
into share purchase agreements (the “Share Purchase Agreements”) with Palisades Goldcorp Ltd. (“Palisades”) under
which Palisades agreed to purchase the 13,500,000 common shares of the Company owned by ThreeD and the 4,000,000 common shares of the
Company owned by 131 for $0.08 per common share. The transactions closed on November 20, 2019. As a private company with restrictions
on the transfer of its common shares, the Company had to approve the proposed transfer, which it did by a consent resolution of the Board.
New Found Gold Corp.
Notes to the Condensed Interim Financial Statements
For the three months ended March 31, 2024 and 2023
(Unaudited - Expressed in Canadian Dollars Unless Otherwise
Noted)
| 14. | CONTINGENCY
(continued) |
On March 10, 2020, ThreeD Capital
Inc. and 131 filed a statement of claim in the Ontario Superior Court of Justice against Collin Kettell, Palisades and the Company (the
“ThreeD Claim”). Pursuant to the ThreeD Claim, the Plaintiffs are challenging the validity of the sale of 17,500,000 common
shares by the Plaintiffs to Palisades on November 20, 2019. ThreeD and 131 claim that at the time of negotiation and execution of
the Share Purchase Agreements, Palisades and Mr. Kettell were aware of positive drill results from the Company’s 2019 Drill
Program and the results were not disclosed to ThreeD and 131 to their detriment. Palisades and Mr. Kettell strongly deny ThreeD and
131’s allegations. ThreeD and 131 have made specific claims for (a) recission of the Share Purchase Agreements on the basis
of oppression or unfair prejudice; (b) or alternatively, damages in the amount of $21,000,000 for the alleged improper actions by
ThreeD and 131, (c) a declaration that Palisades and Collin Kettell, as shareholder or director and/or officer of the Company, have
had acted in a manner that is oppressive, unfairly prejudicial or unfairly disregarded their interests, (d) a declaration that Palisades
and Collin Kettell engaged in insider trading contrary to section 138 of the Securities Act (Ontario), (e) unjust enrichment
and (f) interests and costs. Palisades and Mr. Kettell refute each of the specific claims made by the Plaintiffs.
The
Company filed a statement of defence in response to the ThreeD Claim on June 12, 2020, pursuant to which, among other things, the
Company denies that it is a proper party to the ThreeD Claim and the allegations against it therein, including because no relief is claimed
against the Company in paragraph 1 of the ThreeD Claim. The action has now progressed through the production of documents and oral
examinations for discovery stages.
In
early 2022, the Plaintiffs formally amended their statement of claim to increase the amount claimed to $229,000,000 and to advance a direct
claim of oppressive conduct against the Company. While continuing to deny any and all liability to the Plaintiffs, the Company has amended
its defence to include specific denials of the new allegations of oppressive conduct against it. The parties completed an additional
round of examinations for discovery in January 2023, following which the plaintiffs set the action down for trial. The parties
had a mediation meeting on October 3, 2023, but were unable to settle the case. A trial date has been set for January 2025.
The
outcome of this claim cannot be determined at this time and therefore no amount has been accrued for.
The Company thoroughly examines the
various financial instrument risks to which it is exposed and assesses the impact and likelihood of those risks. These risks may include
credit risk, liquidity risk, currency risk, and interest rate risk. Where material, these risks are reviewed and monitored by the Board
of Directors.
(a) Fair Values
Financial assets and liabilities measured
at fair value are recognized according to a fair value hierarchy that prioritizes the inputs to valuation techniques used to measure fair
value. The hierarchy gives the highest priority to unadjusted quoted prices in active markets for identical assets and liabilities and
the lowest priority to unobservable inputs. The three levels of fair value hierarchy are as follows:
| |
Level
1 – |
Unadjusted quoted
prices in active markets that are accessible at the measurement date for identical, unrestricted assets or liabilities. |
| |
Level 2 – |
Quoted prices in markets that are not active, or inputs that are observable, either directly or indirectly, for substantially the full term of the asset or liability. |
| |
Level 3 – |
Prices or valuation techniques that require inputs that are both significant to the fair value measurement and unobservable (supported by little or no market activity). |
New Found Gold Corp.
Notes to the Condensed Interim Financial Statements
For the three months ended March 31, 2024 and 2023
(Unaudited - Expressed in Canadian Dollars Unless Otherwise
Noted)
| 15. | FINANCIAL
INSTRUMENTS (continued) |
(a) Fair
Values (continued)
The
Company’s financial instruments measured at fair value are its investments, which include equities, warrants and Notes held. The
fair value of equities held is determined using closing prices at the statement of financial position date with any unrealized gain or
loss recognized in profit or loss. The Company’s warrants and Notes are classified within level 2 of the fair value hierarchy.
Warrants are not traded on an active exchange and are valued using the Black-Scholes option pricing model using assumptions including
risk-free interest rate, expected dividend yield, expected volatility and expected remaining life of the warrant which are supported by
observable market conditions. The Notes are not traded on an active exchange and are valued using the Hull-White valuation model using
assumptions including coupon rate, credit spread, mean reversion, rate volatility, riskless rate curve and redemption prices.
The carrying values of other financial
instruments, including cash, deposits, interest receivable, accounts payable and accrued liabilities, and lease liabilities approximate
their fair values due to the short-term maturity of these financial instruments.
The
Company’s financial instruments carried at fair value and categorized according to the fair value hierarchy are as follows
as at March 31, 2024:
| | |
| | |
Level 1
$ | | |
Level 2
$ | | |
Level 3
$ | | |
Total
$ | |
| Recurring measurements | |
Carrying amount | | |
Fair value | |
| Investments | |
| 3,290,838 | | |
| 3,057,138 | | |
| 233,700 | | |
| - | | |
| 3,290,838 | |
| Secured notes | |
| 2,553,200 | | |
| - | | |
| 2,553,200 | | |
| - | | |
| 2,553,200 | |
The
Company’s financial instruments carried at fair value and categorized according to the fair value hierarchy are as follows
as at December 31, 2023:
| | |
| | |
Level 1
$ | | |
Level 2
$ | | |
Level 3
$ | | |
Total
$ | |
| Recurring measurements | |
Carrying amount | | |
Fair value | |
| Investments | |
| 3,596,592 | | |
| 3,408,092 | | |
| 188,500 | | |
| - | | |
| 3,596,592 | |
| Secured notes | |
| 2,454,300 | | |
| - | | |
| 2,454,300 | | |
| - | | |
| 2,454,300 | |
There was no movement between levels
during the three months ended March 31, 2024.
(b) Financial Instrument Risk
Exposure
Credit risk
Credit
risk is the risk that one party to a financial instrument will fail to discharge an obligation and cause the other party to incur a financial
loss. The Company is subject to the credit through its investment in Maritime secured notes, in which case the maximum exposure to the
credit risk is the full value of the secured notes of $2,553,200 at March 31, 2024. Interest receivable on Maritime secured
notes is collected quarterly. Sales taxes recoverable are due from the Canada Revenue Agency and the Company places its cash with financial
institutions with high credit ratings, therefore in management’s judgment, credit risk related to sales taxes recoverable and cash
is low.
There have been no changes in management’s
methods for managing credit risk since December 31, 2023.
New Found Gold Corp.
Notes to the Condensed Interim Financial Statements
For the three months ended March 31, 2024 and 2023
(Unaudited - Expressed in Canadian Dollars Unless Otherwise
Noted)
| 15. | FINANCIAL
INSTRUMENTS (continued) |
(b) Financial
Instrument Risk Exposure (continued)
Liquidity risk
Liquidity
risk is the risk that the Company will not be able to meet its financial obligations as they fall due. The Company has in place a planning
and budgeting process to help determine the funds required to ensure the Company has the appropriate liquidity to meet its operating and
growth objectives. The Company has historically relied on issuance of shares to fund exploration programs and may require doing so again
in the future. As at March 31, 2024, the Company has total liabilities of $14,607,816 and cash of $50,252,203 which is available
to discharge these liabilities (December 31, 2023 – total liabilities of $19,076,473 and cash of $53,884,809). As at March 31,
2024, the Company must spend another $33,025,621 of Qualifying CEE by December 31, 2024 to satisfy its remaining current flow-through
liability of $9,019,410.
There have been no changes in management’s
methods for managing liquidity risk since December 31, 2023.
Market risk
Market risk is the risk that changes
in market prices, such as commodity prices, interest rates and foreign exchange rates will affect the Company’s net earnings or
the value of financial instruments. The objective of the Company is to manage and mitigate market risk exposures within acceptable limits,
while maximizing returns.
Financial
instruments that impact the Company’s net earnings or other comprehensive income due to currency fluctuation include cash accounts,
secured notes, interest receivable, investments and accounts payable and accrued liabilities denominated in US dollars. The sensitivity
of the Company’s net loss to changes in the exchange rate between the US dollar and the Canadian dollar at March 31, 2024 would
change the Company’s net loss by $364,982 as a result of a 10% change in the exchange rate.
Interest rate risk is the risk that
the fair value of future cash flows of a financial instrument will fluctuate due to changes in market interest rates. As the Company deposits
its cash into demand accounts with minimal interest rates, the interest rate risk is not significant. Interest receivable on secured notes
is determined based on a floating interest rate and therefore subject to interest rate fluctuations, the interest rate risk is not material.
| (iii) | Commodity price risk |
Commodity price risk is defined as the
potential adverse impact on earnings and economic value due to commodity price movements and volatilities. The Company’s property
has exposure to predominantly gold. Commodity prices, especially gold, greatly affect the value of the Company and the potential value
of its property and investments.
New Found Gold Corp.
Notes to the Condensed Interim Financial Statements
For the three months ended March 31, 2024 and 2023
(Unaudited - Expressed in Canadian Dollars Unless Otherwise
Noted)
| 15. | FINANCIAL
INSTRUMENTS (continued) |
(b) Financial
Instrument Risk Exposure (continued)
Equity
price risk is the risk that the fair value of or future cash flows from the Company’s financial instruments will significantly fluctuate
because of changes in market prices. The Company is exposed to market risk in trading its investments in unfavorable market conditions
which could result in dispositions of investments at less than favorable prices. Additionally, the Company adjusts its investments to
fair value at the end of each reporting period. This process could result in write-downs of the Company’s investments over one or
more reporting periods, particularly during periods of overall market instability. The sensitivity of the Company’s net loss to
changes in market prices at March 31, 2024 would change the Company’s net loss by $329,084 as a result of a 10% change
in the market price of its investments.
There have been no changes in management’s
methods for managing market risks since December 31, 2023.
ATM Sales
Subsequent
to March 31, 2024, the Company sold 1,914,807 common shares of the Company under the ATM program at an average price of $5.09
per share for gross proceeds of $9,738,518 or net proceeds of $9,509,620, and paid an aggregate commission of $228,898.
Acquisition of Kingsway Project
On April 21, 2024, the Company
entered into a property purchase agreement with Labrador Gold Corp. (“LabGold”) to acquire a 100% interest in LabGold’s
Kingsway Project, located near Gander, Newfoundland and Labrador, as well as certain related assets of LabGold (the “Transaction”).
As consideration, the Company will issue to LabGold such number of common shares in New Found equal to $20,000,000 divided by the closing
price of the Company’s shares on the TSX Venture Exchange (“TSX-V”) on the last trading day prior to the closing date
of the Transaction. The Transaction is subject to customary closing conditions, including LabGold shareholders and the TSX-V final approvals.
Stock Options
Subsequent to March 31, 2024,
40,000 stock options were granted at an exercise price of $4.78 per share and an expiry date of May 6, 2029.
Subsequent
to March 31, 2024, the following stock options were forfeited:
| · | 12,000 stock options with an exercise price of $8.04 per share; and |
| · | 12,000 stock options with an exercise price of $5.68 per share. |
Subsequent
to March 31, 2024, the following stock options expired:
| · | 75,000 stock options with an exercise price of $5.68 per share; |
| · | 23,625 stock options with an exercise price of $6.79 per share; and |
| · | 7,500 stock options with an exercise price of $8.98 per share. |
Exhibit 99.2

Management’s Discussion and Analysis
For
the three months ended March 31, 2024 and 2023
The following discussion is management’s
assessment and analysis of the results and financial condition of New Found Gold Corp. (the “Company” or “NFG”)
and should be read in conjunction with the accompanying unaudited condensed interim financial statements for the three months ended March 31,
2024 and March 31, 2023 and related notes. In addition, this MD&A should be read in conjunction with the audited annual financial
statements and the related notes for the years ended December 31, 2023 and December 31, 2022. The financial data was prepared
using accounting policies consistent with International Financial Reporting Standards (“IFRS”), as applicable to interim financial
reports including International Accounting Standards 34 “Interim Financial Reporting” issued by the International Accounting
Standards Board (“IASB”), and all figures are reported in Canadian dollars unless otherwise indicated. Please refer to the
cautionary note regarding forward-looking statements and information within this Management’s Discussion & Analysis (“MD&A”)
and the Risks Factors discussed in the Company’s most recent Annual Information Form on file with the Canadian provincial securities,
regulatory authorities and Form 40-F on file with the U.S. Securities and Exchange Commission (the “SEC”).
This
MD&A contains forward-looking information and forward-looking statements, within the meaning of the U.S. Private Securities
Litigation Reform Act of 1995 and forward-looking information within the meaning of applicable Canadian securities legislation, (collectively,
“forward-looking statements”), that involve numerous risks and uncertainties. The Company continually seeks to minimize
its exposure to business risks, but by the nature of its business and exploration activities and size, will always have some risk. These
risks are not always quantifiable due to their uncertain nature. Should one or more of these risks and uncertainties, including those
described under the headings “Risks and Uncertainties” and “Cautionary Notes Regarding Forward-Looking Statements”
materialize, or should underlying assumptions prove incorrect, then actual results may vary materially from those expressed or implied
in forward-looking statements. The effective date of this report is May 9, 2024.
The
technical content disclosed in this MD&A was reviewed and approved by Greg Matheson, P. Geo., Chief Operating Officer, and a Qualified
Person as defined under National Instrument 43-101. Mr. Matheson consents to the publication of this MD&A, by NFG. The scientific
and technical information in this MD&A relating to the Queensway Project is derived from, and in some instances is a direct extract
from, and is based on the assumptions, qualifications and procedures set out in, the report entitled “January 2023 Exploration
Update At New Found Gold Corp’s Queensway Gold Project in Newfoundland and Labrador, Canada” with an effective date of January 24,
2023, prepared by R. Eccles P.Geo of Apex Geoscience in accordance with National Instrument 43-101 – Standards of Disclosure
for Mineral Projects (“NI 43-101”) (the “Queensway Technical Report”). Reference should be made to the
full text of the Queensway Technical Report, which is available for review under the Company’s profile on SEDAR+ at www.sedarplus.ca.
Description of Business
The
Company was incorporated on January 6, 2016, under the Business Corporations Act (Ontario). On June 23, 2020, the Company continued
as a British Columbia corporation under the Business Corporation Act in the province of British Columbia. The Company’s head office
is located at WeWork c/o New Found Gold Corp., 1600 – 595 Burrard Street, Vancouver, British Columbia V7X 1L4, and its registered
office is located at Suite 3500, The Stack, 1133 Melville Street, Vancouver, British Columbia V6E 4E5. On August 11, 2020, the
Company completed an initial public offering and listed on the TSX Venture Exchange under the symbol “NFG”. On September 29,
2021, the Company also listed its shares on the NYSE American stock exchange under the symbol “NFGC”.
The
Company is a mineral exploration company engaged in the acquisition, exploration and evaluation of resource properties with a focus on
gold properties located in Newfoundland and Labrador, Canada. The Company’s principal objective is to explore and develop
the Queensway Project, which is located near Gander, Newfoundland and to identify other properties worthy of investment and exploration.
For the purpose of NI 43-101, the Queensway Project is the Company’s only material property.
Management’s Discussion and Analysis
For
the three months ended March 31, 2024 and 2023
The
Queensway Project is comprised of 96 mineral licenses, including 6,659 claims comprising 166,475ha of land located near Gander, Newfoundland.
The Queensway Project is accessible by main access roads including the Trans-Canada Highway (“TCH”) that passes
through the northern portion of the project and has high voltage electric transmission lines running through the project area. The Queensway
Project is divided into two blocks, Queensway North (“QWN”) which is designated to the claim group north of Gander
Lake and Queensway South (“QWS”) which is the property portion located south of Gander Lake.
As of the date of this MD&A, the Company’s
Board of Directors consisted of the following: Collin Kettell (Executive Chairman), Vijay Mehta, Denis Laviolette, Ray Threlkeld and Douglas
Hurst.
Additional information relating to the Company
is available on the Company’s website at www.newfoundgold.ca.
Project Summary
Queensway Project, Newfoundland
Ownership
The
Queensway project consists of licences that were acquired through 1) online map staking with the Government of Newfoundland, 2) the successful
completion of a series of Option Agreements (9 Option Agreements), and 3) as part of a current Option Agreement announced on November 3,
2022. Some licences were acquired via a direct purchase agreement. The optioned lands also carry various net smelter royalties
which are summarized in the table below. The current Option Agreement increased the property package by 551 individual claims totalling
13,775ha and added 6.1km of strike length on the Appleton Fault Zone. In 2022, NFG conducted additional map staking adding 4 new claims.
By the end of Q3 2023, NFG increased the property package by 60 new claims expanding the Queensway project to 6,659 claims for a total
of 166,475 ha.
Management’s Discussion and Analysis
For
the three months ended March 31, 2024 and 2023
Queensway Project mineral licence description
and status (reported by blocks of contiguous licences/claims)
| Licence
No. | |
Title Holder | |
Location | |
No. of
Claims | |
Area (km²) | |
Status | |
Issued Date | |
Renewal Date | |
Report Due
Date | |
Annual
Minimum
Expenses
Due | |
Expenses Due
Date | |
NSR
Royalty
(%) | |
NSR
Buyback
Provision
(%) |
| 006821M | |
New Found Gold Corp. | |
Gander River, Central
NL | |
2 | |
0.50 | |
Issued | |
1999-05-17 | |
2023-05-17 | |
2023-07-17 | |
$ | 4,591.50 | |
2026-05-17 | |
2.5 | |
1 |
| 007984M | |
New Found Gold Corp. | |
Glenwood, Central NL | |
50 | |
12.50 | |
Issued | |
1998-11-13 | |
2023-11-13 | |
2025-01-13 | |
| N/A | |
N/A | |
0.4 | |
0 |
| 022216M | |
New Found Gold Corp. | |
Glenwood, Central NL | |
6 | |
1.50 | |
Issued | |
2014-06-12 | |
2024-06-12 | |
2024-08-12 | |
$ | 6,731.36 | |
2032-06-12 | |
1.6 | |
1 |
| 022491M | |
New Found Gold Corp. | |
Gander Lake Area, Central NL | |
12 | |
3.00 | |
Issued | |
2014-11-06 | |
2024-11-06 | |
2025-01-06 | |
$ | 13,227.96 | |
2032-11-06 | |
1.6 | |
1 |
| 023720M | |
New Found Gold Corp. | |
Glenwood, Central NL | |
4 | |
1.00 | |
Issued | |
2001-12-31 | |
2024-01-01 | |
2024-02-29 | |
$ | 7,657.67 | |
2026-12-31 | |
1 | |
0 |
| 023721M | |
New Found Gold Corp. | |
Glenwood, Central NL | |
2 | |
0.50 | |
Issued | |
2001-12-31 | |
2024-01-01 | |
2024-02-29 | |
$ | 1,522.60 | |
2025-12-31 | |
1 | |
0 |
| 023804M | |
New Found Gold Corp. | |
Glenwood, Central NL | |
12 | |
3.00 | |
Issued | |
2001-02-19 | |
2023-02-20 | |
2023-04-20 | |
$ | 12,313.65 | |
2026-02-19 | |
1.6 | |
1 |
| 023860M | |
New Found Gold Corp. | |
Joe Batts Brook, Central NL | |
11 | |
2.75 | |
Issued | |
2016-04-07 | |
2026-04-07 | |
2024-06-06 | |
$ | 10,953.23 | |
2033-04-07 | |
0.6 | |
0 |
| 023861M | |
New Found Gold Corp. | |
Joe Batts Pond, Central NL | |
16 | |
4.00 | |
Issued | |
2016-04-07 | |
2026-04-07 | |
2024-06-06 | |
$ | 15,931.97 | |
2033-04-07 | |
1 | |
0 |
| 023862M | |
New Found Gold Corp. | |
Joe Batts Brook, Central NL | |
4 | |
1.00 | |
Issued | |
2016-04-07 | |
2026-04-07 | |
2024-06-06 | |
$ | 3,982.99 | |
2033-04-07 | |
0.6 | |
0 |
| 023863M | |
New Found Gold Corp. | |
Joe Batts Brook, Central NL | |
11 | |
2.75 | |
Issued | |
2016-04-07 | |
2026-04-07 | |
2024-06-06 | |
$ | 10,953.23 | |
2033-04-07 | |
1 | |
0 |
| 023864M | |
New Found Gold Corp. | |
Joe Batts Brook, Central NL | |
3 | |
0.75 | |
Issued | |
2016-04-07 | |
2026-04-07 | |
2024-06-06 | |
$ | 2,987.24 | |
2033-04-07 | |
1 | |
0 |
| 023866M | |
New Found Gold Corp. | |
Joe Batts Brook, Central NL | |
4 | |
1.00 | |
Issued | |
2016-04-07 | |
2026-04-07 | |
2024-06-06 | |
$ | 1,966.33 | |
2033-04-07 | |
1 | |
0.5 |
| 023874M | |
New Found Gold Corp. | |
Joe Batts Brook, Central NL | |
8 | |
2.00 | |
Issued | |
2016-04-11 | |
2026-04-13 | |
2024-06-10 | |
$ | 7,965.98 | |
2033-04-11 | |
1.6 | |
1 |
| 023875M | |
New Found Gold Corp. | |
Joe Batts Pond, Central NL | |
3 | |
0.75 | |
Issued | |
2016-04-12 | |
2026-04-13 | |
2023-06-12 | |
$ | 2,700.00 | |
2029-04-12 | |
1.6 | |
1 |
| 023881M | |
New Found Gold Corp. | |
Joe Batts Brook, Central NL | |
7 | |
1.75 | |
Issued | |
2016-04-21 | |
2026-04-21 | |
2023-06-20 | |
$ | 6,300.00 | |
2029-04-21 | |
1.6 | |
1 |
| 023916M | |
New Found Gold Corp. | |
Gander Lake Area, Central NL | |
4 | |
1.00 | |
Issued | |
2016-05-05 | |
2026-05-05 | |
2024-07-04 | |
$ | 3,982.99 | |
2033-05-05 | |
1.6 | |
1 |
| 023962M | |
New Found Gold Corp. | |
The Outflow, Central NL | |
9 | |
2.25 | |
Issued | |
2016-05-19 | |
2026-05-19 | |
2024-07-18 | |
$ | 7,039.56 | |
2033-05-19 | |
1.6 | |
1 |
| 023987M | |
New Found Gold Corp. | |
Joe Batts Pond Area, Central
NL | |
11 | |
2.75 | |
Issued | |
2016-06-07 | |
2026-06-08 | |
2024-08-06 | |
$ | 5,407.41 | |
2033-06-07 | |
1.6 | |
1 |
| 024026M | |
New Found Gold Corp. | |
Joe Batts Pond Area, Central
NL | |
6 | |
1.50 | |
Issued | |
2016-06-30 | |
2026-06-30 | |
2024-08-29 | |
$ | 2,949.50 | |
2033-06-30 | |
1.6 | |
1 |
| 024031M | |
New Found Gold Corp. | |
Joe Batts Pond Area, Central
NL | |
6 | |
1.50 | |
Issued | |
2016-06-30 | |
2026-06-30 | |
2023-08-29 | |
$ | 5,400.00 | |
2029-06-30 | |
1.6 | |
1 |
| 024136M | |
New Found Gold Corp. | |
Gander River Area, Central NL | |
25 | |
6.25 | |
Issued | |
2016-09-13 | |
2026-09-14 | |
2024-11-12 | |
$ | 30,000.00 | |
2033-09-13 | |
0.4 | |
0 |
| 024138M | |
New Found Gold Corp. | |
Gander Lake, Central NL | |
21 | |
5.25 | |
Issued | |
2016-09-15 | |
2026-09-15 | |
2024-11-14 | |
$ | 25,200.00 | |
2033-09-15 | |
1.6 | |
1 |
| 024139M | |
New Found Gold Corp. | |
Gander Lake, Central NL | |
30 | |
7.50 | |
Issued | |
2016-09-15 | |
2026-09-15 | |
2024-11-14 | |
$ | 36,000.00 | |
2033-09-15 | |
1.6 | |
1 |
| 024140M | |
New Found Gold Corp. | |
Joe Batts Pond, Central NL | |
2 | |
0.50 | |
Issued | |
2016-09-15 | |
2026-09-15 | |
2024-11-14 | |
$ | 2,400.00 | |
2033-09-15 | |
1.6 | |
1 |
| 024141M | |
New Found Gold Corp. | |
Joe Batts Pond Area, Central
NL | |
2 | |
0.50 | |
Issued | |
2016-09-15 | |
2026-09-15 | |
2024-11-14 | |
$ | 2,400.00 | |
2033-09-15 | |
1.6 | |
1 |
| 024264M | |
New Found Gold Corp. | |
Joe Batts Pond Area, Central
NL | |
4 | |
1.00 | |
Issued | |
2016-10-24 | |
2026-10-26 | |
2024-12-23 | |
$ | 4,800.00 | |
2033-10-24 | |
0.4 | |
0 |
| 024265M | |
New Found Gold Corp. | |
Appleton, Central NL | |
12 | |
3.00 | |
Issued | |
2016-10-24 | |
2026-10-26 | |
2024-12-23 | |
$ | 14,400.00 | |
2033-10-24 | |
0.4 | |
0 |
| 024266M | |
New Found Gold Corp. | |
Joe Batts Pond, Central NL | |
128 | |
32.00 | |
Issued | |
2016-10-24 | |
2026-10-26 | |
2024-12-23 | |
$ | 12,677.96 | |
2032-10-24 | |
0.4 | |
0 |
| 024268M | |
New Found Gold Corp. | |
Millers Brook, Central NL | |
56 | |
14.00 | |
Issued | |
2016-10-24 | |
2026-10-26 | |
2024-12-23 | |
$ | 37,446.05 | |
2032-10-24 | |
1.6 | |
1 |
| 024997M | |
New Found Gold Corp. | |
Glenwood Area, Central NL | |
21 | |
5.25 | |
Issued | |
2017-04-27 | |
2027-04-27 | |
2024-06-26 | |
$ | 10,323.24 | |
2033-04-27 | |
1.6 | |
1 |
| 025008M | |
New Found Gold Corp. | |
Gander Lake, Central NL | |
13 | |
3.25 | |
Issued | |
2017-05-04 | |
2027-05-04 | |
2024-07-03 | |
$ | 12,944.72 | |
2033-05-04 | |
1 | |
0 |
| 026074M | |
New Found Gold Corp. | |
Joe Batts Brook, Central NL | |
3 | |
0.75 | |
Issued | |
2018-05-31 | |
2023-05-31 | |
2024-07-30 | |
$ | 2,087.24 | |
2033-05-31 | |
2.2 | |
1 |
| 030714M | |
New Found Gold Corp. | |
King's Point, Gander Lake | |
8 | |
2.00 | |
Issued | |
2020-05-02 | |
2025-05-02 | |
2024-07-01 | |
$ | 6,710.45 | |
2033-05-02 | |
1 | |
0 |
| 035198M | |
Suraj Amarnani | |
Fourth Pond | |
168 | |
42.00 | |
Issued | |
2022-10-11 | |
2027-10-11 | |
2024-01-09 | |
$ | 33,600.00 | |
2023-11-10 | |
0 | |
0 |
| 035681M | |
New Found
Gold Corp. | |
The Outflow,
Central NL | |
4 | |
1.00 | |
Issued | |
2023-03-16 | |
2028-03-16 | |
2024-05-15 | |
$ | 800.00 | |
2024-03-16 | |
0 | |
0 |
Management’s Discussion and Analysis
For
the three months ended March 31, 2024 and 2023
| | |
| |
| |
| |
| |
| |
| |
| |
| |
| |
| |
| |
|
| Licence
No. | |
Title Holder | |
Location | |
No. of
Claims | |
Area (km²) | |
Status | |
Issued Date | |
Renewal Date | |
Report Due
Date | |
Annual
Minimum
Expenses
Due | |
Expenses Due
Date | |
NSR
Royalty
(%) | |
NSR
Buyback
Provision
(%) |
| 022236M | |
New Found Gold Corp. | |
Southwest Gander
River, Central NL | |
5 | |
1.25 | |
Issued | |
2014-06-12 | |
2024-06-12 | |
2023-08-11 | |
$ | 508.21 | |
2023-06-12 | |
1 | |
0.5 |
| 022260M | |
New Found Gold Corp. | |
Southwest Gander River, Central
NL | |
1 | |
0.25 | |
Issued | |
2014-06-13 | |
2024-06-13 | |
2024-08-12 | |
$ | 436.83 | |
2024-06-13 | |
1 | |
0.5 |
| 022342M | |
New Found Gold Corp. | |
Southwest Gander River, Central
NL | |
1 | |
0.25 | |
Issued | |
2014-08-25 | |
2024-08-25 | |
2024-10-24 | |
$ | 828.59 | |
2025-08-25 | |
1 | |
0.5 |
| 023239M | |
New Found Gold Corp. | |
Pauls Pond, Central NL | |
2 | |
0.50 | |
Issued | |
2015-08-12 | |
2025-08-12 | |
2024-10-11 | |
$ | 1,187.57 | |
2025-08-12 | |
1 | |
0.5 |
| 023495M | |
New Found Gold Corp. | |
Northwest Gander River, Central NL | |
5 | |
1.25 | |
Issued | |
2015-11-19 | |
2025-11-19 | |
2024-01-18 | |
$ | 2,448.69 | |
2023-11-19 | |
1 | |
0.5 |
| 023498M | |
New Found Gold Corp. | |
Northwest Gander River, Central NL | |
8 | |
2.00 | |
Issued | |
2015-11-19 | |
2025-11-19 | |
2024-01-18 | |
$ | 3,882.09 | |
2023-11-19 | |
1 | |
0.5 |
| 024435M | |
New Found Gold Corp. | |
Greenwood Pond, Central NL | |
7 | |
1.75 | |
Issued | |
2016-11-21 | |
2026-11-23 | |
2024-01-22 | |
$ | 1,428.47 | |
2023-11-21 | |
1 | |
0.5 |
| 024436M | |
New Found Gold Corp. | |
Greenwood Pond, Central NL | |
3 | |
0.75 | |
Issued | |
2016-11-21 | |
2026-11-23 | |
2024-01-22 | |
$ | 1,277.65 | |
2024-11-21 | |
1 | |
0.5 |
| 024557M | |
New Found Gold Corp. | |
Bear Pond, Central NL | |
250 | |
62.50 | |
Issued | |
2016-12-12 | |
2026-12-14 | |
2023-02-10 | |
$ | 105,663.21 | |
2022-12-12 | |
1 | |
0 |
| 024558M | |
New Found Gold Corp. | |
Great Gull River, Central NL | |
239 | |
59.75 | |
Issued | |
2016-12-12 | |
2026-12-14 | |
2023-02-10 | |
$ | 100,989.75 | |
2022-12-12 | |
1 | |
0 |
| 024559M | |
New Found Gold Corp. | |
Northwest Gander River, Central NL | |
256 | |
64.00 | |
Issued | |
2016-12-12 | |
2026-12-14 | |
2023-02-10 | |
$ | 116,036.32 | |
2022-12-12 | |
1 | |
0 |
| 024560M | |
New Found Gold Corp. | |
Careless Brook, Central NL | |
121 | |
30.25 | |
Issued | |
2016-12-12 | |
2026-12-14 | |
2024-02-12 | |
$ | 63,185.40 | |
2023-12-12 | |
1 | |
0 |
| 024561M | |
New Found Gold Corp. | |
Eastern Pond, Central NL | |
256 | |
64.00 | |
Issued | |
2016-12-12 | |
2026-12-14 | |
2023-02-10 | |
$ | 69,687.96 | |
2022-12-12 | |
1 | |
0 |
| 024562M | |
New Found Gold Corp. | |
Hussey Pond, Central NL | |
241 | |
60.25 | |
Issued | |
2016-12-12 | |
2026-12-14 | |
2023-02-10 | |
$ | 109,210.11 | |
2022-12-12 | |
1 | |
0 |
| 024563M | |
New Found Gold Corp. | |
Eastern Pond, Central NL | |
236 | |
59.00 | |
Issued | |
2016-12-12 | |
2026-12-14 | |
2023-02-10 | |
$ | 99,717.74 | |
2022-12-12 | |
1 | |
0 |
| 024565M | |
New Found Gold Corp. | |
Gander Lake, Central NL | |
12 | |
3.00 | |
Issued | |
2016-12-12 | |
2026-12-14 | |
2023-02-10 | |
$ | 1,509.68 | |
2022-12-12 | |
1 | |
0 |
| 024566M | |
New Found Gold Corp. | |
Gander Lake, Central NL | |
125 | |
31.25 | |
Issued | |
2016-12-12 | |
2026-12-14 | |
2023-02-10 | |
$ | 60,031.83 | |
2022-12-12 | |
1 | |
0 |
| 024567M | |
New Found Gold Corp. | |
Gander Lake, Central NL | |
106 | |
26.50 | |
Issued | |
2016-12-12 | |
2026-12-14 | |
2023-02-10 | |
$ | 50,830.46 | |
2022-12-12 | |
1 | |
0 |
| 024568M | |
New Found Gold Corp. | |
Birch Pond, Central NL | |
254 | |
63.50 | |
Issued | |
2016-12-12 | |
2026-12-14 | |
2023-02-10 | |
$ | 107,360.90 | |
2022-12-12 | |
1 | |
0 |
| 024569M | |
New Found Gold Corp. | |
Southwest Gander River, Central
NL | |
221 | |
55.25 | |
Issued | |
2016-12-12 | |
2026-12-14 | |
2023-02-10 | |
$ | 106,523.78 | |
2022-12-12 | |
1 | |
0 |
| 024570M | |
New Found Gold Corp. | |
Dennis Brook, Central NL | |
117 | |
29.25 | |
Issued | |
2016-12-12 | |
2026-12-14 | |
2023-02-10 | |
$ | 49,185.49 | |
2022-12-12 | |
1 | |
0 |
| 024571M | |
New Found Gold Corp. | |
Winter Brook, Central NL | |
153 | |
38.25 | |
Issued | |
2016-12-12 | |
2026-12-14 | |
2023-02-10 | |
$ | 15,598.82 | |
2022-12-12 | |
1 | |
0 |
| 025766M | |
New Found Gold Corp. | |
Pauls Pond, Central NL | |
163 | |
40.75 | |
Issued | |
2016-12-12 | |
2026-12-14 | |
2023-02-10 | |
$ | 68,720.03 | |
2022-12-12 | |
1 | |
0 |
| 030710M | |
New Found Gold Corp. | |
Little Dead Wolf Pond | |
144 | |
36.00 | |
Issued | |
2020-05-02 | |
2025-05-02 | |
2024-07-01 | |
$ | 33,831.05 | |
2024-05-02 | |
1 | |
0 |
| 030716M | |
New Found Gold Corp. | |
Third Berry Hill Pond | |
224 | |
56.00 | |
Issued | |
2020-05-02 | |
2025-05-02 | |
2024-07-01 | |
$ | 46,121.42 | |
2024-05-02 | |
0 | |
0 |
| 030722M | |
New Found Gold Corp. | |
Hunt's Pond | |
149 | |
37.25 | |
Issued | |
2020-05-02 | |
2025-05-02 | |
2024-07-01 | |
$ | 35,005.74 | |
2024-05-02 | |
1 | |
0 |
| 030726M | |
New Found Gold Corp. | |
Joe's Feeder Cove | |
5 | |
1.25 | |
Issued | |
2020-05-02 | |
2025-05-02 | |
2024-07-01 | |
$ | 1,347.81 | |
2027-05-02 | |
1 | |
0 |
| 030727M | |
New Found Gold Corp. | |
Dead Wolf Brook | |
195 | |
48.75 | |
Issued | |
2020-05-02 | |
2025-05-02 | |
2024-07-01 | |
$ | 40,150.35 | |
2024-05-02 | |
1 | |
0 |
| 030733M | |
New Found Gold Corp. | |
Rocky Brook | |
173 | |
43.25 | |
Issued | |
2020-05-02 | |
2025-05-02 | |
2024-07-01 | |
$ | 35,620.56 | |
2024-05-02 | |
1 | |
0 |
| 030737M | |
New Found Gold Corp. | |
Caribou Lake | |
247 | |
61.75 | |
Issued | |
2020-05-02 | |
2025-05-02 | |
2024-07-01 | |
$ | 50,857.12 | |
2024-05-02 | |
1 | |
0 |
| 030739M | |
New Found Gold Corp. | |
Great Gull River | |
224 | |
56.00 | |
Issued | |
2020-05-02 | |
2025-05-02 | |
2024-07-01 | |
$ | 39,274.23 | |
2024-05-02 | |
1 | |
0 |
| 030740M | |
New Found Gold Corp. | |
Ribbon Ponds | |
1 | |
0.25 | |
Issued | |
2020-05-02 | |
2025-05-02 | |
2024-07-01 | |
$ | 192.39 | |
2024-05-02 | |
0 | |
0 |
| 030741M | |
New Found Gold Corp. | |
Southwest Gander River Cove | |
2 | |
0.50 | |
Issued | |
2020-05-02 | |
2025-05-02 | |
2024-07-01 | |
$ | 265.12 | |
2025-05-02 | |
1 | |
0 |
| 030742M | |
New Found Gold Corp. | |
Steeles Brook | |
32 | |
8.00 | |
Issued | |
2020-05-02 | |
2025-05-02 | |
2024-07-01 | |
$ | 5,610.61 | |
2024-05-02 | |
1 | |
0 |
| 030745M | |
New Found Gold Corp. | |
Dead Wolf Brook | |
101 | |
25.25 | |
Issued | |
2020-05-02 | |
2025-05-02 | |
2024-07-01 | |
$ | 20,795.83 | |
2024-05-02 | |
1 | |
0 |
| 030746M | |
New Found Gold Corp. | |
Southwest Islands View | |
3 | |
0.75 | |
Issued | |
2020-05-02 | |
2025-05-02 | |
2024-07-01 | |
$ | 672.68 | |
2026-05-02 | |
1 | |
0 |
| 030747M | |
New Found Gold Corp. | |
Owl Pond | |
37 | |
9.25 | |
Issued | |
2020-05-02 | |
2025-05-02 | |
2024-07-01 | |
$ | 7,618.27 | |
2024-05-02 | |
1 | |
0 |
| 030748M | |
New Found Gold Corp. | |
Southwest Pond | |
140 | |
35.00 | |
Issued | |
2020-05-02 | |
2025-05-02 | |
2024-07-01 | |
$ | 28,825.88 | |
2024-05-02 | |
1 | |
0 |
| 030752M | |
New Found Gold Corp. | |
Miguel's Lake | |
78 | |
19.50 | |
Issued | |
2020-05-02 | |
2025-05-02 | |
2024-07-01 | |
$ | 16,060.14 | |
2024-05-02 | |
1 | |
0 |
| 030753M | |
New Found Gold Corp. | |
Gander Lake | |
3 | |
0.75 | |
Issued | |
2020-05-02 | |
2025-05-02 | |
2024-07-01 | |
$ | 37.68 | |
2025-05-02 | |
1 | |
0 |
| 030754M | |
New Found Gold Corp. | |
Little Gander Lake | |
172 | |
43.00 | |
Issued | |
2020-05-02 | |
2025-05-02 | |
2024-07-01 | |
$ | 35,414.66 | |
2024-05-02 | |
0 | |
0 |
| 030755M | |
New Found Gold Corp. | |
Rocky Brook | |
30 | |
7.50 | |
Issued | |
2020-05-02 | |
2025-05-02 | |
2024-07-01 | |
$ | 6,176.98 | |
2024-05-02 | |
0 | |
0 |
| 030756M | |
New Found Gold Corp. | |
Southwest Pond | |
88 | |
22.00 | |
Issued | |
2020-05-02 | |
2025-05-02 | |
2024-07-01 | |
$ | 18,119.14 | |
2024-05-02 | |
1 | |
0 |
| 030763M | |
New Found Gold Corp. | |
Rocky Brook | |
45 | |
11.25 | |
Issued | |
2020-05-02 | |
2025-05-02 | |
2024-07-01 | |
$ | 9,265.46 | |
2024-05-02 | |
0 | |
0 |
| 030765M | |
New Found Gold Corp. | |
Berry Hill Brook | |
124 | |
31.00 | |
Issued | |
2020-05-02 | |
2025-05-02 | |
2024-07-01 | |
$ | 25,531.50 | |
2024-05-02 | |
0 | |
0 |
| 030768M | |
New Found Gold Corp. | |
Gander Lake Prime | |
149 | |
37.25 | |
Issued | |
2020-05-02 | |
2025-05-02 | |
2023-07-03 | |
$ | 39,040.07 | |
2023-05-02 | |
1 | |
0 |
| 030771M | |
New Found Gold Corp. | |
Northwest Gander River | |
37 | |
9.25 | |
Issued | |
2020-05-02 | |
2025-05-02 | |
2024-07-01 | |
$ | 7,618.27 | |
2024-05-02 | |
1 | |
0 |
| 030783M | |
New Found Gold Corp. | |
Little Dead Wolf Brook | |
41 | |
10.25 | |
Issued | |
2020-05-02 | |
2025-05-02 | |
2024-07-01 | |
$ | 9,632.45 | |
2024-05-02 | |
0 | |
0 |
| 035087M | |
New Found Gold Corp. | |
Gander Lake Prime | |
2 | |
0.50 | |
Issued | |
2022-10-13 | |
2027-10-13 | |
2023-12-12 | |
$ | 400.00 | |
2023-10-13 | |
0 | |
0 |
| 035338M | |
New Found Gold Corp. | |
Gillingham's Pond | |
53 | |
13.25 | |
Issued | |
2023-01-05 | |
2028-01-05 | |
2024-03-05 | |
$ | 10,600.00 | |
2024-01-05 | |
0 | |
0 |
| 036670M | |
Alicia Moning | |
Careless
Brook, Central NL | |
6 | |
1.50 | |
Issued | |
2023-10-26 | |
2028-10-26 | |
2024-12-25 | |
$ | 1,200.00 | |
2024-10-26 | |
0 | |
0 |
| | |
| |
| |
| |
| |
| |
| |
| |
| |
| |
| |
| |
NSR |
| | |
| |
| |
| |
| |
| |
| |
| |
| |
Annual | |
| |
NSR | |
Buyback |
| | |
| |
| |
No. of | |
| |
| |
| |
| |
Report Due | |
Minimum | |
Expenses Due | |
Royalty | |
Provision |
| Licence
No. | |
Title Holder | |
Location | |
Claims | |
Area (km²) | |
Status | |
Issued Date | |
Renewal Date | |
Date | |
Expenses Due | |
Date | |
(%) | |
(%) |
| 024270M | |
New Found Gold Corp. | |
Island Pond, Central
NL | |
107 | |
26.75 | |
Issued | |
2016-10-24 | |
2026-10-26 | |
2023-12-25 | |
$ | 13,350.26 | |
2027-10-24 | |
1.6 | |
1 |
| 024274M | |
New Found Gold Corp. | |
Twin Ponds, Central NL | |
77 | |
19.25 | |
Issued | |
2016-10-24 | |
2026-10-26 | |
2023-12-25 | |
$ | 7,295.39 | |
2027-10-24 | |
1.6 | |
1 |
| 035048M | |
Suraj Amarnani | |
Twin Ponds | |
42 | |
10.50 | |
Issued | |
2022-09-29 | |
2027-09-29 | |
2023-11-28 | |
$ | 8,400.00 | |
2023-09-29 | |
0 | |
0 |
| D) | Ten Mile Duder Lake Block |
| | |
| |
| |
| |
| |
| |
| |
| |
| |
| |
| |
| |
NSR |
| | |
| |
| |
| |
| |
| |
| |
| |
| |
Annual | |
| |
NSR | |
Buyback |
| | |
| |
| |
No. of | |
| |
| |
| |
| |
Report Due | |
Minimum | |
Expenses Due | |
Royalty | |
Provision |
| Licence
No. | |
Title Holder | |
Location | |
Claims | |
Area (km²) | |
Status | |
Issued Date | |
Renewal Date | |
Date | |
Expenses Due | |
Date | |
(%) | |
(%) |
| 035047M | |
Aidan ONeil | |
Ten Mile-Duder Lake | |
209 | |
52.25 | |
Issued | |
2022-09-29 | |
2027-09-29 | |
2023-11-28 | |
$ | 41,800.00 | |
2023-09-29 | |
0 | |
0 |
| 035050M | |
Josh Vann | |
Ten Mile
Lake | |
2 | |
0.50 | |
Issued | |
2022-09-29 | |
2027-09-29 | |
2023-11-28 | |
$ | 400.00 | |
2023-09-29 | |
0 | |
0 |
| | |
| |
| |
| |
| |
| |
| |
| |
| |
| |
| |
| |
NSR |
| | |
| |
| |
| |
| |
| |
| |
| |
| |
Annual | |
| |
NSR | |
Buyback |
| | |
| |
| |
No. of | |
| |
| |
| |
| |
Report | |
Minimum | |
Expenses Due | |
Royalty | |
Provision |
| Licence No. | |
Title Holder | |
Location | |
Claims | |
Area (km²) | |
Status | |
Issued Date | |
Renewal Date | |
Due Date | |
Expenses
Due | |
Date | |
(%) | |
(%) |
| 035197M | |
Aidan ONeil | |
South Pond | |
130 | |
32.50 | |
Issued | |
2022-10-11 | |
2027-10-11 | |
2024-01-09 | |
$ | 26,000.00 | |
2023-11-10 | |
0 | |
0 |
| 035209M | |
New Found Gold Corp. | |
South Pond | |
2 | |
0.50 | |
Issued | |
2022-11-10 | |
2027-11-10 | |
2024-01-09 | |
$ | 400.00 | |
2023-11-10 | |
0 | |
0 |
Management’s Discussion and Analysis
For
the three months ended March 31, 2024 and 2023
| | |
| |
| |
| |
| |
| |
| |
| |
| |
| |
| |
| |
NSR |
| | |
| |
| |
| |
| |
| |
| |
| |
| |
Annual | |
| |
NSR | |
Buyback |
| | |
| |
| |
No. of | |
| |
| |
| |
| |
Report | |
Minimum | |
Expenses Due | |
Royalty | |
Provision |
| Licence
No. | |
Title Holder | |
Location | |
Claims | |
Area (km²) | |
Status | |
Issued Date | |
Renewal Date | |
Due Date | |
Expenses Due | |
Date | |
(%) | |
(%) |
| 030775M | |
New
Found Gold Corp. | |
Bellman's
Pond | |
1 | |
0.25 | |
Issued | |
2020-05-02 | |
2025-05-02 | |
2024-07-01 | |
$ | 221.43 | |
2024-05-02 | |
0 | |
0 |
| G) | Little Rocky Brook Block |
| | |
| |
| |
| |
| |
| |
| |
| |
| |
| |
| |
| |
NSR |
| | |
| |
| |
| |
| |
| |
| |
| |
| |
Annual | |
| |
NSR | |
Buyback |
| | |
| |
| |
No. of | |
| |
| |
| |
| |
Report | |
Minimum | |
Expenses
Due | |
Royalty | |
Provision |
| Licence
No. | |
Title Holder | |
Location | |
Claims | |
Area (km²) | |
Status | |
Issued Date | |
Renewal Date | |
Due Date | |
Expenses
Due | |
Date | |
(%) | |
(%) |
| 030777M | |
New
Found Gold Corp. | |
Little
Rocky Pond, Gander River | |
114 | |
28.50 | |
Issued | |
2020-05-02 | |
2025-05-02 | |
2024-07-01 | |
$ | 26,782.91 | |
2024-05-02 | |
0 | |
0 |
Management’s Discussion and Analysis
For
the three months ended March 31, 2024 and 2023
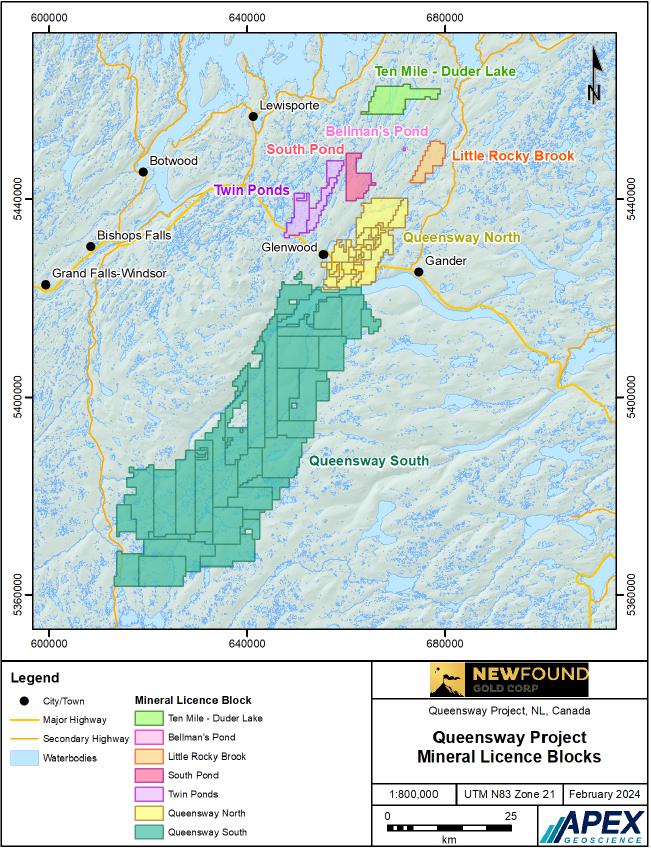
Queensway Project – Claim Groups
Management’s Discussion and Analysis
For
the three months ended March 31, 2024 and 2023
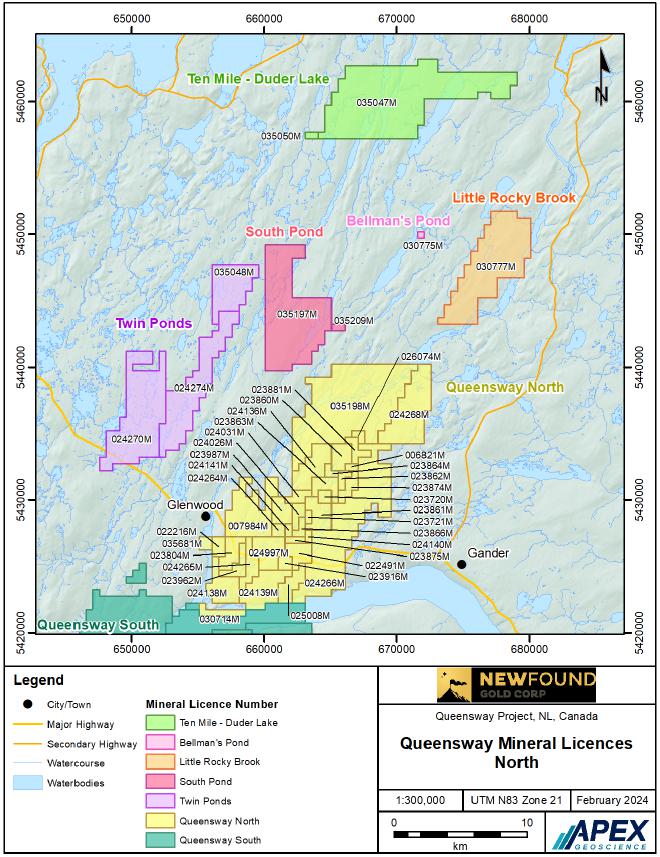
Queensway Project – Queensway North
mineral licences, and the separate licences of Twin Ponds, Ten Mile-Duder Lake, South Pond, Bellman’s Pond, and Little Rocky Brook
Management’s Discussion and Analysis
For
the three months ended March 31, 2024 and 2023
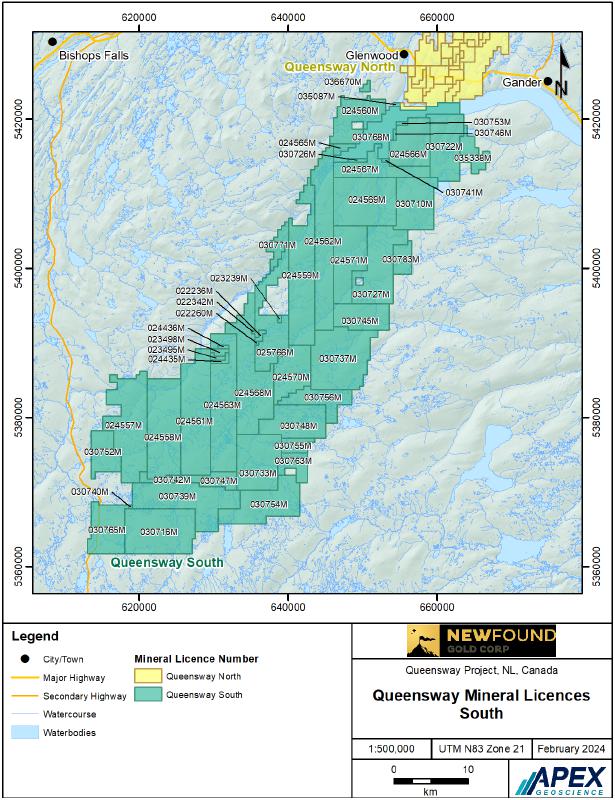
Queensway Project – Queensway South
mineral licences
Management’s Discussion and Analysis
For
the three months ended March 31, 2024 and 2023
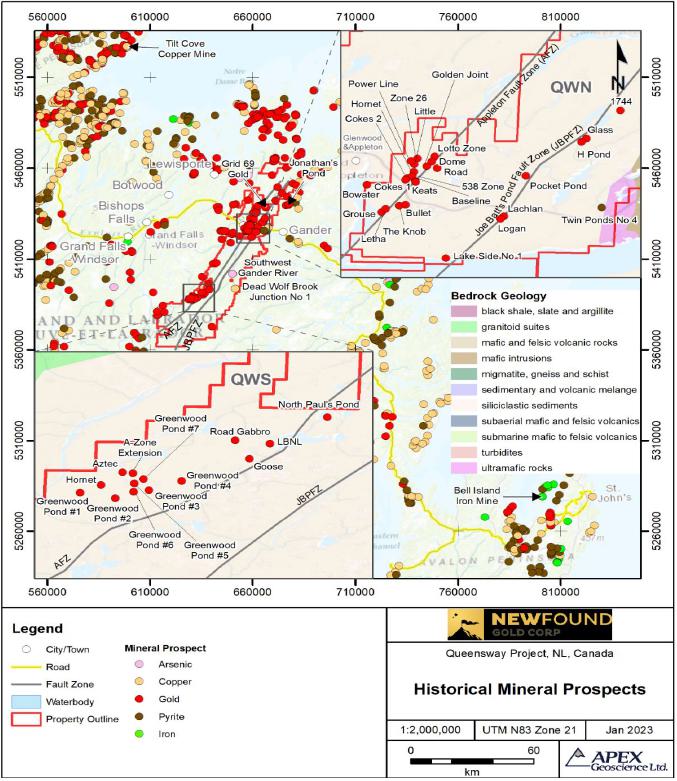
Queensway Project – Locations of Gold
Prospects
Management’s Discussion and Analysis
For
the three months ended March 31, 2024 and 2023
Environmental and Exploration Permitting
NFG is responsible for obtaining all permits in
accordance with the laws of Newfoundland and Labrador to conduct exploration activities at the Queensway Property. Exploration activities
require approval from the Mineral Lands Division of the province’s Department of Industry, Energy, and Technology. These specify
the activities that are allowed in the area; they are typically valid for one year and can be renewed.
The different permits and licence requirements in the province of Newfoundland
and Labrador can include:
| 1. | Exploration Approvals: An Exploration Approval Permit enables an exploration company to conduct
prospecting, rock and soil geochemistry, line cutting, trenching, bulk sampling, airborne and/or ground geophysical surveys, fuel storage,
ATV usage, diamond drilling, etc. |
| 2. | Water Use Licence: Activities that require water to be drawn from surface waterways or from aquifers
require a Water Use Licence. These are typically valid for five years and can be renewed. These permits are no longer needed for drilling
and trenching activities. |
| 3. | Licence to Occupy: Required if a camp location was to be used for a period longer than that which
was allowed as part of the Exploration Approval Permit. This permit is obtained from the Provincial Department of Crown lands. These are
typically valid for five years and can be renewed. |
| 4. | Section 39 Permit: When field activities occur within a Protected Public Water Supply Area
(PPWSA), restoration requirements and constraints on field activities are stipulated in a “Section 39 Permit” that is
typically valid for one year and can be renewed. |
| 5. | Section 48 Permit: If exploration activities include stream crossings and/or fording, or any
work in and around any body of water, the Water Resources Management Division must be contacted to obtain a Section 48 Permit to
Alter a Water Body under the Water Resources Act, 2002. |
| 6. | Forestry Permits: NFG shall contact the nearest Forest Management District Office to obtain the
following permits prior to commencing any activity as required. |
| a. | A commercial harvesting permit before the start of the exploration program if trees must be cut for access
to exploration sites on Crown lands. |
| b. | An operating permit if operations are to take place on forest land during the forest fire season (May-September). |
| c. | During the forest fire season, a permit to burn must be obtained to ignite a fire on or within 300 m of
forest land. NFG has never needed this permit. |
| 7. | Development Permit: Any activity that meets the definition of development under the Urban and
Rural Planning Act, 2000, within a municipal planning area/boundary will require application and permit from the Municipality. |
The table below summarizes the permits, licences, and approvals that
have currently been granted to NFG:
| · | Exploration Approvals (prefixed with E). |
| · | Water Use Licences (prefixed with WUL). |
| · | PPWSA Section 39 Permits (prefixed with PRO). |
| · | Section 48 Permits to Alter a Water Body (prefixed with ALT). |
| · | Other environmental permits. |
Management’s Discussion and Analysis
For
the three months ended March 31, 2024 and 2023
Mineral licences 024557M, 024558M, 024561M, 024563M,
024568M, and 024570M, all of which lie in the south of Queensway South, are restricted from exploration activities from mid-May to
early-July as this area is a spring habitat for Newfoundland caribou.
Mineral licence 035198M in Queensway North encloses
two known archaeological sites and covers a portion of the Gander River which has high archaeological potential. As such, the Provincial
Archaeology Office recommends a 100 m buffer along the Gander River, and 50 m buffers around the two known sites. The two known archaeological
sites in UTM Zone 21N NAD83 are: 1) 662938 m Easting, 5435800.33 m Northing and 2) 670038.33 m Easting, 5439264.60 m Northing.
With respect to title, mineral licences: 035047M
and 035197M, 035048M and 035198M, and 035050M are owned by Aidan O’Neil, Suraj Amarnani, and Josh Vann respectively. Hence, NFG
mineral rights ownership of these licence areas and the mineral occurrences that may occur within them are subject to successful completion
of conditions of a single Option Agreement in place.
Management’s Discussion and Analysis
For
the three months ended March 31, 2024 and 2023
Project Infrastructure
The main access roads
include the TCH that passes through the southern portion of the Appleton Fault Zone (“AFZ”) / Joe Batts Pond Fault
Zone (“JBPFZ”) claim areas on the QWN, and the Northwest Gander (“NWG”) road that extends along
the western portion of the property from the TCH just west of Glenwood, to the south and west of Gander Lake on QWS.
Gravel woods access roads originally built for
the forestry industry, such as the AFZ access, the JBPFZ access, the JBP road and the roads to the east of the steel bridge across the
NWG River and across the bridge to the east of the Southwest Gander River extend through most of the property, with areas in the extreme
SE and SW the most difficult to access. The SW area is best accessed by woods roads from Route 360, the Baie D’Espoir highway, that
leaves the TCH at Bishop’s Falls, approximately 70km to the west of Glenwood.
Transportation availability includes the international
airport at Gander which has bush plane and helicopter bases, a helicopter base in Appleton and shipping through the ports of Lewisporte
and Botwood, 25km and 70km to the west respectively, and north of the TCH, both with good harbours although problems with winter shipping
due to sea and pack ice.
Electricity is available from the NL provincial
grid, which has three transmission lines through the Queensway Project as follows:
| 1) | A 350 kV HVdc direct current line which passes through the approximate
centre of QWS licences; |
| 2) | Two 138 kV HVac transmission lines to the north of the TCH crossing the AFZ and JBPFZ trends on the QWN
licences; |
| 3) | And a 69 kV HVac transmission line that approximately parallels the TCH to the north across the AFZ and
JBPFZ trends on the QWN licences and follows the TCH and secondary routes. |
Historical Work
There has been over 29,200 metres of core in 238
holes drilled historically on the Queensway Project by Noranda, Rubicon and various operators from the mid 1980’s through to 2012.
Historical core drilling has primarily occurred north of Gander Lake along the two principal fault structures the AFZ and JBPFZ; the exploration
drilling has been spread out amongst individual zones with drilling along 5km of the AFZ targeting the Lotto, Powerline, Cokes, Keats,
Dome, Trench 26, Road, Knob, Letha, and Grouse zones. Drilling at the JBPFZ has focussed along 3km targeting the Pocket Pond and H-Pond
zones and one drill hole targeting the 798 Zone. Significantly lesser number of drill holes have also targeted zones south of Gander Lake
including the Paul’s Pond showing, Aztec and A-Zone extension, and the Goose zone.
Throughout the 1980’s through mid-2000’s
various operators and prospectors have completed surface geochemical sampling including tills, soils, and rock samples. This amounts to
roughly 2,500 till samples, over 14,000 soil samples and 6,000 rock samples spread across the large district scale project with concentrations
of work around the many showings in the Queensway license group. This work has identified a number of gold-in-soil or gold-in-till anomalies
that have led to surface gold discoveries or have yet to be explained with follow up exploration. Several locations throughout the project
have defined surface float samples containing high grade gold mineralization some of which have led to surface gold occurrences while
other locations have not been adequately explored to trace them to source.
Various historical ground geophysical surveys
have been conducted throughout the Queensway Project with most of this work concentrated either along the AFZ, JBPFZ, or in the region
of the Paul’s Pond and Greenwood Pond showings in the QWS claim group. Over 50 different geophysical surveys including VLF, EM,
MAG and IP have covered ground-based grids throughout the Queensway Project. Various anomalies have been identified and often limited
follow up exploration has occurred.
Management’s Discussion and Analysis
For
the three months ended March 31, 2024 and 2023
A significant number of surface trenches have
been conducted at the project with over 330 trenches completed to date. Many of the historical trenches have targeted soil and till anomalies
with only some of these reaching bedrock; often the trenches not reaching bedrock have left both soil and till anomalies unexplained and
open for further interpretation and exploration.
Project Geology
The Queensway Project is located within the Exploits
subzone of the Dunnage zone and lies just to the west of the Gander River Ultramafic Complex (“GRUC”) fault, which is the
Dunnage-Gander zones boundary. See figure below:
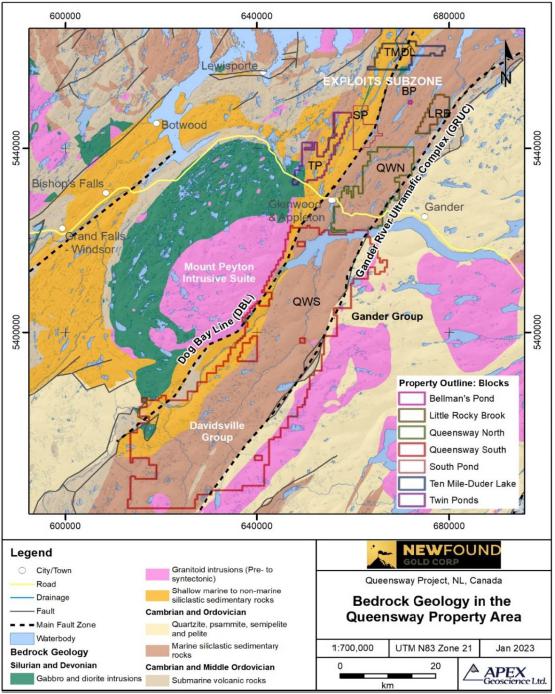
Queensway Project – Geological context of the Queensway
Project Geological map from Colman-Sadd et al., 1990.
Management’s Discussion and Analysis
For
the three months ended March 31, 2024 and 2023
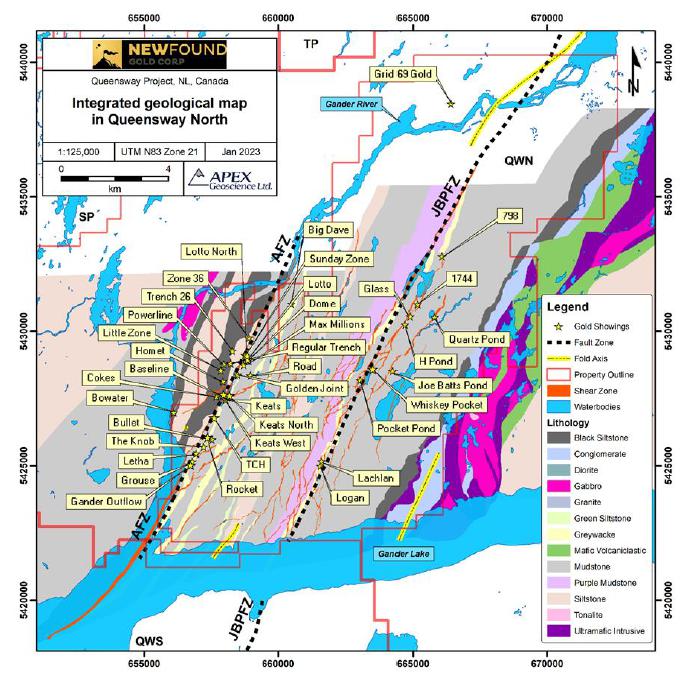
Queensway Project- Integrated geological
map of lithology, shear zones and gold showings in Queensway North.
It mostly comprises Cambrian to Silurian meta-sedimentary
rocks of the Davidsville group (Williams et al., 1988; Colman-Sadd et al., 1990; Valverde-Vaquero et al., 2006; van Staal, 2007; O’Reilly
et al., 2010). The Davidsville group is divided into the Outflow Formation and the Hunt’s Cove Formation. The property south of
Gander Lake also includes the boundary between the Davidsville and Indian Island groups. The latter mainly comprises Silurian siliciclastic
rocks, intruded by the Mount Peyton Intrusive suite.
There are over 100 gold showings/occurrences on
and around the Queensway Project however the most notable mineralized zones in the Queensway Project are the JBPFZ which includes the
H-Pond, Pocket Pond, Glass, Logan, and Lachlan showings and the AFZ which includes the Dome, Little, Knob, Letha, Lotto, Grouse, Road,
Bullet, Trench 26, Cokes, Powerline, Keats, and Bowater showings.
Management’s Discussion and Analysis
For
the three months ended March 31, 2024 and 2023
A number of gold mineralized occurrences also
occur within the QWS claim group including the Greenwood Pond, Hornet, North Pauls Pond, Aztec, Goose, Road Gabbro and LBNL showings.
Recent Exploration
Queensway Drill Program
On August 17, 2020, the Company announced
it had initiated a 100,000m HQ-size diamond drilling program at the Queensway Project. The Company announced on January 6, 2021,
that it had increased the drilling program started in 2020 to a total of 200,000m; this program was further expanded on October 15,
2021, to 400,000m, followed by another extension to 500,000m on January 3, 2023, and then to 650,000m on January 4, 2024. This
program is ongoing, and the Company currently has 4 drills operating in Q1 2024.
In 2020, the Company completed 67 drill holes
for a total of 13,593m that expanded the Keats zone and lead to the discovery of Lotto and Golden Joint zones.
In 2021, the Company completed an additional 424
drill holes totalling 115,852m largely focused on expanding Keats, Golden Joint, Lotto, 1744, and Pocket Pond zones.
In
2022, a total of 188,717m was completed in 677 holes that lead to the discoveries of Keats North, Keats West, Lotto North and further
expanded Keats, Golden Joint, and Lotto zones in addition to continued systematic testing along the AFZ. The Company also completed
a regional diamond drilling program designed to test high-priority targets at both Twin Ponds and QWS projects; both programs are the
first phase of drilling completed by the Company. The QWS program targeted an area 50km south of the Keats Zone with a high concentration
of gold anomalies surrounding the southern extension of the AFZ. This program generated encouraging results with twenty-seven holes returning
significant gold mineralization and 10 holes across 4 targets containing visible gold. The exploration drilling program was designed to
test a variety of targets in and around Paul’s Pond, Goose, Eastern Pond, and Greenwood #2 prospects and resulted in the discovery
of the Paul’s Pond and Devil’s Pond trends.
In 2023, a total of 196,115m was completed in
1,001 holes that lead to several discoveries including Iceberg, Iceberg East, K2, Monte Carlo, Jackpot, and Honeypot. Drilling rapidly
expanded on these new discoveries, in addition to extending Keats West, Golden Joint, and Keats. Notably the strike length of the Keats-Baseline
Fault Zone was extended to 1.9km with the addition of Iceberg and Iceberg East. Regional exploration programs included the completion
of a first pass drilling program on the newly optioned VOA ground that covers the northern extension of the AFZ testing 10 target areas,
results are pending from this program. Follow-up drilling at QWS was also completed including the Paul’s Pond trend in addition
to testing a number of new target areas, the results of this program are also pending. Other notable programs in 2023 include the completion
of the 3D seismic acquisition by HiSeis and the excavation of the Keats trench. The Company has received the seismic data, consultant
interpretations and targeting products and is actively working with it to guide deeper drilling programs. Trenching of the near-surface
high-grade segment of the Keats zone finished in October 2023, along with preliminary mapping; a detailed sampling and mapping program
is scheduled for early Q2.
The current drilling program is designed to test
multiple exploration targets and zones along the 9.45km of the AFZ at Queensway North. The primary focus at Queensway North is on the
expansion of known zones of mineralization and testing key discovery areas at depth utilizing the seismic data such as at Keats, Iceberg,
Keats West, K2, Lotto, and Jackpot in addition to new targets generated by the seismic interpretation. Meters have been allocated to regional
programs at QWS with the potential for a follow-up program at VOA pending the results of the first-pass program. Regional diamond drilling
programs are testing drill-ready targets generated through grassroots exploration activities in addition to follow-up programs from previously
completed drill programs.
Management’s Discussion and Analysis
For
the three months ended March 31, 2024 and 2023
The majority of drilling to date has occurred
along the northern segment of the AFZ with drill counts ranging from 4-15 and a project-wide year-to-date total of 544,674m has been completed
in 2,311 holes.
Queensway Project summary of drillholes from
diamond drilling programs
A) Queensway North
| | |
| |
2019 | | |
2020 | | |
2021 | | |
2022 | | |
2023 | | |
2024 | | |
24-Apr | | |
Total | |
| Prospect | |
Block | |
No.
of
Holes | | |
Length
(m) | | |
No.
of
Holes | | |
Length
(m) | | |
No.
of
Holes | | |
Length
(m) | | |
No.
of
Holes | | |
Length
(m) | | |
No.
of
Holes | | |
Length
(m) | | |
No.
of
Holes | | |
Length
(m) | | |
No.
of
Holes | | |
Length
(m) | |
| 798 | |
QWN | |
- | | |
- | | |
- | | |
- | | |
2 | | |
469 | | |
- | | |
- | | |
- | | |
- | | |
- | | |
- | | |
2 | | |
469 | |
| 1744 | |
QWN | |
2 | | |
522 | | |
- | | |
- | | |
23 | | |
7,066 | | |
3 | | |
1,398 | | |
- | | |
- | | |
- | | |
- | | |
28 | | |
8,986 | |
| Big Dave | |
QWN | |
- | | |
- | | |
- | | |
- | | |
- | | |
- | | |
24 | | |
7,792 | | |
- | | |
- | | |
- | | |
- | | |
24 | | |
7,792 | |
| Cokes | |
QWN | |
- | | |
- | | |
- | | |
- | | |
11 | | |
3,395 | | |
19 | | |
5,313 | | |
38 | | |
6,243 | | |
7 | | |
665 | | |
75 | | |
15,616 | |
| Dome | |
QWN | |
2 | | |
116 | | |
5 | | |
993 | | |
5 | | |
1,107 | | |
13 | | |
4,117 | | |
4 | | |
1,212 | | |
- | | |
- | | |
29 | | |
7,545 | |
| Everest | |
QWN | |
- | | |
- | | |
- | | |
- | | |
- | | |
- | | |
15 | | |
4,594 | | |
14 | | |
3,643 | | |
- | | |
- | | |
29 | | |
8,237 | |
| Gambit | |
QWN | |
- | | |
- | | |
- | | |
- | | |
- | | |
- | | |
- | | |
- | | |
3 | | |
552 | | |
- | | |
- | | |
3 | | |
552 | |
| Gander Outflow | |
QWN | |
- | | |
- | | |
- | | |
- | | |
- | | |
- | | |
2 | | |
1,345 | | |
- | | |
- | | |
10 | | |
1,760 | | |
12 | | |
3,105 | |
| Glass | |
QWN | |
4 | | |
879 | | |
- | | |
- | | |
- | | |
- | | |
2 | | |
679 | | |
- | | |
- | | |
- | | |
- | | |
6 | | |
1,558 | |
| Golden Bullet | |
QWN | |
- | | |
- | | |
- | | |
- | | |
- | | |
- | | |
1 | | |
572 | | |
2 | | |
634 | | |
- | | |
- | | |
3 | | |
1,206 | |
| Golden Joint | |
QWN | |
- | | |
- | | |
- | | |
- | | |
49 | | |
16,018 | | |
24 | | |
7,040 | | |
31 | | |
4,252 | | |
- | | |
- | | |
104 | | |
27,310 | |
| H Pond | |
QWN | |
- | | |
- | | |
- | | |
- | | |
- | | |
- | | |
- | | |
- | | |
4 | | |
1,373 | | |
- | | |
- | | |
4 | | |
1,373 | |
| Honeypot | |
QWN | |
- | | |
- | | |
- | | |
- | | |
- | | |
- | | |
10 | | |
2,611 | | |
28 | | |
5,099 | | |
8 | | |
1,292 | | |
46 | | |
9,002 | |
| Iceberg | |
QWN | |
- | | |
- | | |
- | | |
- | | |
4 | | |
1,365 | | |
12 | | |
3,544 | | |
117 | | |
29,393 | | |
- | | |
- | | |
133 | | |
34,302 | |
| Iceberg
Alley | |
QWN | |
- | | |
- | | |
- | | |
- | | |
- | | |
- | | |
1 | | |
353 | | |
27 | | |
3,673 | | |
9 | | |
1,899 | | |
37 | | |
5,925 | |
| Iceberg
East | |
QWN | |
- | | |
- | | |
- | | |
- | | |
- | | |
- | | |
6 | | |
1,774 | | |
89 | | |
16,760 | | |
4 | | |
2,717 | | |
99 | | |
21,251 | |
| Jackpot | |
QWN | |
- | | |
- | | |
- | | |
- | | |
- | | |
- | | |
9 | | |
2,562 | | |
60 | | |
10,783 | | |
7 | | |
1,641 | | |
76 | | |
14,986 | |
| K2 | |
QWN | |
- | | |
- | | |
- | | |
- | | |
5 | | |
1,129 | | |
17 | | |
4,477 | | |
103 | | |
17,426 | | |
23 | | |
4,438 | | |
148 | | |
27,471 | |
| K2 West | |
QWN | |
- | | |
- | | |
- | | |
- | | |
- | | |
- | | |
- | | |
- | | |
5 | | |
1,030 | | |
- | | |
- | | |
5 | | |
1,030 | |
| Keats | |
QWN | |
2 | | |
469 | | |
41 | | |
8,370 | | |
194 | | |
51,252 | | |
85 | | |
24,181 | | |
38 | | |
7,661 | | |
- | | |
- | | |
360 | | |
91,935 | |
| Keats North | |
QWN | |
- | | |
- | | |
- | | |
- | | |
- | | |
- | | |
70 | | |
18,707 | | |
47 | | |
6,410 | | |
- | | |
- | | |
117 | | |
25,117 | |
| Keats West | |
QWN | |
- | | |
- | | |
- | | |
- | | |
2 | | |
748 | | |
67 | | |
14,127 | | |
86 | | |
15,201 | | |
9 | | |
1,260 | | |
164 | | |
31,337 | |
| Keats South | |
QWN | |
- | | |
- | | |
- | | |
- | | |
12 | | |
4,091 | | |
47 | | |
24,461 | | |
25 | | |
5,006 | | |
2 | | |
836 | | |
86 | | |
34,395 | |
| Kings Point | |
QWN | |
- | | |
- | | |
- | | |
- | | |
- | | |
- | | |
- | | |
- | | |
5 | | |
787 | | |
- | | |
- | | |
5 | | |
787 | |
| Knob | |
QWN | |
- | | |
- | | |
- | | |
- | | |
14 | | |
2,667 | | |
24 | | |
3,621 | | |
- | | |
- | | |
- | | |
- | | |
38 | | |
6,289 | |
| Rocket | |
QWN | |
- | | |
- | | |
- | | |
- | | |
2 | | |
492 | | |
29 | | |
6,064 | | |
5 | | |
769 | | |
6 | | |
950 | | |
42 | | |
8,275 | |
| Little Zone | |
QWN | |
- | | |
- | | |
6 | | |
769 | | |
- | | |
- | | |
- | | |
- | | |
19 | | |
3,881 | | |
3 | | |
1,272 | | |
28 | | |
5,922 | |
| Lonely Mountain | |
QWN | |
- | | |
- | | |
- | | |
- | | |
- | | |
- | | |
- | | |
- | | |
3 | | |
567 | | |
- | | |
- | | |
3 | | |
567 | |
| Lotto | |
QWN | |
- | | |
- | | |
13 | | |
3,032 | | |
45 | | |
13,405 | | |
34 | | |
8,444 | | |
4 | | |
1,018 | | |
- | | |
- | | |
96 | | |
25,899 | |
| Lotto North | |
QWN | |
- | | |
- | | |
- | | |
- | | |
4 | | |
674 | | |
42 | | |
10,406 | | |
33 | | |
7,248 | | |
2 | | |
931 | | |
81 | | |
19,258 | |
| Monte Carlo | |
QWN | |
- | | |
- | | |
- | | |
- | | |
- | | |
- | | |
21 | | |
4,664 | | |
79 | | |
16,440 | | |
10 | | |
2,785 | | |
110 | | |
23,889 | |
| Pocket Pond | |
QWN | |
- | | |
- | | |
- | | |
- | | |
42 | | |
9,677 | | |
4 | | |
1,052 | | |
8 | | |
1,789 | | |
- | | |
- | | |
54 | | |
12,518 | |
| Powerline | |
QWN | |
- | | |
- | | |
- | | |
- | | |
3 | | |
595 | | |
9 | | |
1,832 | | |
44 | | |
8,269 | | |
- | | |
- | | |
56 | | |
10,696 | |
| Road | |
QWN | |
- | | |
- | | |
2 | | |
429 | | |
1 | | |
284 | | |
3 | | |
819 | | |
9 | | |
2,121 | | |
12 | | |
2,135 | | |
27 | | |
5,789 | |
| TCH (Trans
Canada Highway) | |
QWN | |
- | | |
- | | |
- | | |
- | | |
2 | | |
449 | | |
25 | | |
8,161 | | |
- | | |
- | | |
- | | |
- | | |
27 | | |
8,609 | |
| TCW (Trans
Canada West) | |
QWN | |
- | | |
- | | |
- | | |
- | | |
- | | |
- | | |
14 | | |
3,321 | | |
8 | | |
2,210 | | |
- | | |
- | | |
22 | | |
5,531 | |
| Whiskey
Pocket | |
QWN | |
- | | |
- | | |
- | | |
- | | |
4 | | |
969 | | |
5 | | |
1,921 | | |
- | | |
- | | |
- | | |
- | | |
9 | | |
2,891 | |
| | |
Totals | |
10 | | |
1,985 | | |
67 | | |
13,593 | | |
424 | | |
115,852 | | |
637 | | |
179,954 | | |
938 | | |
181,451 | | |
112 | | |
24,584 | | |
2,188 | | |
517,419 | |
B) Queensway South
| | |
| |
2019 | | |
2020 | | |
2021 | | |
2022 | | |
2023 | | |
2024 | | |
Q1 | | |
Total | |
| Prospect | |
Block | |
No.
of
Holes | | |
Length
(m) | | |
No.
of
Holes | | |
Length
(m) | | |
No.
of
Holes | | |
Length
(m) | | |
No.
of
Holes | | |
Length
(m) | | |
No.
of
Holes | | |
Length
(m) | | |
No.
of
Holes | | |
Length
(m) | | |
No.
of
Holes | | |
Length
(m) | |
| Astronaut | |
QWS | |
- | | |
- | | |
- | | |
- | | |
- | | |
- | | |
2 | | |
718 | | |
8 | | |
2,117 | | |
- | | |
- | | |
10 | | |
2,835 | |
| Aztec | |
QWS | |
- | | |
- | | |
- | | |
- | | |
- | | |
- | | |
2 | | |
739 | | |
- | | |
- | | |
- | | |
- | | |
2 | | |
739 | |
| Bernards
Pond | |
QWS | |
- | | |
- | | |
- | | |
- | | |
- | | |
- | | |
3 | | |
438 | | |
- | | |
- | | |
6 | | |
1,458 | | |
9 | | |
1,896 | |
| Devil's
Trench | |
QWS | |
- | | |
- | | |
- | | |
- | | |
- | | |
- | | |
4 | | |
551 | | |
- | | |
- | | |
- | | |
- | | |
4 | | |
551 | |
| Eastern
Pond | |
QWS | |
- | | |
- | | |
- | | |
- | | |
- | | |
- | | |
1 | | |
407 | | |
9 | | |
1,934 | | |
- | | |
- | | |
10 | | |
2,341 | |
| Golden Elbow | |
QWS | |
- | | |
- | | |
- | | |
- | | |
- | | |
- | | |
- | | |
- | | |
3 | | |
906 | | |
- | | |
- | | |
3 | | |
906 | |
| Goose | |
QWS | |
- | | |
- | | |
- | | |
- | | |
- | | |
- | | |
5 | | |
743 | | |
- | | |
- | | |
- | | |
- | | |
5 | | |
743 | |
| Greenwood | |
QWS | |
- | | |
- | | |
- | | |
- | | |
- | | |
- | | |
6 | | |
756 | | |
- | | |
- | | |
- | | |
- | | |
6 | | |
756 | |
| Mars | |
QWS | |
- | | |
- | | |
- | | |
- | | |
- | | |
- | | |
- | | |
- | | |
- | | |
- | | |
8 | | |
871 | | |
8 | | |
871 | |
| Nebula | |
QWS | |
- | | |
- | | |
- | | |
- | | |
- | | |
- | | |
2 | | |
448 | | |
4 | | |
690 | | |
- | | |
- | | |
6 | | |
1,138 | |
| Nova | |
QWS | |
- | | |
- | | |
- | | |
- | | |
- | | |
- | | |
4 | | |
1,103 | | |
7 | | |
1,118 | | |
- | | |
- | | |
11 | | |
2,221 | |
| Paul's Pond | |
QWS | |
- | | |
- | | |
- | | |
- | | |
- | | |
- | | |
4 | | |
1,352 | | |
3 | | |
900 | | |
- | | |
- | | |
7 | | |
2,252 | |
| Potato Trench | |
QWS | |
- | | |
- | | |
- | | |
- | | |
- | | |
- | | |
- | | |
- | | |
- | | |
- | | |
5 | | |
1,096 | | |
5 | | |
1,096 | |
| Till Raft | |
QWS | |
- | | |
- | | |
- | | |
- | | |
- | | |
- | | |
- | | |
- | | |
3 | | |
714 | | |
- | | |
- | | |
3 | | |
714 | |
| | |
Totals | |
- | | |
- | | |
- | | |
- | | |
- | | |
- | | |
33 | | |
7,255 | | |
37 | | |
8,379 | | |
19 | | |
3,425 | | |
89 | | |
19,059 | |
C) VOA
| | |
| |
2019 | | |
2020 | | |
2021 | | |
2022 | | |
2023 | | |
2024 | | |
Q1 | | |
Total | |
| Prospect | |
Block | |
No.
of
Holes | | |
Length
(m) | | |
No.
of
Holes | | |
Length
(m) | | |
No.
of
Holes | | |
Length
(m) | | |
No.
of
Holes | | |
Length
(m) | | |
No.
of
Holes | | |
Length
(m) | | |
No.
of
Holes | | |
Length
(m) | | |
No.
of
Holes | | |
Length
(m) | |
| 69 Zone | |
VOA | |
- | | |
- | | |
- | | |
- | | |
- | | |
- | | |
- | | |
- | | |
4 | | |
972 | | |
- | | |
- | | |
4 | | |
972 | |
| BD Pond | |
VOA | |
- | | |
- | | |
- | | |
- | | |
- | | |
- | | |
- | | |
- | | |
1 | | |
350 | | |
- | | |
- | | |
1 | | |
350 | |
| Bigger Vein | |
VOA | |
- | | |
- | | |
- | | |
- | | |
- | | |
- | | |
- | | |
- | | |
2 | | |
700 | | |
- | | |
- | | |
2 | | |
700 | |
| Bigger Vein
2 | |
VOA | |
- | | |
- | | |
- | | |
- | | |
- | | |
- | | |
- | | |
- | | |
1 | | |
600 | | |
- | | |
- | | |
1 | | |
600 | |
| Fork in
the Road | |
VOA | |
- | | |
- | | |
- | | |
- | | |
- | | |
- | | |
- | | |
- | | |
2 | | |
285 | | |
- | | |
- | | |
2 | | |
285 | |
| Hank1 | |
VOA | |
- | | |
- | | |
- | | |
- | | |
- | | |
- | | |
- | | |
- | | |
7 | | |
1,360 | | |
- | | |
- | | |
7 | | |
1,360 | |
| Hank2 | |
VOA | |
- | | |
- | | |
- | | |
- | | |
- | | |
- | | |
- | | |
- | | |
1 | | |
441 | | |
1 | | |
402 | | |
2 | | |
843 | |
| Hank3 | |
VOA | |
- | | |
- | | |
- | | |
- | | |
- | | |
- | | |
- | | |
- | | |
2 | | |
507 | | |
- | | |
- | | |
2 | | |
507 | |
| Home Pond | |
VOA | |
- | | |
- | | |
- | | |
- | | |
- | | |
- | | |
- | | |
- | | |
3 | | |
515 | | |
- | | |
- | | |
3 | | |
515 | |
| Karate Chop
South | |
VOA | |
- | | |
- | | |
- | | |
- | | |
- | | |
- | | |
- | | |
- | | |
3 | | |
555 | | |
- | | |
- | | |
3 | | |
555 | |
| | |
Totals | |
- | | |
- | | |
- | | |
- | | |
- | | |
- | | |
- | | |
- | | |
26 | | |
6,285 | | |
1 | | |
402 | | |
27 | | |
6,687 | |
| | |
| |
2019 | | |
2020 | | |
2021 | | |
2022 | | |
2023 | | |
2024 | | |
Q1 | | |
Total | |
| Prospect | |
Block | |
No.
of
Holes | | |
Length
(m) | | |
No.
of
Holes | | |
Length
(m) | | |
No.
of
Holes | | |
Length
(m) | | |
No.
of
Holes | | |
Length
(m) | | |
No.
of
Holes | | |
Length
(m) | | |
No.
of
Holes | | |
Length
(m) | | |
No.
of
Holes | | |
Length
(m) | |
| Twin Ponds | |
TP | |
- | | |
- | | |
- | | |
- | | |
- | | |
- | | |
7 | | |
1,509 | | |
- | | |
- | | |
- | | |
- | | |
7 | | |
1,509 | |
| Property
Total | |
| |
10 | | |
1,985 | | |
67 | | |
13,593 | | |
424 | | |
115,852 | | |
677 | | |
188,717 | | |
1,001 | | |
196,115 | | |
132 | | |
28,411 | | |
2,311 | | |
544,674 | |
Management’s Discussion and Analysis
For
the three months ended March 31, 2024 and 2023
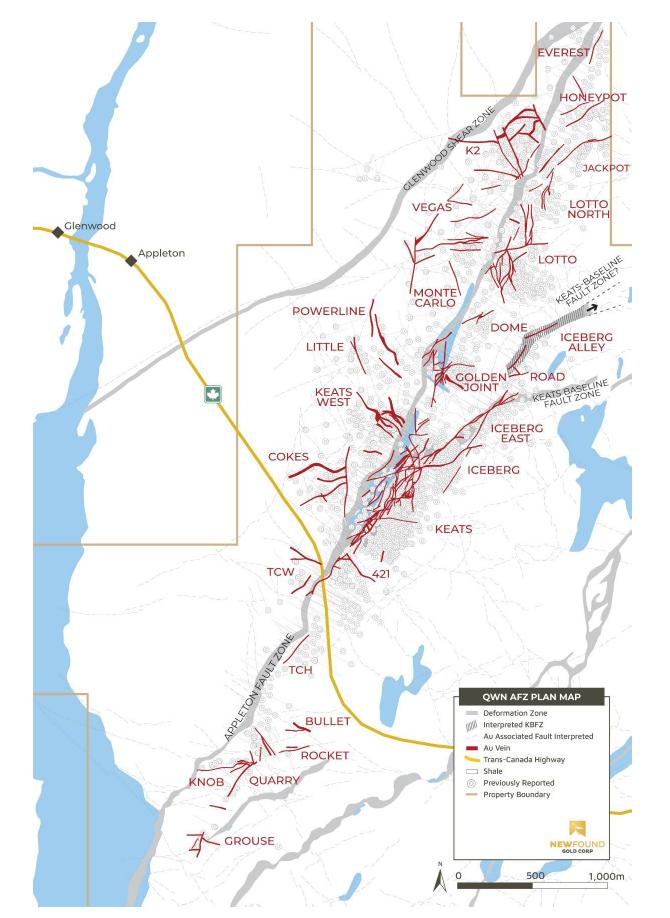
Queensway Project – Knob to Everest
plan map (April 17, 2024)
Management’s Discussion and Analysis
For
the three months ended March 31, 2024 and 2023
Keats Zone Drilling
To
date, the Company has focused significant drilling efforts at the Keats Zone where a discovery hole in late 2019 (NFGC-19-01 reporting
92.9 g/t Au over 19.00m) was drilled. In August 2020, as follow-up to the 2019 drill program, NFGC began incrementally stepping
out with diamond drilling from NFGC-19-01 identifying a brittle fault zone known as the “Keats-Baseline” (“KBFZ”)
that has an east-northeast strike (N55°E) and dips to the southeast at approximately 60°. This brittle fault zone lies to the
east of the AFZ and runs slightly oblique to it. The KBFZ forms an extensive damage zone that controls the development of a complex network
of brittle, high-grade gold vein arrays that are epizonal in character. Several significant gold assay intercepts have been encountered
within multiple individual zones at Keats.
From 2021 to 2023 the Keats Zone steadily increased
in both strike and depth extent; it is now defined over 575m of strike and a selection of highlight intervals with release dates are summarized
in the table below. When connected through to the recent discoveries at Iceberg and Iceberg-East, that are also hosted by the KBFZ, this
mineralized corridor spans a strike length of 1.9km, with a maximum tested vertical depth of 450m in the southern extents of the Keats
Zone. Other notable additions include cross-cutting structures such as the 421 Zone located at the south end of Keats and the Umbra and
Penumbra structures that link through to Keats North and likely play a key role in concentrating gold at the north end of Keats.
In
2023, exploration testing at depths greater than 400m vertical was largely postponed in anticipation of the 3-D seismic data that will
assist with targeting deeper mineralization. The Company instead focussed on a shallow step-out program utilizing a barge-mounted
drill situated on South Hermans Pond to reach the upper portions of the Keats Zone that was not reachable by land. Drilling extended the
mineralization to surface and confirmed the near-surface continuation of the Keats Main Zone (reported on March 26, 2024).
Additional drilling results released in Q1 2024
(March 26, 2024), from both barge and on-land extensions of drill holes originally targeting the Keats Main Zone, expanded on a series
of mineralized structures located between the Keats Main Zone and the AFZ. Within this domain of rock, there are several lower-grade structures
that trend parallel to the AFZ but also contain domains of localized high-grade gold. This area of mineralization immediately east of
the AFZ remains poorly tested at depth and will be a focus of future deep drilling efforts.
On
November 17, 2023, the Company announced the completion of the Keats trench excavation and phase I mapping program. The trenching
program was designed to expose nearly 200m of strike over a 70m wide area, roughly corresponding to the known surface expression of the
Keats Main Zone. The Keats trench will provide critical geological information used to validate the current geological model. Before the
Keats trench, the Keats Zone had only ever been observed in drill core and modelled in 3D, forming the basis of the Company’s geological
model. As expected, the trench has revealed an extensive network of veins as well as the related Keats-Baseline Fault Zone and initial
observations closely mirror the working model, but with added detail, including the presence of visible gold in areas where it was not
previously identified by nearby drilling.
One particularly notable vein called the East-West
Vein (“E-W Vein”) was uncovered over a 100m long surface expression, including a 25m segment that is host to a significant
amount of visible gold. Through previous drilling, the E-W Vein has been intercepted over a strike length of 300m and down to a vertical
depth of 150m, forming an important constituent of the Keats-Baseline Fault Zone. The phase II trench mapping and sampling program will
commence in early Q2 2024, which will lend further validation to the geological model, as well as provide critical insights into the genesis
of the Keats Zone and assist in future targeting along the Appleton Fault Zone.
In 2024, the Company has initiated deep drilling
at Keats utilizing the seismic data exploring the down-dip extension of the KBFZ in addition to looking for new structures located between
the KBFZ and the AFZ.
Management’s Discussion and Analysis
For
the three months ended March 31, 2024 and 2023
2024 assay results have
been reported in press releases dated March 26, 2024. All previous and 2024 press releases can be found through SEDAR+.
Highlighted assay values and drill hole locations
from Keats drilling are shown in the tables below:
| Hole No. |
From (m) |
To (m) |
Length (m) |
Au (g/t) |
Zone |
True Width (%) |
Date Released |
| NFGC-19-01 |
95.00 |
115.50 |
20.50 |
86.17 |
Keats Main |
40-70 |
01/28/2020 |
| Including |
96.00 |
115.00 |
19.00 |
92.86 |
Keats Main |
40-70 |
01/28/2020 |
| Including |
105.00 |
111.00 |
6.00 |
285.2 |
Keats Main |
40-70 |
01/28/2020 |
| NFGC-20-26 |
44.70 |
73.85 |
29.15 |
11.8 |
Keats Main |
70-95 |
11/16/2020 |
| Including |
67.00 |
73.85 |
6.85 |
44.5 |
Keats Main |
70-95 |
11/16/2020 |
| Including |
73.50 |
73.85 |
0.35 |
824 |
Keats Main |
70-95 |
11/16/2020 |
| NFGC-20-74 |
44.00 |
46.00 |
2.00 |
32.27 |
Keats Main |
70-95 |
04/07/2021 |
| NFGC-20-74 |
81.70 |
85.75 |
4.05 |
45.59 |
Keats Main |
70-95 |
04/07/2021 |
| NFGC-21-80 |
49.45 |
88.50 |
39.05 |
25.8 |
Keats Main |
70-95 |
03/10/2021 |
| Including |
62.70 |
72.80 |
10.10 |
58.5 |
Keats Main |
40-70 |
03/10/2021 |
| Including |
78.65 |
88.50 |
9.85 |
39.5 |
Keats Main |
70-95 |
03/10/2021 |
| NFGC-21-80 |
93.15 |
95.45 |
2.30 |
41.6 |
Keats Main |
70-95 |
03/10/2021 |
| NFGC-21-118 |
211.15 |
224.80 |
13.65 |
61.8 |
Keats Main |
40-70 |
03/16/2021 |
| Including |
212.10 |
213.05 |
0.95 |
565 |
Keats Main |
70-95 |
03/16/2021 |
| NFGC-21-182 |
285.85 |
321.25 |
35.40 |
106.2 |
Keats Main |
Unknown |
05/21/2021 |
| Including |
291.00 |
316.60 |
25.60 |
146.25 |
Keats Main |
Unknown |
05/21/2021 |
| Including |
291.00 |
292.00 |
1.00 |
10.18 |
Keats Main |
Unknown |
05/21/2021 |
| Including |
296.45 |
298.45 |
2.00 |
747.89 |
Keats Main |
Unknown |
05/21/2021 |
| Including |
302.00 |
312.00 |
10.00 |
219.43 |
Keats Main |
Unknown |
05/21/2021 |
| Including |
315.00 |
316.00 |
1.00 |
15.87 |
Keats Main |
Unknown |
05/21/2021 |
| NFGC-21-204 |
244.45 |
252.50 |
8.05 |
21.36 |
Keats Main |
40-70 |
06/15/2021 |
| Including |
248.80 |
249.65 |
0.85 |
184.73 |
Keats Main |
40-70 |
06/15/2021 |
| NFGC-21-204 |
283.15 |
296.00 |
12.85 |
14.92 |
Keats Main |
10-40 |
06/15/2021 |
| Including |
284.10 |
285.00 |
0.90 |
134.96 |
Keats Main |
10-40 |
06/15/2021 |
| Including |
289.15 |
290.80 |
1.65 |
25.25 |
Keats Main |
10-40 |
06/15/2021 |
| Including |
291.80 |
292.65 |
0.85 |
12.05 |
Keats Main |
10-40 |
06/15/2021 |
| NFGC-21-360 |
260.80 |
266.00 |
5.20 |
61.5 |
Keats Main |
40-70 |
10/14/2021 |
| Including |
260.80 |
263.50 |
2.70 |
117.15 |
Keats Main |
40-70 |
10/14/2021 |
| NFGC-21-413A |
463.05 |
467.55 |
4.50 |
28.2 |
Keats FW |
40-70 |
01/26/2022 |
| Including |
463.05 |
465.00 |
1.95 |
61.62 |
Keats FW |
40-70 |
01/26/2022 |
| NFGC-23-1130 |
102.70 |
111.00 |
8.30 |
17.83 |
421 |
40-70 |
09/20/2023 |
| Including |
102.70 |
103.35 |
0.65 |
66.96 |
421 |
40-70 |
09/20/2023 |
| Including |
108.00 |
111.00 |
3.00 |
44.33 |
421 |
40-70 |
09/20/2023 |
| NFGC-23-1182 |
185.45 |
194.35 |
8.90 |
11.5 |
Keats S |
Unknown |
07/24/2023 |
| Including |
187.00 |
188.00 |
1.00 |
80.8 |
Keats S |
Unknown |
07/24/2023 |
Infill veining in secondary structures with
multiple orientations crosscutting the primary host structures are commonly observed in drill core which could result in additional uncertainty
in true width. As of March 1, 2023, composite intervals reported carry a minimum weighted average of 1 g/t Au diluted over a minimum
core length of 2m with a maximum of 4m consecutive dilution when at depths above 200m vertical depth and 2m consecutive dilution when
below 200m vertical depth. Prior to this date, all composites allowed for 2m consecutive dilution. Prior to February 18, 2022, all
composite intervals were selected visually. Included high-grade intercepts are reported as any consecutive interval with grades greater
than 10 g/t Au. Grades have not been capped in the averaging and intervals are reported as drill thickness.
| Hole No. |
Azimuth (°) |
Dip (°) |
Length (m) |
UTM E |
UTM N |
Prospect |
| NFGC-19-01 |
302 |
-44 |
199 |
658227 |
5427454 |
Keats |
| NFGC-20-26 |
300 |
-45 |
269 |
658151 |
5427444 |
Keats |
| NFGC-20-74 |
300 |
-45 |
238 |
658229 |
5427491 |
Keats |
| NFGC-21-80 |
300 |
-45 |
200 |
658239 |
5427486 |
Keats |
| NFGC-21-118 |
300 |
-45 |
660 |
658189 |
5427285 |
Keats |
| NFGC-21-182 |
300 |
-48 |
377 |
658182 |
5427196 |
Keats |
| NFGC-21-204 |
297 |
-56 |
412 |
658145 |
5427194 |
Keats |
| NFGC-21-360 |
299 |
-46 |
359 |
658011 |
5427180 |
Keats |
| NFGC-21-413A |
296 |
-57 |
515 |
658086 |
5427134 |
Keats |
| NFGC-23-1130 |
300 |
-45 |
203 |
657777 |
5427034 |
Keats S |
| NFGC-23-1182 |
332 |
-45 |
322 |
657775 |
5426945 |
Keats S |
Management’s Discussion and Analysis
For
the three months ended March 31, 2024 and 2023
The latest drilling results are shown on the long
section, plan map, and cross sections below:
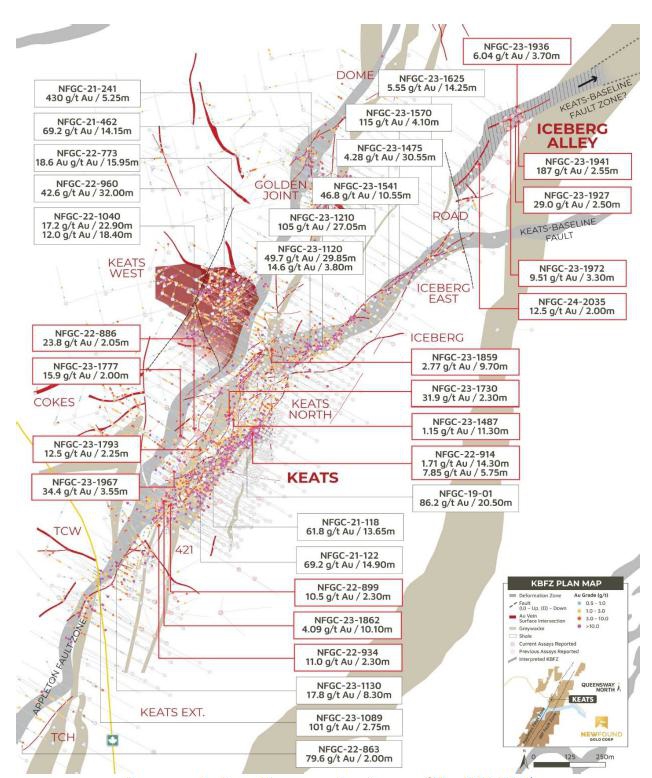
Queensway Project – Keats area plan
view map (March 26, 2024)
Management’s Discussion and Analysis
For
the three months ended March 31, 2024 and 2023
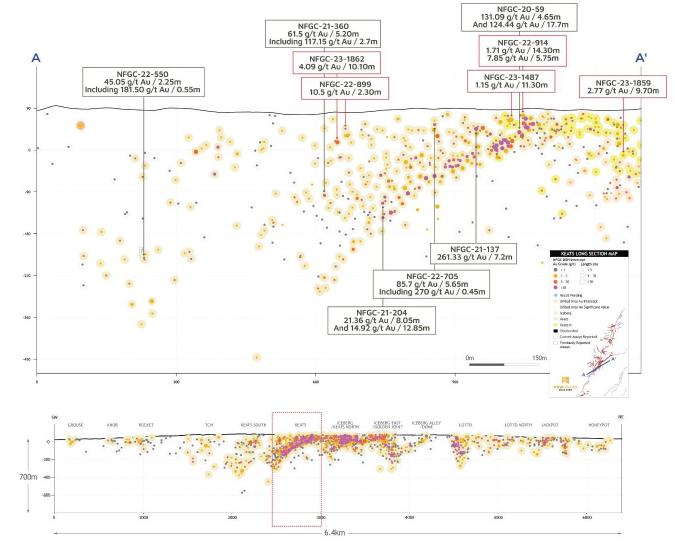
Queensway Project – Long section of
Iceberg, Keats Main and TCH zones, looking northwest (March 26, 2024)
Management’s Discussion and Analysis
For
the three months ended March 31, 2024 and 2023
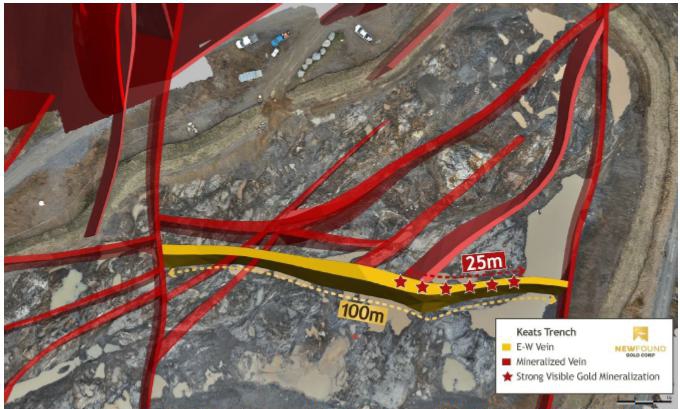
Queensway Project – Keats Trench plan
view map with location of strong visible gold mineralization in the E-W Vein (November 17, 2023).
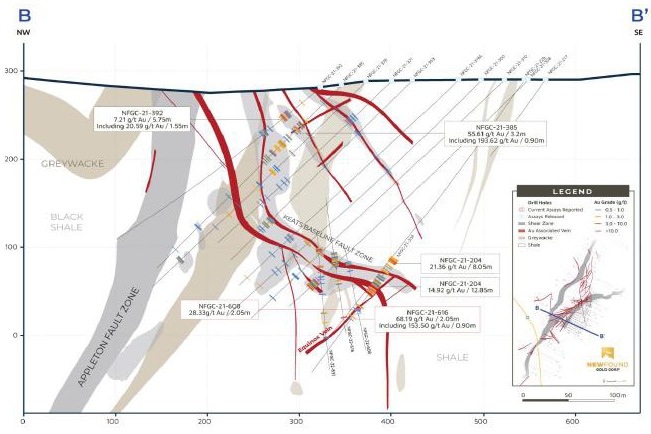
Queensway Project – Keats Cross-Section (B-B’),
Looking NE, +/- 12.5m (October 18, 2022)
Management’s Discussion and Analysis
For
the three months ended March 31, 2024 and 2023
Iceberg and Iceberg
East Drilling
On March 1, 2023,
the Company announced the discovery of a new zone, “Iceberg”. This zone is found along the highly prolific Keats-Baseline
Fault Zone (“KBFZ”), the structure that is host to the Keats Main Zone. Iceberg shares a similar orientation to Keats Main
and is comprised of a multitude of intersecting veins concentrating high-grade gold mineralization. The geological characteristics of
Iceberg are nearly identical to those observed at Keats Main and the Company’s current interpretation is that Iceberg is the eastern
continuation of Keats Main that has been displaced by faulting.
This
new discovery has expanded rapidly, and step-out drilling has continued to intersect high-grade gold along strike to the east, which is
an area now known as Iceberg East. Drilling reported on February 14, 2024, expanded the Iceberg-Iceberg East segment to over
a strike length of 665m, spotlighting the continued strength of the gold system within the KBFZ that includes Keats, Iceberg, and
Iceberg East – a corridor that now spans 1.9km in strike length. The high-grade gold mineralization at Iceberg-Iceberg East starts
at surface and is currently extended to a vertical depth of 170m.
Results reported in Q1 2024 both expanded and
infilled the eastern extent of Iceberg East in addition to near-surface gaps along strike, a selection of highlight intervals from this
drilling are summarized in the table below (February 14, 2014). These intervals are all located nearly 500m east of the AFZ and start
at vertical depths ranging between 30-50m.
Also reported in Q1 2024 (March 26, 2024)
was a new zone, now named “Iceberg Alley”. This new zone was intersected as part of a targeted program following the eastern
continuation of the Keats-Iceberg-Iceberg East corridor along the high-grade KBFZ. Based on the fault characteristics observed at Iceberg
Alley, as well as the zone’s orientation, intensity, and width of the damage zone, the Company’s preliminary interpretation
indicates that it is another displaced segment of the KBFZ, in a northward direction. Additional drilling is planned at Iceberg Alley
to expand on this new discovery in addition to gaining a better understanding of its structural relationship to the KBFZ mineralization.
Drilling at Iceberg pivoted to infilling gaps,
extending the high-grade to surface, and testing the opposing vein orientations to the main east-northeast striking orientation of the
Keats-Baseline Fault Zone. Results of this program were reported on March 13, 2024, and a selection of highlight results from this
program are summarized in the table below. The high-grade domain at Iceberg occurs where there is a confluence of high-grade gold veins
and associated structures. These holes were drilled from the west to the east to better test this secondary set of gold veins that are
partly controlling the high-grade mineralization in this segment of the Keats-Baseline Fault Zone (‘KBFZ’) and to gain a better
understanding of their orientations and true widths.
The
Company is pleased with the ongoing success and rapid expansion of both the Iceberg and Iceberg East zones; mineralization ranges in true
width from 10-40m, intervals received have demonstrated good continuity of the high-grade along strike and to depth, and the KBFZ remains
open in all directions. Exploration will continue to further define these domains of high-grade while also focussing on expansion drilling
both along strike and to depth. Minimal exploration work has been completed below 200m vertical depth with the deepest drilling
completed to date intersecting the structure and gold mineralization at 270m vertical. Exploration will utilize the seismic results to
assist with targeting the structure at depth.
Management’s Discussion and Analysis
For the three months ended March 31, 2024 and 2023
2024 assay results have
been reported in press releases dated February 14, 2024, and March 13, 2024. All previous and 2024 press releases can be found
through SEDAR+.
Highlighted assay values and drill hole
locations from Iceberg and Iceberg East drilling are shown in the tables below:
| Hole No. |
From (m) |
To (m) |
Length (m) |
Au (g/t) |
Zone |
True Width (%) |
Date Released |
| NFGC-23-1120 |
53.55 |
57.35 |
3.80 |
14.6 |
Iceberg |
70-95 |
03/13/2023 |
| Including |
55.75 |
56.70 |
0.95 |
54.5 |
Iceberg |
70-95 |
03/13/2023 |
| NFGC-23-1120 |
63.20 |
93.05 |
29.85 |
49.65 |
Iceberg |
70-95 |
03/13/2023 |
| Including |
63.70 |
64.75 |
1.05 |
56.11 |
Iceberg |
70-95 |
03/13/2023 |
| Including |
65.75 |
66.95 |
1.20 |
19.63 |
Iceberg |
70-95 |
03/13/2023 |
| Including |
67.55 |
68.55 |
1.00 |
31.9 |
Iceberg |
70-95 |
03/13/2023 |
| Including |
73.10 |
77.45 |
4.35 |
183.28 |
Iceberg |
70-95 |
03/13/2023 |
| Including |
78.85 |
80.35 |
1.50 |
31.13 |
Iceberg |
70-95 |
03/13/2023 |
| Including |
83.75 |
84.55 |
0.80 |
14.65 |
Iceberg |
70-95 |
03/13/2023 |
| Including |
85.55 |
86.40 |
0.85 |
25.5 |
Iceberg |
70-95 |
03/13/2023 |
| Including |
90.10 |
93.05 |
2.95 |
158 |
Iceberg |
70-95 |
03/13/2023 |
| NFGC-23-1141 |
109.25 |
129.60 |
20.35 |
6.88 |
Iceberg |
40-70 |
04/04/2023 |
| Including |
117.00 |
117.60 |
0.60 |
10.65 |
Iceberg |
40-70 |
04/04/2023 |
| Including |
121.40 |
121.80 |
0.40 |
73.1 |
Iceberg |
40-70 |
04/04/2023 |
| Including |
126.10 |
126.55 |
0.45 |
25.7 |
Iceberg |
40-70 |
04/04/2023 |
| Including |
128.60 |
129.60 |
1.00 |
66.3 |
Iceberg |
40-70 |
04/04/2023 |
| NFGC-23-1141 |
138.85 |
149.50 |
10.65 |
35.58 |
Iceberg |
40-70 |
04/04/2023 |
| Including |
138.85 |
140.35 |
1.50 |
232.4 |
Iceberg |
40-70 |
04/04/2023 |
| Including |
143.35 |
144.10 |
0.75 |
20.2 |
Iceberg |
40-70 |
04/04/2023 |
| NFGC-23-1141 |
205.35 |
212.00 |
6.65 |
10.47 |
Iceberg |
10-40 |
04/04/2023 |
| Including |
206.00 |
206.70 |
0.70 |
32 |
Iceberg |
10-40 |
04/04/2023 |
| Including |
209.50 |
211.10 |
1.60 |
24.55 |
Iceberg |
10-40 |
04/04/2023 |
| NFGC-23-1235 |
103.00 |
116.35 |
13.35 |
7.56 |
Iceberg East |
70-95 |
02/14/2024 |
| Including |
105.70 |
106.50 |
0.80 |
91.75 |
Iceberg East |
70-95 |
02/14/2024 |
| NFGC-23-1261A |
237.55 |
247.00 |
9.45 |
25.98 |
Iceberg |
40-70 |
06/08/2023 |
| Including |
237.55 |
238.50 |
0.95 |
10.11 |
Iceberg |
40-70 |
06/08/2023 |
| Including |
239.80 |
240.40 |
0.60 |
372.37 |
Iceberg |
40-70 |
06/08/2023 |
| NFGC-23-1274 |
80.70 |
88.25 |
7.55 |
15.45 |
Iceberg East |
70-95 |
06/28/2023 |
| Including |
81.35 |
84.20 |
2.85 |
28 |
Iceberg East |
70-95 |
06/28/2023 |
| Including |
87.30 |
88.25 |
0.95 |
29.6 |
Iceberg East |
70-95 |
06/28/2023 |
| NFGC-23-1306 |
141.95 |
146.75 |
4.80 |
33.07 |
Iceberg |
40-70 |
07/05/2023 |
| Including |
141.95 |
142.90 |
0.95 |
160.5 |
Iceberg |
40-70 |
07/05/2023 |
| NFGC-23-1306 |
153.15 |
157.45 |
4.30 |
39.23 |
Iceberg |
70-95 |
07/05/2023 |
| Including |
153.15 |
154.05 |
0.90 |
175 |
Iceberg |
70-95 |
07/05/2023 |
| NFGC-23-1306 |
162.00 |
188.25 |
26.25 |
1.26 |
Iceberg |
40-70 |
07/05/2023 |
| Including |
187.60 |
188.25 |
0.65 |
11.5 |
Iceberg |
40-70 |
07/05/2023 |
| NFGC-23-1306 |
204.15 |
224.40 |
20.25 |
9.72 |
Iceberg |
40-70 |
07/05/2023 |
| Including |
204.15 |
205.50 |
1.35 |
130.48 |
Iceberg |
40-70 |
07/05/2023 |
| NFGC-23-1312 |
94.75 |
122.55 |
27.80 |
14.54 |
Iceberg |
70-95 |
07/05/2023 |
| Including |
99.80 |
101.05 |
1.25 |
214.4 |
Iceberg |
70-95 |
07/05/2023 |
| Including |
104.95 |
105.95 |
1.00 |
66 |
Iceberg |
70-95 |
07/05/2023 |
| Including |
120.10 |
120.50 |
0.40 |
36.2 |
Iceberg |
70-95 |
07/05/2023 |
| NFGC-23-1312 |
127.30 |
132.60 |
5.30 |
34.59 |
Iceberg |
70-95 |
07/05/2023 |
| Including |
127.85 |
128.95 |
1.10 |
161.14 |
Iceberg |
70-95 |
07/05/2023 |
| NFGC-23-1475 |
62.00 |
92.55 |
30.55 |
4.28 |
Iceberg East |
10-40 |
09/13/2023 |
| Including |
66.00 |
66.45 |
0.45 |
15.85 |
Iceberg East |
10-40 |
09/13/2023 |
| Including |
67.10 |
67.80 |
0.70 |
19 |
Iceberg East |
10-40 |
09/13/2023 |
| Including |
70.10 |
71.05 |
0.95 |
76.46 |
Iceberg East |
10-40 |
09/13/2023 |
| NFGC-23-1541 |
85.85 |
96.40 |
10.55 |
46.81 |
Iceberg East |
70-95 |
09/13/2023 |
| Including |
88.55 |
89.20 |
0.65 |
20.13 |
Iceberg East |
70-95 |
09/13/2023 |
| Including |
90.45 |
94.85 |
4.40 |
104.01 |
Iceberg East |
70-95 |
09/13/2023 |
| NFGC-23-1625 |
33.45 |
47.70 |
14.25 |
5.55 |
Iceberg East |
40-70 |
02/14/2024 |
| Including |
38.15 |
39.15 |
1.00 |
48.6 |
Iceberg East |
40-70 |
02/14/2024 |
| NFGC-23-1746 |
50.80 |
58.15 |
7.35 |
42.8 |
Iceberg |
40-70 |
03/13/2024 |
| Including |
51.60 |
53.40 |
1.80 |
172.02 |
Iceberg |
40-70 |
03/13/2024 |
| NFGC-23-1914 |
29.00 |
41.80 |
12.80 |
13.86 |
Iceberg |
70-95 |
03/13/2024 |
| Including |
31.60 |
32.20 |
0.60 |
27.9 |
Iceberg |
70-95 |
03/13/2024 |
| Including |
33.85 |
35.40 |
1.55 |
69.1 |
Iceberg |
70-95 |
03/13/2024 |
| Including |
40.50 |
41.00 |
0.50 |
61.4 |
Iceberg |
40-70 |
03/13/2024 |
| NFGC-23-1914 |
51.25 |
53.65 |
2.40 |
14.69 |
Iceberg |
40-70 |
03/13/2024 |
| Including |
52.20 |
53.00 |
0.80 |
42.3 |
Iceberg |
40-70 |
03/13/2024 |
Infill veining in secondary structures
with multiple orientations crosscutting the primary host structures are commonly observed in drill core which could result in additional
uncertainty in true width. As of March 1, 2023, composite intervals reported carry a minimum weighted average of 1 g/t Au diluted
over a minimum core length of 2m with a maximum of 4m consecutive dilution when at depths above 200m vertical depth and 2m consecutive
dilution when below 200m vertical depth. Prior to this date, all composites allowed for 2m consecutive dilution. Included high-grade
intercepts are reported as any consecutive interval with grades greater than 10 g/t Au. Grades have not been capped in the averaging
and intervals are reported as drill thickness.
Management’s Discussion
and Analysis
For
the three months ended March 31, 2024 and 2023
| Hole No. |
Azimuth (°) |
Dip (°) |
Length (m) |
UTM E |
UTM N |
Prospect |
| NFGC-23-1120 |
300 |
-45 |
191 |
658443 |
5427794 |
Iceberg |
| NFGC-23-1141 |
300 |
-45 |
297 |
658488 |
5427769 |
Iceberg |
| NFGC-23-1235 |
300 |
-45 |
198 |
658680 |
5427948 |
Iceberg East |
| NFGC-23-1261A |
297 |
-45.5 |
395 |
658447 |
5427649 |
Iceberg |
| NFGC-23-1274 |
300 |
-45 |
407 |
658750 |
5428022 |
Iceberg East |
| NFGC-23-1306 |
300 |
-45 |
290 |
658505 |
5427759 |
Iceberg |
| NFGC-23-1312 |
300 |
-45 |
260 |
658527 |
5427805 |
Iceberg |
| NFGC-23-1475 |
220 |
-67 |
180 |
658681 |
5428034 |
Iceberg East |
| NFGC-23-1541 |
300 |
-62 |
150 |
658615 |
5427931 |
Iceberg East |
| NFGC-23-1625 |
300 |
-73 |
83 |
658824 |
5428123 |
Iceberg East |
| NFGC-23-1746 |
119 |
-45 |
107 |
658456 |
5427887 |
Iceberg |
| NFGC-23-1914 |
16 |
-45 |
86 |
658534 |
5427895 |
Iceberg |
The latest drilling results from Iceberg are shown
on the plan map, long-section, and cross-section below:
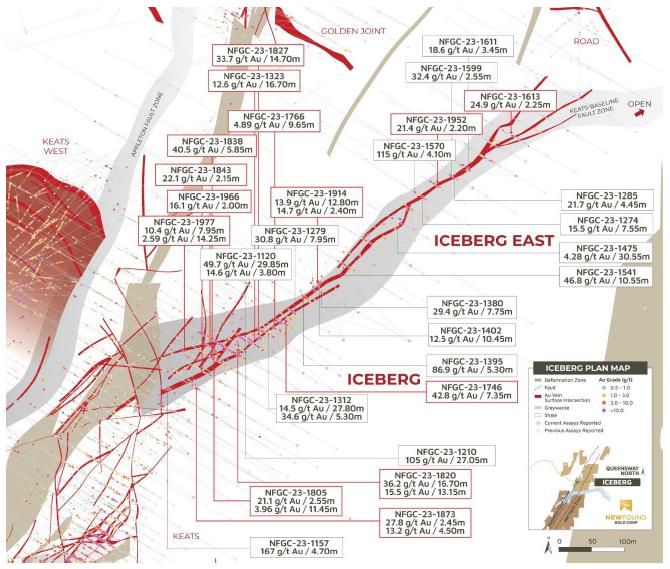
Queensway Project – Plan view map of
Iceberg area (March 13, 2024)
Management’s Discussion and Analysis
For the three months ended March 31, 2024 and 2023
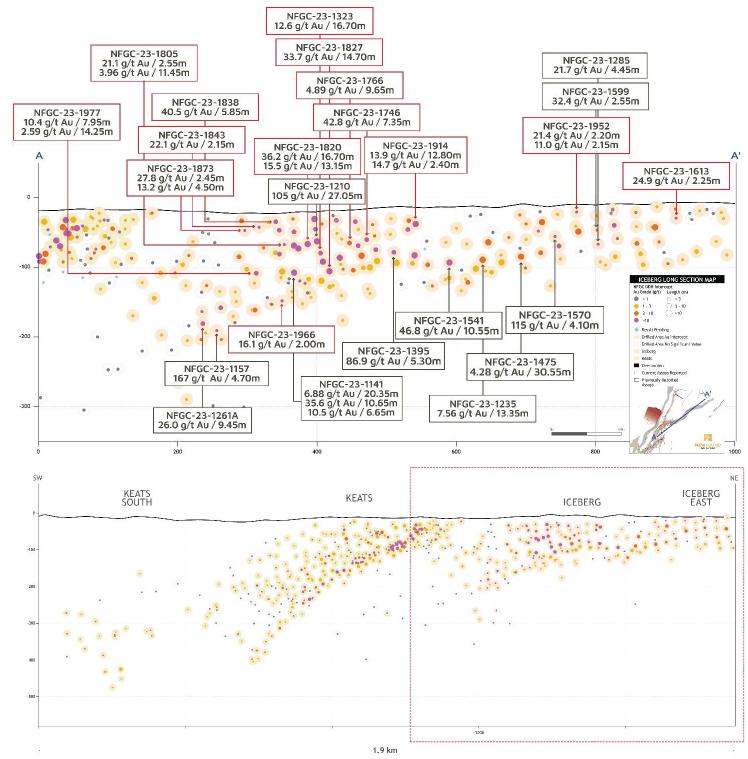
Queensway Project – Long section of
Keats Main, Iceberg, and Iceberg East zones, looking northwest (March 13, 2024)
Management’s Discussion and Analysis
For the three months ended March 31, 2024 and 2023

Queensway Project – Keats West to Iceberg
cross-section view, +/-12.5m, looking northwest (August 9, 2023)
Keats
North Drilling
Reconnaissance drilling
working in the highly prospective region between the Keats Main and Golden Joint zones (“Keats North”) intersected significant
mineralization, now named the “515 Zone”, returning initial intercepts of 9.21 g/t Au over 2.15m and 43.9 g/t Au over 3.85m
in NFGC-22-515 (reported on April 13, 2022) approximately 440m north of the Keats Main Zone. Following this discovery, reconnaissance
drilling in this region identified additional near-surface high-grade gold mineralization with the intercept of 275 g/t Au over 2.15 m
in NFGC-22-538 (reported on May 4, 2022) which occurs at a vertical depth of 22m adjacent to the AFZ and is approximately 65m north of
the Keats Zone.
On August 2, 2022, the
company announced results from continued exploration in the Keats North target region defining multiple high-grade veins that define a
corridor over a strike length of approximately 630m x 150m wide linking up the north end of Keats with the 515 Zone. A selection of noteworthy
intervals in these veins are summarized in the table below.
Exploration drilling
throughout 2022 at the Keats North prospect successfully defined this complex network of gold-bearing veins and associated structures
to depths of up to 200m vertical. These significant intervals along with many others occur largely within and around the Umbra, Penumbra,
and Enigma structures, see figure below, however, others fall outside into new structural splays; these zones remain open at depth. Umbra
and Penumbra structures strike north-south and can be traced through the Keats North prospect and play an important role in concentrating
gold at Keats North and the northeast end of the Keats Main zone.
Deeper exploration drilling
will focus on targeting these key structures at depth.
All previous and 2024
press releases can be found through SEDAR+.
Management’s Discussion and Analysis
For the three months ended March 31, 2024 and 2023
Highlighted assay values and drill hole
locations from Keats North drilling are shown in the tables below:
| Hole No. |
From (m) |
To (m) |
Length (m) |
Au (g/t) |
Zone |
True Width (%) |
Date Released |
| NFGC-22-515 |
209.00 |
212.85 |
3.85 |
43.93 |
Keats N |
10-40 |
04/13/2022 |
| Including |
209.00 |
210.65 |
1.65 |
75.97 |
Keats N |
10-40 |
04/13/2022 |
| Including |
211.35 |
212.35 |
1.00 |
43.1 |
Keats N |
10-40 |
04/13/2022 |
| NFGC-22-538 |
32.45 |
34.60 |
2.15 |
275.04 |
Keats N |
40-70 |
05/04/2022 |
| Including |
33.10 |
33.90 |
0.80 |
738 |
Keats N |
40-70 |
05/04/2022 |
| NFGC-22-580 |
52.00 |
54.20 |
2.20 |
24.05 |
Keats N |
70-95 |
08/02/2022 |
| Including |
53.20 |
53.70 |
0.50 |
105.5 |
Keats N |
70-95 |
08/02/2022 |
| NFGC-22-586 |
48.00 |
50.00 |
2.00 |
40.59 |
Keats N |
40-70 |
08/02/2022 |
| Including |
49.45 |
50.00 |
0.55 |
147.5 |
Keats N |
40-70 |
08/02/2022 |
| NFGC-22-665 |
46.60 |
52.35 |
5.75 |
18.95 |
Keats N |
40-70 |
09/01/2022 |
| Including |
48.25 |
48.85 |
0.60 |
162.5 |
Keats N |
40-70 |
09/01/2022 |
| NFGC-22-728 |
249.20 |
251.20 |
2.00 |
116.93 |
Keats N |
40-70 |
12/05/2022 |
| Including |
250.15 |
250.80 |
0.65 |
358.07 |
Keats N |
40-70 |
12/05/2022 |
Infill veining in secondary structures with
multiple orientations crosscutting the primary host structures are commonly observed in drill core which could result in additional uncertainty
in true width. As of March 1, 2023, composite intervals reported carry a minimum weighted average of 1 g/t Au diluted over a minimum core
length of 2m with a maximum of 4m consecutive dilution when at depths above 200m vertical depth and 2m consecutive dilution when below
200m vertical depth. Prior to this date, all composites allowed for 2m consecutive dilution. Prior to February 18, 2022, all composite
intervals were selected visually. Included high-grade intercepts are reported as any consecutive interval with grades greater than 10
g/t Au. Grades have not been capped in the averaging and intervals are reported as drill thickness.
| Hole No. |
Azimuth (°) |
Dip (°) |
Length (m) |
UTM E |
UTM N |
Prospect |
| NFGC-22-515 |
299 |
-45.5 |
281 |
658344 |
5428026 |
Keats North |
| NFGC-22-538 |
300 |
-45 |
386 |
658193 |
5427710 |
Keats North |
| NFGC-22-580 |
300 |
-45 |
110 |
658188 |
5427698 |
Keats North |
| NFGC-22-586 |
300 |
-45 |
332 |
658162 |
5427669 |
Keats North |
| NFGC-22-665 |
300 |
-45 |
159 |
658226 |
5427762 |
Keats North |
| NFGC-22-728 |
300 |
-45 |
260 |
658237 |
5427597 |
Keats North |
A selection of highlight drilling results
is shown in the inclined 3-D image below for Keats North:
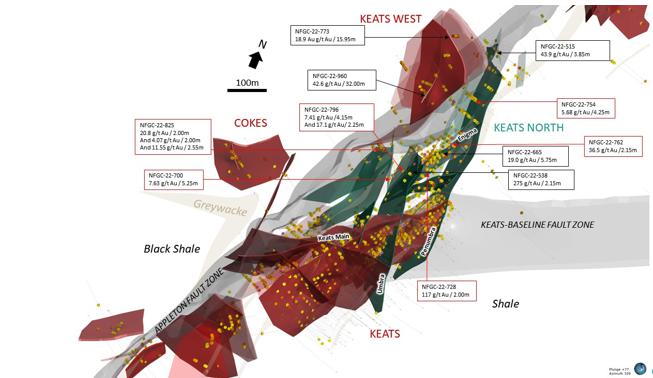
Queensway Project
– Keats, Keats West, and Keats North inclined 3-D plan view map (December 5, 2022)
Management’s Discussion and Analysis
For the three months ended March 31, 2024 and 2023
Keats West Drilling
A combination of reconnaissance drilling and targeted
drilling looking for the potential extension of the Penumbra vein in the hangingwall to the AFZ (west side) led to the discovery of the
Keats West Zone intersecting significant mineralization in NFGC-22-533 reporting 8.70 g/t Au over 6.75m (reported on May, 4, 2022) followed
by 17.9 g/t Au over 4.20m in NFGC-22-681 and 10.4 g/t Au over 10.50m in NFGC-22-686 (reported on September 27, 2022).
Ongoing exploration drilling at Keats West has
uncovered a significant structure that is interpreted to be a thrust fault that dips gently to the south-southwest and hosts both low
and high-grade gold mineralization over a considerable thickness with cumulative widths ranging from 10-50m. This fault zone occurs on
the west side of the AFZ, is hosted by an interbedded sequence of black siltstone, siltstone, and greywacke, and consists of a series
of stacked veins that contain the gold mineralization and represents an important new discovery for the Company. A selection of significant
intervals are presented in the table below.
The mineralization style is epizonal and typical
of the other gold prospects found along this segment of the AFZ. Drilling has quickly expanded this system now having intersected significant
mineralization over an area that is 315m wide x 305m long, with mineralization starting at surface. All intercepts to date occur above
130m vertical depth and ongoing step-out and infill drilling continue to exhibit good continuity of both low and high-grade mineralization
within the host structure.
Q1
2024 results from a step-out drilling program into the westernmost extent of the Keats West zone, intercepted significant gold
mineralization. All three holes were reported on February 22, 2024 (see a selection of highlights in the table below) and hit the
structure shallowly starting between 2m and 35m vertical depth, indicating strong near-surface continuity of high-grade gold mineralization
over a strike length of 315m at Keats West.
Additional infill drilling at Keats West is planned
to better define the continuity of grade and the controls on the gold mineralization within the host fault in addition to deeper drilling
utilizing the seismic data.
Management’s Discussion and Analysis
For the three months ended March 31, 2024 and 2023
2024 assay results have
been reported in press releases dated February 22, 2024. All previous and 2024 press releases can be found through SEDAR+.
Highlighted assay values and drill hole locations
from Keats West drilling are shown in the tables below:
| Hole No. |
From (m) |
To (m) |
Length (m) |
Au (g/t) |
Zone |
True Width (%) |
Date Released |
| NFGC-22-686 |
100.50 |
111.00 |
10.50 |
10.36 |
Keats W |
70-95 |
09/27/2022 |
| Including |
101.30 |
102.55 |
1.25 |
43.84 |
Keats W |
70-95 |
09/27/2022 |
| Including |
103.05 |
103.45 |
0.40 |
88.2 |
Keats W |
70-95 |
09/27/2022 |
| NFGC-22-833 |
11.00 |
22.40 |
11.40 |
3.25 |
Keats W |
40-70 |
03/21/2023 |
| NFGC-22-833 |
30.00 |
65.00 |
35.00 |
2.41 |
Keats W |
40-70 |
03/21/2023 |
| NFGC-22-833 |
74.00 |
91.35 |
17.35 |
1.61 |
Keats W |
40-70 |
03/21/2023 |
| NFGC-22-945 |
78.10 |
100.60 |
22.50 |
10.05 |
Keats W |
70-95 |
03/21/2023 |
| Including |
88.15 |
88.80 |
0.65 |
12.55 |
Keats W |
70-95 |
03/21/2023 |
| Including |
90.00 |
91.00 |
1.00 |
12.95 |
Keats W |
70-95 |
03/21/2023 |
| Including |
93.70 |
94.85 |
1.15 |
14.24 |
Keats W |
70-95 |
03/21/2023 |
| Including |
95.65 |
96.00 |
0.35 |
16.1 |
Keats W |
70-95 |
03/21/2023 |
| Including |
99.95 |
100.60 |
0.65 |
221 |
Keats W |
70-95 |
03/21/2023 |
| NFGC-22-960 |
145.00 |
177.00 |
32.00 |
42.64 |
Keats W |
10-40 |
11/28/2022 |
| Including |
151.35 |
152.30 |
0.95 |
14.05 |
Keats W |
10-40 |
11/28/2022 |
| Including |
156.65 |
157.55 |
0.90 |
86.6 |
Keats W |
10-40 |
11/28/2022 |
| Including |
159.40 |
161.30 |
1.90 |
24.06 |
Keats W |
10-40 |
11/28/2022 |
| Including |
162.05 |
162.95 |
0.90 |
29.68 |
Keats W |
10-40 |
11/28/2022 |
| Including |
163.75 |
164.35 |
0.60 |
24.5 |
Keats W |
10-40 |
11/28/2022 |
| Including |
165.70 |
167.00 |
1.30 |
16.26 |
Keats W |
10-40 |
11/28/2022 |
| Including |
170.50 |
173.10 |
2.60 |
121.57 |
Keats W |
10-40 |
11/28/2022 |
| Including |
173.70 |
177.00 |
3.30 |
241.54 |
Keats W |
10-40 |
11/28/2022 |
| NFGC-22-1010 |
30.80 |
34.45 |
3.65 |
2.29 |
Keats W |
40-70 |
07/19/2023 |
| NFGC-22-1010 |
46.00 |
56.25 |
10.25 |
1.54 |
Keats W |
40-70 |
07/19/2023 |
| Including |
55.75 |
56.25 |
0.50 |
10.7 |
Keats W |
40-70 |
07/19/2023 |
| NFGC-22-1010 |
96.85 |
140.25 |
43.40 |
4.43 |
Keats W |
40-70 |
07/19/2023 |
| Including |
96.85 |
98.00 |
1.15 |
25.83 |
Keats W |
40-70 |
07/19/2023 |
| Including |
102.80 |
103.75 |
0.95 |
16.4 |
Keats W |
40-70 |
07/19/2023 |
| Including |
111.00 |
111.50 |
0.50 |
10.5 |
Keats W |
40-70 |
07/19/2023 |
| Including |
126.55 |
127.55 |
1.00 |
69.3 |
Keats W |
40-70 |
07/19/2023 |
| NFGC-22-1027 |
6.70 |
18.40 |
11.70 |
5.05 |
Keats W |
70-95 |
07/19/2023 |
| Including |
15.80 |
17.05 |
1.25 |
13.79 |
Keats W |
70-95 |
07/19/2023 |
| NFGC-22-1028 |
52.00 |
81.45 |
29.45 |
2.47 |
Keats W |
70-95 |
12/06/2023 |
| Including |
64.05 |
65.65 |
1.60 |
15.84 |
Keats W |
70-95 |
12/06/2023 |
| NFGC-22-1028 |
86.00 |
107.30 |
21.30 |
1.39 |
Keats W |
70-95 |
12/06/2023 |
| NFGC-22-1028 |
166.80 |
169.50 |
2.70 |
66 |
Keats W |
70-95 |
12/06/2023 |
| Including |
167.85 |
168.50 |
0.65 |
271.01 |
Keats W |
70-95 |
12/06/2023 |
| NFGC-22-1040 |
40.40 |
63.30 |
22.90 |
17.23 |
Keats W |
70-95 |
04/25/2023 |
| Including |
45.85 |
47.45 |
1.60 |
162.12 |
Keats W |
70-95 |
04/25/2023 |
| Including |
49.45 |
49.95 |
0.50 |
18.82 |
Keats W |
70-95 |
04/25/2023 |
| Including |
58.50 |
59.00 |
0.50 |
161.66 |
Keats W |
70-95 |
04/25/2023 |
| Including |
61.95 |
62.65 |
0.70 |
14.18 |
Keats W |
70-95 |
04/25/2023 |
| NFGC-22-1040 |
69.65 |
88.05 |
18.40 |
12 |
Keats W |
70-95 |
04/25/2023 |
| Including |
71.25 |
72.10 |
0.85 |
12 |
Keats W |
70-95 |
04/25/2023 |
| Including |
72.55 |
73.30 |
0.75 |
57.67 |
Keats W |
70-95 |
04/25/2023 |
| Including |
80.10 |
80.50 |
0.40 |
93.75 |
Keats W |
70-95 |
04/25/2023 |
| Including |
82.50 |
82.85 |
0.35 |
53.36 |
Keats W |
70-95 |
04/25/2023 |
| Including |
85.75 |
87.30 |
1.55 |
47.87 |
Keats W |
70-95 |
04/25/2023 |
| NFGC-23-1129 |
14.95 |
57.30 |
42.35 |
3.29 |
Keats W |
70-95 |
09/27/2023 |
| Including |
31.15 |
32.00 |
0.85 |
11.35 |
Keats W |
70-95 |
09/27/2023 |
| Including |
34.00 |
35.00 |
1.00 |
11.1 |
Keats W |
70-95 |
09/27/2023 |
| NFGC-23-1155 |
55.55 |
90.30 |
34.75 |
1.53 |
Keats W |
10-40 |
04/25/2023 |
| NFGC-23-1708 |
5.70 |
49.50 |
43.80 |
3.2 |
Keats W |
70-95 |
02/22/2024 |
| Including |
12.70 |
13.50 |
0.80 |
12.25 |
Keats W |
70-95 |
02/22/2024 |
| Including |
34.00 |
35.20 |
1.20 |
34.47 |
Keats W |
70-95 |
02/22/2024 |
| Including |
37.50 |
38.05 |
0.55 |
12.1 |
Keats W |
70-95 |
02/22/2024 |
| Including |
49.15 |
49.50 |
0.35 |
25.4 |
Keats W |
70-95 |
02/22/2024 |
| NFGC-23-1765 |
3.30 |
26.50 |
23.20 |
3.49 |
Keats W |
70-95 |
02/22/2024 |
| Including |
12.90 |
13.35 |
0.45 |
10.5 |
Keats W |
70-95 |
02/22/2024 |
| NFGC-23-1765 |
14.30 |
15.00 |
0.70 |
15.95 |
Keats W |
70-95 |
02/22/2024 |
Management’s Discussion and Analysis
For the three months ended March 31, 2024 and 2023
Infill veining in secondary structures with
multiple orientations crosscutting the primary host structures are commonly observed in drill core which could result in additional uncertainty
in true width. As of March 1, 2023, composite intervals reported carry a minimum weighted average of 1 g/t Au diluted over a minimum
core length of 2m with a maximum of 4m consecutive dilution when at depths above 200m vertical depth and 2m consecutive dilution when
below 200m vertical depth. Prior to this date, all composites allowed for 2m consecutive dilution. Included high-grade intercepts are
reported as any consecutive interval with grades greater than 10 g/t Au. Grades have not been capped in the averaging and intervals are
reported as drill thickness.
| Hole No. |
Azimuth (°) |
Dip (°) |
Length (m) |
UTM E |
UTM N |
Prospect |
| NFGC-22-686 |
70 |
-60 |
206 |
658053 |
5427905 |
Keats West |
| NFGC-22-833 |
120 |
-45.5 |
221 |
658033 |
5428032 |
Keats West |
| NFGC-22-945 |
58 |
-47 |
237 |
657949 |
5427794 |
Keats West |
| NFGC-22-960 |
120 |
-45 |
378 |
657980 |
5427948 |
Keats West |
| NFGC-22-1010 |
115 |
-45 |
309 |
657920 |
5428041 |
Keats West |
| NFGC-22-1027 |
115 |
-45 |
210 |
657876 |
5428065 |
Keats West |
| NFGC-22-1028 |
49 |
-53 |
227 |
657992 |
5427768 |
Keats West |
| NFGC-22-1040 |
56 |
-53 |
206 |
657952 |
5427847 |
Keats West |
| NFGC-23-1129 |
357 |
-45 |
170 |
657989 |
5427886 |
Keats West |
| NFGC-23-1155 |
203 |
-61 |
179 |
658124 |
5427975 |
Keats West |
| NFGC-23-1708 |
55 |
-55 |
86 |
658098 |
5428023 |
Keats West |
| NFGC-23-1765 |
65 |
-67 |
68 |
657879 |
5428036 |
Keats West |
The latest drilling results for Keats West are
shown in the images below:
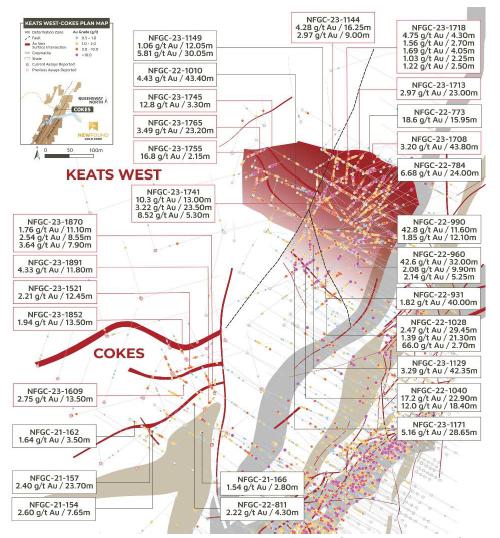
Queensway Project
– Keats West area plan map (February 22, 2024)
Management’s Discussion and Analysis
For the three months ended March 31, 2024 and 2023
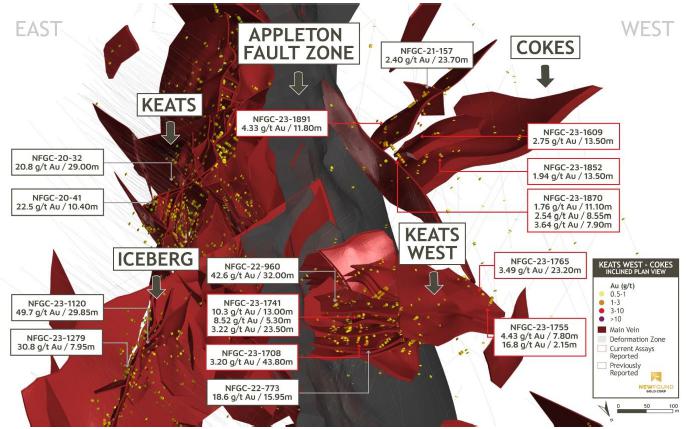
Queensway
Project – Keats West inclined 3-D view with main veins
plotted only, looking south (February 22, 2024)

Queensway Project – Keats West cross-section
(+/- 25m, looking southeast). (December 6, 2023)
Management’s Discussion and Analysis
For the three months ended March 31, 2024 and 2023
Cokes Drilling
At Cokes, a historic showing located 300m southwest
of Keats West on the west side of the AFZ, the Company completed a first-pass program in 2021 which returned the highlight interval of
2.40 g/t over 23.70m in NFGC-21-157. Recently completed follow-up drilling successfully expanded the mineralized zone through a combination
of grid and targeted drilling.
This program defined a low-angle and south-dipping
gold mineralized structure that is very similar in orientation to the nearby Keats West Zone. Several significant intervals were received
and are summarized in the table below, that together span a domain 65m wide by 90m long.
Additional drilling is required to understand
the mineralizing controls in this area and to expand on this new discovery.
2024 assay results have
been reported in press releases dated February 22, 2024. All previous and 2024 press releases can be found through SEDAR+.
Highlighted assay values and drill hole locations
from Cokes drilling are shown in the tables below:
| Hole No. |
From (m) |
To (m) |
Length (m) |
Au (g/t) |
Zone |
True Width (%) |
Date Released |
| NFGC-21-157 |
10.00 |
33.70 |
23.70 |
2.4 |
Cokes |
40-70 |
07/06/2021 |
| Including |
20.60 |
24.75 |
4.15 |
6.43 |
Cokes |
40-70 |
07/06/2021 |
| NFGC-21-157 |
55.20 |
68.35 |
13.15 |
1.69 |
Cokes |
Unknown |
07/06/2021 |
| NFGC-21-157 |
105.00 |
109.50 |
4.50 |
2.04 |
Cokes |
10-40 |
07/06/2021 |
| NFGC-23-1521 |
38.60 |
51.05 |
12.45 |
2.21 |
Cokes |
40-70 |
02/22/2024 |
| NFGC-23-1521 |
56.25 |
62.00 |
5.75 |
1.37 |
Cokes |
40-70 |
02/22/2024 |
| NFGC-23-1609 |
39.90 |
53.40 |
13.50 |
2.75 |
Cokes |
10-40 |
02/22/2024 |
| NFGC-23-1852 |
17.10 |
30.60 |
13.50 |
1.94 |
Cokes |
70-95 |
02/22/2024 |
| NFGC-23-1870 |
15.45 |
26.55 |
11.10 |
1.76 |
Cokes |
Unknown |
02/22/2024 |
| NFGC-23-1870 |
36.60 |
45.15 |
8.55 |
2.54 |
Cokes |
Unknown |
02/22/2024 |
| NFGC-23-1870 |
49.20 |
57.10 |
7.90 |
3.64 |
Cokes |
70-95 |
02/22/2024 |
| NFGC-23-1891 |
35.60 |
47.40 |
11.80 |
4.33 |
Cokes |
70-95 |
02/22/2024 |
Infill veining in secondary structures with
multiple orientations crosscutting the primary host structures are commonly observed in drill core which could result in additional uncertainty
in true width. As of March 1, 2023, composite intervals reported carry a minimum weighted average of 1 g/t Au diluted over a minimum
core length of 2m with a maximum of 4m consecutive dilution when at depths above 200m vertical depth and 2m consecutive dilution when
below 200m vertical depth. Prior to this date, all composites allowed for 2m consecutive dilution. Prior to February 18, 2022, all
composite intervals were selected visually. Included high-grade intercepts are reported as any consecutive interval with grades greater
than 10 g/t Au. Grades have not been capped in the averaging and intervals are reported as drill thickness.
| Hole No. |
Azimuth (°) |
Dip (°) |
Length (m) |
UTM E |
UTM N |
Prospect |
| NFGC-21-157 |
120 |
-45 |
167 |
657642 |
5427535 |
Cokes |
| NFGC-23-1521 |
75 |
-45 |
251 |
657706 |
5427645 |
Cokes |
| NFGC-23-1609 |
120 |
-49 |
200 |
657706 |
5427643 |
Cokes |
| NFGC-23-1870 |
334 |
-45 |
95 |
657792 |
5427603 |
Cokes |
| NFGC-23-1852 |
335 |
-45 |
87 |
657734 |
5427674 |
Cokes |
| NFGC-23-1891 |
37 |
-69 |
143 |
657772 |
5427571 |
Cokes |
Management’s Discussion and Analysis
For the three months ended March 31, 2024 and 2023
Lotto Zone Drilling
The Company has reported several significant gold
assay intervals from the Lotto Zone starting with its first drill hole NFGC-20-17 reporting 16.3 g/t Au over 2.20m, 41.2 g/t Au over 4.75m,
and a third interval of 25.4 g/t Au over 5.15m (reported on October 2, 2020). Following this result, the Lotto Main vein has been
systematically tested and expanded by subsequent highlight intercepts summarized in the table below.
The Lotto Zone is comprised of a north-south striking,
steeply east-dipping vein (“Lotto Main Vein”) located approximately 200m east of the AFZ and drilling to date on the Lotto
Main Vein has confirmed good continuity of a high-grade lens that is interpreted to plunge steeply to the northeast in addition to defining
new corridors of high-grade gold contained within the vein.
Continued exploration drilling has expanded the
Lotto Main Vein high-grade gold domain to 225m vertical depth and a strike length of 220m. This vein has been intersected at depths of
up to 325m vertical and remains open at depth and along strike.
Other veins of note occur between the Lotto Main
Vein and the AFZ in a region known as the Lotto Footwall (FW) these include “Sunday” and “Tuesday” veins. A selection
of highlight intervals is summarized in the table below.
In 2024, utilizing the seismic data, exploration
will continue to test the down-dip extension of the Lotto structure.
2024 assay results have
been reported in press releases dated April 17, 2024. All previous and 2024 press releases can be found through SEDAR+.
Highlighted assay values and drill hole locations
from Lotto drilling are shown in the tables below:
| Hole No. |
From (m) |
To (m) |
Length (m) |
Au (g/t |
Zone |
True Width (%) |
Date Released |
| NFGC-20-17 |
29.80 |
32.00 |
2.20 |
16.3 |
Lotto Main |
40-70 |
01/14/2021 |
| NFGC-20-17 |
35.25 |
40.00 |
4.75 |
41.2 |
Lotto Main |
40-70 |
10/02/2020 |
| Including |
35.25 |
36.90 |
1.65 |
108.7 |
Lotto Main |
40-70 |
10/02/2020 |
| NFGC-20-17 |
56.95 |
70.75 |
13.80 |
10.1 |
Lotto Main |
40-70 |
10/02/2020 |
| Including |
56.95 |
62.10 |
5.15 |
25.4 |
Lotto Main |
40-70 |
10/02/2020 |
| Including |
61.00 |
61.80 |
0.80 |
138.3 |
Lotto Main |
40-70 |
10/02/2020 |
| NFGC-20-44 |
238.55 |
245.05 |
6.50 |
18.1 |
Sunday |
70-95 |
01/14/2021 |
| Including |
242.10 |
245.05 |
2.95 |
38.7 |
Sunday |
70-95 |
01/14/2021 |
| NFGC-21-109 |
152.70 |
161.50 |
8.80 |
19.34 |
Lotto Main |
70-95 |
03/23/2021 |
| Including |
154.20 |
157.40 |
3.20 |
51.31 |
Lotto Main |
70-95 |
03/23/2021 |
| NFGC-21-201 |
196.65 |
208.15 |
11.50 |
150.28 |
Lotto Main |
70-95 |
06/23/2021 |
| Including |
197.25 |
198.85 |
1.60 |
30.17 |
Lotto Main |
70-95 |
06/23/2021 |
| Including |
205.00 |
207.45 |
2.45 |
683.14 |
Lotto Main |
70-95 |
06/23/2021 |
| NFGC-21-233 |
169.20 |
171.85 |
2.65 |
111.36 |
Lotto Main |
40-70 |
09/08/2021 |
| NFGC-21-311 |
294.65 |
297.45 |
2.80 |
76.81 |
Lotto Main |
70-95 |
09/08/2021 |
| Including |
294.65 |
296.55 |
1.90 |
112.51 |
Lotto Main |
70-95 |
09/08/2021 |
| NFGC-22-552 |
87.95 |
89.95 |
2.00 |
89.5 |
Tuesday |
70-95 |
06/08/2022 |
| Including |
88.35 |
88.75 |
0.40 |
442 |
Tuesday |
70-95 |
06/08/2022 |
| NFGC-22-673 |
206.15 |
210.00 |
3.85 |
151.87 |
Lotto Main |
10-40 |
09/13/2022 |
| Including |
206.15 |
208.90 |
2.75 |
211.71 |
Lotto Main |
10-40 |
09/13/2022 |
| NFGC-22-684 |
211.45 |
226.40 |
14.95 |
12.98 |
Lotto Main |
10-40 |
09/13/2022 |
| Including |
216.30 |
217.00 |
0.70 |
25.3 |
Lotto Main |
10-40 |
09/13/2022 |
| Including |
224.30 |
226.40 |
2.10 |
72.35 |
Lotto Main |
10-40 |
09/13/2022 |
Infill veining in secondary structures with
multiple orientations crosscutting the primary host structures are commonly observed in drill core which could result in additional uncertainty
in true width. As of March 1, 2023, composite intervals reported carry a minimum weighted average of 1 g/t Au diluted over a minimum
core length of 2m with a maximum of 4m consecutive dilution when at depths above 200m vertical depth and 2m consecutive dilution when
below 200m vertical depth. Prior to this date, all composites allowed for 2m consecutive dilution. Prior to February 18, 2022, all
composite intervals were selected visually. Included high-grade intercepts are reported as any consecutive interval with grades greater
than 10 g/t Au. Grades have not been capped in the averaging and intervals are reported as drill thickness.
Management’s Discussion and Analysis
For the three months ended March 31, 2024 and 2023
| Hole No. |
Azimuth (°) |
Dip (°) |
Length (m) |
UTM E |
UTM N |
| NFGC-20-17 |
300 |
-45 |
354 |
658931 |
5428990 |
| NFGC-20-44 |
300 |
-45 |
298 |
658956 |
5429030 |
| NFGC-21-89 |
300 |
-45 |
294 |
658968 |
5429052 |
| NFGC-21-109 |
300 |
-45 |
252 |
659012 |
5428912 |
| NFGC-21-201 |
300 |
-45 |
241 |
659058 |
5428890 |
| NFGC-21-233 |
298 |
-45.5 |
342 |
659024 |
5428935 |
| NFGC-21-311 |
299 |
-45.5 |
321 |
659107 |
5428914 |
| NFGC-22-552 |
300 |
-45 |
201 |
658833 |
5429014 |
| NFGC-22-673 |
263 |
-68 |
258 |
658990 |
5429097 |
| NFGC-22-684 |
258 |
-69 |
237 |
658983 |
5429072 |
Management’s Discussion and Analysis
For the three months ended March 31, 2024 and 2023
The latest results from the Lotto and Lotto North
zones are shown in the long section, plan map, and Lotto cross-section below:

Queensway Project – Golden Joint to
Honeypot area plan map (April 17, 2024)
Management’s Discussion and Analysis
For the three months ended March 31, 2024 and 2023
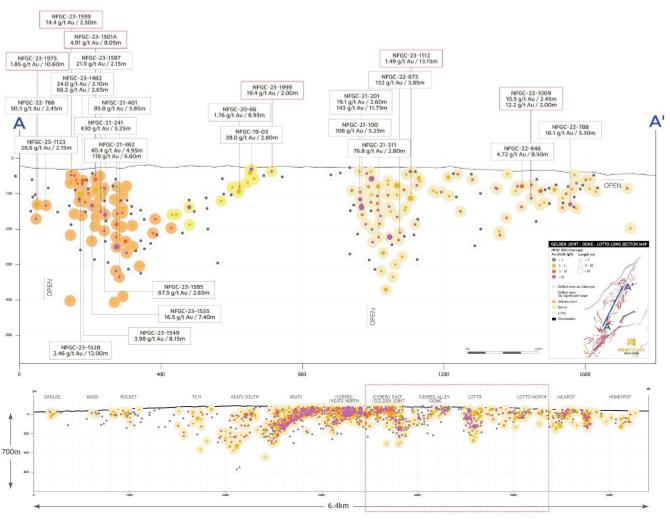
Queensway Project – Lotto- Lotto North
zones long section, looking northwest (April 17, 2024)
Management’s Discussion and Analysis
For the three months ended March 31, 2024 and 2023
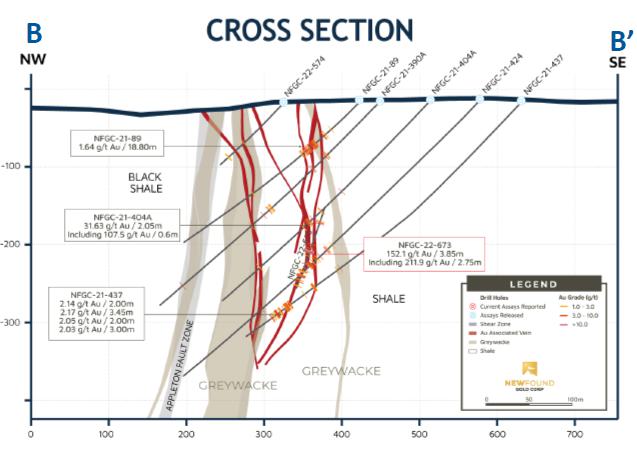
Queensway Project – Lotto cross-section,
+/- 12.5m, looking northeast (September 13, 2022)
Lotto North Drilling
The Lotto North prospect
is adjacent (north) to the Lotto prospect in QWN on the east side of the AFZ. Systematic grid drilling testing along the eastern side
of the AFZ north of Lotto identified this new gold-bearing structural zone in November 2022 first reporting 33.8 g/t Au over 2.35m
in NFGC-22-661, 37.4 g/t Au over 2.10m in NFGC-22-690 and 22.2 g/t Au over 2.20m in NFGC-22-717.
Continued exploration
drilling at Lotto North has defined a series of AFZ-typical epizonal-style gold-bearing veins contained within a north-south striking
brittle fault zone immediately north of the Lotto prospect. Drilling has expanded the Lotto North gold mineralization and host structure
over a strike length of 340m and to a vertical depth of 200m where it starts at surface. The Lotto North structure remains open at depth
and is likely the same structure that hosts the Lotto Main vein but has been offset by late faulting in this region. A selection of highlight
intervals can be found in the table below.
When
combined with the Lotto Main Zone, these high-grade gold-bearing structures have been drill-defined over a total strike length of 630m.
Exploration is currently paused at Lotto North while the focus in early 2024 is expanding the Lotto Main Zone at depth utilizing
the seismic data.
2024 assay results have been reported in press
releases dated April 17, 2024. All previous and 2024 press releases can be found through SEDAR+.
Management’s Discussion and Analysis
For the three months ended March 31, 2024 and 2023
Highlighted assay values and drill hole locations
from Lotto North drilling are shown in the tables below:
| Hole No. |
From (m) |
To (m) |
Length (m) |
Au (g/t) |
Zone |
True Width (%) |
Date Released |
| NFGC-22-646 |
71.80 |
80.30 |
8.50 |
4.72 |
Lotto N |
40-70 |
01/10/2023 |
| Including |
71.80 |
72.55 |
0.75 |
38.5 |
Lotto N |
40-70 |
01/10/2023 |
| NFGC-22-661 |
74.65 |
77.00 |
2.35 |
33.79 |
Lotto N |
40-70 |
11/02/2022 |
| Including |
74.95 |
75.30 |
0.35 |
225 |
Lotto N |
40-70 |
11/02/2022 |
| NFGC-22-690 |
69.45 |
71.55 |
2.10 |
37.36 |
Lotto N |
70-95 |
11/02/2022 |
| Including |
70.15 |
70.85 |
0.70 |
109 |
Lotto N |
70-95 |
11/02/2022 |
| NFGC-22-788 |
120.70 |
126.00 |
5.30 |
16.12 |
Lotto N |
40-70 |
01/10/2023 |
| Including |
122.00 |
123.55 |
1.55 |
49.63 |
Lotto N |
40-70 |
01/10/2023 |
| NFGC-22-895 |
174.65 |
179.20 |
4.55 |
7.2 |
Lotto N |
70-95 |
05/10/2023 |
| Including |
178.60 |
179.20 |
0.60 |
32.56 |
Lotto N |
70-95 |
05/10/2023 |
| NFGC-22-940 |
80.25 |
83.80 |
3.55 |
11.13 |
Lotto N |
70-95 |
05/10/2023 |
| Including |
82.15 |
82.80 |
0.65 |
51.7 |
Lotto N |
70-95 |
05/10/2023 |
Infill veining in secondary structures with
multiple orientations crosscutting the primary host structures are commonly observed in drill core which could result in additional uncertainty
in true width. As of March 1, 2023, composite intervals reported carry a minimum weighted average of 1 g/t Au diluted over a minimum
core length of 2m with a maximum of 4m consecutive dilution when at depths above 200m vertical depth and 2m consecutive dilution when
below 200m vertical depth. Prior to this date, all composites allowed for 2m consecutive dilution. Included high-grade intercepts are
reported as any consecutive interval with grades greater than 10 g/t Au. Grades have not been capped in the averaging and intervals are
reported as drill thickness.
| Hole No. |
Azimuth (°) |
Dip (°) |
Length (m) |
UTM E |
UTM N |
Prospect |
| NFGC-22-646 |
300 |
-45 |
429 |
659079 |
5429391 |
Lotto North |
| NFGC-22-661 |
285 |
-45 |
396 |
659079 |
5429391 |
Lotto North |
| NFGC-22-690 |
270 |
-42 |
264 |
659083 |
5429446 |
Lotto North |
| NFGC-22-788 |
240 |
-45 |
261 |
659068 |
5429627 |
Lotto North |
| NFGC-22-895 |
70 |
-45 |
243 |
658848 |
5429213 |
Lotto North |
| NFGC-22-940 |
90 |
-45 |
135 |
658986 |
5429329 |
Lotto North |
Jackpot Drilling
On June 22, 2023,
the Company announced the discovery of a new zone, “Jackpot” located 600m north of Lotto North and 280m east of the AFZ with
the discovery hole of 95.7 g/t Au over 3.25m in NFGC-23-1292 at 20m vertical depth. This hole was drilled as part of a targeted program
testing an area of interest between Lotto North and Everest.
Follow-up drilling designed
to efficiently determine the orientation of the vein for continued expansion intercepted multiple near-surface high-grade intervals occurring
at vertical depths ranging from 20-40m.
Continued expansion drilling has determined that
Jackpot is an east-west striking, steeply south-dipping high-grade structure with characteristics similar to the neighbouring Lotto Zone.
Additional results received indicate strong high-grade continuity and are presented in the table below.
Reported in Q1 were the outstanding assay results
that were received from initial drilling designed to determine the extent of the near-surface high-grade mineralization at Jackpot, increasing
the down-plunge extent of the high-grade domain to 155m. A selection of highlight intervals from this drilling can be found in the table
below.
The
Jackpot structure demonstrates strong continuity of gold mineralization that plunges to the southwest and covers an area averaging 75m
wide and 250m long that remains open at depth. Data from the seismic program will guide a deeper drilling program in the future.
2024 assay results have
been reported in press release dated April 17, 2024. All previous and 2024 press releases can be found through SEDAR+.
Management’s Discussion and Analysis
For the three months ended March 31, 2024 and 2023
Highlighted assay values
and drill hole locations from Jackpot drilling are shown in the tables below:
| Hole No. |
From (m) |
To (m) |
Length (m) |
Au (g/t) |
Zone |
True Width (%) |
Date Released |
| NFGC-23-1292 |
27.45 |
30.70 |
3.25 |
95.71 |
Jackpot |
70-95 |
06/22/2023 |
| Including |
27.45 |
28.30 |
0.85 |
352.58 |
Jackpot |
70-95 |
06/22/2023 |
| Including |
29.80 |
30.70 |
0.90 |
12.37 |
Jackpot |
70-95 |
06/22/2023 |
| NFGC-23-1292 |
202.55 |
212.55 |
10.00 |
1.88 |
Everest |
40-70 |
06/22/2023 |
| NFGC-23-1423 |
20.40 |
23.10 |
2.70 |
146.67 |
Jackpot |
70-95 |
09/05/2023 |
| Including |
20.40 |
22.50 |
2.10 |
188.1 |
Jackpot |
70-95 |
09/05/2023 |
| Including |
21.40 |
21.80 |
0.40 |
699 |
Jackpot |
70-95 |
09/05/2023 |
| Including |
22.10 |
22.50 |
0.40 |
241 |
Jackpot |
70-95 |
09/05/2023 |
| NFGC-23-1425 |
36.90 |
41.00 |
4.10 |
118.73 |
Jackpot |
40-70 |
09/05/2023 |
| Including |
36.90 |
39.00 |
2.10 |
229.71 |
Jackpot |
40-70 |
09/05/2023 |
| NFGC-23-1447 |
59.20 |
62.05 |
2.85 |
51.93 |
Jackpot |
70-95 |
10/18/2023 |
| Including |
59.20 |
61.10 |
1.90 |
77.82 |
Jackpot |
70-95 |
10/18/2023 |
| NFGC-23-1488 |
108.20 |
117.65 |
9.45 |
3.01 |
Jackpot |
40-70 |
10/18/2023 |
| Including |
110.00 |
110.70 |
0.70 |
25.7 |
Jackpot |
40-70 |
10/18/2023 |
| NFGC-23-1505 |
76.75 |
79.75 |
3.00 |
18.93 |
Jackpot |
70-95 |
10/18/2023 |
| Including |
78.90 |
79.75 |
0.85 |
61.78 |
Jackpot |
70-95 |
10/18/2023 |
| NFGC-23-1523 |
79.25 |
86.00 |
6.75 |
18.23 |
Jackpot |
70-95 |
11/14/2023 |
| Including |
79.25 |
80.80 |
1.55 |
73.76 |
Jackpot |
70-95 |
11/14/2023 |
| NFGC-23-1627 |
156.85 |
160.50 |
3.65 |
11.27 |
Jackpot |
70-95 |
04/17/2024 |
| Including |
159.95 |
160.50 |
0.55 |
67.6 |
Jackpot |
70-95 |
04/17/2024 |
Infill veining in secondary structures with
multiple orientations crosscutting the primary host structures are commonly observed in drill core which could result in additional uncertainty
in true width. As of March 1, 2023, composite intervals reported carry a minimum weighted average of 1 g/t Au diluted over a minimum
core length of 2m with a maximum of 4m consecutive dilution when at depths above 200m vertical depth and 2m consecutive dilution when
below 200m vertical depth. Prior to this date, all composites allowed for 2m consecutive dilution. Included high-grade intercepts are
reported as any consecutive interval with grades greater than 10 g/t Au. Grades have not been capped in the averaging and intervals are
reported as drill thickness.
| Hole No. |
Azimuth (°) |
Dip (°) |
Length (m) |
UTM E |
UTM N |
Prospect |
| NFGC-23-1292 |
300 |
-45 |
249 |
659421 |
5429886 |
Jackpot |
| NFGC-23-1423 |
0 |
-71 |
72 |
659418 |
5429888 |
Jackpot |
| NFGC-23-1425 |
270 |
-72 |
74 |
659417 |
5429884 |
Jackpot |
| NFGC-23-1447 |
340 |
-62 |
99 |
659393 |
5429840 |
Jackpot |
| NFGC-23-1488 |
14 |
-60 |
177 |
659394 |
5429803 |
Jackpot |
| NFGC-23-1505 |
355 |
-48 |
111 |
659372 |
5429801 |
Jackpot |
| NFGC-23-1523 |
12 |
-65 |
138 |
659413 |
5429830 |
Jackpot |
| NFGC-23-1627 |
356 |
-60 |
189 |
659369 |
5429743 |
Jackpot |
Management’s Discussion and Analysis
For the three months ended March 31, 2024 and 2023
The latest results from Jackpot Zone are shown
in the long section below:
Queensway Project – Jackpot long section,
looking north (April 17, 2024)
Management’s Discussion and Analysis
For the three months ended March 31, 2024 and 2023
Honeypot Drilling
On January 10, 2024,
the Company announced the discovery of a new zone, “Honeypot”, located 230m north of Jackpot and 1.3km north of Lotto. This
discovery was made as a result of a follow-up drill program testing a mineralized fault that was initially identified by grid drilling.
A near-surface, brittle fault structure was intersected exhibiting characteristics similar to other epizonal high-grade, gold bearing
faults that occur along this segment of the AFZ. Honeypot has a similar east-northeast striking and steeply dipping orientation to the
neighbouring Jackpot Zone. Gold found at Honeypot is hosted within a primary fault that has been drill-defined over a strike length of
280m and to a depth of 190m. The high-grade domain shows good continuity and appears to strengthen at depth as demonstrated by several
of the highlight intervals summarized in the table below.
Limited drilling has
been completed in this area to date and ongoing drilling is targeting its expansion along strike and to depth. Honeypot will be an area
of focus in the 2024 drill campaign.
2024 assay results have
been reported in a press release dated January 10, 2024. All previous and 2024 press releases can be found through SEDAR+.
Highlighted assay values
and drill hole locations from Honeypot drilling are shown in the tables below:
| Hole No. |
From (m) |
To (m) |
Length (m) |
Au (g/t) |
Zone |
True Width (%) |
Date Released |
| NFGC-23-1796 |
79.80 |
90.70 |
10.90 |
3.67 |
Honeypot |
70-95 |
04/17/2024 |
| Including |
80.35 |
80.90 |
0.55 |
25.6 |
Honeypot |
70-95 |
04/17/2024 |
| NFGC-23-1806A |
57.70 |
62.20 |
4.50 |
7.25 |
Honeypot |
70-95 |
04/17/2024 |
| Including |
57.70 |
58.60 |
0.90 |
12.05 |
Honeypot |
70-95 |
04/17/2024 |
| Including |
59.05 |
60.00 |
0.95 |
17.15 |
Honeypot |
70-95 |
04/17/2024 |
| NFGC-23-1810 |
122.85 |
130.50 |
7.65 |
26.35 |
Honeypot |
70-95 |
01/10/2024 |
| Including |
123.60 |
125.40 |
1.80 |
101.72 |
Honeypot |
70-95 |
01/10/2024 |
| Including |
126.30 |
126.75 |
0.45 |
24.06 |
Honeypot |
70-95 |
01/10/2024 |
| NFGC-23-1828 |
168.00 |
182.70 |
14.70 |
2.05 |
Honeypot |
70-95 |
01/10/2024 |
| NFGC-23-1908 |
191.05 |
200.10 |
9.05 |
1.41 |
Honeypot |
40-70 |
01/10/2024 |
| NFGC-23-1931 |
208.00 |
213.25 |
5.25 |
23.05 |
Honeypot |
40-70 |
01/10/2024 |
| Including |
208.75 |
209.20 |
0.45 |
71.42 |
Honeypot |
40-70 |
01/10/2024 |
| Including |
210.10 |
211.10 |
1.00 |
67.99 |
Honeypot |
40-70 |
01/10/2024 |
| Including |
211.80 |
212.80 |
1.00 |
11.39 |
Honeypot |
40-70 |
01/10/2024 |
| NFGC-24-2063 |
167.35 |
172.35 |
5.00 |
14.83 |
Honeypot |
Unknown |
04/17/2024 |
| Including |
167.35 |
168.25 |
0.90 |
70.06 |
Honeypot |
Unknown |
04/17/2024 |
Infill veining in secondary structures with
multiple orientations crosscutting the primary host structures are commonly observed in drill core which could result in additional uncertainty
in true width. As of March 1, 2023, composite intervals reported carry a minimum weighted average of 1 g/t Au diluted over a minimum
core length of 2m with a maximum of 4m consecutive dilution when at depths above 200m vertical depth and 2m consecutive dilution when
below 200m vertical depth. Prior to this date, all composites allowed for 2m consecutive dilution. Included high-grade intercepts are
reported as any consecutive interval with grades greater than 10 g/t Au. Grades have not been capped in the averaging and intervals are
reported as drill thickness.
| Hole No. |
Azimuth (°) |
Dip (°) |
Length (m) |
UTM E |
UTM N |
Prospect |
| NFGC-23-1796 |
351 |
-63 |
116 |
659435 |
5430057 |
Honeypot |
| NFGC-23-1806A |
293 |
-57 |
92 |
659437 |
5430057 |
Honeypot |
| NFGC-23-1810 |
297 |
-50 |
170 |
659521 |
5430060 |
Honeypot |
| NFGC-23-1828 |
299 |
-45.5 |
230 |
659565 |
5430035 |
Honeypot |
| NFGC-23-1908 |
300 |
-58 |
219 |
659566 |
5430034 |
Honeypot |
| NFGC-23-1931 |
301 |
-63.5 |
240 |
659567 |
5430033 |
Honeypot |
| NFGC-24-2063 |
282 |
-71.5 |
200 |
659554 |
5430100 |
Honeypot |
Management’s Discussion and Analysis
For the three months ended March 31, 2024 and 2023
Results from Honeypot are shown in the long section
below:

Queensway
Project – Honeypot long section, looking north (April 17, 2024)
K2 Drilling
On January 10, 2023,
the Company reported the intersection of broad gold mineralization west of the AFZ and in close proximity to the Zone 36 prospect during
systematic drilling stepping north of Lotto North. This interval graded 3.63 g/t Au over 9.50m in NFGC-22-816. In light of the recent
discovery at Keats West, the first major discovery made west of the AFZ, exploration drilling had shifted to targeting two structures
identified in a lineament study that had orientations similar to the KBFZ. This work led to the discoveries of K2 and Monte Carlo announced
on May 10, 2023. The K2 Fault is located 725m north of Lotto on the west side of the AFZ, adjacent to Zone 36.
Management’s Discussion and Analysis
For the three months ended March 31, 2024 and 2023
Ongoing
exploration at K2 has identified a significant structural zone made up of multiple structures and crosscutting vein orientations, that
currently has a defined mineralized footprint of 490m long x 395m wide. The gold mineralization begins at surface and has been drill-defined
down to a maximum vertical depth of 250m, where it remains open and untested. Much of the gold at K2 is found in the “K2 Main”
structure (shown in red in the figure below), a low-angle gold-bearing fault zone starting at surface that dips 30-40° to the southeast
which shares a similar dip to Keats West and strike to the Keats-Baseline Fault Zone. This complex network of associated structures
forms a mineralized damage zone that averages 65m in thickness.
The K2 structure is interpreted
as the master structure whereas the previously discussed “Zone 36” is a related vein occurring in close proximity that was
originally exposed in trenching.
One such vein constituent of the greater K2 structure
is “Stibnite” vein that has returned several significant intervals, a selection of which are summarized in the table below.
Stibnite is a near-surface high-grade vein that has been traced over a current strike length of 105m. This vein contains significant amounts
of stibnite, an antimony-bearing sulphide mineral as reflected by the antimony assay results of 0.95% Sb over 12.95m in NFGC-23-1303,
and 0.04% Sb over 3.90m in NFGC-23-1391. This is the first time this mineral association has been observed at Queensway North.
The network of cross-cutting veins form thick
domains of gold mineralization which is well demonstrated by several highlight intervals hosted by the K2 Main structure including 5.58
g/t Au over 12.35m in NFGC-23-1733 located just 29m from surface, 3.23 g/t Au over 17.65m, 1.45 g/t Au over 17.25m and 1.60 g/t Au over
10.45m in NFGC-23-1552, located a further 220m down-dip, and 5.28 g/t Au over 10.75m in NFGC-23-1626 situated 230m along strike (all reported
November 8, 2023).
K2 also indicates high-grade potential, and exploration
is ongoing to test these high-grade gold-bearing cross-cutting-structures and where they interact with the main K2 Main structure.
Exploration will remain focused on expanding K2,
which has been drill-defined to a maximum depth of 250m vertical, where it remains open and untested in addition to looking at areas of
interest at depth below this structure.
2024 assay results have
been reported in press releases January 31, 2024, and April 10, 2024. All previous and 2024 press releases can be found through
SEDAR+.
Management’s Discussion and Analysis
For the three months ended March 31, 2024 and 2023
Highlighted assay values and drill hole locations
from K2 drilling are shown in the tables below:
| Hole No. |
From (m) |
To (m) |
Length (m) |
Au (g/t) |
Zone |
True Width (%) |
Date Released |
| NFGC-22-898 |
176.00 |
187.00 |
11.00 |
3 |
K2 |
40-70 |
05/10/2023 |
| Including |
182.20 |
183.00 |
0.80 |
14.8 |
K2 |
40-70 |
05/10/2023 |
| NFGC-22-928 |
16.40 |
38.35 |
21.95 |
2.22 |
K2 |
40-70 |
11/29/2023 |
| Including |
27.50 |
28.50 |
1.00 |
19.71 |
K2 |
40-70 |
11/29/2023 |
| NFGC-22-928 |
46.45 |
58.00 |
11.55 |
1.92 |
K2 |
70-95 |
11/29/2023 |
| NFGC-22-986 |
43.70 |
62.50 |
18.80 |
1.44 |
K2 |
10-40 |
05/10/2023 |
| NFGC-23-1303 |
22.35 |
35.30 |
12.95 |
4.5 |
K2 |
70-95 |
08/28/2023 |
| Including |
23.20 |
24.35 |
1.15 |
21.12 |
K2 |
70-95 |
08/28/2023 |
| Including |
25.00 |
25.45 |
0.45 |
12.05 |
K2 |
70-95 |
08/28/2023 |
| NFGC-23-1426 |
29.05 |
51.00 |
21.95 |
1.77 |
K2 |
70-95 |
11/29/2023 |
| NFGC-23-1552 |
222.20 |
239.85 |
17.65 |
3.23 |
K2 |
40-70 |
11/29/2023 |
| Including |
227.55 |
228.30 |
0.75 |
25.2 |
K2 |
40-70 |
11/29/2023 |
| NFGC-23-1552 |
246.10 |
256.55 |
10.45 |
1.6 |
K2 |
40-70 |
11/29/2023 |
| NFGC-23-1552 |
266.05 |
283.30 |
17.25 |
1.45 |
K2 |
10-40 |
11/29/2023 |
| NFGC-23-1626 |
28.30 |
39.05 |
10.75 |
5.28 |
K2 |
70-95 |
11/29/2023 |
| Including |
37.65 |
39.05 |
1.40 |
30.88 |
K2 |
70-95 |
11/29/2023 |
| NFGC-23-1630 |
58.20 |
66.10 |
7.90 |
4.92 |
K2 |
70-95 |
01/31/2024 |
| Including |
58.20 |
58.55 |
0.35 |
26.5 |
K2 |
70-95 |
01/31/2024 |
| NFGC-23-1630 |
129.75 |
153.20 |
23.45 |
1.82 |
K2 |
70-95 |
01/31/2024 |
| NFGC-23-1636 |
264.60 |
281.00 |
16.40 |
2.79 |
K2 |
70-95 |
11/29/2023 |
| Including |
265.25 |
266.00 |
0.75 |
10.28 |
K2 |
70-95 |
11/29/2023 |
| Including |
270.70 |
271.50 |
0.80 |
10.18 |
K2 |
70-95 |
11/29/2023 |
| NFGC-23-1647 |
204.30 |
207.00 |
2.70 |
27.68 |
K2 |
Unknown |
04/10/2024 |
| Including |
205.00 |
205.60 |
0.60 |
124.5 |
K2 |
Unknown |
04/10/2024 |
| NFGC-23-1647 |
223.80 |
237.65 |
13.85 |
3.26 |
K2 |
70-95 |
04/10/2024 |
| Including |
223.80 |
224.55 |
0.75 |
24.5 |
K2 |
70-95 |
04/10/2024 |
| NFGC-23-1729 |
55.20 |
62.20 |
7.00 |
27.49 |
K2 |
70-95 |
01/31/2024 |
| Including |
55.20 |
55.70 |
0.50 |
370 |
K2 |
70-95 |
01/31/2024 |
| NFGC-23-1733 |
35.30 |
47.65 |
12.35 |
5.58 |
K2 |
70-95 |
11/29/2023 |
| Including |
35.30 |
36.20 |
0.90 |
19.95 |
K2 |
70-95 |
11/29/2023 |
| Including |
40.70 |
41.45 |
0.75 |
13.86 |
K2 |
70-95 |
11/29/2023 |
| Including |
46.75 |
47.65 |
0.90 |
29.47 |
K2 |
70-95 |
11/29/2023 |
| NFGC-23-1783 |
10.40 |
35.70 |
25.30 |
3.48 |
K2 |
40-70 |
01/31/2024 |
| Including |
10.40 |
11.00 |
0.60 |
12.5 |
K2 |
40-70 |
01/31/2024 |
| Including |
12.90 |
13.20 |
0.30 |
42.3 |
K2 |
40-70 |
01/31/2024 |
| NFGC-23-1783 |
55.00 |
57.40 |
2.40 |
21.96 |
K2 |
70-95 |
01/31/2024 |
| Including |
56.00 |
56.40 |
0.40 |
130.5 |
K2 |
70-95 |
01/31/2024 |
| NFGC-23-1786 |
29.45 |
41.70 |
12.25 |
8.69 |
K2 |
70-95 |
01/31/2024 |
| Including |
29.45 |
30.15 |
0.70 |
18.54 |
K2 |
70-95 |
01/31/2024 |
| Including |
30.75 |
31.40 |
0.65 |
90.69 |
K2 |
70-95 |
01/31/2024 |
| Including |
32.25 |
33.25 |
1.00 |
13.4 |
K2 |
70-95 |
01/31/2024 |
| NFGC-23-1904 |
72.35 |
90.80 |
18.45 |
3.14 |
K2 |
10-40 |
01/31/2024 |
| Including |
86.60 |
87.45 |
0.85 |
17.4 |
K2 |
10-40 |
01/31/2024 |
| NFGC-23-1904 |
145.30 |
162.05 |
16.75 |
1 |
K2 |
Unknown |
01/31/2024 |
| NFGC-23-1951 |
179.00 |
194.65 |
15.65 |
1.71 |
K2 |
70-95 |
04/10/2024 |
| NFGC-23-1986 |
85.85 |
88.35 |
2.50 |
16.01 |
K2 |
70-95 |
04/10/2024 |
| Including |
85.85 |
86.15 |
0.30 |
130.14 |
K2 |
70-95 |
04/10/2024 |
| NFGC-23-1986 |
167.70 |
181.15 |
13.45 |
17.77 |
K2 |
40-70 |
04/10/2024 |
| Including |
172.15 |
174.30 |
2.15 |
93.96 |
K2 |
40-70 |
04/10/2024 |
| Including |
180.80 |
181.15 |
0.35 |
17.02 |
K2 |
40-70 |
04/10/2024 |
| NFGC-23-1997 |
233.15 |
237.75 |
4.60 |
12.69 |
K2 |
Unknown |
04/10/2024 |
| Including |
233.15 |
234.10 |
0.95 |
32.36 |
K2 |
Unknown |
04/10/2024 |
| Including |
234.65 |
235.15 |
0.50 |
27.1 |
K2 |
Unknown |
04/10/2024 |
| NFGC-23-1997 |
243.40 |
290.60 |
47.20 |
1.23 |
K2 |
70-95 |
04/10/2024 |
| NFGC-23-2004 |
152.20 |
172.00 |
19.80 |
1.27 |
K2 |
70-95 |
04/10/2024 |
| NFGC-24-2010 |
53.70 |
74.00 |
20.30 |
2.9 |
K2 |
70-95 |
04/10/2024 |
| Including |
60.90 |
61.25 |
0.35 |
24.34 |
K2 |
70-95 |
04/10/2024 |
| Including |
62.00 |
62.35 |
0.35 |
10.54 |
K2 |
70-95 |
04/10/2024 |
Infill veining in secondary structures with
multiple orientations crosscutting the primary host structures are commonly observed in drill core which could result in additional uncertainty
in true width. Composite intervals reported carry a minimum weighted average of 1 g/t Au diluted over a minimum core length of 2m with
a maximum of 4m consecutive dilution when above 200m vertical depth and 2m consecutive dilution when below 200m vertical depth. Included
high-grade intercepts are reported as any consecutive interval with grades greater than 10 g/t Au. Grades have not been capped in the
averaging and intervals are reported as drill thickness.
Management’s Discussion and Analysis
For the three months ended March 31, 2024 and 2023
| Hole No. |
Azimuth (°) |
Dip (°) |
Length (m) |
UTM E |
UTM N |
Prospect |
| NFGC-22-898 |
260 |
-44 |
230 |
658965 |
5429766 |
K2 |
| NFGC-22-928 |
300 |
-45 |
206 |
659051 |
5429922 |
K2 |
| NFGC-22-986 |
330 |
-45 |
308 |
658965 |
5429767 |
K2 |
| NFGC-23-1303 |
345 |
-60 |
227 |
658956 |
5430041 |
K2 |
| NFGC-23-1426 |
345 |
-45 |
98 |
659082 |
5430012 |
K2 |
| NFGC-23-1552 |
300 |
-45 |
338 |
659160 |
5429773 |
K2 |
| NFGC-23-1630 |
345 |
-64 |
176 |
659018 |
5429881 |
K2 |
| NFGC-23-1626 |
345 |
-45 |
130 |
658893 |
5429932 |
K2 |
| NFGC-23-1647 |
300 |
-45 |
260 |
659100 |
5429749 |
K2 |
| NFGC-23-1636 |
300 |
-47 |
296 |
659139 |
5429668 |
K2 |
| NFGC-23-1729 |
0 |
-45 |
110 |
659064 |
5429990 |
K2 |
| NFGC-23-1733 |
0 |
-45 |
110 |
659104 |
5429987 |
K2 |
| NFGC-23-1786 |
75 |
-45 |
131 |
659091 |
5430008 |
K2 |
| NFGC-23-1783 |
20 |
-50 |
95 |
659052 |
5430044 |
K2 |
| NFGC-23-1904 |
17 |
-58 |
206 |
658913 |
5429819 |
K2 |
| NFGC-23-1951 |
48 |
-46 |
245 |
658843 |
5429662 |
K2 |
| NFGC-23-1986 |
39 |
-46 |
194 |
658867 |
5429772 |
K2 |
| NFGC-23-1997 |
60 |
-45.5 |
302 |
658829 |
5429766 |
K2 |
| NFGC-23-2004 |
77 |
-51 |
239 |
658829 |
5429765 |
K2 |
| NFGC-24-2010 |
13 |
-45 |
167 |
658900 |
5429829 |
K2 |
Management’s Discussion and Analysis
For the three months ended March 31, 2024 and 2023
Results from K2 are shown in plan map, 3-D view,
cross-section, and long section below:
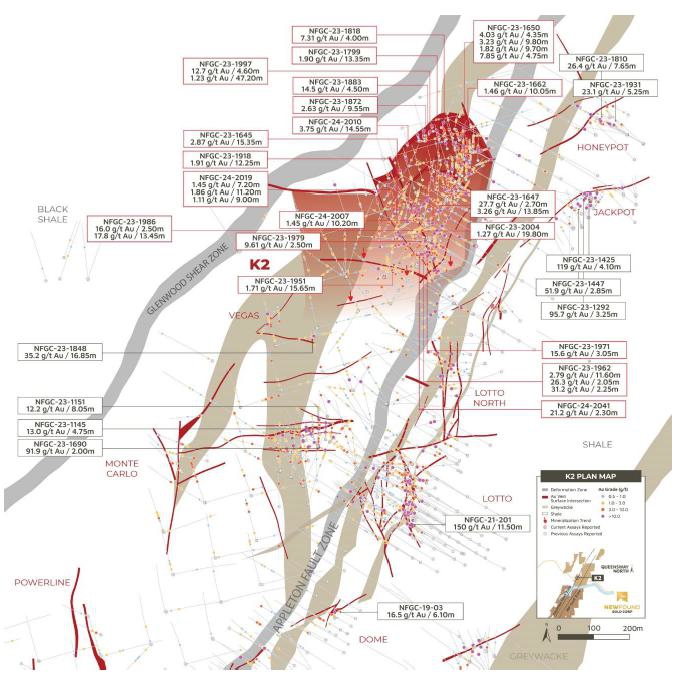
Queensway
Project – K2 area plan map (April 10, 2024)
Management’s Discussion and Analysis
For the three months ended March 31, 2024 and 2023
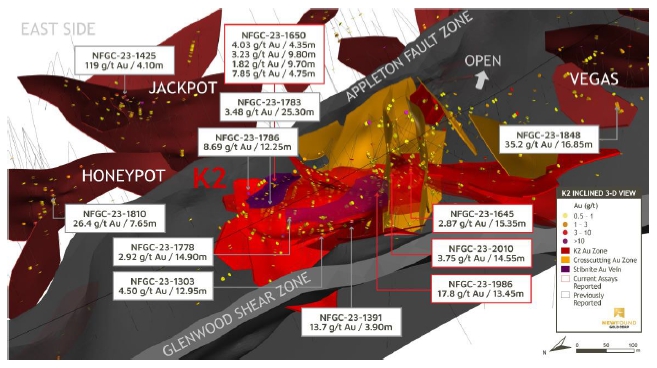
Queensway
Project – K2 inclined 3-D view, looking southeast (April 10, 2024)
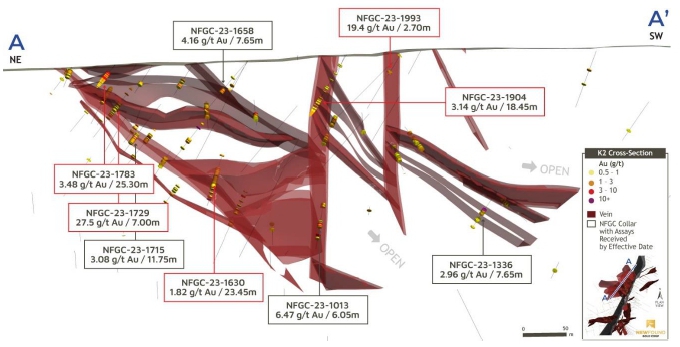
Queensway
Project – K2 3-D cross-section, +/-25m, looking southeast (January 31, 2024)
Management’s Discussion and Analysis
For the three months ended March 31, 2024 and 2023
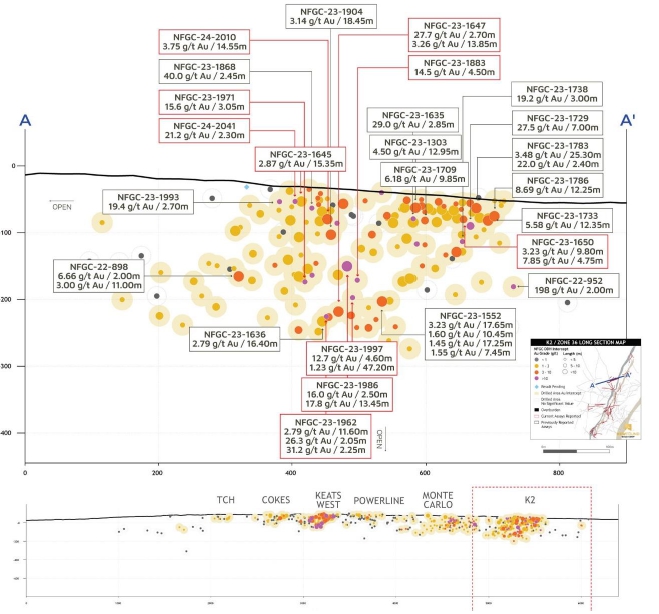
Queensway
Project – K2 long section, looking north (April 10, 2024)
Monte Carlo, Powerline, and Vegas Drilling
On May 10, 2023, the Company announced another
new discovery on the west side of the AFZ a further 850m south of K2, a zone now named “Monte Carlo”. The discovery high-grade
results of 12.3 g/t Au over 8.05m in NFGC-23-1151 and 13.0 g/t Au over 4.75m in NFGC-23-1145 were found to be hosted by an east-west striking
brittle fault zone.
Targeted follow-up drilling has since intersected
multiple high-grade gold intervals which are summarized in the table below. The Monte Carlo structure has a strike length of 520m with
a depth extent of 160m vertical while the high-grade segment spans 185m of strike.
Exploration work at Monte Carlo has focussed on
expanding the highest-grade segment of the fault down dip. Drilling is currently paused and likely to resume later in 2024 utilizing the
seismic data to guide deeper drilling.
Management’s Discussion and Analysis
For the three months ended March 31, 2024 and 2023
On February 29, 2024, the Company introduced
the discovery of a new zone now named “Vegas” which is located midway between the Monte Carlo and K2 zones on the west side
of the AFZ. The high-grade highlight intercept from Vegas of 35.2 g/t Au over 16.85m in NFGC-23-1848 includes an elevated high-grade sample
running 1,910 g/t Au over 0.30m that exhibits significant visible gold over a 3cm length. Vegas was discovered through reconnaissance
grid drilling and subsequent, follow-up drilling has identified a high-grade segment of this moderately northeast-dipping fault that appears
to link between the Monte Carlo and K2 structures. Additional drilling is planned to expand on this newly identified high-grade domain.
Also announced on February 29, 2024, the
Company introduced the “Powerline” Zone which was discovered through reconnaissance grid drilling (West Grid) on the west
side of the AFZ a further 800 metres south of Monte Carlo. Drilling encountered a broad gold mineralized shallowly northeast-dipping shear
zone with characteristics similar to the neighbouring Keats West Zone. Powerline was first intercepted by grid drilling that returned
the highlight intervals of 3.32 g/t Au over 7.00m and 1.85m over 6.30m in NFGC-23-1321. Targeted follow-up drilling intercepted 1.80 g/t
Au over 10.55m in NFGC-23-1884, found 50m along strike of the initial discovery. Highly anomalous and low-grade mineralization has been
defined over a current strike length of 350m at Powerline and testing has only occurred at shallow depths.
2024 assay results have
been reported in press releases dated February 29, 2024. All previous and 2024 press releases can be found through SEDAR+.
Highlighted assay values and drill hole locations from Monte Carlo,
Powerline and Vegas are shown in the tables below:
| Hole No. |
From (m) |
To (m) |
Length (m) |
Au (g/t) |
Zone |
True Width (%) |
Date Released |
| NFGC-22-1064 |
86.55 |
88.55 |
2.00 |
25.77 |
Monte Carlo |
70-95 |
02/29/2024 |
| Including |
87.40 |
87.90 |
0.50 |
92.51 |
Monte Carlo |
70-95 |
02/29/2024 |
| NFGC-23-1135 |
49.30 |
55.55 |
6.25 |
7.49 |
Monte Carlo |
70-95 |
10/11/2023 |
| Including |
49.30 |
49.65 |
0.35 |
40 |
Monte Carlo |
70-95 |
10/11/2023 |
| Including |
54.30 |
55.05 |
0.75 |
33 |
Monte Carlo |
70-95 |
10/11/2023 |
| NFGC-23-1145 |
61.80 |
66.55 |
4.75 |
13.04 |
Monte Carlo |
70-95 |
05/10/2023 |
| Including |
61.80 |
62.35 |
0.55 |
79.9 |
Monte Carlo |
70-95 |
05/10/2023 |
| Including |
64.15 |
64.55 |
0.40 |
20.1 |
Monte Carlo |
70-95 |
05/10/2023 |
| NFGC-23-1151 |
63.25 |
71.30 |
8.05 |
12.21 |
Monte Carlo |
40-70 |
05/10/2023 |
| Including |
65.00 |
65.60 |
0.60 |
51.3 |
Monte Carlo |
40-70 |
05/10/2023 |
| Including |
67.70 |
68.10 |
0.40 |
111 |
Monte Carlo |
40-70 |
05/10/2023 |
| NFGC-23-1321 |
46.00 |
53.00 |
7.00 |
3.32 |
Powerline |
40-70 |
02/29/2024 |
| NFGC-23-1673 |
59.45 |
66.70 |
7.25 |
6.87 |
Monte Carlo |
40-70 |
02/29/2024 |
| Including |
61.00 |
62.25 |
1.25 |
27.76 |
Monte Carlo |
40-70 |
02/29/2024 |
| NFGC-23-1683 |
36.20 |
38.25 |
2.05 |
23.52 |
Monte Carlo |
70-95 |
10/11/2023 |
| Including |
36.20 |
36.75 |
0.55 |
80.95 |
Monte Carlo |
70-95 |
10/11/2023 |
| NFGC-23-1683 |
51.55 |
54.25 |
2.70 |
18.85 |
Monte Carlo |
70-95 |
10/11/2023 |
| Including |
52.00 |
52.35 |
0.35 |
131.1 |
Monte Carlo |
70-95 |
10/11/2023 |
| NFGC-23-1690 |
166.75 |
168.75 |
2.00 |
91.86 |
Monte Carlo |
40-70 |
10/11/2023 |
| Including |
166.75 |
167.85 |
1.10 |
166.89 |
Monte Carlo |
40-70 |
10/11/2023 |
| NFGC-23-1848 |
89.70 |
106.55 |
16.85 |
35.24 |
Vegas |
70-95 |
02/29/2024 |
| Including |
97.40 |
97.70 |
0.30 |
1910 |
Vegas |
70-95 |
02/29/2024 |
| NFGC-23-1884 |
43.00 |
53.55 |
10.55 |
1.8 |
Powerline |
40-70 |
02/29/2024 |
Infill veining in secondary structures with
multiple orientations crosscutting the primary host structures are commonly observed in drill core which could result in additional uncertainty
in true width. As of March 1, 2023, composite intervals reported carry a minimum weighted average of 1 g/t Au diluted over a minimum
core length of 2m with a maximum of 4m consecutive dilution when at depths above 200m vertical depth and 2m consecutive dilution when
below 200m vertical depth. Prior to this date, all composites allowed for 2m consecutive dilution. Included high-grade intercepts are
reported as any consecutive interval with grades greater than 10 g/t Au. Grades have not been capped in the averaging and intervals are
reported as drill thickness.
Management’s Discussion and Analysis
For the three months ended March 31, 2024 and 2023
| Hole No. |
Azimuth (°) |
Dip (°) |
Length (m) |
UTM E |
UTM N |
Prospect |
| NFGC-22-1064 |
330 |
-50 |
137 |
658589 |
5429172 |
Monte Carlo |
| NFGC-23-1135 |
332 |
-45 |
185 |
658657 |
5429192 |
Monte Carlo |
| NFGC-23-1145 |
5 |
-42 |
173 |
658659 |
5429192 |
Monte Carlo |
| NFGC-23-1151 |
300 |
-45 |
164 |
658657 |
5429196 |
Monte Carlo |
| NFGC-23-1321 |
75 |
-45 |
251 |
658152 |
5428428 |
Golden Joint |
| NFGC-23-1673 |
0 |
-70 |
110 |
658680 |
5429208 |
Monte Carlo |
| NFGC-23-1683 |
0 |
-45 |
80 |
658625 |
5429206 |
Monte Carlo |
| NFGC-23-1690 |
25 |
-45 |
219 |
658618 |
5429078 |
Monte Carlo |
| NFGC-23-1848 |
200 |
-75 |
146 |
658656 |
5429521 |
Monte Carlo |
| NFGC-23-1884 |
30 |
-54.5 |
75 |
658212 |
5428391 |
Golden Joint |
The latest results from Monte Carlo, Powerline,
and Vegas zones are shown in the images below:
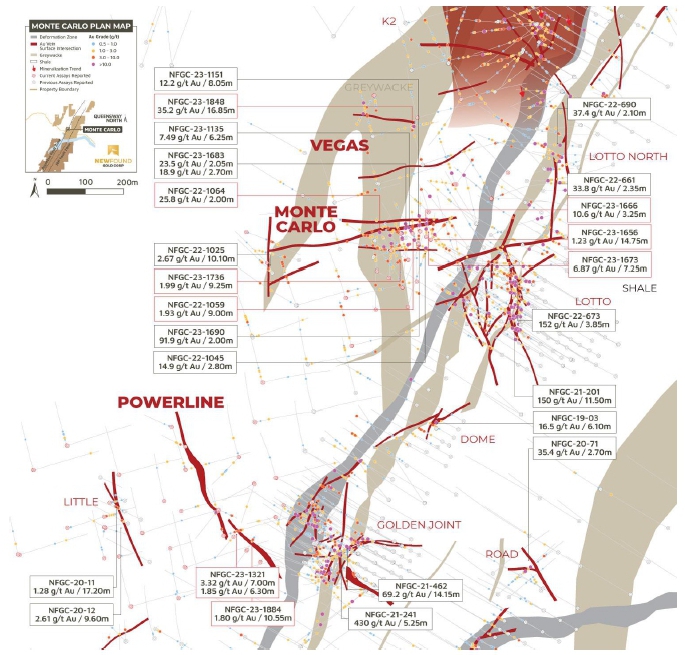
Queensway Project – Powerline to K2
plan view map (February 29, 2024)
Management’s Discussion and Analysis
For the three months ended March 31, 2024 and 2023
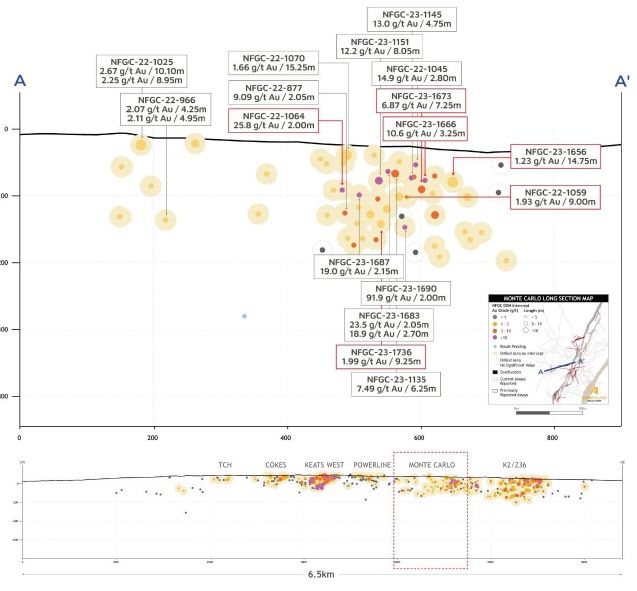
Queensway Project – Monte Carlo long
section, looking northwest (February 29, 2024)
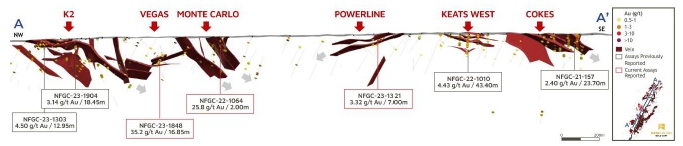
Queensway
Project – 3D Cross-Section of AFZ West (looking east, +/- 35m) (February 29, 2024)
Management’s Discussion and Analysis
For the three months ended March 31, 2024 and 2023
Golden Joint Drilling
On June 30, 2021, the Company announced the
discovery of a new high-grade zone in the footwall of the AFZ approximately 1km north of Keats named the “Golden Joint” with
initial highlight intervals of 10.4 g/t Au over 4.85m in NFGC-21-171 and 430 g/t Au over 5.25m in NFGC-21-241. Continued step-out drilling
at Golden Joint rapidly expanded the zone and selection of significant intervals are summarized in the table below.
The
Golden Joint prospect is comprised of two sub-parallel vein systems (Main Zone and HW Zone) and is located between the Keats and Lotto
zones. Golden Joint Main Zone, consists of an approximately north-south striking, steeply west-dipping quartz vein and associated brittle
fault in the footwall to the AFZ, whereas the HW Zone forms a network of stock-work style veining that is largely constrained to a thick
bed of greywacke and is more distal to the AFZ. The Golden Joint Main vein carries high-grade gold mineralization and has a vertical
depth of 305 m, and a strike length of 250 m. The vein has been intersected at depths as great as 385 m and remains open down-dip.
Drilling to date at the Golden Joint Hanging Wall
(“HW”) Zone, located immediately east of the Golden Joint Main Zone has extended the zone over a strike length of 185m and
to a vertical depth of 150m. A selection of highlight intervals is summarized in the table below.
A drilling program at Golden Joint utilizing a
barge drill was recently completed that was designed to test the upper 100m of the Golden Joint Zone that was not reachable from land.
This program successfully expanded the Golden Joint Zone to surface and initial results received indicate strong continuity of high-grade
gold to surface. The remainder of the program results were received in Q1 2024 reported on April 17, 2024.
Golden Joint is drill defined from surface down
to a vertical depth of 385m, future exploration will focus on expanding mineralization to depth utilizing the seismic data, where it remains
open.
2024 assay results have
been reported in press release dated April 17, 2024. All previous and 2024 press releases can be found through SEDAR+.
Highlighted assay values and drill hole locations
from Golden Joint drilling are shown in the tables below:
| Hole No. |
From (m) |
To (m) |
Length (m) |
Au (g/) |
Zone |
True Width (%) |
Date Released |
| NFGC-21-171 |
223.45 |
228.30 |
4.85 |
10.36 |
Golden Joint Main |
40-70 |
06/30/2021 |
| Including |
225.00 |
226.00 |
1.00 |
41.26 |
Golden Joint Main |
40-70 |
06/30/2021 |
| NFGC-21-225 |
136.9 |
139.00 |
2.10 |
64.94 |
Golden Joint HW |
40-70 |
09/30/2021 |
| Including |
136.9 |
137.65 |
0.75 |
135.66 |
Golden Joint HW |
40-70 |
09/30/2021 |
| Including |
138.00 |
139.00 |
1.00 |
34.52 |
Golden Joint HW |
40-70 |
06/30/2021 |
| NFGC-21-225 |
143.00 |
145.45 |
2.45 |
17.43 |
Golden Joint HW |
70-95 |
09/30/2021 |
| Including |
143.85 |
144.85 |
1.00 |
42.55 |
Golden Joint HW |
70-95 |
09/30/2021 |
| NFGC-21-274 |
164.65 |
166.75 |
2.10 |
33.1 |
Golden Joint HW |
10-40 |
01/06/2022 |
| Including |
164.65 |
165.80 |
1.15 |
48.41 |
Golden Joint HW |
10-40 |
01/06/2022 |
| NFGC-21-307B |
349.40 |
353.90 |
4.50 |
16.35 |
Golden Joint Main |
40-70 |
09/30/2021 |
| Including |
351.00 |
353.90 |
2.90 |
24.59 |
Golden Joint Main |
40-70 |
09/30/2021 |
| Including |
351.00 |
351.45 |
0.45 |
16.06 |
Golden Joint Main |
40-70 |
09/30/2021 |
| Including |
352.90 |
353.90 |
1.00 |
63.82 |
Golden Joint Main |
40-70 |
09/30/2021 |
| NFGC-21-322 |
271.65 |
275.90 |
4.25 |
15.32 |
Golden Joint Main |
40-70 |
09/30/2021 |
| Including |
272.35 |
274.75 |
2.40 |
25.78 |
Golden Joint Main |
40-70 |
09/30/2021 |
| NFGC-21-386 |
424.75 |
429.10 |
4.35 |
68.27 |
Golden Joint Main |
70-95 |
01/06/2022 |
| Including |
426.60 |
427.50 |
0.90 |
320.65 |
Golden Joint Main |
70-95 |
01/06/2022 |
| NFGC-21-401 |
450.15 |
454.00 |
3.85 |
85.77 |
Golden Joint Main |
10-40 |
01/19/2022 |
| Including |
450.15 |
450.70 |
0.55 |
594 |
Golden Joint Main |
10-40 |
01/19/2022 |
| NFGC-21-462 |
325.75 |
339.90 |
14.15 |
69.15 |
Golden Joint Main |
10-40 |
03/24/2022 |
| Including |
325.75 |
330.70 |
4.95 |
40.36 |
Golden Joint Main |
10-40 |
03/24/2022 |
| Including |
326.30 |
327.25 |
0.95 |
182.5 |
Golden Joint Main |
10-40 |
03/24/2022 |
| Including |
328.10 |
328.45 |
0.35 |
37.9 |
Golden Joint Main |
10-40 |
05/31/2022 |
| Including |
333.30 |
339.90 |
6.60 |
117.85 |
Golden Joint Main |
10-40 |
03/24/2022 |
| Including |
333.30 |
334.25 |
0.95 |
96.1 |
Golden Joint Main |
10-40 |
03/24/2022 |
| Including |
335.85 |
337.15 |
1.30 |
190.63 |
Golden Joint Main |
10-40 |
03/24/2022 |
| Including |
338.00 |
339.90 |
1.90 |
228.03 |
Golden Joint Main |
10-40 |
03/24/2022 |
| NFGC-22-766 |
206.85 |
209.30 |
2.45 |
50.3 |
Golden Joint Main |
40-70 |
01/24/2023 |
| Including |
207.20 |
208.15 |
0.95 |
129.5 |
Golden Joint Main |
40-70 |
01/24/2023 |
| NFGC-23-1123 |
150.55 |
152.70 |
2.15 |
26.55 |
Golden Joint HW |
40-70 |
10/23/2023 |
| Including |
150.55 |
150.85 |
0.30 |
190.24 |
Golden Joint HW |
40-70 |
10/23/2023 |
| NFGC-23-1482 |
15.90 |
18.00 |
2.10 |
24.01 |
Golden Joint Main |
70-95 |
10/23/2023 |
| Including |
17.00 |
17.35 |
0.35 |
140 |
Golden Joint Main |
70-95 |
10/23/2023 |
| NFGC-23-1482 |
44.70 |
47.35 |
2.65 |
66.16 |
Golden Joint Main |
70-95 |
10/23/2023 |
| Including |
45.95 |
46.80 |
0.85 |
194 |
Golden Joint Main |
70-95 |
10/23/2023 |
| NFGC-23-1535 |
116.50 |
123.90 |
7.40 |
16.54 |
Golden Joint Main |
10-40 |
10/23/2023 |
| Including |
116.50 |
117.10 |
0.60 |
165.13 |
Golden Joint Main |
10-40 |
10/23/2023 |
| Including |
122.15 |
122.75 |
0.60 |
13.09 |
Golden Joint Main |
10-40 |
10/23/2023 |
| Including |
123.50 |
123.90 |
0.40 |
29.08 |
Golden Joint Main |
10-40 |
10/23/2023 |
| NFGC-23-1585 |
85.95 |
88.60 |
2.65 |
67.48 |
Golden Joint Main |
10-40 |
10/23/2023 |
| Including |
85.95 |
87.60 |
1.65 |
107.98 |
Golden Joint Main |
10-40 |
10/23/2023 |
Management’s Discussion and Analysis
For the three months ended March 31, 2024 and 2023
Infill veining in secondary structures with
multiple orientations crosscutting the primary host structures are commonly observed in drill core which could result in additional uncertainty
in true width. As of March 1, 2023, composite intervals reported carry a minimum weighted average of 1 g/t Au diluted over a minimum
core length of 2m with a maximum of 4m consecutive dilution when at depths above 200m vertical depth and 2m consecutive dilution when
below 200m vertical depth. Prior to this date, all composites allowed for 2m consecutive dilution. Prior to February 18, 2022, all
composite intervals were selected visually. Included high-grade intercepts are reported as any consecutive interval with grades greater
than 10 g/t Au. Grades have not been capped in the averaging and intervals are reported as drill thickness.
| Hole No. |
Azimuth (°) |
Dip (°) |
Length (m) |
UTM E |
UTM N |
Prospect |
| NFGC-21-171 |
300 |
-45 |
338 |
658546 |
5428356 |
Golden Joint |
| NFGC-21-225 |
298 |
-45.5 |
321 |
658545 |
5428328 |
Golden Joint |
| NFGC-21-274 |
294 |
-49 |
552 |
658616 |
5428373 |
Golden Joint |
| NFGC-21-307B |
298 |
-47 |
477 |
658593 |
5428358 |
Golden Joint |
| NFGC-21-322 |
299 |
-46 |
342 |
658570 |
5428313 |
Golden Joint |
| NFGC-21-386 |
298.5 |
-46.5 |
582 |
658634 |
5428306 |
Golden Joint |
| NFGC-21-401 |
298.5 |
-46.5 |
492 |
658612 |
5428318 |
Golden Joint |
| NFGC-21-462 |
298 |
-47.5 |
486 |
658590 |
5428331 |
Golden Joint |
| NFGC-22-766 |
230 |
-45 |
327 |
658523 |
5428283 |
Golden Joint |
| NFGC-23-1123 |
32 |
-45 |
240 |
658351 |
5428136 |
Golden Joint |
| NFGC-23-1482 |
150 |
-66 |
92 |
658404 |
5428350 |
Golden Joint |
| NFGC-23-1535 |
88 |
-60 |
149 |
658360 |
5428358 |
Golden Joint |
| NFGC-23-1585 |
355 |
-44 |
189 |
658502 |
5428380 |
Golden Joint |
Management’s Discussion and Analysis
For the three months ended March 31, 2024 and 2023
The latest results from the Golden Joint prospect
are shown in the long section, plan map, and cross-section below:

Queensway Project – Golden Joint –
Lotto North plan map (October 23, 2023)
Management’s Discussion and Analysis
For the three months ended March 31, 2024 and 2023
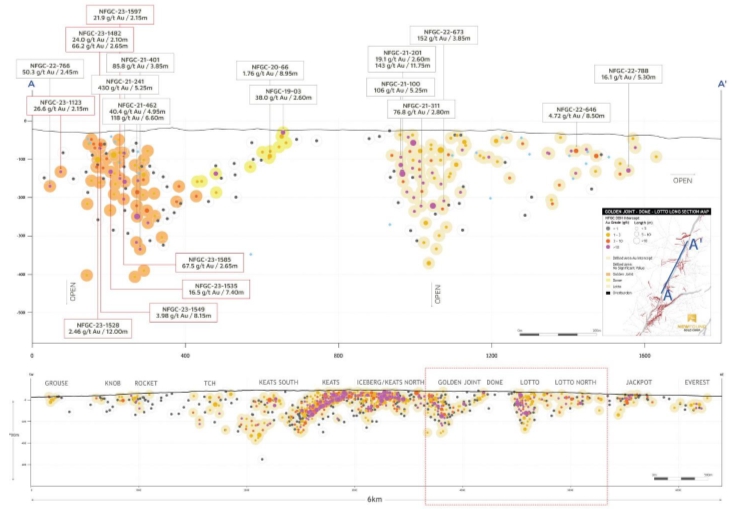
Queensway Project – Golden Joint –
Lotto North long section, looking northwest (October 23, 2023)
Management’s Discussion and Analysis
For the three months ended March 31, 2024 and 2023
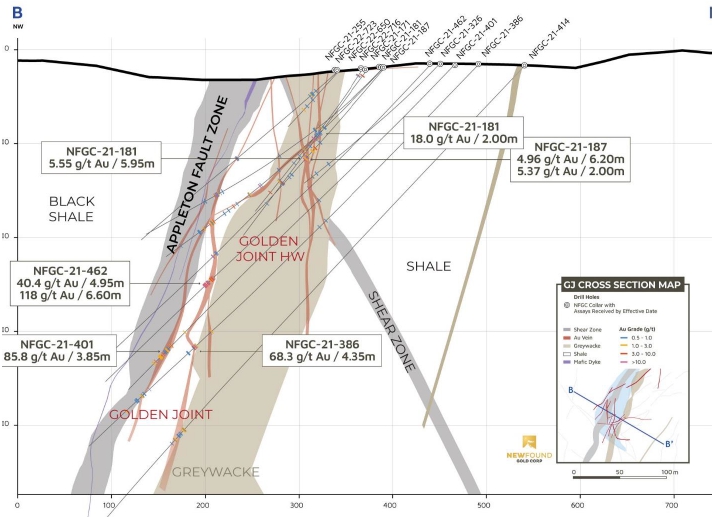
Queensway Project – Golden Joint cross-section,
+/- 12.5m, looking northeast (February 16, 2023)
TCH, Knob (Rocket Vein) and Grouse Drilling
The Trans-Canada Highway (TCH) prospect is located
between Keats and Knob.
On January 18, 2023, the Company announced
results from its drilling at the TCH prospect where systematic reconnaissance grid drilling south of the Trans-Canada highway along the
eastern side of the AFZ identified a new gold-bearing zone called “TCH (Trans Canada Highway)” with intercepts of 79.6 g/t
Au over 2.00m in NFGC-22-863, 10.5 g/t Au over 2.45m in NFGC-22-642, and 1.02 g/t Au over 10.70m in NFGC-22-703. This structure is located
in the footwall to the AFZ and has been intersected over a strike length of 190m and down to a vertical depth of 300m.
At the TCH prospect, mineralization has been identified
in structures located in both the hangingwall (TCW) and footwall (TCH) of the AFZ. Epizonal-style veining is associated with significant
brittle faulting and silicification in the siltstones.
Also announced on January 18, 2023, were
results from targeted drilling at the Knob prospect which identified a new vein now called “Rocket” located 100m to the northeast.
The highlight interval of 12.6 g/t Au over 4.45m in NFGC-22-704 was intersected at a vertical depth of 65m. Subsequent follow-up drilling
expanded on this discovery intersecting 49.5 g/t Au over 2.30m in NFGC-22-704 48m along strike (reported on June 20, 2023).
Management’s Discussion and Analysis
For the three months ended March 31, 2024 and 2023
Further north, exploration at Knob-Quarry, targeting
a series of approximately east-west striking structures similar in orientation to the KBFZ, identified significant gold mineralization
hosted in and around the greywacke, a coarser-grained sedimentary rock that occurs at Queensway interbedded with the shales and adjacent
to the AFZ, with highlight interval NFGC-22-906 returning 20.2 g/t Au over 3.35m (reported on June 20, 2023). This interval is located
150m from surface and 250m east of the AFZ.
The Knob zone is a historical discovery with mineralization
hosted within an east-west striking structure largely constrained to greywacke which has been traced over a strike length of 160m and
has seen minimal modern-day drilling. Limited drilling has been completed in the Knob prospect area due to other drilling priorities.
No immediate follow-up work is scheduled at this time.
On
September 20, 2023, the Company announced the results of a first pass program at the Grouse Zone located 2km south of Keats, a
historic showing discovered by trenching and tested by limited drilling in the early 2000s. This initial program identified significant
gold mineralization akin to the Knob Zone consisting of massive to stockwork-style quartz veins developed within and around a thick bed
of greywacke hosted by an east-west striking fault zone located 300m east of the AFZ. Highlight intervals of this program include 3.56
g/t Au over 4.90m in NFGC-22-1005, 1.34 g/t Au over 9.70m in NFGC-22-1047, and 2.32 g/t Au over 5.55m in NFGC-22-1053, along with the
presence of visible gold and several additional significant intervals. Mineralization has been identified over an area 100m along strike,
starting near surface and reaching a depth of 80m.
The Grouse Zone is now the southernmost gold zone
drilled at Queensway North. Measuring from Grouse north to the Everest Zone spans 6.1km of strike where high-grade gold mineralization
has been identified through near-surface drilling, indicating that the gold mineralization footprint of the AFZ continues a full 2.7km
south of Keats.
All previous and 2024
press releases can be found through SEDAR+.
Management’s Discussion and Analysis
For the three months ended March 31, 2024 and 2023
Highlighted assay values and drill hole locations
from TCH and Rocket (Knob) drilling are shown in the tables below:
| Hole No. |
From (m) |
To (m) |
Length (m) |
Au (g/t) |
Zone |
True Width (%) |
Date Released |
| NFGC-21-142 |
81.00 |
86.00 |
5.00 |
5.12 |
Knob |
10-40 |
05/31/2022 |
| Including |
81.00 |
81.85 |
0.85 |
22.1 |
Knob |
10-40 |
05/31/2022 |
| NFGC-22-642 |
303.45 |
305.90 |
2.45 |
10.45 |
TCH |
40-70 |
01/18/2023 |
| Including |
303.80 |
304.35 |
0.55 |
14.46 |
TCH |
40-70 |
01/18/2023 |
| Including |
305.40 |
305.90 |
0.50 |
32.43 |
TCH |
40-70 |
01/18/2023 |
| NFGC-22-704 |
86.60 |
91.05 |
4.45 |
12.63 |
Rocket |
70-95 |
01/18/2023 |
| Including |
88.00 |
88.45 |
0.45 |
118.5 |
Rocket |
70-95 |
01/18/2023 |
| NFGC-22-863 |
427.10 |
429.10 |
2.00 |
79.62 |
TCH |
Unknown |
01/18/2023 |
| Including |
427.10 |
427.80 |
0.70 |
226.46 |
TCH |
Unknown |
01/18/2023 |
| NFGC-22-885 |
278.60 |
280.80 |
2.20 |
7.06 |
TCH |
70-95 |
01/18/2023 |
| Including |
279.50 |
280.20 |
0.70 |
22.01 |
TCH |
70-95 |
01/18/2023 |
| NFGC-22-906 |
192.95 |
196.30 |
3.35 |
20.15 |
Knob |
Unknown |
06/20/2023 |
| Including |
192.95 |
193.25 |
0.30 |
215 |
Knob |
Unknown |
06/20/2023 |
| NFGC-22-950 |
23.50 |
25.80 |
2.30 |
49.45 |
Rocket |
70-95 |
06/20/2023 |
| Including |
24.90 |
25.40 |
0.50 |
227 |
Rocket |
70-95 |
06/20/2023 |
| NFGC-22-1005 |
16.60 |
21.50 |
4.90 |
3.56 |
Grouse |
70-95 |
09/20/2023 |
| Including |
18.25 |
18.80 |
0.55 |
17.41 |
Grouse |
70-95 |
09/20/2023 |
| NFGC-22-1005 |
43.85 |
45.85 |
2.00 |
8.51 |
Grouse |
10-40 |
09/20/2023 |
| Including |
43.85 |
44.85 |
1.00 |
17.01 |
Grouse |
10-40 |
09/20/2023 |
| NFGC-22-1005 |
50.40 |
52.60 |
2.20 |
6.77 |
Grouse |
10-40 |
09/20/2023 |
| Including |
51.20 |
51.75 |
0.55 |
19.14 |
Grouse |
10-40 |
09/20/2023 |
Infill veining in secondary structures with
multiple orientations crosscutting the primary host structures are commonly observed in drill core which could result in additional uncertainty
in true width. As of March 1, 2023, composite intervals reported carry a minimum weighted average of 1 g/t Au diluted over a minimum
core length of 2m with a maximum of 4m consecutive dilution when at depths above 200m vertical depth and 2m consecutive dilution when
below 200m vertical depth. Prior to this date, all composites allowed for 2m consecutive dilution. Prior to February 18, 2022, all
composite intervals were selected visually. Included high-grade intercepts are reported as any consecutive interval with grades greater
than 10 g/t Au. Grades have not been capped in the averaging and intervals are reported as drill thickness.
| Hole No. |
Azimuth (°) |
Dip (°) |
Length (m) |
UTM E |
UTM N |
Prospect |
| NFGC-21-142 |
0 |
-45 |
220 |
657138 |
5425717 |
Knob |
| NFGC-22-642 |
300 |
-45 |
500 |
657636 |
5426511 |
TCH (Trans Canada Highway) |
| NFGC-22-704 |
100 |
-50 |
107 |
657192 |
5425868 |
Rocket |
| NFGC-22-863 |
300 |
-45 |
472 |
657573 |
5426335 |
TCH (Trans Canada Highway) |
| NFGC-22-885 |
120 |
-70 |
329 |
657272 |
5426509 |
TCW (Trans Canada West) |
| NFGC-22-906 |
165 |
-45 |
335 |
657285 |
5425980 |
Rocket |
| NFGC-22-950 |
120 |
-45 |
185 |
657218 |
5425818 |
Knob |
| NFGC-22-1005 |
200 |
-45 |
128 |
656814 |
5425185 |
Knob |
Management’s Discussion and Analysis
For the three months ended March 31, 2024 and 2023
The latest results from the TCH, Knob (Rocket
Vein) and Grouse are shown the plan map below:
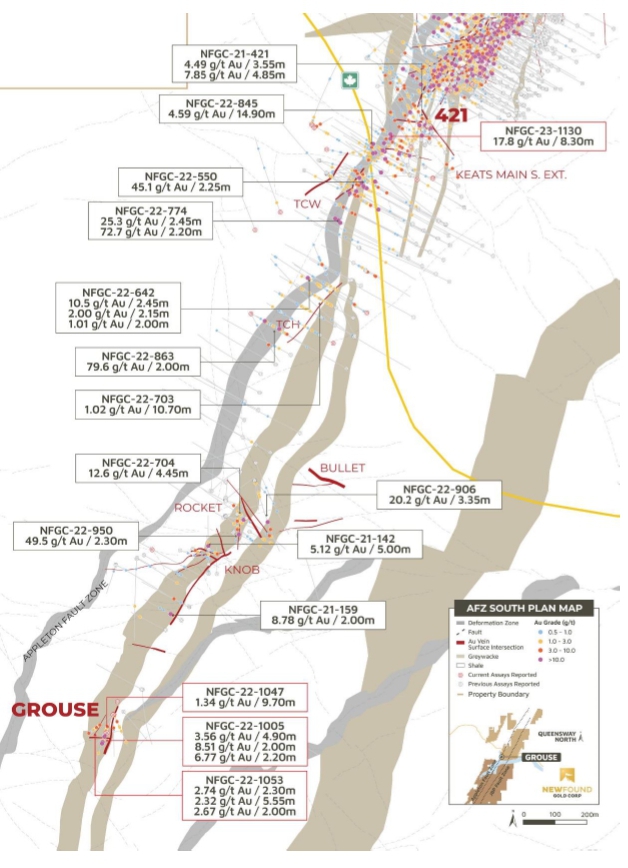
Queensway Project – Knob to Keats Main
South plan map (September 20, 2023)
Management’s Discussion and Analysis
For the three months ended March 31, 2024 and 2023
Queensway North – 3-D Seismic Program
On
March 7, 2023, the Company announced the commencement of a 3-D seismic survey being conducted by HiSeis, an Australian-based leader
in 3-D seismic technology, responsible for conducting similar surveys at numerous projects globally for the mining sector, including
at Agnico Eagle’s Fosterville Mine. This is the first survey of its kind to be conducted on the island of Newfoundland and one of
the first in North America. Its implementation will not only aid in the geologic understanding of the Queensway Project but of the entire
central Newfoundland gold belt.
The survey was planned to cover an area 5.8km
wide and spanning 8km of strike length along the AFZ and JBPFZ, encompassing known significant mineralized zones such as Keats, Keats
West, Iceberg, Golden Joint and Lotto, as well as large areas that remain undrilled. This technology provides high-resolution penetration
up to 3km below surface, with a coarser resolution to 8km depth.
Drilling completed by the Company to date has
primarily focused shallowly on the first 200m from surface and within a 200m window on either side of the AFZ. By collecting seismic data
across the known zones, the Company will be able to effectively train a 3-D dataset, with the goal of identifying similar-looking, prospective
zones both outside of this narrow window and at depth.
On August 21, 2023, the Company reported
that the seismic program acquisition phase had been completed and the program had moved into its final phase of data cleaning, compilation,
and interpretation. The survey utilized approximately 20,000 energy source points spaced at 12.5m
intervals along 260km of source lines, as well as approximately 25,000 geophone receiver stations, generating 3-D seismic data across
a 47km2 grid. Source lines were spaced at 100m intervals and perpendicular receiver lines were constructed at 100m interims
to optimize resolution from 200-1,000m in depth, with good resolution penetrating to 3,000m.
The
Company is now in possession of the final data products as announced on March 4, 2024, and is currently working with the data. The
preliminary seismic interpretation successfully outlines the presence of structures and geological features down to a depth of 2.5km that
align with known gold-bearing structures closer to surface, and points to additional lineaments that could represent new and untested
structures. A more detailed interpretation is now underway by HiSeis that will include the identification of priority targets.
Ongoing interpretation and targeting will continue throughout the lifespan of the project as new data derived from drilling is used to
continuously refine and validate the 3-D seismic interpretation for increased targeting effectiveness.
Based on the initial
results of the seismic survey, the Company has initiated deep drilling aimed at collecting geological information that will be used to
confirm the presence of structures identified in the seismic data and to further train and understand the dataset.
The details of the seismic program have been reported
in press releases on March 7, 2023, June 26, 2023, August 21, 2023, and March 4, 2024, found through SEDAR+.
Management’s Discussion and Analysis
For the three months ended March 31, 2024 and 2023
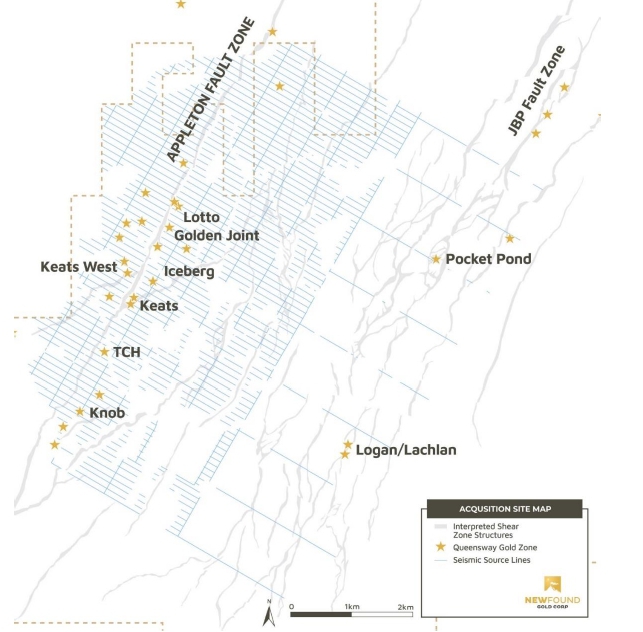
Queensway
Project – Region Covered by the Seismic Survey (March 2, 2024)
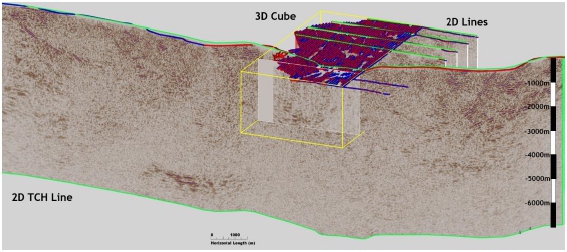
Queensway
Project – Extents of the 3-D cube and 2-D seismic lines (March 4,2024)
Management’s Discussion and Analysis
For the three months ended March 31, 2024 and 2023
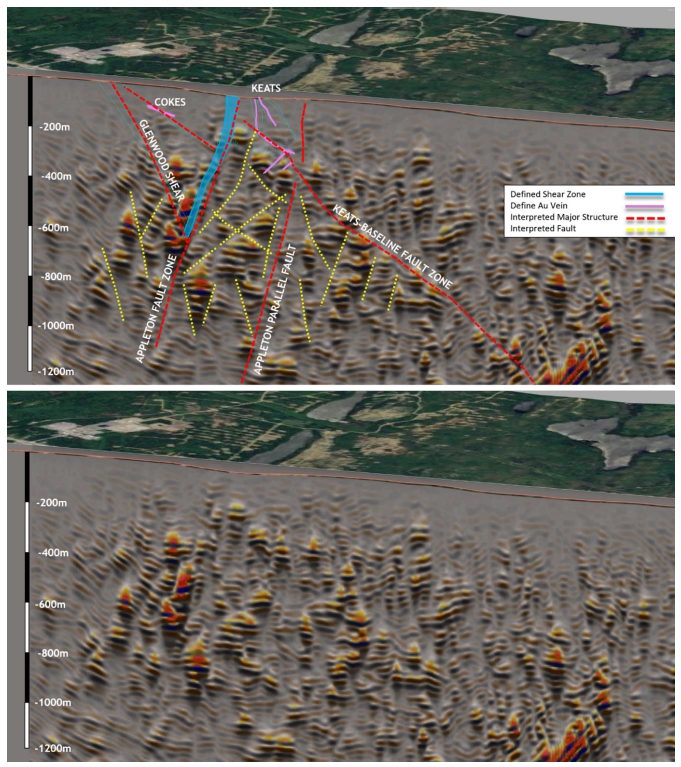
Queensway Project- Keats 3-D cube cross-section
(Pre-SDM and Pseudo Relief, looking north), Top: With interpretation, Bottom: Without interpretation.
Management’s Discussion and Analysis
For the three months ended March 31, 2024 and 2023
Regional Exploration – Queensway South
Starting in June 2020, the Company initiated
a field reconnaissance program within the QWS mineral licenses. The objective of this program was to conduct geological mapping, structural
analysis, prospecting and the collection of C horizon till samples to be processed for gold grain analysis. This work has continued each
field season through to 2023 and has evolved to include soil sampling and trenching. The goal of these field programs has been to aid
in the development of drilling targets for testing in an inaugural diamond drill program which began in 2022.
Highlight results from these field activities
include the results from the 2020 field program detailed till survey which were reported August 27, 2020, where the Company announced
it had found a new fertile gold region 45km south of the current QWN drill targets.
The Eastern Pond target is comprised of two areas
where recent till results have shown highly anomalous total gold grain counts including a high percentage of pristine gold grains and
yielded several sub-crop samples up to 15.0 g/t Au.
One
till sample yielded 216 gold grains, 163 (75%) of them classified as pristine. A second cluster of samples yielded up to 155 gold
grains with 127 (82%) of these classified as pristine. The pristine morphology of these grains indicates that they have not travelled
far from their bedrock source.
To date the Eastern Pond target is defined by
sub-crop and till sample results over an approximately 4km of strike length. Five other gold in till anomalies have been discovered to
date within QWS and warrant follow up exploration including Pauls Pond.
At Pauls Pond, an area located approximately 50km
south of the Keats Zone, continued prospecting, till and soil sampling, and trenching identified an area with a high concentration of
gold anomalies on both sides of the interpreted extension of the AFZ.
In
August 2022, a diamond drill was mobilized to the Pauls Pond area to test drill-ready targets generated from the previous field programs,
this was the first ever drilling program conducted by NFGC at QWS. This program consisted of 7,255m drilled in 33 holes over 7 target
areas including Aztec, Bernards Pond, Devils Trench, Eastern Pond, Goose, Greenwood, and Paul’s Pond.
Twenty-seven of thirty-three drill holes hit significant
gold mineralization while ten drill holes contained visible gold across four target areas in this initial drill program. Several new discoveries
were made along an 18.5km corridor that were prioritized due to the amount of gold found in the surficial environment; specific targets
tested occur on both sides of the AFZ and exhibit a combination of favourable characteristics including elevated Au-in-grab, till, and
soil samples.
At Pauls Pond, seventeen drillholes were completed
leading to three new discoveries: “Astronaut”, “Nova”, and “Nebula”, as well as the expansion of the
historic “Goose” zone. Astronaut and Nova are parallel structures located west of the AFZ that have been traced over 1,600m
and 250m of strike length, respectively. At Astronaut and Nova, eight out of nine holes drilled contained visible gold, including highlight
interval of 19.0 g/t Au over 3.15m in NFGC-QS-22-20. The Company believes these two zones connect through to the Goose zone, which if
confirmed would expand this mineralized corridor to 2.5km in strike length.
Nebula, the third discovery in the Pauls Pond
area, is located on the east side of the AFZ and drill testing of a prominent Au-in-soil anomaly with two holes identified significant
mineralization that is associated with a near-surface shear zone that returned an initial highlight result of 3.70 g/t Au over 4.30m in
NFGC-QS-22-25.
Management’s Discussion and Analysis
For the three months ended March 31, 2024 and 2023
On the east side of the AFZ drill testing of two
trenched Au-in soil and till anomalies led to two new discoveries, “Devils Pond” and “Devils Pond South”. These
zones are located 12km apart and all drillholes at both targets intersected broad domains of highly anomalous gold including highlight
intervals of 0.47 g/t Au over 8.00m and 0.37 g/t Au over 28.00m in NFGC-QS-22-15 at Devils Pond and 1.01 g/t Au over 8.80m in NFGC-QS-22-30
at Devils Pond South.
On July 26, 2023, the Company announced the
commencement of a Phase II diamond drilling program consisting of approximately 10,000m to follow up on results of its inaugural 2022
program and test new targets along an 18.5km long stretch of the AFZ at QWS. Results of the 2023 program are pending.
All previous and 2024
press releases can be found through SEDAR+.
Highlighted assay values and drill hole locations
from the Queensway South drilling are shown in the tables below:
| Hole No. |
From (m) |
To (m) |
Interval (m) |
Au (g/t) |
Zone |
| NFGC-QS-22-18 |
183.00 |
190.10 |
7.10 |
2.13 |
Astronaut |
| Including* |
186.00 |
189.70 |
3.70 |
3.85 |
| NFGC-QS-22-19 |
197.00 |
207.00 |
10.00 |
1.03 |
Astronaut |
| Including* |
199.90 |
201.95 |
2.05 |
4.29 |
| Including^ |
199.90 |
200.55 |
0.65 |
11.47 |
| NFGC-QS-22-20 |
227.45 |
232.30 |
4.85 |
12.35 |
Astronaut |
| Including* |
227.45 |
230.60 |
3.15 |
18.95 |
| Including^ |
229.10 |
229.85 |
0.75 |
72.60 |
| NFGC-QS-22-21 |
37.00 |
52.20 |
15.20 |
0.81 |
Nova |
| Including* |
37.00 |
46.50 |
9.50 |
1.09 |
| NFGC-QS-22-22 |
206.15 |
209.70 |
3.55 |
5.17 |
Astronaut |
| Including* |
207.30 |
209.30 |
2.00 |
8.88 |
| Including^ |
208.30 |
209.30 |
1.00 |
14.69 |
| NFGC-QS-22-25* |
18.55 |
22.85 |
4.30 |
3.70 |
Nebula |
| Including |
18.55 |
21.60 |
3.05 |
4.92 |
| Including |
22.25 |
22.85 |
0.60 |
1.29 |
| NFGC-QS-22-30 |
70.00 |
78.80 |
8.80 |
1.01 |
Devils Pond South |
| Including* |
72.00 |
78.80 |
6.80 |
1.17 |
At Queensway South, host structures are interpreted
to be steeply dipping and true widths are unknown at this time, additional drilling is required to assess the true width of intersected
vein structures. Composite intervals reported carry a minimum weighted average of 0.25 g/t Au diluted over a minimum core length of 2m
with a maximum of 4m consecutive dilution. Included high-grade intercepts are reported as any consecutive interval with grades greater
than 1 g/t Au. *Composite intervals reported carry a minimum weighted average of 1 g/t Au diluted over a minimum core length
of 2m with a maximum of 4m consecutive dilution. ^Included high-grade intercepts are reported as any consecutive interval with
grades greater than 10 g/t Au. Grades have not been capped in the averaging and intervals are reported as drill thickness.
| Hole No. |
Azimuth (°) |
Dip (°) |
Length (m) |
UTM E |
UTM N |
Prospect |
| NFGC-QS-22-18 |
125 |
-45 |
335 |
636772 |
5391456 |
Pauls Pond |
| NFGC-QS-22-19 |
125 |
-45 |
290 |
636528 |
5391234 |
Pauls Pond |
| NFGC-QS-22-20 |
125 |
-45 |
383 |
636731 |
5391485 |
Pauls Pond |
| NFGC-QS-22-21 |
125 |
-45 |
275 |
636434 |
5391138 |
Pauls Pond |
| NFGC-QS-22-22 |
125 |
-45 |
272 |
636333 |
5391070 |
Pauls Pond |
| NFGC-QS-22-25 |
135 |
-45 |
218 |
638312 |
5392358 |
Pauls Pond |
| NFGC-QS-22-30 |
115 |
-45 |
101 |
634043 |
5385020 |
Devils Pond South |
Management’s Discussion and Analysis
For the three months ended March 31, 2024 and 2023
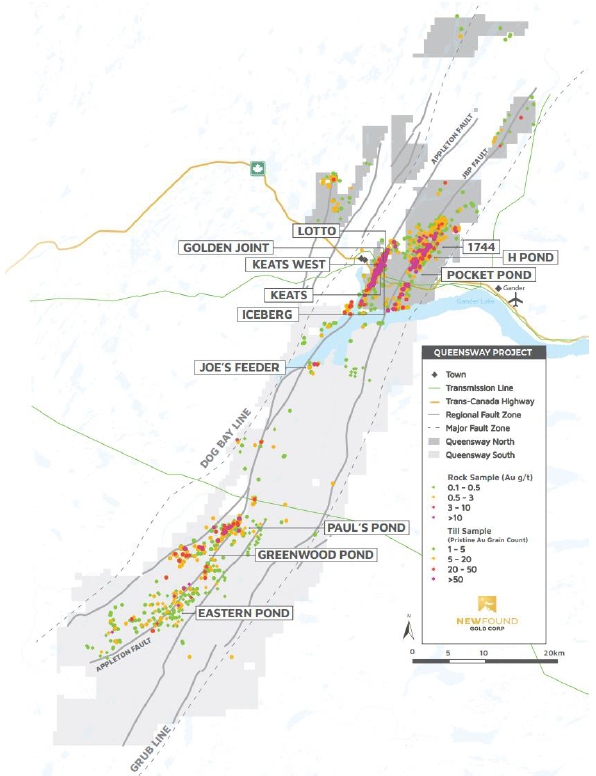
Queensway Project: Gold occurrences in rocks
and tills and major prospects
Management’s Discussion and Analysis
For the three months ended March 31, 2024 and 2023
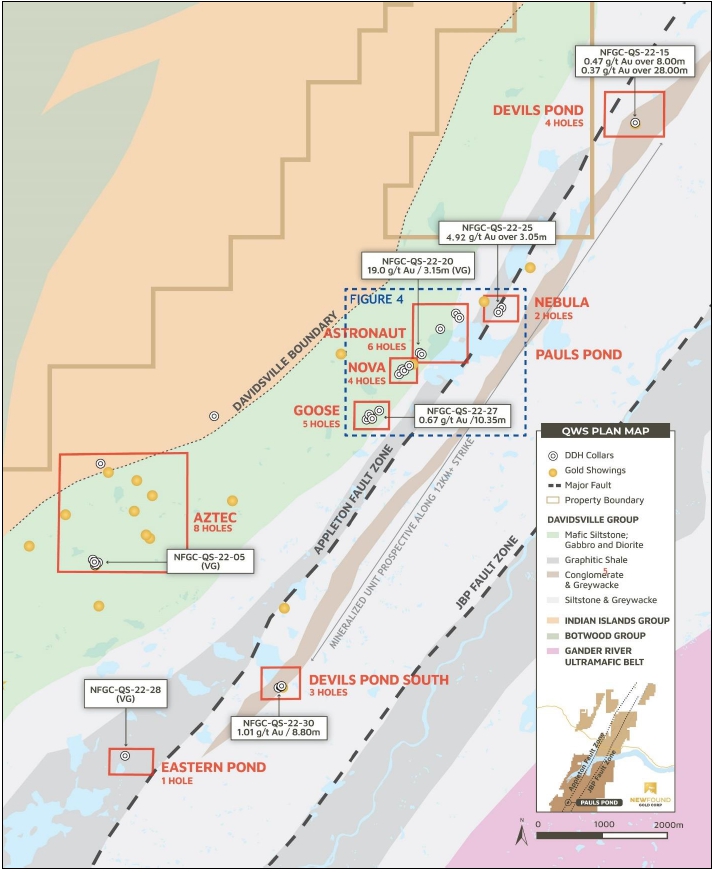
Regional drill targets at QWS
Management’s Discussion and Analysis
For the three months ended March 31, 2024 and 2023
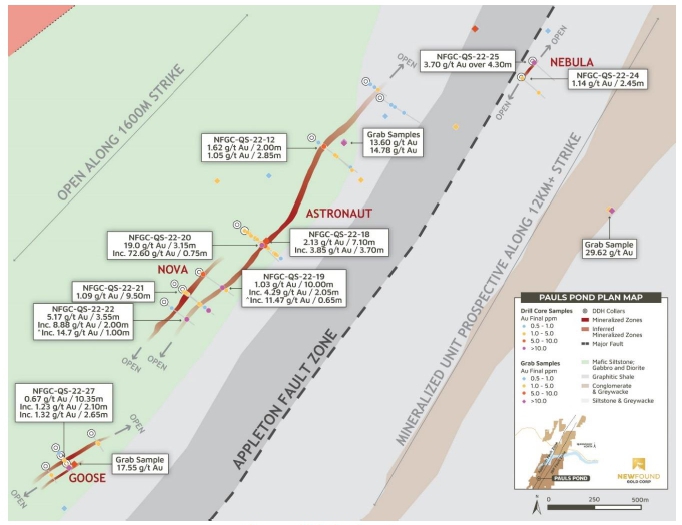
Goose – Nebula plan view map
Regional Exploration – VOA Option
In November 2022, the Company entered into
an option agreement which added approximately 6.1km of strike on the AFZ. Beginning in early 2023 a regional exploration program was launched
which involved first-pass soil sampling, mapping, and prospecting with the intention of identifying drill-targets for testing in Q3 2023.
A first phase of drilling was completed in early 2024 consisting of 6,687m in 27 holes testing 10 different target areas, the results
of this program are pending.
Sampling, Sub-sampling and Laboratory
All drilling recovers HQ core. The drill core
is split in half using a diamond saw or a hydraulic splitter for rare intersections with incompetent core.
A geologist examines the drill core and marks
out the intervals to be sampled and the cutting line. Sample lengths are mostly 1.0 meter and adjusted to respect lithological and/or
mineralogical contacts and isolate narrow (<1.0m) veins or other structures that may yield higher grades.
Technicians saw the core along the defined cutting
line. One-half of the core is kept as a witness sample and the other half is submitted for analysis. Individual sample bags are sealed
and placed into totes, which are then sealed and marked with the contents.
Management’s Discussion and Analysis
For the three months ended March 31, 2024 and 2023
New Found has submitted samples for gold determination
by fire assay to ALS Canada Ltd. (“ALS”) and by photon assay to MSALABS (“MSA”) since June 2022. As of February 2024,
gold analysis at ALS has been performed by photon assay. ALS and MSA operate under a commercial contract with New Found.
Drill core samples are shipped to ALS for sample
preparation in Sudbury, Ontario, Thunder Bay, Ontario, or Moncton, New Brunswick. ALS is an ISO-17025 accredited laboratory for the fire
assay method.
Drill core samples are also submitted to MSA in
Val-d’Or, Quebec. MSA operates numerous laboratories worldwide and maintains ISO-17025 accreditation for many metal determination
methods. MSA is an ISO-17025 accredited laboratory for the photon assay method.
At ALS for fire assay, the entire sample is crushed
to approximately 70% passing 2mm. A 3,000-g split is pulverized. “Routine” samples do not have visible gold (VG) identified
and are not within a mineralized zone. Routine samples are assayed for gold by 30-g fire assay with an inductively-couple plasma spectrometry
(ICP) finish. If the initial 30-g fire assay gold result is over 1 g/t, the remainder of the 3,000-g split is screened at 106 microns
for screened metallics assay. For the screened metallics assay, the entire coarse fraction (sized greater than 106 microns) is fire-assayed,
and two splits of the fine fraction (sized less than 106 microns) are fire-assayed. The three assays are combined on a weight-averaged
basis. Samples that have VG identified or fall within a mineralized interval are automatically submitted for screened metallic assay for
gold.
Samples submitted to ALS beginning in February 2024,
received gold analysis by photon assay whereby the entire sample is crushed to approximately 70% passing 2 mm mesh. The sample is then
riffle split and transferred into jars. For “routine” samples that do not have VG identified and are not within a mineralized
zone, one (300-500g) jar is analyzed by photon assay. If the jar assays greater than 0.8 g/t, the remaining crushed material is weighed
into multiple jars and submitted for photon assay.
For samples that have VG identified, the entire
crushed sample is riffle split and weighed into multiple jars that are submitted for photon assay. The assays from all jars are combined
on a weight-averaged basis.
At MSA, the entire sample is crushed to approximately
70% passing 2mm. For “routine” samples that do not have VG identified and are not within a mineralized zone, the samples are
riffle split to fill one 450g jar for photon assay. If the jar assays greater than 0.8 g/t, the remaining crushed material is weighed
into multiple jars and submitted for photon assay.
For samples that have VG identified, the entire
crushed sample is weighed into multiple jars and submitted for photon assay. The assays from all jars are combined on a weight-averaged
basis.
All samples prepared at ALS or MSA are also analyzed
for a multi-element ICP package (ALS method code ME-ICP61) at ALS Vancouver.
Drill program design, Quality Assurance/Quality
Control, and interpretation of results are performed by qualified persons employing a rigorous Quality Assurance/Quality Control program
consistent with industry best practices. Standards and blanks account for a minimum of 10% of the samples in addition to the laboratory’s
internal quality assurance programs.
Quality Control data are evaluated on receipt
from the laboratories for failures. Appropriate action is taken if assay results for standards and blanks fall outside allowed tolerances.
All results stated have passed New Found’s quality control protocols.
New Found’s quality control program also
includes submission of the second half of the core for approximately 2% of the drilled intervals. In addition, approximately 1% of sample
pulps for mineralized samples are submitted for re-analysis to a second ISO-accredited laboratory for check assays.
The Company does not recognize any factors of
drilling, sampling, or recovery that could materially affect the accuracy or reliability of the assay data disclosed.
Management’s Discussion and Analysis
For the three months ended March 31, 2024 and 2023
The assay data disclosed in this press release
have been verified by the Company’s Qualified Person against the original assay certificates.
The Company notes that it has not completed any
economic evaluations of its Queensway Project and that the Queensway Project does not have any resources or reserves.
Acquisition of Kingsway Project, Newfoundland
On April 21, 2024, the Company entered into
a property purchase agreement with Labrador Gold Corp. (“LabGold”) to acquire a 100% interest in LabGold’s Kingsway
Project, located near Gander, Newfoundland and Labrador, as well as certain related assets of LabGold (the “Transaction”).
As consideration, the Company will issue to LabGold such number of common shares in New Found equal to $20,000,000 divided by the closing
price of the Company’s shares on the TSX Venture Exchange (“TSX-V”) on the last trading day prior to the closing date
of the Transaction. The Transaction is subject to customary closing conditions, including LabGold shareholders and the TSX-V final approvals.
The schedules below summarize the carrying costs
of acquisition costs and exploration expenditures incurred to date for each exploration and evaluation asset that the Company is continuing
to explore as at March 31, 2024 and December 31, 2023:
| | |
Newfoundland | |
| Three
months ended March 31, 2024 | |
Queensway
$ | | |
Other
$ | | |
Total
$ | |
| Exploration and evaluation assets | |
| | | |
| | | |
| | |
| Balance as at December 31, 2023 | |
| 9,014,478 | | |
| 78,709 | | |
| 9,093,187 | |
| Additions: | |
| | | |
| | | |
| | |
| Claim staking and license renewal costs | |
| 2,400 | | |
| - | | |
| 2,400 | |
| Balance as at March 31, 2024 | |
| 9,016,878 | | |
| 78,709 | | |
| 9,095,587 | |
| | |
| | | |
| | | |
| | |
| Exploration and evaluation expenditures | |
| | | |
| | | |
| | |
| Cumulative exploration expense -
December 31, 2023 | |
| 215,285,192 | | |
| 574,857 | | |
| 215,860,049 | |
| Assays | |
| 2,605,635 | | |
| - | | |
| 2,605,635 | |
| Drilling | |
| 5,946,537 | | |
| - | | |
| 5,946,537 | |
| Environmental studies | |
| 355,144 | | |
| - | | |
| 355,144 | |
| Geochemistry | |
| 103,927 | | |
| - | | |
| 103,927 | |
| Geophysics | |
| 256,074 | | |
| - | | |
| 256,074 | |
| Imagery and mapping | |
| 28,409 | | |
| 69 | | |
| 28,478 | |
| Metallurgy | |
| 220,676 | | |
| - | | |
| 220,676 | |
| Office and general | |
| 206,081 | | |
| - | | |
| 206,081 | |
| Other | |
| 687,809 | | |
| - | | |
| 687,809 | |
| Permitting | |
| 100,956 | | |
| - | | |
| 100,956 | |
| Property taxes, mining leases and rent | |
| 81,466 | | |
| - | | |
| 81,466 | |
| Reclamation | |
| 196,577 | | |
| - | | |
| 196,577 | |
| Salaries and consulting | |
| 2,694,021 | | |
| - | | |
| 2,694,021 | |
| Seismic survey | |
| 117,583 | | |
| - | | |
| 117,583 | |
| Supplies and equipment | |
| 433,064 | | |
| - | | |
| 433,064 | |
| Travel and accommodations | |
| 241,135 | | |
| - | | |
| 241,135 | |
| Trenching | |
| 1,600 | | |
| - | | |
| 1,600 | |
| Exploration cost recovery | |
| (115,500 | ) | |
| - | | |
| (115,500 | ) |
| | |
| 14,161,194 | | |
| 69 | | |
| 14,161,263 | |
| Cumulative exploration expense –
March 31, 2024 | |
| 229,446,386 | | |
| 574,926 | | |
| 230,021,312 | |
Management’s Discussion and Analysis
For the three months ended March 31, 2024 and 2023
| | |
Newfoundland | | |
| |
| Three months ended
March 31, 2023 | |
Queensway
$ | | |
Other
$ | | |
Ontario
$ | | |
Total
$ | |
| Exploration and evaluation assets | |
| | | |
| | | |
| | | |
| | |
| Balance as at December 31, 2022 | |
| 8,616,693 | | |
| 47,916 | | |
| 272,000 | | |
| 8,936,609 | |
| Additions: | |
| | | |
| | | |
| | | |
| | |
| Claim staking and license renewal costs | |
| 2,400 | | |
| - | | |
| - | | |
| 2,400 | |
| Balance as at March 31, 2023 | |
| 8,619,093 | | |
| 47,916 | | |
| 272,000 | | |
| 8,939,009 | |
| | |
| | | |
| | | |
| | | |
| | |
| Exploration and evaluation expenditures | |
| | | |
| | | |
| | | |
| | |
| Cumulative exploration expense -
December 31, 2022 | |
| 121,302,318 | | |
| 539,998 | | |
| 3,428,034 | | |
| 125,270,350 | |
| Assays | |
| 3,076,329 | | |
| 50 | | |
| - | | |
| 3,076,379 | |
| Drilling | |
| 10,434,259 | | |
| - | | |
| - | | |
| 10,434,259 | |
| Environmental studies | |
| 213,144 | | |
| - | | |
| - | | |
| 213,144 | |
| Geochemistry | |
| 248,815 | | |
| - | | |
| - | | |
| 248,815 | |
| Geophysics | |
| 209,436 | | |
| - | | |
| - | | |
| 209,436 | |
| Imagery and mapping | |
| 40,033 | | |
| - | | |
| - | | |
| 40,033 | |
| Metallurgy | |
| 15,756 | | |
| - | | |
| - | | |
| 15,756 | |
| Office and general | |
| 238,206 | | |
| - | | |
| 144 | | |
| 238,350 | |
| Permitting | |
| 13,493 | | |
| - | | |
| - | | |
| 13,493 | |
| Property taxes, mining leases and rent | |
| 86,673 | | |
| - | | |
| 2,123 | | |
| 88,796 | |
| Reclamation | |
| 252,027 | | |
| - | | |
| - | | |
| 252,027 | |
| Salaries and consulting | |
| 2,706,338 | | |
| 9,714 | | |
| 8,000 | | |
| 2,724,052 | |
| Seismic survey | |
| 2,580,660 | | |
| - | | |
| - | | |
| 2,580,660 | |
| Supplies and equipment | |
| 1,185,869 | | |
| - | | |
| 480 | | |
| 1,186,349 | |
| Technical reports | |
| 55,025 | | |
| - | | |
| - | | |
| 55,025 | |
| Travel and accommodations | |
| 315,352 | | |
| 309 | | |
| - | | |
| 315,661 | |
| Exploration cost recovery | |
| (45,450 | ) | |
| - | | |
| - | | |
| (45,450 | ) |
| | |
| 21,625,965 | | |
| 10,073 | | |
| 10,747 | | |
| 21,646,785 | |
| Cumulative exploration expense
– March 31, 2023 | |
| 142,928,283 | | |
| 550,071 | | |
| 3,438,781 | | |
| 146,917,135 | |
Overall Performance and Results of Operations
Total assets decreased to $79,032,718 at March 31,
2024, from $84,579,493 at December 31, 2023, primarily as a result of a decrease in cash of $3,632,606, investments of $305,754,
sales taxes recoverable of $1,327,282 and investment in Kirkland Lake Discoveries Corp. of $399,864. The most significant assets at March 31,
2024 were cash of $50,252,203 (December 31, 2023: $53,884,809), investments of $3,290,838 (December 31, 2023: $3,596,592), exploration
and evaluation assets of $9,095,587 (December 31, 2023: $9,093,187), investment in Kirkland Lake Discoveries Corp. of $2,461,386
(December 31, 2023: $2,861,250), property and equipment of $7,673,794 (December 31, 2023: $7,638,608) and secured notes of $2,553,200
(December 31, 2023: $2,454,300). Cash decreased by $3,632,606 during the three months ended March 31, 2024 primarily as a result
of cash used in operating activities of $15,144,139, partially offset by gross proceeds from the issuance of common shares in the Company’s
prospectus offerings of $11,878,079 net of share issue costs of $289,038.
Management’s Discussion and Analysis
For the three months ended March 31, 2024 and 2023
Three months ended March 31, 2024 and
2023
During the three months ended March 31, 2024,
loss from operating activities decreased by $7,944,912 to $16,513,301 compared to $24,458,213 for the three months ended March 31,
2023. The decrease in loss from operating activities is largely due to:
| - | A decrease of $7,485,522 in
exploration and evaluation expenditures. Exploration and evaluation expenditures were $14,161,263 for the three months ended March 31,
2024 compared to $21,646,785 for the three months ended March 31, 2023. The Company completed approximately 28,411 meters
of drilling in 132 holes during the three months ended March 31, 2024 compared to completing approximately 50,324 meters of drilling
in 216 holes of drilling at its Queensway project and commencing a 3D seismic program during the three months ended March 31, 2023. |
| - | A decrease of $242,786 in professional fees. Professional fees were $381,692 for the three months ended
March 31, 2024 compared to $624,478 for the three months ended March 31, 2023. The Company incurred lower costs for legal and
accounting services during the three months ended March 31, 2024 compared to higher costs for legal and accounting services as a
result of increased regulatory compliance during the three months ended March 31, 2023. |
Other items
For the three months ended March 31, 2024,
other income was $3,331,089 compared to $4,405,870 for the three months ended March 31, 2023. The $1,074,781 decrease is largely
due to:
| - | A decrease of $2,047,680 in
settlement of flow-through share premium. Settlement of flow-through share premium was $3,406,912 for the three months ended March 31,
2024 compared to $5,454,592 the three months ended March 31, 2023. The Company incurred $12,474,803 of qualifying Canadian
exploration expenses and derecognized $3,406,912 of its flow-through share premium liability during the three months ended March 31,
2024. |
| - | An increase of $399,864 in loss
from equity investment. Loss from equity investment in Kirkland Lake Discoveries Corp was $399,864 for the three months ended March 31,
2024 compared to $Nil for the three months ended March 31, 2023. The increase is due to the Company’s share of comprehensive
loss for the three months ended March 31, 2024 as 32.29% equity owner in Kirkland Lake Discoveries Corp. since May 25, 2023. |
| - | An increase of $288,567 in Part XII.6
tax. Part XII.6 tax was $288,567 for the three months ended March 31, 2024 compared to $Nil for the three months ended
March 31, 2023. The Company incurred $288,567 in Part XII.6 tax in respect of unspent flow-through proceeds renounced in year
1 under the Look-Back Rules, in accordance with the Income Tax Act of Canada during the three months ended March 31, 2024. |
The decrease in other income was partially offset
by:
| - | A decrease of $1,605,691 in unrealized losses on investments. Unrealized losses on investments were $305,754
for the three months ended March 31, 2024 compared to $1,911,445 in unrealized losses on investments for the three months ended March 31,
2023. The decrease is due to changes in the fair values of investments held at March 31, 2024. |
The
Company recorded loss and comprehensive loss of $13,182,212 or $0.07 basic and diluted loss per share for the three months ended
March 31, 2024 (March 31, 2023: $20,052,343 or $0.11 basic and diluted loss per share).
Management’s Discussion and Analysis
For the three months ended March 31, 2024 and 2023
Summary of Quarterly Results
| | |
2024 | | |
2023 | | |
2022 | |
| | |
Mar. 31
$ | | |
Dec. 31
$ | | |
Sep. 30
$ | | |
Jun. 30
$ | | |
Mar. 31
$ | | |
Dec. 31
$ | | |
Sep. 30
$ | | |
Jun. 30
$ | |
| Revenues | |
- | | |
- | | |
- | | |
- | | |
- | | |
- | | |
- | | |
- | |
| Loss
and comprehensive loss for the period | |
| (13,182,212 | )(2) | |
| (20,544,297 | )(3) | |
| (23,357,516 | )(4) | |
| (15,936,607 | )(5) | |
| (20,052,343 | )(6) | |
| (24,658,958 | )(7) | |
| (18,627,388 | )(8) | |
| (24,294,494 | ) |
| Loss
per Common Share Basic(1) | |
| (0.07 | ) | |
| (0.11 | ) | |
| (0.13 | ) | |
| (0.09 | ) | |
| (0.11 | ) | |
| (0.14 | ) | |
| (0.11 | ) | |
| (0.15 | ) |
| Loss
per Common Share Diluted(1) | |
| (0.07 | ) | |
| (0.11 | ) | |
| (0.13 | ) | |
| (0.09 | ) | |
| (0.11 | ) | |
| (0.14 | ) | |
| (0.11 | ) | |
| (0.15 | ) |
| (1) | Per share amounts are rounded to the nearest cent, therefore aggregating quarterly amounts may not reconcile
to year-to-date per share amounts. |
| (2) | Decrease in loss and comprehensive loss from prior quarter primarily driven by a decrease in exploration
and evaluation expenditures of $6,323,876 and a decrease in impairment of equity investment of $1,000,237, partially offset by an increase
in share-based compensation of $344,292. |
| (3) | Decrease in loss and comprehensive loss from prior quarter primarily driven by a decrease in exploration
and evaluation expenditures of $6,460,073 and a decrease in unrealized losses on investments of $1,525,529, partially offset by a decrease
in settlement of flow-through share premium of $3,968,911 and an increase in impairment of equity investment of $1,000,237. |
| (4) | Increase in loss and comprehensive loss from prior quarter primarily driven by an increase in exploration
and evaluation expenditures of $1,984,071, an increase in salaries and consulting of $382,246, an increase in unrealized losses on investments
of $1,052,805, partially offset by a decrease in gain on sale of exploration and evaluation assets of $4,217,935. |
| (5) | Decrease in loss and comprehensive loss from prior quarter primarily driven by an increase in gain on
sale of exploration and evaluation assets of $4,217,935, an increase in settlement of flow-through share premium of $1,478,775, a decrease
in unrealized losses on investments of $1,382,266 and a decrease in professional fees of $382,614, partially offset by an increase in
exploration and evaluation expenditures of $3,314,356. |
| (6) | Decrease in loss and comprehensive loss from prior quarter primarily driven by a decrease in share-based
compensation of $6,514,473 and an increase in settlement of flow-through share premium of $774,982, partially offset by an increase in
unrealized losses on investments of $2,724,750 and an increase in exploration and evaluation expenditures of $489,264. |
| (7) | Increase in loss and comprehensive loss from prior quarter primarily driven by an increase in exploration
and evaluation expenditures of $1,438,747, an increase in share-based compensation of $6,148,741, partially offset by a decrease in realized
losses on sale of investments of $1,037,858 and an increase in unrealized gains on investments of $1,104,121. |
| (8) | Decrease in loss and comprehensive loss from prior quarter primarily driven by a decrease in net realized
losses on disposal of investments of $2,599,368 and a decrease in unrealized losses on investments of $4,916,027, partially offset by
an increase in exploration and evaluation expenditures of $2,438,298. |
Liquidity and Capital Resources
As
at March 31, 2024, the Company had cash of $50,252,203 to settle current liabilities of $14,538,865. As at March 31,
2024, the Company must also spend $33,025,621 of Qualifying CEE by December 31, 2024 to satisfy its remaining current flow-through
share premium liability of $9,019,410.
The
Company does not currently have a recurring source of revenue and has historically incurred negative cash flows from operating activities.
As at March 31, 2024, the Company has a working capital surplus, calculated as current assets less current liabilities, of
$42,477,237, consisting primarily of cash, and negative cash flow from operating activities of $15,144,139 for the three months ended
March 31, 2024.
Management’s Discussion and Analysis
For the three months ended March 31, 2024 and 2023
The Company’s exploration and evaluation
assets presently have no proven or probable reserves, and on the basis of information to date, it has not yet determined whether these
properties contain economically recoverable resources. The recoverability of amounts shown for exploration and evaluation assets are dependent
upon the existence of economically recoverable reserves, the ability of the Company to obtain necessary financing to complete the development
of those reserves and upon future profitable production.
Although the Company presently has sufficient
financial resources to cover its existing obligations and operating costs, the Company expects to require further funding in the longer
term to fund its planned programs for the next year. Management is actively targeting sources of additional financing through alliances
with financial, exploration and mining entities, or other business and financial transactions which would assure continuation of the Company’s
operations and exploration programs. In order for the Company to meet its liabilities as they come due and to continue its operations,
the Company is solely dependent upon its ability to generate such financing. These items cast significant doubt as to the Company’s
ability to continue as a going concern.
The sources of funds currently available to the
Company for its acquisition and exploration projects are solely from equity financing. The Company does not have bank debt or banking
credit facilities in place as at the date of this report.
As at March 31, 2024, the Company had the
following contractual obligations:
| Contractual obligations | |
Total
$ | | |
1 Year
$ | | |
1-3 Years
$ | | |
4-5 Years
$ | | |
After 5 Years
$ | |
| Accounts payable and accrued liabilities | |
| 5,450,827 | | |
| 5,450,827 | | |
| - | | |
| - | | |
| - | |
| Lease obligations | |
| 329,068 | | |
| 85,347 | | |
| 23,898 | | |
| 25,522 | | |
| 194,301 | |
| Total contractual obligations | |
| 5,779,895 | | |
| 5,536,174 | | |
| 23,898 | | |
| 25,522 | | |
| 194,301 | |
Property Option Agreement
On
November 2, 2022, the Company entered into a definitive property option agreement to acquire a 100% interest in five mineral licenses
located near Gander, Newfoundland. Under the terms of this agreement, the Company may exercise the option by issuing an aggregate of 487,078
common shares in the capital the Company and making aggregate cash payments of $2,350,000 to the optionors as follows:
| · | $200,000 (paid) and 39,762 common shares (issued) on the later of (i) staking confirmation date as
defined in the Option Agreement and (ii) the receipt of the TSX-Venture Exchange’s approval; |
| · | $200,000 (paid) and 39,762 common shares (issued) on or before November 2, 2023; |
| · | $250,000 and 69,583 common shares on or before November 2, 2024; |
| · | $300,000 and 89,463 common shares on or before November 2, 2025; |
| · | $600,000 and 129,224 common shares on or before November 2, 2026; and |
| · | $800,000 and 119,284 common shares on or before November 2, 2027. |
Management’s Discussion and Analysis
For the three months ended March 31, 2024 and 2023
At-the-Market Distributions (“ATM”)
Program
In
August 2022, the Company filed a prospectus supplement to its short form base shelf prospectus, pursuant to which the Company may,
at its discretion and from time-to-time, sell common shares of the Company for aggregate gross proceeds of up to US$100,000,000. The sale
of common shares is to be made through “at-the-market distributions” ("ATM"), as defined in the Canadian Securities
Administrators’ National Instrument 44-102 Shelf Distributions, directly on the TSX Venture Exchange and the NYSE American
stock exchange.
Assuming net proceeds of the maximum of US$100,000,000
(less commissions) on or before the expiry of the prospectus on August 22, 2024, the Company intends to use the net proceeds of the
offering as follows:
| Uses of Funds: |
Intended Use of Proceeds
(Estimated)
$ |
| Exploration and drilling at the Queensway Project and commissioning of mineral resource estimate |
US$51,000,000 to US$85,000,000 |
| General, corporate and administrative expenses |
US$10,000,000 to US$15,000,000 |
| Total Uses |
US$100,000,000 (less commission) |
Although the
Company intends to use the net proceeds from the offering as set forth above, the actual allocation of the net proceeds may vary from
those allocations set out above, depending on the amount raised, the time periods in which the proceeds are raised and future developments
in relation to the Company’s projects and unforeseen events.
During
the three months ended March 31, 2024, the Company sold 2,561,690 common shares of the Company under the ATM program at an
average price of $4.64 per share for gross proceeds of $11,878,079 or net proceeds of $11,553,196, and paid an aggregate commission of
$279,188.
As
at March 31, 2024, the Company completed $37,408,094 of the ATM program and has used $10,239,544 for general, corporate and administrative
expenses, and $11,255,142 for its Queensway project work programs. As at the date of this report, the Company has completed $46,917,714
of the ATM program.
Prior Financings
November 6,
2023 Financing – Net Proceeds of $53,028,996
On
November 6, 2023, the Company completed a bought-deal prospectus offering of 7,725,000 flow-through common shares at a price
of $7.25 per common share for gross proceeds of $56,006,250. The Company paid share issuance costs of $2,977,254 in cash, of which $2,357,908
was paid to the underwriters. The premium received on the flow-through shares issued was determined to be $15,295,500.
| Uses of Funds: | |
Intended Use of Proceeds (Estimated) $ | | |
Actual Use of Proceeds $ | | |
Over/(Under)-
Expenditure at March 31, 2024 $ | |
| Queensway Project work program | |
| 56,006,250 | | |
| 22,980,629 | | |
| (33,025,621 | ) |
| Total Uses | |
| 56,006,250 | | |
| 22,980,629 | | |
| (33,025,621 | ) |
Management’s Discussion and Analysis
For the three months ended March 31, 2024 and 2023
Outstanding Share Data
During the three months
ended March 31, 2024, the Company sold 2,561,690 common shares of the Company under the ATM program at an average price of $4.64
per share for gross proceeds of $11,878,079 or net proceeds of $11,553,196, and paid an aggregate commission of $279,188.
Subsequent
to March 31, 2024, the Company sold 1,914,807 common shares of the Company under the ATM program at an average price of
$5.09 per share for gross proceeds of $9,738,518 or net proceeds of $9,509,620, and paid an aggregate commission of $228,898.
Subsequent to March 31, 2024, 40,000 stock options were
granted with an exercise price of $4.78 per share and an expiry date of May 6, 2029.
Subsequent to March 31, 2024, 12,000 stock
options with an exercise price of $8.04 per share and 12,000 stock options with an exercise price of $5.68 per share were forfeited.
Subsequent
to March 31, 2024, 75,000 stock options with an exercise price of $5.68 per share, 23,625 stock options with an exercise price
of $6.79 per share and 7,500 stock options with an exercise price of $8.98 per share expired.
As
at March 31, 2024, there were 189,434,702 common shares issued and outstanding. As at the date of this report, there were
191,349,509 common shares issued and outstanding.
As
at March 31, 2024, there were 12,460,125 stock options and no warrants outstanding. As at the date of this report, there were
12,370,000 stock options and no warrants outstanding.
Related Party Transactions
All transactions with related parties have occurred
in the normal course of operations and on terms and conditions that are similar to those of transactions with unrelated parties and are
measured at the amount of consideration paid or received. A summary of the Company’s related party transactions with corporations
having similar directors and officers is as follows:
| | |
Three months ended March 31, | |
| | |
2024
$ | | |
2023
$ | |
| Amounts paid to EarthLabs Inc. (i) for exploration and evaluation | |
| 4,500 | | |
| 4,500 | |
| Amounts paid to Notz Capital Corp. (ii) for corporate development and investor relations | |
| 43,585 | | |
| - | |
| (i) | EarthLabs Inc. is a related entity having the following common director and officer to the Company: Denis
Laviolette, Director and President. |
| (ii) | Notz Capital Corp. is a related
entity of the Executive Chairman and Chief Executive Officer. |
There are no ongoing contractual commitments resulting
from these transactions with related parties.
There were no amounts payable to these related
parties as at March 31, 2024 or December 31, 2023.
Key management personnel compensation
Key management personnel include those persons
having authority and responsibility for planning, directing and controlling the activities of the Company as a whole. The Company has
determined that key management personnel consist of executive and non-executive members of the Company’s Board of Directors and
corporate officers.
Management’s Discussion and Analysis
For the three months ended March 31, 2024 and 2023
| | |
Salaries and
Consulting
$ | | |
Share-based
compensation
$ | | |
Three months
ended March 31,
2024
$ | |
| Executive Chairman and Chief Executive Officer | |
| 97,200 | | |
| - | | |
| 97,200 | |
| President | |
| 68,040 | | |
| - | | |
| 68,040 | |
| Chief Financial Officer | |
| 29,160 | | |
| - | | |
| 29,160 | |
| Chief Operating Officer | |
| 63,180 | | |
| - | | |
| 63,180 | |
| Chief Development Officer | |
| 84,240 | | |
| 33,478 | | |
| 117,718 | |
| Non-executive directors | |
| 54,000 | | |
| - | | |
| 54,000 | |
| Total | |
| 395,820 | | |
| 33,478 | | |
| 429,298 | |
| | |
Salaries and
Consulting
$ | | |
Share-based
compensation
$ | | |
Three months
ended March 31,
2023
$ | |
| Executive Chairman and Chief Executive Officer | |
| 97,200 | | |
| - | | |
| 97,200 | |
| President | |
| 68,040 | | |
| - | | |
| 68,040 | |
| Chief Financial Officer | |
| 29,160 | | |
| - | | |
| 29,160 | |
| Chief Operating Officer | |
| 63,180 | | |
| - | | |
| 63,180 | |
| Chief Development Officer | |
| 84,240 | | |
| 82,917 | | |
| 167,157 | |
| Non-executive directors | |
| 54,000 | | |
| - | | |
| 54,000 | |
| Total | |
| 395,820 | | |
| 82,917 | | |
| 478,737 | |
As
at March 31, 2024, there was $26,877 payable to key management personnel in respect of key management compensation and expense
reimbursements included in accounts payable and accrued liabilities (December 31, 2023 - $18,888). The amounts are unsecured, non-interest
bearing and without fixed terms of repayment.
Under the terms of their management agreements,
certain officers of the Company are entitled to 18 months of base pay in the event of their agreements being terminated without cause.
Risks and Uncertainties
The risks and uncertainties described in this
section are considered by management to be the most important in the context of the Company's business. The risks and uncertainties below
are not inclusive of all the risks and uncertainties the Company may be subject to and other risks may exist. The Company is in the business
of acquiring, exploring and evaluating gold properties. It is exposed to a number of risks and uncertainties that are common to other
gold mining companies. The industry is capital intensive at all stages and is subject to variations in commodity prices, market sentiment,
inflation and other risks.
Exploration Stage Company
The Company is an exploration stage company and
cannot give any assurance that a commercially viable deposit, or “reserve,” exists on any properties for which the Company
currently has or may have (through potential future joint venture agreements or acquisitions) an interest. Determination of the existence
of a reserve depends on appropriate and sufficient exploration work and the evaluation of legal, economic, and environmental factors.
If the Company fails to find a commercially viable deposit on any of its properties, its financial condition and results of operations
will be materially adversely affected.
Management’s Discussion and Analysis
For the three months ended March 31, 2024 and 2023
No Mineral Resources
Currently, there are no mineral resources (within
the meaning of NI 43-101) on any of the properties in which the Company has an interest and the Company cannot give any assurance that
any mineral resources will be identified. If the Company fails to identify any mineral resources on any of its properties, its financial
condition and results of operations will be materially adversely affected.
Reliability of Historical Information
The Company has relied on, and the disclosure
in the Queensway Technical Report is based, in part, upon, historical data compiled by previous parties involved with the Queensway Project.
To the extent that any of such historical data is inaccurate or incomplete, the Company’s exploration plans may be adversely affected.
Mineral Exploration and Development
Resource exploration and development is a speculative
business, characterized by a number of significant risks including, among other things, unprofitable efforts resulting not only from the
failure to discover mineral deposits but from finding mineral deposits which, though present, are insufficient in quantity and quality
to return a profit from production. The marketability of minerals acquired or discovered by the Company may be affected by numerous factors
which are beyond the control of the Company and which cannot be accurately predicted, such as market fluctuations, the proximity and capacity
of milling facilities, mineral markets and processing equipment and such other factors as government regulations, including regulations
relating to royalties, allowable production, importing and exporting of minerals and environmental protection, the combination of which
factors may result in the Company not receiving an adequate return of investment capital. There is no assurance that the Company’s
mineral exploration and any development activities will result in any discoveries of commercial bodies of ore. The long-term profitability
of the Company’s operations will in part be directly related to the costs and success of its exploration programs, which may be
affected by a number of factors. Substantial expenditures are required to establish reserves through drilling and to develop the mining
and processing facilities and infrastructure at any site chosen for mining. Substantial expenditures are required to establish ore reserves
through exploration and drilling, to develop metallurgical processes to extract the metal from the ore and, in the case of new properties,
to develop the mining and processing facilities and infrastructure at any site chosen for mining.
Although substantial benefits may be derived from
the discovery of a major mineralized deposit, no assurance can be given that minerals will be discovered in sufficient quantities and
grades to justify commercial operations or that funds required for development can be obtained on a timely basis.
Estimates of reserves, mineral deposits and production
costs can also be affected by such factors as environmental permitting regulations and requirements, weather, environmental factors, unforeseen
technical difficulties, unusual or unexpected geological formations and work interruptions. In addition, the grade of ore ultimately mined
may differ from that indicated by drilling results. Short term factors relating to reserves, such as the need for orderly development
of ore bodies or the processing of new or different grades, may also have an adverse effect on mining operations and on the results of
operations. Material changes in ore reserves, grades, stripping ratios or recovery rates may affect the economic viability of any project.
Competition and Mineral Exploration
The mineral exploration industry is intensely
competitive in all of its phases and the Company must compete in all aspects of its operations with a substantial number of large established
mining companies with greater liquidity, greater access to credit and other financial resources, newer or more efficient equipment, lower
cost structures, more effective risk management policies and procedures and/or greater ability than the Company to withstand losses.
Management’s Discussion and Analysis
For the three months ended March 31, 2024 and 2023
The Company's competitors may be able to respond
more quickly to new laws or regulations or emerging technologies or devote greater resources to the expansion of their operations, than
the Company can. In addition, current and potential competitors may make strategic acquisitions or establish cooperative relationships
among themselves or with third parties. Competition could adversely affect the Company's ability to acquire suitable new mineral properties
or prospects for exploration in the future. Competition could also affect the Company's ability to raise financing to fund the exploration
and development of its properties or to hire qualified personnel. The Company may not be able to compete successfully against current
and future competitors, and any failure to do so could have a material adverse effect on the Company's business, financial condition or
results of operations.
Additional Funding
The exploration and development of the Company’s
mineral properties will require substantial additional capital. When such additional capital is required, the Company will need to pursue
various financing transactions or arrangements, including joint venturing of projects, debt financing, equity financing or other means.
Additional financing may not be available when needed or, if available, the terms of such financing might not be favorable to the Company
and might involve substantial dilution to existing shareholders. The Company may not be successful in locating suitable financing transactions
in the time period required or at all. A failure to raise capital when needed would have a material adverse effect on the Company’s
business, financial condition and results of operations. Any future issuance of securities to raise required capital will likely be dilutive
to existing shareholders. In addition, debt and other debt financing may involve a pledge of assets and may be senior to interests of
equity holders. The Company may incur substantial costs in pursuing future capital requirements, including investment banking fees, legal
fees, accounting fees, securities law compliance fees, printing and distribution expenses and other costs.
The ability to obtain needed financing may be
impaired by such factors as the capital markets (both generally and in the gold and copper industries in particular), the Company’s
status as a new enterprise with a limited history, the location of the Company’s mineral properties, the price of commodities and/or
the loss of key management personnel.
Permits and Government Regulation
The future operations of the Company may require
permits from various federal, state, provincial and local governmental authorities and will be governed by laws and regulations governing
prospecting, development, mining, production, export, taxes, labour standards, occupational health, waste disposal, land use, environmental
protections, mine safety and other matters.
Although Canada has a favorable legal and fiscal
regime for exploration and mining, including a relatively simple system for the acquisition of mineral titles and relatively low tax burden,
possible future government legislation, policies and controls relating to prospecting, development, production, environmental protection,
mining taxes and labour standards could cause additional expense, capital expenditures, restrictions and delays in the activities of the
Company, the extent of which cannot be predicted. Before development and production can commence on any properties, the Company must obtain
regulatory and environmental approvals. There is no assurance that such approvals can be obtained on a timely basis or at all. The cost
of compliance, with changes in governmental regulations, has the potential to reduce the profitability of operations. The Company is currently
in compliance with all material regulations applicable to its exploration activities.
Limited Operating History
The Company has a limited operating history and
its mineral properties are exploration stage properties. As such, the Company will be subject to all of the business risks and uncertainties
associated with any new business enterprise, including under-capitalization, cash shortages, limitations with respect to personnel, financial
and other resources and lack of revenues.
Management’s Discussion and Analysis
For the three months ended March 31, 2024 and 2023
The current state of the Company’s mineral
properties require significant additional expenditures before any cash flow may be generated. Although the Company possesses an experienced
management team, there is no assurance that the Company will be successful in achieving a return on shareholders’ investment and
the likelihood of success of the Company must be considered in light of the problems, expenses, difficulties, complications and delays
frequently encountered in connection with the establishment of any business. There is no assurance that the Company can generate revenues,
operate profitably, or provide a return on investment, or that it will successfully implement its plans.
An investment in the Company’s securities
carries a high degree of risk and should be considered speculative by purchasers. There is no assurance that we will be successful in
achieving a return on shareholders’ investment and the likelihood of our success must be considered in light of our early stage
of operations. You should consider any purchase of the Company’s securities in light of the risks, expenses and problems frequently
encountered by all companies in the early stages of their corporate development.
Title Risks
Although the Company has or will receive title
opinions for any properties in which it has a material interest, there is no guarantee that title to such properties will not be challenged
or impugned. The Company has not conducted surveys on all of the claims in which it holds direct or indirect interests. The Company’s
properties may be subject to prior unregistered agreements or transfers or native land claims and title may be affected by unidentified
or unknown defects. Title insurance is generally not available for mineral properties and the Company's ability to ensure that it has
obtained secure claims to individual mineral properties or mining concessions may be constrained.
A successful challenge to the Company’s
title to a property or to the precise area and location of a property could cause delays or stoppages to the Company’s exploration,
development or operating activities without reimbursement to the Company. Any such delays or stoppages could have a material adverse
effect on the Company’s business, financial condition and results of operations.
Laws and Regulation
The Company’s exploration activities are
subject to extensive federal, provincial and local laws and regulations governing prospecting, development, production, exports, taxes,
labour standards, occupational health and safety, mine safety and other matters in all the jurisdictions in which it operates. These laws
and regulations are subject to change, can become more stringent and compliance can therefore become more costly. The Company applies
the expertise of its management, advisors, employees and contractors to ensure compliance with current laws.
Uninsured and Underinsured Risks
The Company faces and will face various risks
associated with mining exploration and the management and administration thereof. Some of these risks are not insurable; some may be the
subject of insurance which is not commercially feasible for the Company. Those insurances which are purchased will have exclusions
and deductibles which may eliminate or restrict recovery in the event of loss. In some cases, the amount of insurance purchased may
not be adequate in amount or in limit. The Company will undertake intermittent assessments of insurable risk to help ensure that the impact
of uninsured/underinsured loss is minimized within reason.
Risks
may vary from time to time within this intermittent period due to changes in such things as operations operating conditions, laws or the
climate which may leave the Company exposed to periods of additional uninsured risk. In the event risk is uninsurable, at its reasonable
and sole discretion, the Company may endeavor to implement policies and procedures, as may be applicable and/or feasible, to reduce the
risk of related loss.
Management’s Discussion and Analysis
For the three months ended March 31, 2024 and 2023
Global Economy Risk
The volatility of global capital markets over
the past several years has generally made the raising of capital by equity or debt financing more difficult. The Company may be dependent
upon capital markets to raise additional financing in the future. As such, the Company is subject to liquidity risks in meeting its operating
expenditure requirements and future development cost requirements in instances where adequate cash positions are unable to be maintained
or appropriate financing is unavailable.
These factors may impact the ability to raise
equity or obtain loans and other credit facilities in the future and on terms favourable to the Company and its management.
Our business, financial condition and results
of operations may be negatively affected by economic and other consequences from Russia’s military action against Ukraine and the
sanctions imposed in response to that action
In late February 2022, Russia launched a
large-scale military attack on Ukraine. The invasion significantly amplified already existing geopolitical tensions among Russia, Ukraine,
Europe, NATO and the West, including Canada. In response to the military action by Russia, various countries, including Canada, the United
States, the United Kingdom and European Union issued broad-ranging economic sanctions against Russia. Such sanctions included, among other
things, a prohibition on doing business with certain Russian companies, large financial institutions, officials and oligarchs; a commitment
by certain countries and the European Union to remove selected Russian banks from the Society for Worldwide Interbank Financial Telecommunications,
or SWIFT, the electronic banking network that connects banks globally; a ban of oil imports from Russia to the United States; and restrictive
measures to prevent the Russian Central Bank from undermining the impact of the sanctions. Additional sanctions may be imposed in the
future.
Such sanctions (and any future sanctions) and
other actions against Russia may adversely impact, among other things, the Russian economy and various sectors of the economy, including
but not limited to, financials, energy, metals and mining, engineering and defense and defense-related materials sectors; result in a
decline in the value and liquidity of Russian securities; result in boycotts, tariffs, and purchasing and financing restrictions on Russia’s
government, companies and certain individuals; weaken the value of the ruble; downgrade the country’s credit rating; freeze Russian
securities and/or funds invested in prohibited assets and impair the ability to trade in Russian securities and/or other assets; and have
other adverse consequences on the Russian government, economy, companies and region. Further, several large corporations and U.S. states
have announced plans to divest interests or otherwise curtail business dealings with certain Russian businesses.
The ramifications of the hostilities and sanctions
may not be limited to Russia, Ukraine and Russian and Ukrainian companies and may spill over to and negatively impact other
regional and global economic markets (including Europe, Canada and the United States), companies in other countries (particularly those
that have done business with Russia and Ukraine) and on various sectors, industries and markets for securities and commodities globally,
such as oil and natural gas. Accordingly, the actions discussed above and the potential for a wider conflict could increase financial
market volatility and cause severe negative effects on regional and global economic markets, industries, and companies. In addition, Russia
may take retaliatory actions and other countermeasures, including cyberattacks and espionage against other countries and companies around
the world, which may negatively impact such countries and companies. The extent and duration of the military action or future escalation
of such hostilities, the extent and impact of existing and future sanctions, market disruptions and volatility, and the result of any
diplomatic negotiations cannot be predicted. While we expect any direct impacts to our business to be limited, the indirect impacts on
the economy and on the mining industry and other industries in general could negatively affect our business and may make it more difficult
for us to raise equity or debt financing. In addition, the impact of other current macro-economic factors on our business, which may be
exacerbated by the war in Ukraine – including inflation, supply chain constraints and geopolitical events – is uncertain.
If these levels of volatility persist or if there is a further economic slowdown, the Company's operations, the Company's ability to raise
capital could be adversely impacted.
Management’s Discussion and Analysis
For the three months ended March 31, 2024 and 2023
Environmental Risks
The Company’s activities are subject to
extensive laws and regulations governing environment protection. The Company is also subject to various reclamation related conditions.
Although the Company closely follows and believes it is operating in compliance with all applicable environmental regulations, there can
be no assurance that all future requirements will be obtainable on reasonable terms. Failure to comply may result in enforcement actions
causing operations to cease or be curtailed and may include corrective measures requiring capital expenditures. Intense lobbying over
environmental concerns by non-governmental organizations has caused some governments to cancel or restrict development of mining projects.
Current publicized concern over climate change may lead to carbon taxes, requirements for carbon offset purchases or new regulation. The
costs or likelihood of such potential issues to the Company cannot be estimated at this time.
The legal framework governing this area is constantly
developing, therefore the Company is unable to fully ascertain any future liability that may arise from the implementation of any new
laws or regulations, although such laws and regulations are typically strict and may impose severe penalties (financial or otherwise).
The proposed activities of the Company, as with any exploration, may have an environmental impact which may result in unbudgeted delays,
damage, loss and other costs and obligations including, without limitation, rehabilitation and/or compensation.
There is also a risk that the Company’s
operations and financial position may be adversely affected by the actions of environmental groups or any other group or person opposed
in general to the Company’s activities and, in particular, the proposed exploration and mining by the Company within the Province
of Newfoundland and Labrador.
Social and Environmental Activism
There is an increasing level of public concern
relating to the effects of mining on the nature landscape, in communities and on the environment. Certain non-governmental organizations,
public interest groups and reporting organizations (“NGOs”) who oppose resource development can be vocal critics of the mining
industry. In addition, there have been many instances in which local community groups have opposed resource extraction activities, which
have resulted in disruption and delays to the relevant operation.
While the Company seeks to operate in a social
responsible manner and believes it has good relationships with local communities in the regions in which it operates, NGOs or local community
organizations could direct adverse publicity against and/or disrupt the operations of the Company in respect of one or more of its properties,
regardless of its successful compliance with social and environmental best practices, due to political factors, activities of unrelated
third parties on lands in which the Company has an interest or the Company’s operations specifically. Any such actions and the resulting
media coverage could have an adverse effect on the reputation and financial condition of the Company or its relationships with the communities
in which it operates, which could have a material adverse effect on the Company’s business, financial condition, results of operations,
cash flows or prospects.
Dependence on Management and Key Personnel
The success of the Company is currently largely
dependent on the performance of its directors and officers. The loss of the services of any of these persons could have a materially adverse
effect on the Company’s business and prospects. There is no assurance the Company can maintain the services of its directors, officers
or other qualified personnel required to operate its business. As the Company’s business activity grows, the Company will require
additional key financial, administrative and mining personnel as well as additional operations staff. There can be no assurance that these
efforts will be successful in attracting, training and retaining qualified personnel as competition for persons with these skill sets
increase. If the Company is not successful in attracting, training and retaining qualified personnel, the efficiency of its operations
could be impaired, which could have an adverse impact on the Company’s operations and financial condition.
Management’s Discussion and Analysis
For the three months ended March 31, 2024 and 2023
First Nations Land Claims
Certain of the Company’s mineral properties
may now or in the future be the subject of First Nations land claims. The legal nature of First Nations land claims is a matter of considerable
complexity. The impact of any such claim on the Company’s material interest in the Company’s mineral properties and/or potential
ownership interest in the Company’s mineral properties in the future, cannot be predicted with any degree of certainty and no assurance
can be given that a broad recognition of First Nations rights in the areas in which the Company’s mineral properties are located,
by way of negotiated settlements or judicial pronouncements, would not have an adverse effect on the Company’s activities.
Even in the absence of such recognition, the Company
may at some point be required to negotiate with and seek the approval of holders of First Nations interests in order to facilitate exploration
and development work on the Company’s mineral properties, there is no assurance that the Company will be able to establish practical
working relationships with the First Nations in the area which would allow it to ultimately develop the Company’s mineral properties.
Claims and Legal Proceedings
The Company and/or its directors and officers
may be subject to a variety of civil or other legal proceedings, with or without merit. From time to time in the ordinary course of its
business, the Company may become involved in various legal proceedings, including commercial, employment and other litigation and claims,
as well as governmental and other regulatory investigations and proceedings. Such matters can be time-consuming, divert management’s
attention and resources and cause the Company to incur significant expenses.
Furthermore, because litigation is inherently
unpredictable, the results of any such actions may have a material adverse effect on the Company’s business, operating results or
financial condition.
On November 15, 2019, ThreeD Capital Inc.
(“ThreeD”) and 1313366 Ontario Inc. (“131” and together with ThreeD, the “Plaintiffs”) each entered
into share purchase agreements (the “Share Purchase Agreements”) with Palisades Goldcorp Ltd. (“Palisades”) under
which Palisades agreed to purchase the 13,500,000 common shares owned by ThreeD and the 4,000,000 common shares owned by 131 for $0.08
per common share. The transactions closed on November 20, 2019. As a private company with restrictions on the transfer of its common
shares, the Company had to approve the proposed transfer, which it did by a consent resolution of the Board.
On March 10, 2020, ThreeD and 131 filed a
statement of claim in the Ontario Superior Court of Justice against Collin Kettell, Palisades and the Company (the “ThreeD Claim”).
Pursuant to the ThreeD Claim, the Plaintiffs are challenging the validity of the sale of 17,500,000 common shares by the Plaintiffs to
Palisades on November 20, 2019.
ThreeD and 131 claim that at the time of negotiation
and execution of the Share Purchase Agreements, Palisades and Mr. Kettell were aware of positive drill results from the Company’s
2019 Drill Program and the results were not disclosed to ThreeD and 131 to their detriment. Palisades and Mr. Kettell strongly deny
ThreeD and 131’s allegations. ThreeD and 131 have made specific claims for (a) recission of the Share Purchase Agreements on
the basis of oppression or unfair prejudice; (b) or alternatively, damages in the amount of $21,000,000 for the alleged improper
actions by ThreeD and 131, (c) a declaration that Palisades and Collin Kettell, as shareholder or director and/or officer of the
Company, have had acted in a manner that is oppressive, unfairly prejudicial or unfairly disregarded their interests, (d) a declaration
that Palisades and Collin Kettell engaged in insider trading contrary to section 138 of the Securities Act (Ontario), (e) unjust
enrichment and (f) interests and costs. Palisades and Mr. Kettell refute each of the specific claims made by the Plaintiffs.
The Company filed a statement of defence in response
to the ThreeD Claim on June 12, 2020, pursuant to which, among other things, the Company denies that it is a proper party to the
ThreeD Claim and the allegations against it therein, including because no relief is claimed against the Company in paragraph 1 of the
ThreeD Claim.
Management’s Discussion and Analysis
For the three months ended March 31, 2024 and 2023
The
action has now progressed through the production of documents and oral examinations for discovery stages. In early 2022, the Plaintiffs
formally amended their statement of claim to increase the amount claimed to $229,000,000 and to advance a direct claim of oppressive conduct
against the Company. While continuing to deny any and all liability to the Plaintiffs, the Company has amended its defence to include
specific denials of the new allegations of oppressive conduct against it. The parties completed an additional round of examinations for
discovery in January 2023, following which the plaintiffs set the action down for trial. The parties had a mediation meeting
on October 3, 2023, but were unable to settle the case. A trial date has been set for January 2025.
The
outcome of this claim cannot be determined at this time and therefore no amount has been accrued for in the financial statements for the
three months ended March 31, 2024.
Conflicts of Interest
Most of the Company’s directors and officers
do not devote their full time to the affairs of the Company. All of the directors and some of the officers of the Company are also directors,
officers and shareholders of other natural resource or public companies, and as a result they may find themselves in a position where
their duty to another company conflicts with their duty to the Company. Although the Company has policies which address such potential
conflicts and the OBCA has provisions governing directors in the event of such a conflict, none of the Company’s constating documents
or any of its other agreements contain any provisions mandating a procedure for addressing such conflicts of interest. There is no assurance
that any such conflicts will be resolved in favour of the Company. If any such conflicts are not resolved in favour of the Company, the
Company may be adversely affected.
Gold and Metal Prices
If the Company’s mineral properties are
developed from exploration properties to full production properties, the majority of our revenue will be derived from the sale of gold.
Therefore, the Company’s future profitability will depend upon the world market prices of the gold for which it is exploring. The
price of gold and other metals are affected by numerous factors beyond the Company’s control, including levels of supply and demand,
global or regional consumptive patterns, sales by government holders, metal stock levels maintained by producers and others, increased
production due to new mine developments and improved mining and production methods, speculative activities related to the sale of metals,
availability and costs of metal substitutes. Moreover, gold prices are also affected by macroeconomic factors such as expectations regarding
inflation, interest rates and global and regional demand for, and supply of, gold as well as general global economic conditions. These
factors may have an adverse effect on the Company’s exploration, development and production activities, as well as on its ability
to fund those activities.
Negative Cash Flow from Operating Activities
The Company has no history of earnings and had
negative cash flow from operating activities since inception. The Company’s mineral properties are in the exploration stage and
there are no known mineral resources or reserves and the proposed exploration programs on the Company’s mineral properties are exploratory
in nature. Significant capital investment will be required to achieve commercial production from the Company’s existing projects.
There is no assurance that any of the Company’s mineral properties will generate earnings, operate profitably or provide a return
on investment in the future. Accordingly, the Company will be required to obtain additional financing in order to meet its future cash
commitments.
Management’s Discussion and Analysis
For the three months ended March 31, 2024 and 2023
Going Concern Risk
The
Company’s financial statements have been prepared assuming the Company will continue on a going-concern basis and do not
include adjustments to amounts and classifications of assets and liabilities that might be necessary should the Company be unable to continue
operations. The ability of the Company to continue as a going concern depends upon its ability to develop profitable operations and to
continue to raise adequate financing. Management is actively targeting sources of additional financing through alliances with financial,
exploration and mining entities, or other business and financial transactions which would assure continuation of the Company’s operations
and exploration programs. In order for the Company to meet its liabilities as they come due and to continue its operations, the Company
is solely dependent upon its ability to generate such financing. These items give rise to material uncertainties that cast significant
doubt as to the Company’s ability to continue as a going concern.
Risks Associated with Acquisitions
If appropriate opportunities present themselves,
the Company may acquire mineral claims, material interests in other mineral claims, and companies that the Company believes are strategic.
The Company currently has no understandings, commitments or agreements with respect to any material acquisition, other than as described
in this MD&A, and no other material acquisition is currently being pursued. There can be no assurance that the Company will be able
to identify, negotiate or finance future acquisitions successfully, or to integrate such acquisitions with its current business. The process
of integrating an acquired Company or mineral claims into the Company may result in unforeseen operating difficulties and expenditures
and may absorb significant management attention that would otherwise be available for ongoing development of the Company’s business.
Future acquisitions could result in potentially dilutive issuances of equity securities, the incurrence of debt, contingent liabilities
and/or amortization expenses related to goodwill and other intangible assets, which could materially adversely affect the Company’s
business, results of operations and financial condition.
Force Majeure
The
Company’s projects now or in the future may be adversely affected by risks outside the control of the Company, including the price
of gold on world markets, labour unrest, civil disorder, war, subversive activities or sabotage, fires, floods, explosions or other catastrophes,
pandemics, epidemics or quarantine restrictions.
Infrastructure
Exploration, development and processing activities
depend, to one degree or another, on adequate infrastructure. Reliable roads, bridges, power sources and water supply are important elements
of infrastructure, which affect access, capital and operating costs. The lack of availability on acceptable terms or the delay in the
availability of any one or more of these items could prevent or delay exploration or development of the Company’s mineral properties.
If adequate infrastructure is not available in a timely manner, there can be no assurance that the exploration or development of the Company’s
mineral properties will be commenced or completed on a timely basis, if at all.
Furthermore, unusual or infrequent weather phenomena,
sabotage, government or other interference in the maintenance or provision of necessary infrastructure could adversely affect our operations.
Exploration operations depend on adequate infrastructure.
In particular, reliable power sources, water supply, transportation and surface facilities are necessary to explore and develop mineral
projects. Failure to adequately meet these infrastructure requirements or changes in the cost of such requirements could affect the Company’s
ability to carry out exploration and future development operations and could have a material adverse effect on the Company’s business,
financial condition, results of operations, cash flows or prospects.
Management’s Discussion and Analysis
For the three months ended March 31, 2024 and 2023
Climate Change Risks
The Company acknowledges climate change as an
international and community concern and it supports and endorses various initiatives for voluntary actions consistent with international
initiatives on climate change. However, in addition to voluntary actions, governments are moving to introduce climate change legislation
and treaties at the international, national, state/provincial and local levels. Where legislation already exists, regulation relating
to emission levels and energy efficiency is becoming more stringent. Some of the costs associated with reducing emissions can be offset
by increased energy efficiency and technological innovation. However, if the current regulatory trend continues, the Company expects that
this could result in increased costs at some of its operations in the future.
The Company and the mining industry are facing
continued geotechnical challenges, which could adversely impact the Company’s production and profitability. Unanticipated adverse
geotechnical and hydrological conditions, such as landslides, floods, seismic activity, droughts and pit wall failures, may occur in the
future and such events may not be detected in advance. Geotechnical instabilities and adverse climatic conditions can be difficult to
predict and are often affected by risks and hazards outside of the Company’s control, such as severe weather and considerable rainfall.
Geotechnical failures could result in limited or restricted access to mine sites, suspension of operations, government investigations,
increased monitoring costs, remediation costs, loss of ore and other impacts, which could cause one or more of the Company’s projects
to be less profitable than currently anticipated and could result in a material adverse effect on the Company’s business results
of operations and financial position.
Information Systems and Cyber Security
The
Company’s operations depend on information technology (“IT”) systems. These IT systems could be subject to network
disruptions caused by a variety of sources, including computer viruses, security breaches and cyber-attacks, as well as disruptions resulting
from incidents such as cable cuts, damage to physical plants, natural disasters, terrorism, fire, power loss, vandalism and theft.
The Company’s operations also depend on
the timely maintenance, upgrade and replacement of networks, equipment, IT systems and software, as well as pre-emptive expenses
to mitigate the risks of failures. Any of these and other events could result in information system failures, delays and/or increase in
capital expenses. The failure of information systems or a component of information systems could, depending on the nature of any such
failure, adversely impact the Company’s reputation and results of operations.
Although to date the Company has not experienced
any material losses relating to cyber-attacks or other information security breaches, there can be no assurance that the Company will
not incur such losses in the future. The Company’s risk and exposure to these matters cannot be fully mitigated because of, among
other things, the evolving nature of these threats. As a result, cyber security and the continued development and enhancement of controls,
processes and practices designed to protect systems, computers, software, data and networks from attack, damage or unauthorized access
remain a priority. As cyber threats continue to evolve, the Company may be required to expend additional resources to continue to modify
or enhance protective measures or to investigate and remediate any security vulnerabilities.
Critical Accounting Policies and Estimates
The Company prepares its financial statements
using accounting policies consistent with IFRS as issued by the IASB.
The preparation of the financial statements requires
management to make certain estimates, judgments and assumptions that affect the reported amounts of assets and liabilities at the date
of the financial statements and reported amounts of expenses during the reporting period. Actual outcomes could differ from these estimates.
Management’s Discussion and Analysis
For the three months ended March 31, 2024 and 2023
The financial statements include estimates which,
by their nature, are uncertain. The impacts of such estimates are pervasive throughout the financial statements, and may require accounting
adjustments based on future occurrences. Revisions to accounting estimates are recognized in the period in which the estimate is revised
and future periods if the revision affects both current and future periods. These estimates are based on historical experience, current
and future economic conditions and other factors, including expectations of future events that are believed to be reasonable under the
circumstances.
In
preparing the condensed interim financial statements for the three months ended March 31, 2024 and 2023, the Company applied
the critical judgments and estimates disclosed in Note 2 of its audited financial statements for the year ended December 31, 2023.
Financial Risk Management
The Company is exposed in varying degrees to a
variety of financial instrument related risks. The Board approves and monitors the risk management processes.
Credit risk
Credit
risk is the risk that one party to a financial instrument will fail to discharge an obligation and cause the other party to incur a financial
loss. The Company is subject to the credit through its investment in Maritime secured notes, in which case the maximum exposure to the
credit risk is the full value of the secured notes of $2,553,200 at March 31, 2024. Interest receivable on Maritime secured
notes is collected quarterly. Sales taxes recoverable are due from the Canada Revenue Agency and the Company places its cash with financial
institutions with high credit ratings, therefore in management’s judgment, credit risk related to sales taxes recoverable and cash
is low.
There have been no changes in management’s
methods for managing credit risk since December 31, 2023.
Liquidity risk
Liquidity
risk is the risk that the Company will not be able to meet its financial obligations as they fall due. The Company has in place a planning
and budgeting process to help determine the funds required to ensure the Company has the appropriate liquidity to meet its operating and
growth objectives. The Company has historically relied on issuance of shares to fund exploration programs and may require doing so again
in the future. As at March 31, 2024, the Company has total liabilities of $14,607,816 and cash of $50,252,203 which is available
to discharge these liabilities (December 31, 2023 – total liabilities of $19,076,473 and cash of $53,884,809). As at March 31,
2024, the Company must spend another $33,025,621 of Qualifying CEE by December 31, 2024 to satisfy its remaining current flow-through
liability of $9,019,410.
There have been no changes in management’s
methods for managing liquidity risk since December 31, 2023.
Market risk
Market risk is the risk that changes in market
prices, such as commodity prices, interest rates and foreign exchange rates will affect the Company’s net earnings or the value
of financial instruments. The objective of the Company is to manage and mitigate market risk exposures within acceptable limits, while
maximizing returns.
Management’s Discussion and Analysis
For the three months ended March 31, 2024 and 2023
Financial
instruments that impact the Company’s net earnings or other comprehensive income due to currency fluctuation include cash accounts,
secured notes, interest receivable, investments and accounts payable and accrued liabilities denominated in US dollars. The sensitivity
of the Company’s net loss to changes in the exchange rate between the US dollar and the Canadian dollar at March 31,
2024 would change the Company’s net loss by $364,982 as a result of a 10% change in the exchange rate.
Interest rate risk is the risk that the fair value
of future cash flows of a financial instrument will fluctuate due to changes in market interest rates. As the Company deposits its cash
into demand accounts with minimal interest rates, the interest rate risk is not significant. Interest receivable on secured notes is determined
based on a floating interest rate and therefore subject to interest rate fluctuations, the interest rate risk is not material.
| (iii) | Commodity price risk |
Commodity price risk is defined as the potential
adverse impact on earnings and economic value due to commodity price movements and volatilities. The Company’s property has exposure
to predominantly gold. Commodity prices, especially gold, greatly affect the value of the Company and the potential value of its property
and investments.
Equity
price risk is the risk that the fair value of or future cash flows from the Company’s financial instruments will significantly fluctuate
because of changes in market prices. The Company is exposed to market risk in trading its investments in unfavorable market conditions
which could result in dispositions of investments at less than favorable prices. Additionally, the Company adjusts its investments to
fair value at the end of each reporting period. This process could result in write-downs of the Company’s investments over one or
more reporting periods, particularly during periods of overall market instability. The sensitivity of the Company’s net loss to
changes in market prices at March 31, 2024 would change the Company’s net loss by $329,084 as a result of a 10% change
in the market price of its investments.
There have been no changes in management’s
methods for managing market risks since December 31, 2023.
Disclosure Controls and Procedures
The Company’s management, with the participation
of its Chief Executive Officer (“CEO”) and Chief Financial Officer (“CFO”), has evaluated the effectiveness of
the Company’s disclosure controls and procedures. Based upon the results of that evaluation, the Company’s CEO and CFO have
concluded that, as of March 31, 2024, the Company’s disclosure controls and procedures were effective to provide reasonable
assurance that the information required to be disclosed by the Company in reports it files is recorded, processed, summarized and reported,
within the appropriate time periods and is accumulated and communicated to management, including the CEO and CFO, as appropriate to allow
timely decisions regarding required disclosure.
Management’s Discussion and Analysis
For the three months ended March 31, 2024 and 2023
Internal Control over Financial Reporting
The Company’s management has
determined that there have been no significant changes in the Company’s internal control over financial reporting during the
quarter ended March 31, 2024, that have materially affected, or are reasonably likely to materially affect, the Company’s
internal control over financial reporting. Any system of internal control over financial reporting, no matter how well designed, has
inherent limitations. As a result, even those systems determined to be effective can only provide reasonable assurance regarding the
preparation of financial statements.
Cautionary Notes Regarding Forward-Looking Statements
This MD&A contains forward looking statements
which reflect management's expectations regarding the Company’s future growth, results from operations (including, without limitation,
statements about the Company’s opportunities, strategies, competition, expected activities and expenditures as the Company pursues
its business plan, the adequacy of the Company’s available cash resources and other statements about future events or results),
performance (both operational and financial) and business prospects, future business plans and opportunities. Wherever possible, words
such as “expects”, “plans”, “anticipates”, “believes”, “interpreted”, “intends”,
“estimates”, “projects”, “aims”, “suggests”, “appears”, “indicate”,
“often”, “target”, “future”, “likely”, “pending”, “potential”,
“goal”, “objective”, “prospective”, “possibly”, “preliminary”, “initial”,
and similar expressions or statements that certain actions, events or results “may”, “could”, “would”,
“might” or “will” be taken, occur or be achieved, or the negative or grammatical variation thereof or other variations
thereof, or comparable terminology have been used to identify forward-looking statements. These forward-looking statements include, among
other things, statements relating to the Queensway Project and the Company’s planned and future exploration on the Queensway Project
and its other mineral properties; the Company’s goals regarding exploration and potential development of its projects; the Company’s
future business plans; expectations regarding the ability to raise further capital; the market price of gold; expectations regarding any
environmental issues that may affect planned or future exploration and development programs and the potential impact of complying with
existing and proposed environmental laws and regulations; the ability to retain and/or maintain any require permits, licenses or other
necessary approvals for the exploration or development of its mineral properties; government regulation of mineral exploration and development
operations in the Province of Newfoundland and Labrador; the Company’s compensation policy and practices; the Company’s expected
reliance on key management personnel, advisors and consultants; effects of the conflict in Ukraine.
Forward-looking statements are not a guarantee
of future performance and is based upon a number of estimates and assumptions of management in light of management’s experience
and perception of trends, current conditions and expected developments, as well as other factors that management believes to be relevant
and reasonable in the circumstances.
As of the date of this MD&A, without limitation,
assumptions about: the ability to raise any necessary additional capital on reasonable terms to advance exploration and development of
the Company’s mineral properties; future prices of gold and other metal prices; the timing and results of exploration and drilling
programs; the demand for, and price of gold; that general business and economic conditions will not change in a material adverse manner;
the Company’s ability to procure equipment and operating supplies in sufficient quantities and on a timely basis; the geology of
the Queensway Project as described in the Queensway Technical Report; the accuracy of budgeted exploration and development costs and expenditures;
future currency exchange rates and interest rates; operating conditions being favourable such that the Company is able to operate in a
safe, efficient and effective manner; the Company’s ability to attract and retain skilled personnel; political and regulatory stability;
the receipt of governmental, regulatory and third-party approvals, licenses and permits on favourable terms; obtaining required renewals
for existing approvals, licenses and permits on favourable terms; requirements under applicable laws; sustained labour stability; stability
in financial and capital goods markets; availability of equipment.
Management’s Discussion and Analysis
For the three months ended March 31, 2024 and 2023
Furthermore, such forward-looking information
involves a variety of known and unknown risks, uncertainties and other factors which may cause the actual plans, intentions, activities,
results, performance or achievements of the Company to be materially different from any future plans, intentions, activities, results,
performance or achievements expressed or implied by such forward-looking statements.
Such
risks include, without limitation: the Company may fail to find a commercially viable deposit at any of its mineral properties; there
are no resources or mineral reserves on any of the properties in which the Company has an interest; the Company’s plans may be adversely
affected by the Company’s reliance on historical data compiled by previous parties involved with its mineral properties; mineral
exploration and development are inherently risky; the mineral exploration industry is intensely competitive; additional financing may
not be available to the Company when required or, if available, the terms of such financing may not be favourable to the Company; fluctuations
in the demand for gold; the Company may not be able to identify, negotiate or finance any future acquisitions successfully, or to integrate
such acquisitions with its current business; the Company’s exploration activities are dependent upon the grant of appropriate licenses,
concessions, leases, permits and regulatory consents, which may be withdrawn or not granted; the Company’s operations could be adversely
affected by possible future government legislation, policies and controls or by changes in applicable laws and regulations; there is no
guarantee that title to the properties in which the Company has a material interest will not be challenged or impugned; the Company
faces various risks associated with mining exploration that are not insurable or may be the subject of insurance which is not commercially
feasible for the Company; the volatility of global capital markets over the past several years has generally made the raising of capital
more difficult; compliance with environmental regulations can be costly; social and environmental activism can negatively impact exploration,
development and mining activities; the success of the Company is largely dependent on the performance of its directors and officers; the
Company’s operations may be adversely affected by First Nations land claims; the Company and/or its directors and officers may be
subject to a variety of legal proceedings, the results of which may have a material adverse effect on the Company’s business; the
Company may be adversely affected if potential conflicts of interests involving its directors and officers are not resolved in favour
of the Company; the Company’s future profitability may depend upon the world market prices of gold; dilution from future equity
financing could negatively impact holders of the Company’s securities; failure to adequately meet infrastructure requirements could
have a material adverse effect on the Company’s business; the Company’s projects now or in the future may be adversely affected
by risks outside the control of the Company; the Company is subject to various risks associated with climate change; other factors discussed
under “Risk and Uncertainties”.
Although the Company has attempted to identify
important factors that could cause actual actions, events, conditions, results, performance or achievements to differ materially from
those described in forward-looking statements, there may be other factors that cause actions, events, conditions, results, performance
or achievements to differ from those anticipated, estimated or intended.
The Company cautions that the foregoing lists
of important assumptions and factors are not exhaustive. Other events or circumstances could cause actual results to differ materially
from those estimated or projected and expressed in, or implied by, the forward-looking statements contained herein. There can be no assurance
that forward-looking statements will prove to be accurate, as actual results and future events could differ materially from those anticipated
in such information. Accordingly, readers should not place undue reliance on forward-looking statements.
Forward-looking statements contained herein are
made as of the date of this MD&A and the Company disclaims any obligation to update or revise any forward-looking statements, whether
as a result of new information, future events or results or otherwise, except as and to the extent required by applicable securities laws.
Management’s Discussion and Analysis
For the three months ended March 31, 2024 and 2023
Off-Balance Sheet Arrangements
The Company does not utilize off-balance sheet
arrangements.
Proposed Transactions
There are no proposed transactions at the date
of this report.
Additional Information
Additional information relating to the Company
is available on SEDAR+ at www.sedarplus.ca.
New Found Gold (AMEX:NFGC)
Historical Stock Chart
From Sep 2024 to Oct 2024

New Found Gold (AMEX:NFGC)
Historical Stock Chart
From Oct 2023 to Oct 2024
