0001109242 False 0001109242 2025-01-28 2025-01-28 iso4217:USD xbrli:shares iso4217:USD xbrli:shares
UNITED STATES
SECURITIES AND EXCHANGE COMMISSION
Washington, D.C. 20549
_________________
FORM 8-K
_________________
CURRENT REPORT
Pursuant to Section 13 or 15(d)
of the Securities Exchange Act of 1934
Date of Report (Date of earliest event reported): January 28, 2025
HANMI FINANCIAL CORPORATION
(Exact name of registrant as specified in its charter)
| Delaware | 000-30421 | 95-4788120 |
| (State or Other Jurisdiction of Incorporation) | (Commission File Number) | (I.R.S. Employer Identification No.) |
900 Wilshire Boulevard, Suite 1250
Los Angeles, CA 90017
(Address of Principal Executive Offices) (Zip Code)
(213) 382-2200
(Registrant's telephone number, including area code)
Not Applicable
(Former name or former address, if changed since last report)
Check the appropriate box below if the Form 8-K filing is intended to simultaneously satisfy the filing obligation of the registrant under any of the following provisions:
| ☐ | Written communications pursuant to Rule 425 under the Securities Act (17 CFR 230.425) |
| ☐ | Soliciting material pursuant to Rule 14a-12 under the Exchange Act (17 CFR 240.14a-12) |
| ☐ | Pre-commencement communications pursuant to Rule 14d-2(b) under the Exchange Act (17 CFR 240.14d-2(b)) |
| ☐ | Pre-commencement communications pursuant to Rule 13e-4(c) under the Exchange Act (17 CFR 240.13e-4(c)) |
Securities registered pursuant to Section 12(b) of the Act:
| Title of each class | Trading Symbol(s) | Name of each exchange on which registered |
| Common Stock, $0.001 par value | HAFC | Nasdaq Global Select Market |
Indicate by check mark whether the registrant is an emerging growth company as defined in Rule 405 of the Securities Act of 1933 (§230.405 of this chapter) or Rule 12b-2 of the Securities Exchange Act of 1934 (§240.12b-2 of this chapter).
Emerging growth company ☐
If an emerging growth company,indicate by check mark if the registrant has elected not to use the extended transition period for complying with any new or revised financial accounting standards provided pursuant to Section 13(a) of the Exchange Act. ☐
Item 2.02. Results of Operations and Financial Condition.
On January 28, 2025, Hanmi Financial Corporation (“Hanmi Financial”) issued a press release announcing its financial results for the quarter ended December 31, 2024. A copy of the press release is attached as Exhibit 99.1 to this Form 8-K. In connection therewith, Hanmi Financial provided a supplemental presentation on its website at https://investors.hanmi.com. A copy of the supplemental presentation is attached hereto as Exhibit 99.2.
This information set forth under “Item 2.02. Results of Operations and Financial Condition,” including Exhibit 99.1 and 99.2 attached hereto, shall not be deemed “filed” for purposes of Section 18 of the Securities and Exchange Act of 1934, as amended (the “Exchange Act”) or otherwise subject to the liabilities of that section, nor shall it be deemed incorporated by reference in any filing under the Securities Act of 1933, as amended, or the Exchange Act, regardless of any general incorporation language in such filing.
Item 9.01. Financial Statements and Exhibits.
(d) Exhibits
Forward-Looking Statements
This press release contains forward-looking statements, which are included in accordance with the “safe harbor” provisions of the Private Securities Litigation Reform Act of 1995. All statements other than statements of historical fact are “forward–looking statements” for purposes of federal and state securities laws, including, but not limited to, statements about our anticipated future operating and financial performance, financial position and liquidity, business strategies, regulatory and competitive outlook, investment and expenditure plans, capital and financing needs and availability, plans and objectives of management for future operations, developments regarding our capital and strategic plans, and other similar forecasts and statements of expectation and statements of assumption underlying any of the foregoing. In some cases, you can identify forward-looking statements by terminology such as “may,” “will,” “should,” “could,” “expects,” “plans,” “intends,” “anticipates,” “believes,” “estimates,” “predicts,” “potential,” or “continue,” or the negative of such terms and other comparable terminology. Although we believe that our forward-looking statements to be reasonable, we cannot guarantee future results, levels of activity, performance or achievements.
Forward-looking statements involve known and unknown risks, uncertainties and other factors that may cause our actual results, levels of activity, performance or achievements to differ from those expressed or implied by the forward-looking statements. These factors include the following:
- a failure to maintain adequate levels of capital and liquidity to support our operations;
- general economic and business conditions internationally, nationally and in those areas in which we operate, including any potential recessionary conditions;
- volatility and deterioration in the credit and equity markets;
- changes in consumer spending, borrowing and savings habits;
- availability of capital from private and government sources;
- demographic changes;
- competition for loans and deposits and failure to attract or retain loans and deposits;
- inflation and fluctuations in interest rates that reduce our margins and yields, the fair value of financial instruments, the level of loan originations or prepayments on loans we have made and make, the level of loan sales and the cost we pay to retain and attract deposits and secure other types of funding;
- our ability to enter new markets successfully and capitalize on growth opportunities;
- the imposition of tariffs or other domestic or international governmental polices impacting the value of the products of our borrowers;
- the current or anticipated impact of military conflict, terrorism or other geopolitical events;
- the effect of potential future supervisory action against us or Hanmi Bank and our ability to address any issues raised in our regulatory exams;
- risks of natural disasters;
- legal proceedings and litigation brought against us;
- a failure in or breach of our operational or security systems or infrastructure, including cyberattacks;
- the failure to maintain current technologies;
- risks associated with Small Business Administration loans;
- failure to attract or retain key employees;
- our ability to access cost-effective funding;
- changes in liquidity, including the size and composition of our deposit portfolio and the percentage of uninsured deposits in the portfolio;
- fluctuations in real estate values;
- changes in accounting policies and practices;
- changes in governmental regulation, including, but not limited to, any increase in FDIC insurance premiums and changes in the monetary policies of the U.S. Treasury and the Board of Governors of the Federal Reserve System;
- the ability of Hanmi Bank to make distributions to Hanmi Financial Corporation, which is restricted by certain factors, including Hanmi Bank’s retained earnings, net income, prior distributions made, and certain other financial tests;
- strategic transactions we may enter into;
- the adequacy of and changes in the methodology for computing our allowance for credit losses;
- our credit quality and the effect of credit quality on our credit losses expense and allowance for credit losses;
- changes in the financial performance and/or condition of our borrowers and the ability of our borrowers to perform under the terms of their loans and other terms of credit agreements;
- our ability to control expenses; and
- cyber security and fraud risks against our information technology and those of our third-party providers and vendors.
In addition, we set forth certain risks in our reports filed with the U.S. Securities and Exchange Commission, including, Item 1A of our Annual Report on Form 10-K for the year ended December 31, 2023, our Quarterly Reports on Form 10-Q, and Current Reports on Form 8-K that we will file hereafter, which could cause actual results to differ from those projected. We undertake no obligation to update such forward-looking statements except as required by law.
SIGNATURES
Pursuant to the requirements of the Securities Exchange Act of 1934, the registrant has duly caused this report to be signed on its behalf by the undersigned hereunto duly authorized.
| | HANMI FINANCIAL CORPORATION |
| | | |
| | | |
| Date: January 28, 2025 | By: | /s/ Bonita I. Lee |
| | | Bonita I. Lee |
| | | Chief Executive Officer |
| | | |
EXHIBIT 99.1
Hanmi Reports 2024 Fourth Quarter and Full Year Results
LOS ANGELES, Jan. 28, 2025 (GLOBE NEWSWIRE) -- Hanmi Financial Corporation (NASDAQ: HAFC, or “Hanmi”), the parent company of Hanmi Bank (the “Bank”), today reported financial results for the fourth quarter of 2024 and full year.
Net income for the fourth quarter of 2024 was $17.7 million, or $0.58 per diluted share, compared with $14.9 million, or $0.49 per diluted share, for the third quarter of 2024. The return on average assets for the fourth quarter of 2024 was 0.93% and the return on average equity was 8.89%, compared with a return on average assets of 0.79% and a return on average equity of 7.55% for the third quarter of 2024.
For the full year of 2024, net income was $62.2 million, or $2.05 per diluted share, compared with $80.0 million, or $2.62 per diluted share, for 2023. The return on average assets for 2024 was 0.83% and the return on average equity was 7.97%.
CEO Commentary
“Hanmi achieved exceptional results in the fourth quarter, delivering our best quarterly performance of the year and closing 2024 with strong momentum,” said Bonnie Lee, President and Chief Executive Officer. “Our team’s outstanding execution generated significant earnings growth fueled by our net interest margin expansion of 17 basis points to 2.91%, disciplined expense management, and vigilant credit administration. These robust results highlight the strength of our relationship-driven banking model.”
“For the full year, we had a number of key accomplishments to advance our growth and diversification strategy. We delivered 16% growth in our C&I loan portfolio, driven primarily by the strong contribution from our Corporate Korea initiative. Noninterest-bearing demand deposits grew by 5% and now represent 33% of our total deposits. Finally, through our proactive monitoring of the portfolio and our successful resolution efforts, we further improved asset quality with nonperforming assets as a percentage of total assets decreasing to 0.19%.”
“With our strong capital foundation, we are well positioned to execute on our growth strategy. Our performance is the result of our team’s unwavering dedication to serving our customers and the communities in which we operate. I want to thank each of them for their continued commitment to deliver long-term value for our shareholders,” concluded Lee.
Fourth Quarter 2024 Highlights:
- Fourth quarter net income was $17.7 million, or $0.58 per diluted share, up 18.8% from $14.9 million, or $0.49 per diluted share for the third quarter of 2024. The increase reflects a $3.4 million, or 6.8%, increase in net interest income, primarily due to a decrease in interest expense on deposits.
- Loans receivable were $6.25 billion at December 31, 2024, essentially unchanged from the end of the third quarter of 2024; loan production for the fourth quarter was $339.0 million, with a weighted average interest rate of 7.37%, compared with loan production for the third quarter of $347.8 million, with a weighted average interest rate of 7.92%.
- Deposits were $6.44 billion at December 31, 2024, up 0.5% from the end of the third quarter of 2024; noninterest-bearing demand deposits were 32.6% of total deposits. During the quarter, noninterest-bearing demand deposits grew 2.2%, while time deposits declined 2.0% from the prior quarter.
- Net interest income for the fourth quarter was $53.4 million, up 6.8% from the third quarter of 2024. Net interest margin (taxable equivalent) increased 17 basis points to 2.91%; the average yield on loans declined three basis points to 5.97%, while the cost of interest-bearing deposits fell 31 basis points to 3.96%.
- Credit loss expense for the fourth quarter was $0.9 million, a decrease from $2.3 million for the prior quarter. The allowance for credit losses increased $1.0 million to $70.1 million at December 31, 2024, or 1.12% of loans. For the fourth quarter, net loan recoveries were $0.1 million.
- Asset quality remained strong, as nonperforming loans declined by 7.9% to $14.3 million, or 0.23% of loans, which included pay-offs of $1.8 million, while criticized loans increased to $165.3 million, as special mention loans increased to $139.6 million and classified loans fell to $25.7 million.
For more information about Hanmi, please see the Q4 2024 Investor Update (and Supplemental Financial Information), which is available on the Bank’s website at www.hanmi.com and via a current report on Form 8-K on the website of the Securities and Exchange Commission at www.sec.gov. Also, please refer to “Non-GAAP Financial Measures” herein for further details of the presentation of certain non-GAAP financial measures.
Quarterly Highlights
(Dollars in thousands, except per share data)
| | As of or for the Three Months Ended | | | Amount Change | |
| | December 31,
| September 30,
| | June 30, | | | March 31, | | | December 31,
| | Q4-24 | | | Q4-24 | |
| | 2024 | | | 2024 | | | 2024 | | | 2024 | | | 2023 | | | vs. Q3-24 | | | vs. Q4-23 | |
| | | | | | | | | | | | | | | | | | | | | |
| Net income | $ | 17,695 | | | $ | 14,892 | | | $ | 14,451 | | | $ | 15,164 | | | $ | 18,633 | | | $ | 2,803 | | | $ | (938 | ) |
| Net income per diluted common share | $ | 0.58 | | | $ | 0.49 | | | $ | 0.48 | | | $ | 0.50 | | | $ | 0.61 | | | $ | 0.09 | | | $ | (0.03 | ) |
| | | | | | | | | | | | | | | | | | | | | |
| Assets | $ | 7,677,925 | | | $ | 7,712,299 | | | $ | 7,586,347 | | | $ | 7,512,046 | | | $ | 7,570,341 | | | $ | (34,374 | ) | | $ | 107,584 | |
| Loans receivable | $ | 6,251,377 | | | $ | 6,257,744 | | | $ | 6,176,359 | | | $ | 6,177,840 | | | $ | 6,182,434 | | | $ | (6,367 | ) | | $ | 68,943 | |
| Deposits | $ | 6,435,776 | | | $ | 6,403,221 | | | $ | 6,329,340 | | | $ | 6,376,060 | | | $ | 6,280,574 | | | $ | 32,555 | | | $ | 155,202 | |
| | | | | | | | | | | | | | | | | | | | | |
| Return on average assets | | 0.93 | % | | | 0.79 | % | | | 0.77 | % | | | 0.81 | % | | | 0.99 | % | | | 0.14 | | | | -0.06 | |
| Return on average stockholders' equity | | 8.89 | % | | | 7.55 | % | | | 7.50 | % | | | 7.90 | % | | | 9.70 | % | | | 1.34 | | | | -0.81 | |
| | | | | | | | | | | | | | | | | | | | | |
| Net interest margin | | 2.91 | % | | | 2.74 | % | | | 2.69 | % | | | 2.78 | % | | | 2.92 | % | | | 0.17 | | | | -0.01 | |
| Efficiency ratio (1) | | 56.79 | % | | | 59.98 | % | | | 62.24 | % | | | 62.42 | % | | | 58.86 | % | | | -3.19 | | | | -2.07 | |
| | | | | | | | | | | | | | | | | | | | | |
| Tangible common equity to tangible assets (2) | | 9.41 | % | | | 9.42 | % | | | 9.19 | % | | | 9.23 | % | | | 9.14 | % | | | -0.01 | | | | 0.27 | |
| Tangible common equity per common share (2) | $ | 23.88 | | | $ | 24.03 | | | $ | 22.99 | | | $ | 22.86 | | | $ | 22.75 | | | | -0.15 | | | | 1.14 | |
| | | | | | | | | | | | | | | | | | | | | |
| | | | | | | | | | | | | | | | | | | | | |
| (1) Noninterest expense divided by net interest income plus noninterest income. | | | | | | | | | | |
| (2) Refer to "Non-GAAP Financial Measures" for further details. | | | | | | | | | | |
Results of Operations
Net interest income for the fourth quarter was $53.4 million, up 6.8% from $50.1 million for the third quarter of 2024. The increase was primarily due to a decrease in deposit interest expense. The decrease in deposit interest expense was primarily a result of decreases in deposit rates and the average balances of interest-bearing deposits, coupled with a 3.1% increase in the average balance of noninterest-bearing demand deposits. The rate on deposits for the fourth quarter decreased 31 basis points to 3.96%, from 4.27% for the third quarter of 2024. The average balance of interest-bearing deposits decreased to $4.36 billion for the fourth quarter of 2024, from $4.40 billion for the third quarter. The average balance of noninterest-bearing deposits for the fourth quarter increased to $1.97 billion, from $1.91 billion for the third quarter of 2024. Net interest margin (taxable equivalent) for the fourth quarter was 2.91%, up 17 basis points from 2.74% for the third quarter of 2024.
Net interest income was $202.8 million for the full year of 2024 compared with $221.3 million for 2023, a decline of 8.4%. The decrease reflected higher interest rates during 2024 compared with 2023, including an increase in the cost of interest-bearing deposits, partially offset by an increase in interest-earning asset yields. The cost of interest-bearing deposits for 2024 year increased 81 basis points to 4.16% from 3.35% for 2023. The yield on average interest-earning assets for 2024 increased 31 basis points to 5.46% from 5.15% for 2023. The average balance of interest-bearing deposits for 2024 increased to $4.39 billion from $4.02 billion for 2023. The average balance of interest-earning assets for 2024 year increased 1.7% to $7.30 billion from $7.18 billion for 2023. The average balance of loans for 2024 year was $6.11 billion, up 2.4% from $5.97 billion for 2023. Net interest margin (taxable-equivalent) for 2024 year was 2.78% compared with 3.08% for 2023. The 30 basis point decrease in the net interest margin reflected the increase in the cost of interest-bearing deposits, partially offset by the increase in average loan yields.
| | For the Three Months Ended (in thousands) | | | Percentage Change | |
| | Dec 31, | | | Sep 30, | | | Jun 30, | | | Mar 31, | | | Dec 31, | | | Q4-24 | | | Q4-24 | |
| Net Interest Income | 2024 | | | 2024 | | | 2024 | | | 2024 | | | 2023 | | | vs. Q3-24 | | | vs. Q4-23 | |
| | | | | | | | | | | | | | | | | | | | | |
| Interest and fees on loans receivable(1) | $ | 91,545 | | | $ | 92,182 | | | $ | 90,752 | | | $ | 91,674 | | | $ | 89,922 | | | | -0.7 | % | | | 1.8 | % |
| Interest on securities | | 5,866 | | | | 5,523 | | | | 5,238 | | | | 4,955 | | | | 4,583 | | | | 6.2 | % | | | 28.0 | % |
| Dividends on FHLB stock | | 360 | | | | 356 | | | | 357 | | | | 361 | | | | 341 | | | | 1.1 | % | | | 5.6 | % |
| Interest on deposits in other banks | | 2,342 | | | | 2,356 | | | | 2,313 | | | | 2,604 | | | | 2,337 | | | | -0.6 | % | | | 0.2 | % |
| Total interest and dividend income | $ | 100,113 | | | $ | 100,417 | | | $ | 98,660 | | | $ | 99,594 | | | $ | 97,183 | | | | -0.3 | % | | | 3.0 | % |
| | | | | | | | | | | | | | | | | | | | | |
| Interest on deposits | | 43,406 | | | | 47,153 | | | | 46,495 | | | | 45,638 | | | | 40,277 | | | | -7.9 | % | | | 7.8 | % |
| Interest on borrowings | | 1,634 | | | | 1,561 | | | | 1,896 | | | | 1,655 | | | | 2,112 | | | | 4.7 | % | | | -22.6 | % |
| Interest on subordinated debentures | | 1,624 | | | | 1,652 | | | | 1,649 | | | | 1,646 | | | | 1,654 | | | | -1.7 | % | | | -1.8 | % |
| Total interest expense | | 46,664 | | | | 50,366 | | | | 50,040 | | | | 48,939 | | | | 44,043 | | | | -7.4 | % | | | 6.0 | % |
| Net interest income | $ | 53,449 | | | $ | 50,051 | | | $ | 48,620 | | | $ | 50,655 | | | $ | 53,140 | | | | 6.8 | % | | | 0.6 | % |
| | | | | | | | | | | | | | | | | | | | | |
| (1) Includes loans held for sale. | | | | | | | | | | | | | | | | | | | | |
| | For the Three Months Ended (in thousands)
| | | Percentage Change
| |
| Average Earning Assets and Interest-bearing Liabilities | | Dec 31,
2024 | | | | Sep 30,
2024 | | | | Jun 30,
2024 | | | | Mar 31,
2024 | | | | Dec 31,
2023 | | | | Q4-24
vs. Q3-24 | | | | Q4-24
vs. Q4-23 | |
| Loans receivable (1) | $ | 6,103,264 | | | $ | 6,112,324 | | | $ | 6,089,440 | | | $ | 6,137,888 | | | $ | 6,071,644 | | | | -0.1 | % | | | 0.5 | % |
| Securities | | 998,313 | | | | 986,041 | | | | 979,671 | | | | 969,520 | | | | 961,551 | | | | 1.2 | % | | | 3.8 | % |
| FHLB stock | | 16,385 | | | | 16,385 | | | | 16,385 | | | | 16,385 | | | | 16,385 | | | | 0.0 | % | | | 0.0 | % |
| Interest-bearing deposits in other banks | | 204,408 | | | | 183,027 | | | | 180,177 | | | | 201,724 | | | | 181,140 | | | | 11.7 | % | | | 12.8 | % |
| Average interest-earning assets | $ | 7,322,370 | | | $ | 7,297,777 | | | $ | 7,265,673 | | | $ | 7,325,517 | | | $ | 7,230,720 | | | | 0.3 | % | | | 1.3 | % |
| | | | | | | | | | | | | | | | | | | | | |
| Demand: interest-bearing | $ | 79,784 | | | $ | 83,647 | | | $ | 85,443 | | | $ | 86,401 | | | $ | 86,679 | | | | -4.6 | % | | | -8.0 | % |
| Money market and savings | | 1,934,540 | | | | 1,885,799 | | | | 1,845,870 | | | | 1,815,085 | | | | 1,669,973 | | | | 2.6 | % | | | 15.8 | % |
| Time deposits | | 2,346,363 | | | | 2,427,737 | | | | 2,453,154 | | | | 2,507,830 | | | | 2,417,803 | | | | -3.4 | % | | | -3.0 | % |
| Average interest-bearing deposits | | 4,360,687 | | | | 4,397,183 | | | | 4,384,467 | | | | 4,409,316 | | | | 4,174,455 | | | | -0.8 | % | | | 4.5 | % |
| Borrowings | | 141,604 | | | | 143,479 | | | | 169,525 | | | | 162,418 | | | | 205,951 | | | | -1.3 | % | | | -31.2 | % |
| Subordinated debentures | | 130,567 | | | | 130,403 | | | | 130,239 | | | | 130,088 | | | | 129,933 | | | | 0.1 | % | | | 0.5 | % |
| Average interest-bearing liabilities | $ | 4,632,858 | | | $ | 4,671,065 | | | $ | 4,684,231 | | | $ | 4,701,822 | | | $ | 4,510,339 | | | | -0.8 | % | | | 2.7 | % |
| | | | | | | | | | | | | | | | | | | | | |
| Average Noninterest Bearing Deposits | | | | | | | | | | | | | | | | | | | | |
| Demand deposits - noninterest bearing | $ | 1,967,789 | | | $ | 1,908,833 | | | $ | 1,883,765 | | | $ | 1,921,189 | | | $ | 2,025,212 | | | | 3.1 | % | | | -2.8 | % |
| | | | | | | | | | | | | | | | | | | | | |
| (1) Includes loans held for sale. | | | | | | | | | | | | | | | | | | | | |
| | For the Three Months Ended | | | Yield/Rate Change | |
| | Dec 31, | | | Sep 30, | | | Jun 30, | | | Mar 31, | | | Dec 31, | | | Q4-24 | | | Q4-24 | |
| Average Yields and Rates | 2024 | | | 2024 | | | 2024 | | | 2024 | | | 2023 | | | vs. Q3-24 | | | vs. Q4-23 | |
| Loans receivable(1) | | 5.97 | % | | | 6.00 | % | | | 5.99 | % | | | 6.00 | % | | | 5.88 | % | | | -0.03 | | | | 0.09 | |
| Securities (2) | | 2.38 | % | | | 2.27 | % | | | 2.17 | % | | | 2.07 | % | | | 1.93 | % | | | 0.11 | | | | 0.45 | |
| FHLB stock | | 8.75 | % | | | 8.65 | % | | | 8.77 | % | | | 8.87 | % | | | 8.25 | % | | | 0.10 | | | | 0.50 | |
| Interest-bearing deposits in other banks | | 4.56 | % | | | 5.12 | % | | | 5.16 | % | | | 5.19 | % | | | 5.12 | % | | | -0.56 | | | | -0.56 | |
| Interest-earning assets | | 5.45 | % | | | 5.48 | % | | | 5.46 | % | | | 5.47 | % | | | 5.34 | % | | | -0.03 | | | | 0.11 | |
| | | | | | | | | | | | | | | | | | | | | |
| Interest-bearing deposits | | 3.96 | % | | | 4.27 | % | | | 4.27 | % | | | 4.16 | % | | | 3.83 | % | | | -0.31 | | | | 0.13 | |
| Borrowings | | 4.59 | % | | | 4.33 | % | | | 4.50 | % | | | 4.10 | % | | | 4.07 | % | | | 0.26 | | | | 0.52 | |
| Subordinated debentures | | 4.97 | % | | | 5.07 | % | | | 5.07 | % | | | 5.06 | % | | | 5.09 | % | | | -0.10 | | | | -0.12 | |
| Interest-bearing liabilities | | 4.01 | % | | | 4.29 | % | | | 4.30 | % | | | 4.19 | % | | | 3.88 | % | | | -0.28 | | | | 0.13 | |
| | | | | | | | | | | | | | | | | | | | | |
| Net interest margin (taxable equivalent basis) | | 2.91 | % | | | 2.74 | % | | | 2.69 | % | | | 2.78 | % | | | 2.92 | % | | | 0.17 | | | | -0.01 | |
| | | | | | | | | | | | | | | | | | | | | |
| Cost of deposits | | 2.73 | % | | | 2.97 | % | | | 2.98 | % | | | 2.90 | % | | | 2.58 | % | | | -0.24 | | | | 0.15 | |
| | | | | | | | | | | | | | | | | | | | | |
| (1) Includes loans held for sale. | | | | | | | | | | | | | | | | | | | | |
| (2) Amounts calculated on a fully taxable equivalent basis using the federal tax rate in effect for the periods presented. | | | | | | | |
Credit loss expense for the fourth quarter was $0.9 million, compared with $2.3 million for the third quarter of 2024. Fourth quarter credit loss expense included a $0.9 million credit loss expense for loan losses. Fourth quarter net loan recoveries were $0.1 million, compared to third quarter net loan charge-offs of $0.9 million.
Credit loss expense was $4.4 million for 2024, compared with $4.3 million for 2023. The credit loss expense for 2024 was comprised of a $4.8 million credit loss expense for loan losses and a $0.4 million credit loss expense recovery for off-balance sheet items. 2023 credit loss expense was comprised of a $4.9 million credit loss expense for loan losses and a $0.6 million credit loss expense recovery for off-balance sheet items.
Noninterest income for the fourth quarter decreased $1.0 million, or 12.8%, to $7.4 million, from $8.4 million for the third quarter of 2024. The decrease was primarily due to a $0.9 million gain from the sale and leaseback of a branch property included in third quarter noninterest income. Gains on sales of SBA loans were $1.4 million for the fourth quarter of 2024, compared with $1.5 million for the third quarter of 2024. The volume of SBA loans sold for the fourth quarter decreased to $21.6 million, from $23.0 million for the third quarter of 2024, while trade premiums were 8.53% for the fourth quarter of 2024, slightly lower than 8.54% for the third quarter. Mortgage loans sold for the fourth quarter were $18.3 million, with a premium of 1.96%, compared with $20.9 million and 2.32% for the third quarter. Gains on mortgage loans sold were $0.3 million for both quarters.
Noninterest income decreased $2.6 million, or 7.6%, to $31.6 million for 2024, from $34.2 million for 2023, primarily due to a $4.0 million gain on the sale-and-leaseback of a branch property in 2023 and a $0.8 million decrease in service charges on deposits. Those items were partially offset by a $1.5 million gain on the sale of mortgage loans and a $0.9 million gain from the sale and leaseback of a branch property in 2024. The volume of SBA loans sold in 2024 declined to $93.7 million, from $100.5 million for 2023, while trade premiums increased to 8.18% for 2024, from 7.12% for 2023.
| | For the Three Months Ended (in thousands) | | | Percentage Change | |
| | Dec 31, | | | Sep 30, | | | Jun 30, | | | Mar 31, | | | Dec 31, | | | Q4-24 | | | Q4-24 | |
| Noninterest Income | 2024 | | | 2024 | | | 2024 | | | 2024 | | | 2023 | | | vs. Q3-24 | | | vs. Q4-23 | |
| Service charges on deposit accounts | $ | 2,192 | | | $ | 2,311 | | | $ | 2,429 | | | $ | 2,450 | | | $ | 2,391 | | | | -5.1 | % | | | -8.3 | % |
| Trade finance and other service charges and fees | | 1,364 | | | | 1,254 | | | | 1,277 | | | | 1,414 | | | | 1,245 | | | | 8.8 | % | | | 9.6 | % |
| Servicing income | | 668 | | | | 817 | | | | 796 | | | | 712 | | | | 772 | | | | -18.2 | % | | | -13.5 | % |
| Bank-owned life insurance income (expense) | | 316 | | | | 320 | | | | 638 | | | | 304 | | | | (29 | ) | | | -1.3 | % | | N/M | |
| All other operating income | | 1,037 | | | | 1,008 | | | | 908 | | | | 928 | | | | 853 | | | | 2.9 | % | | | 21.6 | % |
| Service charges, fees & other | | 5,577 | | | | 5,710 | | | | 6,048 | | | | 5,808 | | | | 5,232 | | | | -2.3 | % | | | 6.6 | % |
| | | | | | | | | | | | | | | | | | | | | |
| Gain on sale of SBA loans | | 1,443 | | | | 1,544 | | | | 1,644 | | | | 1,482 | | | | 1,448 | | | | -6.5 | % | | | -0.3 | % |
| Gain on sale of mortgage loans | | 337 | | | | 324 | | | | 365 | | | | 443 | | | | - | | | | 4.0 | % | | | 0.0 | % |
| Gain on sale of bank premises | | - | | | | 860 | | | | - | | | | - | | | | - | | | | -100.0 | % | | | 0.0 | % |
| Total noninterest income | $ | 7,357 | | | $ | 8,438 | | | $ | 8,057 | | | $ | 7,733 | | | $ | 6,680 | | | | -12.8 | % | | | 10.1 | % |
| | | | | | | | | | | | | | | | | | | | | |
| N/M - Not meaningful. | | | | | | | | | | | | | | | | | | | | |
Noninterest expense for the fourth quarter decreased by $0.6 million to $34.5 million from $35.1 million for the third quarter of 2024. The decrease primarily reflects a $1.6 million gain on the sale of an other real estate owned property. Absent this gain, fourth quarter noninterest expense was up 3.1% sequentially, due to increases in advertising and promotion expense and legal fees from collections and business activities. In addition, other operating expense for the fourth quarter included a $0.5 million charge related to an SBA loan acquired in a previous acquisition, while the third quarter included a $0.3 million reimbursement for property taxes. The efficiency ratio for the fourth quarter was 56.8%, compared with 60.0% for the third quarter of 2024.
Noninterest expense increased by $4.8 million, or 3.5%, to $141.3 million for 2024, from $136.5 million for 2023. The increase reflected a $2.0 million, or 2.4%, increase in salaries and benefits, a $1.2 million increase in data processing expense, a $0.7 million increase in professional fees, and a $1.4 million increase in other operating expenses. Decreases of $0.2 million in occupancy and equipment expense and $0.2 million in supplies and communication expense partially offset the increases. The efficiency ratio for 2024 increased to 60.3%, from 53.5% for 2023, primarily due to higher expenses and lower revenue.
| | For the Three Months Ended (in thousands) | | | Percentage Change | |
| | Dec 31, | | | Sep 30, | | | Jun 30, | | | Mar 31, | | | Dec 31, | | | Q4-24 | | | Q4-24 | |
| | 2024 | | | 2024 | | | 2024 | | | 2024 | | | 2023 | | | vs. Q3-24 | | | vs. Q4-23 | |
| Noninterest Expense | | | | | | | | | | | | | | | | | | | | |
| Salaries and employee benefits | $ | 20,498 | | | $ | 20,851 | | | $ | 20,434 | | | $ | 21,585 | | | $ | 20,062 | | | -1.7 | % | | 2.2 | % |
| Occupancy and equipment | | 4,503 | | | | 4,499 | | | | 4,348 | | | | 4,537 | | | | 4,604 | | | 0.1 | % | | -2.2 | % |
| Data processing | | 3,800 | | | | 3,839 | | | | 3,686 | | | | 3,551 | | | | 3,487 | | | -1.0 | % | | 9.0 | % |
| Professional fees | | 1,821 | | | | 1,492 | | | | 1,749 | | | | 1,893 | | | | 1,977 | | | 22.1 | % | | -7.9 | % |
| Supplies and communication | | 551 | | | | 538 | | | | 570 | | | | 601 | | | | 613 | | | 2.4 | % | | -10.1 | % |
| Advertising and promotion | | 821 | | | | 631 | | | | 669 | | | | 907 | | | | 990 | | | 30.1 | % | | -17.1 | % |
| All other operating expenses | | 3,847 | | | | 2,875 | | | | 3,251 | | | | 3,160 | | | | 3,252 | | | 33.8 | % | | 18.3 | % |
| Subtotal | | 35,841 | | | | 34,725 | | | | 34,707 | | | | 36,234 | | | | 34,985 | | | 3.2 | % | | 2.4 | % |
| | | | | | | | | | | | | | | | | | | | | |
| Branch consolidation expense | | - | | | | - | | | | 301 | | | | - | | | | - | | | 0.0 | % | | 0.0 | % |
| Other real estate owned (income) expense | | (1,588 | ) | | | 77 | | | | 6 | | | | 22 | | | | 15 | | | N/M | | | N/M | |
| Repossessed personal property expense | | 281 | | | | 278 | | | | 262 | | | | 189 | | | | 211 | | | 1.1 | % | | 33.2 | % |
| Total noninterest expense | $ | 34,534 | | | $ | 35,080 | | | $ | 35,276 | | | $ | 36,445 | | | $ | 35,211 | | | -1.6 | % | | -1.9 | % |
| | | | | | | | | | | | | | | | | | | | | |
| N/M - Not meaningful. | | | | | | | | | | | | | | | | | | | | |
Hanmi recorded a provision for income taxes of $7.6 million for the fourth quarter of 2024, compared with $6.2 million for the third quarter of 2024, representing an effective tax rate of 30.1% and 29.5%, respectively. The effective tax rates for 2024 and 2023 years were 29.8% and 30.1%, respectively.
Financial Position
Total assets at December 31, 2024, decreased 0.4%, or $33.7 million, to $7.68 billion from $7.71 billion at September 30, 2024. The decrease reflected a $45.8 million decrease in loans held-for-sale and a $6.4 million decrease in loans, offset partially by a $17.0 million increase in cash and due from banks. From December 31, 2023, total assets increased 1.4%, or $108.2 million. This year-over-year increase reflected a 1.1%, or $68.9 million, growth in loans receivable, and a 4.6%, or $40.1 million increase in securities, supported by a 2.5%, or $155.2 million increase in deposits.
Loans receivable, before allowance for credit losses, were $6.25 billion at December 31, 2024, down from $6.26 billion at September 30, 2024.
Loans held-for-sale were $8.6 million at December 31, 2024, down from $54.3 million at September 30, 2024. At the end of the fourth quarter, loans held-for-sale consisted of the guaranteed portion of SBA 7(a) loans. The prior quarter included $18.3 million of residential mortgage loans and a $27.2 million nonaccrual loan, all of which were sold in the fourth quarter.
| | As of (in thousands) | | | Percentage Change | |
| | Dec 31, | | | Sep 30, | | | Jun 30, | | | Mar 31, | | | Dec 31, | | | Q4-24 | | | Q4-24 | |
| | 2024 | | | 2024 | | | 2024 | | | 2024 | | | 2023 | | | vs. Q3-24 | | | vs. Q4-23 | |
| Loan Portfolio | | | | | | | | | | | | | | | | | | | | |
| Commercial real estate loans | $ | 3,949,622 | | | $ | 3,932,088 | | | $ | 3,888,505 | | | $ | 3,878,677 | | | $ | 3,889,739 | | | | 0.4 | % | | 1.5 | % |
| Residential/consumer loans | | 951,302 | | | | 939,285 | | | | 954,209 | | | | 970,362 | | | | 962,661 | | | | 1.3 | % | | -1.2 | % |
| Commercial and industrial loans | | 863,431 | | | | 879,092 | | | | 802,372 | | | | 774,851 | | | | 747,819 | | | | -1.8 | % | | 15.5 | % |
| Equipment finance | | 487,022 | | | | 507,279 | | | | 531,273 | | | | 553,950 | | | | 582,215 | | | | -4.0 | % | | -16.4 | % |
| Loans receivable | | 6,251,377 | | | | 6,257,744 | | | | 6,176,359 | | | | 6,177,840 | | | | 6,182,434 | | | | -0.1 | % | | 1.1 | % |
| Loans held for sale | | 8,579 | | | | 54,336 | | | | 10,467 | | | | 3,999 | | | | 12,013 | | | | -84.2 | % | | -28.6 | % |
| Total | $ | 6,259,956 | | | $ | 6,312,080 | | | $ | 6,186,826 | | | $ | 6,181,839 | | | $ | 6,194,447 | | | | -0.8 | % | | 1.1 | % |
| | As of | |
| | Dec 31, | | | Sep 30, | | | Jun 30, | | | Mar 31, | | | Dec 31, | |
| | 2024 | | | 2024 | | | 2024 | | | 2024 | | | 2023 | |
| Composition of Loan Portfolio | | | | | | | | | | | | | | |
| Commercial real estate loans | 63.1 | % | | 62.3 | % | | 62.9 | % | | 62.7 | % | | 62.8 | % |
| Residential/consumer loans | 15.2 | % | | 14.9 | % | | 15.4 | % | | 15.7 | % | | 15.5 | % |
| Commercial and industrial loans | 13.8 | % | | 13.9 | % | | 13.0 | % | | 12.5 | % | | 12.1 | % |
| Equipment finance | 7.8 | % | | 8.0 | % | | 8.5 | % | | 9.0 | % | | 9.4 | % |
| Loans receivable | 99.9 | % | | 99.1 | % | | 99.8 | % | | 99.9 | % | | 99.8 | % |
| Loans held for sale | 0.1 | % | | 0.9 | % | | 0.2 | % | | 0.1 | % | | 0.2 | % |
| Total | 100.0 | % | | 100.0 | % | | 100.0 | % | | 100.0 | % | | 100.0 | % |
New loan production was $339.0 million for the fourth quarter of 2024 at an average rate of 7.37%, while payoffs were $137.9 million during the quarter at an average rate of 6.78%.
Commercial real estate loan production for the fourth quarter of 2024 was $146.7 million. Commercial and industrial loan production was $60.2 million, SBA loan production was $49.7 million, equipment finance production was $42.2 million, and residential mortgage loan production was $40.2 million.
New loan production for 2024 was $1.20 billion, a decrease of 7.4%, or $96.0 million, from $1.29 billion for the full year 2023. The average rate for new loan production for 2024 was 7.87% compared with 7.66% for 2023. Payoffs for 2024 were $450.2 million with an average rate of 7.34% compared with $386.0 million and 7.13% for 2023.
| | For the Three Months Ended (in thousands) | |
| | Dec 31, | | | Sep 30, | | | Jun 30, | | | Mar 31, | | | Dec 31, | |
| | 2024 | | | 2024 | | | 2024 | | | 2024 | | | 2023 | |
| New Loan Production | | | | | | | | | | | | | | |
| Commercial real estate loans | $ | 146,716 | | | $ | 110,246 | | | $ | 87,632 | | | $ | 60,085 | | | $ | 178,157 | |
| Commercial and industrial loans | | 60,159 | | | | 105,086 | | | | 59,007 | | | | 50,789 | | | | 52,079 | |
| SBA loans | | 49,740 | | | | 51,616 | | | | 54,486 | | | | 30,817 | | | | 48,432 | |
| Equipment finance | | 42,168 | | | | 40,066 | | | | 42,594 | | | | 39,155 | | | | 57,334 | |
| Residential/consumer loans | | 40,225 | | | | 40,758 | | | | 30,194 | | | | 53,115 | | | | 53,465 | |
| subtotal | | 339,008 | | | | 347,772 | | | | 273,913 | | | | 233,961 | | | | 389,467 | |
| | | | | | | | | | | | | | | |
| | | | | | | | | | | | | | | |
| Payoffs | | (137,932 | ) | | | (77,603 | ) | | | (148,400 | ) | | | (86,250 | ) | | | (77,961 | ) |
| Amortization | | (60,583 | ) | | | (151,674 | ) | | | (83,640 | ) | | | (90,711 | ) | | | (106,610 | ) |
| Loan sales | | (67,852 | ) | | | (43,868 | ) | | | (42,945 | ) | | | (55,321 | ) | | | (29,861 | ) |
| Net line utilization | | (75,651 | ) | | | 9,426 | | | | 1,929 | | | | (4,150 | ) | | | (11,609 | ) |
| Charge-offs & OREO | | (3,356 | ) | | | (2,668 | ) | | | (2,338 | ) | | | (2,123 | ) | | | (1,777 | ) |
| | | | | | | | | | | | | | | |
| Loans receivable-beginning balance | | 6,257,744 | | | | 6,176,359 | | | | 6,177,840 | | | | 6,182,434 | | | | 6,020,785 | |
| Loans receivable-ending balance | $ | 6,251,377 | | | $ | 6,257,744 | | | $ | 6,176,359 | | | $ | 6,177,840 | | | $ | 6,182,434 | |
Deposits were $6.44 billion at the end of the fourth quarter of 2024, up $32.6 million, or 0.5%, from $6.40 billion at the end of the prior quarter. Driving the change was a $44.8 million increase in noninterest-bearing demand deposits and a $34.7 million increase in money market and savings deposits, partially offset by a $48.0 million decrease in time deposits. Noninterest-bearing demand deposits represented 32.6% of total deposits at December 31, 2024, and the loan-to-deposit ratio was 97.1%.
| | As of (in thousands) | | | Percentage Change | |
| | Dec 31, | | | Sep 30, | | | Jun 30, | | | Mar 31, | | | Dec 31, | | | Q4-24 | | | Q4-24 | |
| | 2024 | | | 2024 | | | 2024 | | | 2024 | | | 2023 | | | vs. Q3-24 | | | vs. Q4-23 | |
| Deposit Portfolio | | | | | | | | | | | | | | | | | | | | |
| Demand: noninterest-bearing | $ | 2,096,634 | | | $ | 2,051,790 | | | $ | 1,959,963 | | | $ | 1,933,060 | | | $ | 2,003,596 | | | 2.2 | % | | 4.6 | % |
| Demand: interest-bearing | | 80,323 | | | | 79,287 | | | | 82,981 | | | | 87,374 | | | | 87,452 | | | 1.3 | % | | -8.2 | % |
| Money market and savings | | 1,933,535 | | | | 1,898,834 | | | | 1,834,797 | | | | 1,859,865 | | | | 1,734,658 | | | 1.8 | % | | 11.5 | % |
| Time deposits | | 2,325,284 | | | | 2,373,310 | | | | 2,451,599 | | | | 2,495,761 | | | | 2,454,868 | | | -2.0 | % | | -5.3 | % |
| Total deposits | $ | 6,435,776 | | | $ | 6,403,221 | | | $ | 6,329,340 | | | $ | 6,376,060 | | | $ | 6,280,574 | | | 0.5 | % | | 2.5 | % |
| | As of | |
| | Dec 31, | | | Sep 30, | | | Jun 30, | | | Mar 31, | | | Dec 31, | |
| | 2024 | | | 2024 | | | 2024 | | | 2024 | | | 2023 | |
| Composition of Deposit Portfolio | | | | | | | | | | | | | | |
| Demand: noninterest-bearing | 32.6 | % | | 32.0 | % | | 31.0 | % | | 30.3 | % | | 31.9 | % |
| Demand: interest-bearing | 1.2 | % | | 1.2 | % | | 1.3 | % | | 1.4 | % | | 1.4 | % |
| Money market and savings | 30.0 | % | | 29.7 | % | | 29.0 | % | | 29.2 | % | | 27.6 | % |
| Time deposits | 36.2 | % | | 37.1 | % | | 38.7 | % | | 39.1 | % | | 39.1 | % |
| Total deposits | 100.0 | % | | 100.0 | % | | 100.0 | % | | 100.0 | % | | 100.0 | % |
Stockholders’ equity at December 31, 2024, was $732.2 million, down $4.5 million from $736.7 million at September 30, 2024. The decrease was due to a $14.6 million increase in unrealized after-tax losses on securities available for sale and a $1.0 million increase in unrealized after-tax losses on cash flow hedges, all due to changes in interest rates during the fourth quarter of 2024. Hanmi also repurchased 24,500 shares of common stock, at a cost of $0.6 million, during the quarter at an average share price of $22.91. At December 31, 2024, 1,230,500 shares remain under Hanmi’s share repurchase program. Partially offsetting these decreases was $10.2 million of net income, net of dividends paid, for the fourth quarter. Tangible common stockholders’ equity was $721.1 million, or 9.41% of tangible assets, at December 31, 2024, compared with $725.7 million, or 9.42% of tangible assets at the end of the prior quarter. Please refer to the Non-GAAP Financial Measures section below for more information.
Hanmi and the Bank exceeded minimum regulatory capital requirements, and the Bank continues to exceed the minimum for the “well capitalized” category. At December 31, 2024, Hanmi’s preliminary common equity tier 1 capital ratio was 12.11% and its total risk-based capital ratio was 15.24%, compared with 11.95% and 15.03%, respectively, at the end of the prior quarter.
| | As of | | | Ratio Change | |
| | Dec 31, | | | Sep 30, | | | Jun 30, | | | Mar 31, | | | Dec 31, | | | Q4-24 | | | Q4-24 | |
| | 2024 | | | 2024 | | | 2024 | | | 2024 | | | 2023 | | | vs. Q3-24 | | | vs. Q4-23 | |
| Regulatory Capital ratios (1) | | | | | | | | | | | | | | | | | | | | |
| Hanmi Financial | | | | | | | | | | | | | | | | | | | | |
| Total risk-based capital | 15.24 | % | | 15.03 | % | | 15.24 | % | | 15.20 | % | | 14.95 | % | | 0.21 | | | 0.29 | |
| Tier 1 risk-based capital | 12.46 | % | | 12.29 | % | | 12.46 | % | | 12.40 | % | | 12.20 | % | | 0.17 | | | 0.26 | |
| Common equity tier 1 capital | 12.11 | % | | 11.95 | % | | 12.11 | % | | 12.05 | % | | 11.86 | % | | 0.16 | | | 0.25 | |
| Tier 1 leverage capital ratio | 10.63 | % | | 10.56 | % | | 10.51 | % | | 10.36 | % | | 10.37 | % | | 0.07 | | | 0.26 | |
| Hanmi Bank | | | | | | | | | | | | | | | | | | | | |
| Total risk-based capital | 14.43 | % | | 14.27 | % | | 14.51 | % | | 14.50 | % | | 14.27 | % | | 0.16 | | | 0.16 | |
| Tier 1 risk-based capital | 13.36 | % | | 13.23 | % | | 13.47 | % | | 13.44 | % | | 13.26 | % | | 0.13 | | | 0.10 | |
| Common equity tier 1 capital | 13.36 | % | | 13.23 | % | | 13.47 | % | | 13.44 | % | | 13.26 | % | | 0.13 | | | 0.10 | |
| Tier 1 leverage capital ratio | 11.46 | % | | 11.43 | % | | 11.41 | % | | 11.29 | % | | 11.32 | % | | 0.03 | | | 0.14 | |
| | | | | | | | | | | | | | | | | | | | | |
| (1) Preliminary ratios for December 31, 2024 | | | | | | | | | | | | | | | | | | | | |
Asset Quality
Loans 30 to 89 days past due and still accruing were 0.30% of loans at the end of the fourth quarter of 2024, compared with 0.24% at the end of the prior quarter.
Criticized loans totaled $165.3 million at December 31, 2024, up from $160.0 million at the end of the third quarter of 2024. The $5.3 million increase resulted from an $8.0 million increase in special mention loans and a $2.7 million decrease in classified loans. The $8.0 million increase in special mention loans included additions of $13.4 million, offset by loan reductions and pay-downs of $3.8 million, upgrades of $1.3 million and downgrades of $0.3 million. The $2.7 million decrease in classified loans resulted from $2.9 million of charge-offs, $2.4 million of payoffs, $1.4 million of upgrades and $1.6 million of amortization and paydowns, offset by loan downgrades of $2.7 million and lease downgrades of $2.9 million.
Nonperforming loans were $14.3 million at December 31, 2024, down from $15.5 million at the end of the prior quarter. The decrease primarily reflects pay-offs of $1.8 million, $1.0 million in loan upgrades, $0.8 million in paydowns, and charge-offs of $2.9 million. Offsetting the decrease were additions of $5.5 million.
Nonperforming assets were $14.4 million at the end of the fourth quarter of 2024, down from $16.3 million at the end of the prior quarter. As a percentage of total assets, nonperforming assets were 0.19% at December 31, 2024, and 0.21% at the end of the prior quarter.
Gross charge-offs for the fourth quarter of 2024 were $3.4 million, compared with $3.8 million for the preceding quarter. Charge-offs included $2.9 million on equipment financing agreements. Recoveries of previously charged-off loans were $3.5 million in the fourth quarter of 2024. As a result, there were $0.1 million of net recoveries for the fourth quarter of 2024, compared to net charge-offs of $0.9 million for the prior quarter. For 2024, net charge-offs were 0.07% of average loans, compared with 0.12% for 2023.
The allowance for credit losses was $70.1 million at December 31, 2024, compared with $69.2 million at September 30, 2024. Specific allowances for loans increased $1.0 million, while the allowance for quantitative and qualitative considerations remained relatively unchanged. The ratio of the allowance for credit losses to loans was 1.12% at December 31, 2024 and 1.11% at September 30, 2024.
| | As of or for the Three Months Ended (in thousands) | | | Amount Change | |
| | Dec 31, | | | Sep 30, | | | Jun 30, | | | Mar 31, | | | Dec 31, | | | Q4-24 | | | Q4-24 | |
| | 2024 | | | 2024 | | | 2024 | | | 2024 | | | 2023 | | | vs. Q3-24 | | | vs. Q4-23 | |
| Asset Quality Data and Ratios | | | | | | | | | | | | | | | | | | | | |
| | | | | | | | | | | | | | | | | | | | | |
| Delinquent loans: | | | | | | | | | | | | | | | | | | | | |
| Loans, 30 to 89 days past due and still accruing | $ | 18,454 | | | $ | 15,027 | | | $ | 13,844 | | | $ | 15,839 | | | $ | 10,263 | | | $ | 3,427 | | | $ | 8,191 | |
| Delinquent loans to total loans | | 0.30 | % | | | 0.24 | % | | | 0.22 | % | | | 0.26 | % | | | 0.17 | % | | | 0.06 | | | | 0.13 | |
| | | | | | | | | | | | | | | | | | | | | |
| Criticized loans: | | | | | | | | | | | | | | | | | | | | |
| Special mention | $ | 139,612 | | | $ | 131,575 | | | $ | 36,921 | | | $ | 62,317 | | | $ | 65,314 | | | $ | 8,037 | | | $ | 74,298 | |
| Classified | | 25,683 | | | | 28,377 | | | | 33,945 | | | | 23,670 | | | | 31,367 | | | | (2,694 | ) | | | (5,684 | ) |
| Total criticized loans | $ | 165,295 | | | $ | 159,952 | | | $ | 70,866 | | | $ | 85,987 | | | $ | 96,681 | | | $ | 5,343 | | | $ | 68,614 | |
| | | | | | | | | | | | | | | | | | | | | |
| Nonperforming assets: | | | | | | | | | | | | | | | | | | | | |
| Nonaccrual loans | $ | 14,274 | | | $ | 15,248 | | | $ | 19,245 | | | $ | 14,025 | | | $ | 15,474 | | | $ | (974 | ) | | $ | (1,200 | ) |
| Loans 90 days or more past due and still accruing | | - | | | | 242 | | | | - | | | | - | | | | - | | | | (242 | ) | | | - | |
| Nonperforming loans* | | 14,274 | | | | 15,490 | | | | 19,245 | | | | 14,025 | | | | 15,474 | | | | (1,216 | ) | | | (1,200 | ) |
| Other real estate owned, net | | 117 | | | | 772 | | | | 772 | | | | 117 | | | | 117 | | | | (655 | ) | | | - | |
| Nonperforming assets** | $ | 14,391 | | | $ | 16,262 | | | $ | 20,017 | | | $ | 14,142 | | | $ | 15,591 | | | $ | (1,871 | ) | | $ | (1,200 | ) |
| | | | | | | | | | | | | | | | | | | | | |
| Nonperforming assets to assets* | | 0.19 | % | | | 0.21 | % | | | 0.26 | % | | | 0.19 | % | | | 0.21 | % | | | -0.02 | | | | -0.02 | |
| Nonperforming loans to total loans | | 0.23 | % | | | 0.25 | % | | | 0.31 | % | | | 0.23 | % | | | 0.25 | % | | | -0.02 | | | | -0.02 | |
| | | | | | | | | | | | | | | | | | | | | |
| * Excludes a $27.2 million nonperforming loan held-for-sale as of September 30, 2024. | | | | |
| ** Excludes repossessed personal property of $0.6 million, $1.2 million, $1.2 million, $1.3 million, and $1.3 million as of Q4-24, Q3-24, Q2-24, Q1-24, and Q4-23, respectively | |
| | As of or for the Three Months Ended (in thousands) | |
| | Dec 31, | | | Sep 30, | | | Jun 30, | | | Mar 31, | | | Dec 31, | |
| | 2024 | | | 2024 | | | 2024 | | | 2024 | | | 2023 | |
| Allowance for credit losses related to loans: | | | | | | | | | | | | | | |
| Balance at beginning of period | $ | 69,163 | | | $ | 67,729 | | | $ | 68,270 | | | $ | 69,462 | | | $ | 67,313 | |
| Credit loss expense (recovery) on loans | | 855 | | | | 2,312 | | | | 1,248 | | | | 404 | | | | (2,880 | ) |
| Net loan (charge-offs) recoveries | | 129 | | | | (878 | ) | | | (1,789 | ) | | | (1,596 | ) | | | 5,029 | |
| Balance at end of period | $ | 70,147 | | | $ | 69,163 | | | $ | 67,729 | | | $ | 68,270 | | | $ | 69,462 | |
| | | | | | | | | | | | | | | |
| Net loan charge-offs (recoveries) to average loans (1) | | -0.01 | % | | | 0.06 | % | | | 0.12 | % | | | 0.10 | % | | | -0.33 | % |
| Allowance for credit losses to loans | | 1.12 | % | | | 1.11 | % | | | 1.10 | % | | | 1.11 | % | | | 1.12 | % |
| | | | | | | | | | | | | | | |
| Allowance for credit losses related to off-balance sheet items: | | | | | | | | | | | | | | |
| Balance at beginning of period | $ | 1,984 | | | $ | 2,010 | | | $ | 2,297 | | | $ | 2,474 | | | $ | 2,463 | |
| Credit loss expense (recovery) on off-balance sheet items | | 90 | | | | (26 | ) | | | (287 | ) | | | (177 | ) | | | 11 | |
| Balance at end of period | $ | 2,074 | | | $ | 1,984 | | | $ | 2,010 | | | $ | 2,297 | | | $ | 2,474 | |
| | | | | | | | | | | | | | | |
| Unused commitments to extend credit | $ | 782,587 | | | $ | 739,975 | | | $ | 795,391 | | | $ | 792,769 | | | $ | 813,960 | |
| | | | | | | | | | | | | | | |
| (1) Annualized | | | | | | | | | | | | | | |
Corporate Developments
On October 24, 2024, Hanmi’s Board of Directors declared a cash dividend on its common stock for the 2024 fourth quarter of $0.25 per share. Hanmi paid the dividend on November 20, 2024, to stockholders of record as of the close of business on November 4, 2024.
Earnings Conference Call
Hanmi Bank will host its fourth quarter 2024 earnings conference call today, January 28, 2025, at 2:00 p.m. PST (5:00 p.m. EST) to discuss these results. This call will also be webcast. To access the call, please dial 1-877-407-9039 before 2:00 p.m. PST, using access code Hanmi Bank. To listen to the call online, either live or archived, please visit Hanmi’s Investor Relations website at https://investors.hanmi.com/ where it will also be available for replay approximately one hour following the call.
About Hanmi Financial Corporation
Headquartered in Los Angeles, California, Hanmi Financial Corporation owns Hanmi Bank, which serves multi-ethnic communities through its network of 31 full-service branches and eight loan production offices in California, Texas, Illinois, Virginia, New Jersey, New York, Colorado, Washington and Georgia. Hanmi Bank specializes in real estate, commercial, SBA and trade finance lending to small and middle market businesses. Additional information is available at www.hanmi.com.
Forward-Looking Statements
This press release contains forward-looking statements, which are included in accordance with the “safe harbor” provisions of the Private Securities Litigation Reform Act of 1995. All statements other than statements of historical fact are “forward–looking statements” for purposes of federal and state securities laws, including, but not limited to, statements about our anticipated future operating and financial performance, financial position and liquidity, business strategies, regulatory and competitive outlook, investment and expenditure plans, capital and financing needs and availability, plans and objectives of management for future operations, developments regarding our capital and strategic plans, and other similar forecasts and statements of expectation and statements of assumption underlying any of the foregoing. In some cases, you can identify forward-looking statements by terminology such as “may,” “will,” “should,” “could,” “expects,” “plans,” “intends,” “anticipates,” “believes,” “estimates,” “predicts,” “potential,” or “continue,” or the negative of such terms and other comparable terminology. Although we believe that our forward-looking statements to be reasonable, we cannot guarantee future results, levels of activity, performance or achievements.
Forward-looking statements involve known and unknown risks, uncertainties and other factors that may cause our actual results, levels of activity, performance or achievements to differ from those expressed or implied by the forward-looking statements. These factors include the following:
- a failure to maintain adequate levels of capital and liquidity to support our operations;
- general economic and business conditions internationally, nationally and in those areas in which we operate, including any potential recessionary conditions;
- volatility and deterioration in the credit and equity markets;
- changes in consumer spending, borrowing and savings habits;
- availability of capital from private and government sources;
- demographic changes;
- competition for loans and deposits and failure to attract or retain loans and deposits;
- inflation and fluctuations in interest rates that reduce our margins and yields, the fair value of financial instruments, the level of loan originations or prepayments on loans we have made and make, the level of loan sales and the cost we pay to retain and attract deposits and secure other types of funding;
- our ability to enter new markets successfully and capitalize on growth opportunities;
- the current or anticipated impact of military conflict, terrorism or other geopolitical events;
- the effect of potential future supervisory action against us or Hanmi Bank and our ability to address any issues raised in our regulatory exams;
- risks of natural disasters;
- legal proceedings and litigation brought against us;
- a failure in or breach of our operational or security systems or infrastructure, including cyberattacks;
- the failure to maintain current technologies;
- risks associated with Small Business Administration loans;
- failure to attract or retain key employees;
- our ability to access cost-effective funding;
- the imposition of tariffs or other domestic or international governmental polices impacting the value of the products of our borrowers;
- changes in liquidity, including the size and composition of our deposit portfolio and the percentage of uninsured deposits in the portfolio;
- fluctuations in real estate values;
- changes in accounting policies and practices;
- changes in governmental regulation, including, but not limited to, any increase in FDIC insurance premiums and changes in the monetary policies of the U.S. Treasury and the Board of Governors of the Federal Reserve System;
- the ability of Hanmi Bank to make distributions to Hanmi Financial Corporation, which is restricted by certain factors, including Hanmi Bank’s retained earnings, net income, prior distributions made, and certain other financial tests;
- strategic transactions we may enter into;
- the adequacy of and changes in the methodology for computing our allowance for credit losses;
- our credit quality and the effect of credit quality on our credit losses expense and allowance for credit losses;
- changes in the financial performance and/or condition of our borrowers and the ability of our borrowers to perform under the terms of their loans and other terms of credit agreements;
- our ability to control expenses; and
- cyber security and fraud risks against our information technology and those of our third-party providers and vendors.
In addition, we set forth certain risks in our reports filed with the U.S. Securities and Exchange Commission, including, Item 1A of our Annual Report on Form 10-K for the year ended December 31, 2023, our Quarterly Reports on Form 10-Q, and Current Reports on Form 8-K that we will file hereafter, which could cause actual results to differ from those projected. We undertake no obligation to update such forward-looking statements except as required by law.
Investor Contacts:
Romolo (Ron) Santarosa
Senior Executive Vice President & Chief Financial Officer
213-427-5636
Lisa Fortuna
Investor Relations
Financial Profiles, Inc.
lfortuna@finprofiles.com
310-622-8251
Hanmi Financial Corporation and Subsidiaries
Consolidated Balance Sheets (Unaudited)
(Dollars in thousands)
| | December 31, | | | September 30, | | | Percentage | | | December 31, | | | Percentage | |
| | 2024 | | | 2024 | | | Change | | | 2023 | | | Change | |
| Assets | | | | | | | | | | | | | | |
| Cash and due from banks | $ | 304,800 | | | $ | 287,767 | | | 5.9 | % | | $ | 302,324 | | | 0.8 | % |
| Securities available for sale, at fair value | | 905,798 | | | | 908,921 | | | -0.3 | % | | | 865,739 | | | 4.6 | % |
| Loans held for sale, at the lower of cost or fair value | | 8,579 | | | | 54,336 | | | -84.2 | % | | | 12,013 | | | -28.6 | % |
| Loans receivable, net of allowance for credit losses | | 6,181,230 | | | | 6,188,581 | | | -0.1 | % | | | 6,112,972 | | | 1.1 | % |
| Accrued interest receivable | | 22,937 | | | | 21,955 | | | 4.5 | % | | | 23,371 | | | -1.9 | % |
| Premises and equipment, net | | 21,404 | | | | 21,371 | | | 0.2 | % | | | 21,959 | | | -2.5 | % |
| Customers' liability on acceptances | | 1,226 | | | | 67 | | | N/M | | | | 625 | | | 96.2 | % |
| Servicing assets | | 6,457 | | | | 6,683 | | | -3.4 | % | | | 7,070 | | | -8.7 | % |
| Goodwill and other intangible assets, net | | 11,031 | | | | 11,031 | | | 0.0 | % | | | 11,099 | | | -0.6 | % |
| Federal Home Loan Bank ("FHLB") stock, at cost | | 16,385 | | | | 16,385 | | | 0.0 | % | | | 16,385 | | | 0.0 | % |
| Bank-owned life insurance | | 57,168 | | | | 56,851 | | | 0.6 | % | | | 56,335 | | | 1.5 | % |
| Prepaid expenses and other assets | | 140,910 | | | | 138,351 | | | 1.8 | % | | | 140,449 | | | 0.3 | % |
| Total assets | $ | 7,677,925 | | | $ | 7,712,299 | | | -0.4 | % | | $ | 7,570,341 | | | 1.4 | % |
| | | | | | | | | | | | | | | |
| Liabilities and Stockholders' Equity | | | | | | | | | | | | | | |
| Liabilities: | | | | | | | | | | | | | | |
| Deposits: | | | | | | | | | | | | | | |
| Noninterest-bearing | $ | 2,096,634 | | | $ | 2,051,790 | | | 2.2 | % | | $ | 2,003,596 | | | 4.6 | % |
| Interest-bearing | | 4,339,142 | | | | 4,351,431 | | | -0.3 | % | | | 4,276,978 | | | 1.5 | % |
| Total deposits | | 6,435,776 | | | | 6,403,221 | | | 0.5 | % | | | 6,280,574 | | | 2.5 | % |
| Accrued interest payable | | 34,824 | | | | 52,613 | | | -33.8 | % | | | 39,306 | | | -11.4 | % |
| Bank's liability on acceptances | | 1,226 | | | | 67 | | | N/M | | | | 625 | | | 96.2 | % |
| Borrowings | | 262,500 | | | | 300,000 | | | -12.5 | % | | | 325,000 | | | -19.2 | % |
| Subordinated debentures | | 130,638 | | | | 130,478 | | | 0.1 | % | | | 130,012 | | | 0.5 | % |
| Accrued expenses and other liabilities | | 80,787 | | | | 89,211 | | | -9.4 | % | | | 92,933 | | | -13.1 | % |
| Total liabilities | | 6,945,751 | | | | 6,975,590 | | | -0.4 | % | | | 6,868,450 | | | 1.1 | % |
| | | | | | | | | | | | | | | |
| Stockholders' equity: | | | | | | | | | | | | | | |
| Common stock | | 34 | | | | 34 | | | 0.0 | % | | | 34 | | | 0.0 | % |
| Additional paid-in capital | | 591,069 | | | | 589,567 | | | 0.3 | % | | | 586,912 | | | 0.7 | % |
| Accumulated other comprehensive income | | (70,723 | ) | | | (55,140 | ) | | -28.3 | % | | | (71,928 | ) | | 1.7 | % |
| Retained earnings | | 350,869 | | | | 340,718 | | | 3.0 | % | | | 319,048 | | | 10.0 | % |
| Less treasury stock | | (139,075 | ) | | | (138,470 | ) | | -0.4 | % | | | (132,175 | ) | | -5.2 | % |
| Total stockholders' equity | | 732,174 | | | | 736,709 | | | -0.6 | % | | | 701,891 | | | 4.3 | % |
| Total liabilities and stockholders' equity | $ | 7,677,925 | | | $ | 7,712,299 | | | -0.4 | % | | $ | 7,570,341 | | | 1.4 | % |
| | | | | | | | | | | | | | | |
| N/M - Not meaningful. | | | | | | | | | | | | | | |
Hanmi Financial Corporation and Subsidiaries
Consolidated Statements of Income (Unaudited)
(Dollars in thousands, except share and per share data)
| | Three Months Ended | |
| | December 31, | | | September 30, | | | Percentage | | | December 31, | | | Percentage | |
| | 2024 | | | 2024 | | | Change | | | 2023 | | | Change | |
| Interest and dividend income: | | | | | | | | | | | | | | |
| Interest and fees on loans receivable | $ | 91,545 | | | $ | 92,182 | | | -0.7 | % | | $ | 89,922 | | | 1.8 | % |
| Interest on securities | | 5,866 | | | | 5,523 | | | 6.2 | % | | | 4,583 | | | 28.0 | % |
| Dividends on FHLB stock | | 360 | | | | 356 | | | 1.1 | % | | | 341 | | | 5.6 | % |
| Interest on deposits in other banks | | 2,342 | | | | 2,356 | | | -0.6 | % | | | 2,337 | | | 0.2 | % |
| Total interest and dividend income | | 100,113 | | | | 100,417 | | | -0.3 | % | | | 97,183 | | | 3.0 | % |
| Interest expense: | | | | | | | | | | | | | | |
| Interest on deposits | | 43,406 | | | | 47,153 | | | -7.9 | % | | | 40,277 | | | 7.8 | % |
| Interest on borrowings | | 1,634 | | | | 1,561 | | | 4.7 | % | | | 2,112 | | | -22.6 | % |
| Interest on subordinated debentures | | 1,624 | | | | 1,652 | | | -1.7 | % | | | 1,654 | | | -1.8 | % |
| Total interest expense | | 46,664 | | | | 50,366 | | | -7.4 | % | | | 44,043 | | | 6.0 | % |
| Net interest income before credit loss expense | | 53,449 | | | | 50,051 | | | 6.8 | % | | | 53,140 | | | 0.6 | % |
| Credit loss expense | | 945 | | | | 2,286 | | | -58.7 | % | | | (2,870 | ) | | 132.9 | % |
| Net interest income after credit loss expense | | 52,504 | | | | 47,765 | | | 9.9 | % | | | 56,010 | | | -6.3 | % |
| Noninterest income: | | | | | | | | | | | | | | |
| Service charges on deposit accounts | | 2,192 | | | | 2,311 | | | -5.1 | % | | | 2,391 | | | -8.3 | % |
| Trade finance and other service charges and fees | | 1,364 | | | | 1,254 | | | 8.8 | % | | | 1,245 | | | 9.6 | % |
| Gain on sale of Small Business Administration ("SBA") loans | | 1,443 | | | | 1,544 | | | -6.5 | % | | | 1,448 | | | -0.3 | % |
| Other operating income | | 2,358 | | | | 3,329 | | | -29.2 | % | | | 1,596 | | | 47.7 | % |
| Total noninterest income | | 7,357 | | | | 8,438 | | | -12.8 | % | | | 6,680 | | | 10.1 | % |
| Noninterest expense: | | | | | | | | | | | | | | |
| Salaries and employee benefits | | 20,498 | | | | 20,851 | | | -1.7 | % | | | 20,062 | | | 2.2 | % |
| Occupancy and equipment | | 4,503 | | | | 4,499 | | | 0.1 | % | | | 4,604 | | | -2.2 | % |
| Data processing | | 3,800 | | | | 3,839 | | | -1.0 | % | | | 3,487 | | | 9.0 | % |
| Professional fees | | 1,821 | | | | 1,492 | | | 22.1 | % | | | 1,977 | | | -7.9 | % |
| Supplies and communications | | 551 | | | | 538 | | | 2.4 | % | | | 613 | | | -10.1 | % |
| Advertising and promotion | | 821 | | | | 631 | | | 30.1 | % | | | 990 | | | -17.1 | % |
| Other operating expenses | | 2,540 | | | | 3,230 | | | -21.4 | % | | | 3,478 | | | -27.0 | % |
| Total noninterest expense | | 34,534 | | | | 35,080 | | | -1.6 | % | | | 35,211 | | | -1.9 | % |
| Income before tax | | 25,327 | | | | 21,123 | | | 19.9 | % | | | 27,479 | | | -7.8 | % |
| Income tax expense | | 7,632 | | | | 6,231 | | | 22.5 | % | | | 8,846 | | | -13.7 | % |
| Net income | $ | 17,695 | | | $ | 14,892 | | | 18.8 | % | | $ | 18,633 | | | -5.0 | % |
| | | | | | | | | | | | | | | |
| Basic earnings per share: | $ | 0.59 | | | $ | 0.49 | | | | | | $ | 0.61 | | | | |
| Diluted earnings per share: | $ | 0.58 | | | $ | 0.49 | | | | | | $ | 0.61 | | | | |
| | | | | | | | | | | | | | | |
| Weighted-average shares outstanding: | | | | | | | | | | | | | | |
| Basic | | 29,933,644 | | | | 29,968,004 | | | | | | | 30,189,578 | | | | |
| Diluted | | 30,011,773 | | | | 30,033,679 | | | | | | | 30,251,315 | | | | |
| Common shares outstanding | | 30,195,999 | | | | 30,196,755 | | | | | | | 30,368,655 | | | | |
Hanmi Financial Corporation and Subsidiaries
Consolidated Statements of Income (Unaudited)
(Dollars in thousands, except share and per share data)
| | Twelve Months Ended | |
| | December 31, | | | December 31, | | | Percentage | |
| | 2024 | | | 2023 | | | Change | |
| Interest and dividend income: | | | | | | | | |
| Interest and fees on loans receivable | $ | 366,153 | | | $ | 339,811 | | | | 7.8 | % |
| Interest on securities | | 21,583 | | | | 16,938 | | | | 27.4 | % |
| Dividends on FHLB stock | | 1,436 | | | | 1,229 | | | | 16.8 | % |
| Interest on deposits in other banks | | 9,611 | | | | 11,350 | | | | -15.3 | % |
| Total interest and dividend income | | 398,783 | | | | 369,328 | | | | 8.0 | % |
| Interest expense: | | | | | | | | |
| Interest on deposits | | 182,692 | | | | 134,708 | | | | 35.6 | % |
| Interest on borrowings | | 6,746 | | | | 6,867 | | | | -1.8 | % |
| Interest on subordinated debentures | | 6,571 | | | | 6,482 | | | | 1.4 | % |
| Total interest expense | | 196,009 | | | | 148,057 | | | | 32.4 | % |
| Net interest income before credit loss expense | | 202,774 | | | | 221,271 | | | | -8.4 | % |
| Credit loss expense | | 4,419 | | | | 4,342 | | | | 1.8 | % |
| Net interest income after credit loss expense | | 198,355 | | | | 216,929 | | | | -8.6 | % |
| Noninterest income: | | | | | | | | |
| Service charges on deposit accounts | | 9,381 | | | | 10,147 | | | | -7.5 | % |
| Trade finance and other service charges and fees | | 5,309 | | | | 4,832 | | | | 9.9 | % |
| Gain on sale of Small Business Administration ("SBA") loans | | 6,112 | | | | 5,701 | | | | 7.2 | % |
| Other operating income | | 10,783 | | | | 13,499 | | | | -20.1 | % |
| Total noninterest income | | 31,585 | | | | 34,179 | | | | -7.6 | % |
| Noninterest expense: | | | | | | | | |
| Salaries and employee benefits | | 83,368 | | | | 81,398 | | | | 2.4 | % |
| Occupancy and equipment | | 18,146 | | | | 18,340 | | | | -1.1 | % |
| Data processing | | 14,876 | | | | 13,695 | | | | 8.6 | % |
| Professional fees | | 6,956 | | | | 6,255 | | | | 11.2 | % |
| Supplies and communications | | 2,261 | | | | 2,479 | | | | -8.8 | % |
| Advertising and promotion | | 3,028 | | | | 3,105 | | | | -2.5 | % |
| Other operating expenses | | 12,700 | | | | 11,255 | | | | 12.8 | % |
| Total noninterest expense | | 141,335 | | | | 136,527 | | | | 3.5 | % |
| Income before tax | | 88,605 | | | | 114,581 | | | | -22.7 | % |
| Income tax expense | | 26,404 | | | | 34,540 | | | | -23.6 | % |
| Net income | $ | 62,201 | | | $ | 80,041 | | | | -22.3 | % |
| | | | | | | | | |
| Basic earnings per share: | $ | 2.06 | | | $ | 2.63 | | | | |
| Diluted earnings per share: | $ | 2.05 | | | $ | 2.62 | | | | |
| | | | | | | | | |
| Weighted-average shares outstanding: | | | | | | | | |
| Basic | | 30,019,815 | | | | 30,269,740 | | | | |
| Diluted | | 30,102,336 | | | | 30,330,258 | | | | |
| Common shares outstanding | | 30,195,999 | | | | 30,368,655 | | | | |
Hanmi Financial Corporation and Subsidiaries
Average Balance, Average Yield Earned, and Average Rate Paid (Unaudited)
(Dollars in thousands)
| | Three Months Ended | |
| | December 31, 2024 | | | September 30, 2024 | | | December 31, 2023 | |
| | | | | Interest | | Average | | | | | | Interest | | Average | | | | | | Interest | | Average | |
| | Average | | | Income / | | Yield / | | | Average | | | Income / | | Yield / | | | Average | | | Income / | | Yield / | |
| | Balance | | | Expense | | Rate | | | Balance | | | Expense | | Rate | | | Balance | | | Expense | | Rate | |
| Assets | | | | | | | | | | | | | | | | | | | | | | | |
| Interest-earning assets: | | | | | | | | | | | | | | | | | | | | | | | |
| Loans receivable (1) | $ | 6,103,264 | | | $ | 91,545 | | | 5.97 | % | | $ | 6,112,324 | | | $ | 92,182 | | | 6.00 | % | | $ | 6,071,644 | | | $ | 89,922 | | | 5.88 | % |
| Securities (2) | | 998,313 | | | | 5,866 | | | 2.38 | % | | | 986,041 | | | | 5,523 | | | 2.27 | % | | | 961,551 | | | | 4,582 | | | 1.93 | % |
| FHLB stock | | 16,385 | | | | 360 | | | 8.75 | % | | | 16,385 | | | | 356 | | | 8.65 | % | | | 16,385 | | | | 341 | | | 8.25 | % |
| Interest-bearing deposits in other banks | | 204,408 | | | | 2,342 | | | 4.56 | % | | | 183,027 | | | | 2,356 | | | 5.12 | % | | | 181,140 | | | | 2,338 | | | 5.12 | % |
| Total interest-earning assets | | 7,322,370 | | | | 100,113 | | | 5.45 | % | | | 7,297,777 | | | | 100,417 | | | 5.48 | % | | | 7,230,720 | | | | 97,183 | | | 5.34 | % |
| | | | | | | | | | | | | | | | | | | | | | | | |
| Noninterest-earning assets: | | | | | | | | | | | | | | | | | | | | | | | |
| Cash and due from banks | | 54,678 | | | | | | | | | 54,843 | | | | | | | | | 61,146 | | | | | | |
| Allowance for credit losses | | (69,291 | ) | | | | | | | | (67,906 | ) | | | | | | | | (68,319 | ) | | | | | |
| Other assets | | 246,744 | | | | | | | | | 251,421 | | | | | | | | | 251,660 | | | | | | |
| | | | | | | | | | | | | | | | | | | | | | | | |
| Total assets | $ | 7,554,501 | | | | | | | | $ | 7,536,135 | | | | | | | | $ | 7,475,207 | | | | | | |
| | | | | | | | | | | | | | | | | | | | | | | | |
| Liabilities and Stockholders' Equity | | | | | | | | | | | | | | | | | | | | | | | |
| Interest-bearing liabilities: | | | | | | | | | | | | | | | | | | | | | | | |
| Deposits: | | | | | | | | | | | | | | | | | | | | | | | |
| Demand: interest-bearing | $ | 79,784 | | | $ | 26 | | | 0.13 | % | | $ | 83,647 | | | $ | 31 | | | 0.15 | % | | $ | 86,679 | | | $ | 29 | | | 0.13 | % |
| Money market and savings | | 1,934,540 | | | | 16,564 | | | 3.41 | % | | | 1,885,799 | | | | 17,863 | | | 3.77 | % | | | 1,669,973 | | | | 14,379 | | | 3.42 | % |
| Time deposits | | 2,346,363 | | | | 26,816 | | | 4.55 | % | | | 2,427,737 | | | | 29,259 | | | 4.79 | % | | | 2,417,803 | | | | 25,869 | | | 4.24 | % |
| Total interest-bearing deposits | | 4,360,687 | | | | 43,406 | | | 3.96 | % | | | 4,397,183 | | | | 47,153 | | | 4.27 | % | | | 4,174,455 | | | | 40,277 | | | 3.83 | % |
| Borrowings | | 141,604 | | | | 1,634 | | | 4.59 | % | | | 143,479 | | | | 1,561 | | | 4.33 | % | | | 205,951 | | | | 2,113 | | | 4.07 | % |
| Subordinated debentures | | 130,567 | | | | 1,624 | | | 4.97 | % | | | 130,403 | | | | 1,652 | | | 5.07 | % | | | 129,933 | | | | 1,653 | | | 5.09 | % |
| Total interest-bearing liabilities | | 4,632,858 | | | | 46,664 | | | 4.01 | % | | | 4,671,065 | | | | 50,366 | | | 4.29 | % | | | 4,510,339 | | | | 44,043 | | | 3.88 | % |
| | | | | | | | | | | | | | | | | | | | | | | | |
| Noninterest-bearing liabilities and equity: | | | | | | | | | | | | | | | | | | | | | | | |
| Demand deposits: noninterest-bearing | | 1,967,789 | | | | | | | | | 1,908,833 | | | | | | | | | 2,025,212 | | | | | | |
| Other liabilities | | 162,064 | | | | | | | | | 171,987 | | | | | | | | | 177,321 | | | | | | |
| Stockholders' equity | | 791,790 | | | | | | | | | 784,250 | | | | | | | | | 762,335 | | | | | | |
| | | | | | | | | | | | | | | | | | | | | | | | |
| Total liabilities and stockholders' equity | $ | 7,554,501 | | | | | | | | $ | 7,536,135 | | | | | | | | $ | 7,475,207 | | | | | | |
| | | | | | | | | | | | | | | | | | | | | | | | |
| Net interest income | | | | $ | 53,449 | | | | | | | | $ | 50,051 | | | | | | | | $ | 53,140 | | | |
| | | | | | | | | | | | | | | | | | | | | | | | |
| Cost of deposits | | | | | | | 2.73 | % | | | | | | | | 2.97 | % | | | | | | | | 2.58 | % |
| Net interest spread (taxable equivalent basis) | | | | | | | 1.44 | % | | | | | | | | 1.19 | % | | | | | | | | 1.47 | % |
| Net interest margin (taxable equivalent basis) | | | | | | | 2.91 | % | | | | | | | | 2.74 | % | | | | | | | | 2.92 | % |
| | | | | | | | | | | | | | | | | | | | | | | | |
| | | | | | | | | | | | | | | | | | | | | | | | |
| | | | | | | | | | | | | | | | | | | | | | | | |
| (1) Includes average loans held for sale | | | | | | | | | | | | | | |
| (2) Income calculated on a fully taxable equivalent basis using the federal tax rate in effect for the periods presented. | | | |
Hanmi Financial Corporation and Subsidiaries
Average Balance, Average Yield Earned, and Average Rate Paid (Unaudited)
(Dollars in thousands)
| | Twelve Months Ended | |
| | December 31, 2024 | | | December 31, 2023 | |
| | | | | Interest | | Average | | | | | | Interest | | Average | |
| | Average | | | Income / | | Yield / | | | Average | | | Income / | | Yield / | |
| | Balance | | | Expense | | Rate | | | Balance | | | Expense | | Rate | |
| Assets | | | | | | | | | | | | | | | |
| Interest-earning assets: | | | | | | | | | | | | | | | |
| Loans receivable (1) | $ | 6,110,713 | | | $ | 366,153 | | | 5.99 | % | | $ | 5,968,339 | | | $ | 339,811 | | | 5.69 | % |
| Securities (2) | | 983,434 | | | | 21,583 | | | 2.22 | % | | | 967,231 | | | | 16,938 | | | 1.78 | % |
| FHLB stock | | 16,385 | | | | 1,437 | | | 8.76 | % | | | 16,385 | | | | 1,229 | | | 7.50 | % |
| Interest-bearing deposits in other banks | | 192,342 | | | | 9,610 | | | 5.00 | % | | | 230,835 | | | | 11,350 | | | 4.92 | % |
| Total interest-earning assets | | 7,302,874 | | | | 398,783 | | | 5.46 | % | | | 7,182,790 | | | | 369,328 | | | 5.15 | % |
| | | | | | | | | | | | | | | | |
| Noninterest-earning assets: | | | | | | | | | | | | | | | |
| Cash and due from banks | | 55,830 | | | | | | | | | 62,049 | | | | | | |
| Allowance for credit losses | | (68,553 | ) | | | | | | | | (70,501 | ) | | | | | |
| Other assets | | 248,820 | | | | | | | | | 240,779 | | | | | | |
| | | | | | | | | | | | | | | | |
| Total assets | $ | 7,538,971 | | | | | | | | $ | 7,415,117 | | | | | | |
| | | | | | | | | | | | | | | | |
| Liabilities and Stockholders' Equity | | | | | | | | | | | | | | | |
| Interest-bearing liabilities: | | | | | | | | | | | | | | | |
| Deposits: | | | | | | | | | | | | | | | |
| Demand: interest-bearing | $ | 83,807 | | | $ | 119 | | | 0.14 | % | | $ | 97,388 | | | $ | 117 | | | 0.12 | % |
| Money market and savings | | 1,870,541 | | | | 68,304 | | | 3.65 | % | | | 1,547,911 | | | | 44,066 | | | 2.85 | % |
| Time deposits | | 2,433,516 | | | | 114,269 | | | 4.70 | % | | | 2,371,520 | | | | 90,525 | | | 3.82 | % |
| Total interest-bearing deposits | | 4,387,864 | | | | 182,692 | | | 4.16 | % | | | 4,016,819 | | | | 134,708 | | | 3.35 | % |
| Borrowings | | 154,193 | | | | 6,746 | | | 4.38 | % | | | 197,409 | | | | 6,867 | | | 3.48 | % |
| Subordinated debentures | | 130,325 | | | | 6,571 | | | 5.04 | % | | | 129,708 | | | | 6,482 | | | 5.00 | % |
| Total interest-bearing liabilities | | 4,672,382 | | | | 196,009 | | | 4.20 | % | | | 4,343,936 | | | | 148,057 | | | 3.41 | % |
| | | | | | | | | | | | | | | | |
| Noninterest-bearing liabilities and equity: | | | | | | | | | | | | | | | |
| Demand deposits: noninterest-bearing | | 1,920,492 | | | | | | | | | 2,173,813 | | | | | | |
| Other liabilities | | 165,288 | | | | | | | | | 149,460 | | | | | | |
| Stockholders' equity | | 780,809 | | | | | | | | | 747,908 | | | | | | |
| | | | | | | | | | | | | | | | |
| Total liabilities and stockholders' equity | $ | 7,538,971 | | | | | | | | $ | 7,415,117 | | | | | | |
| | | | | | | | | | | | | | | | |
| Net interest income | | | | $ | 202,774 | | | | | | | | $ | 221,271 | | | |
| | | | | | | | | | | | | | | | |
| Cost of deposits | | | | | | | 2.90 | % | | | | | | | | 2.18 | % |
| Net interest spread (taxable equivalent basis) | | | | | | | 1.27 | % | | | | | | | | 1.74 | % |
| Net interest margin (taxable equivalent basis) | | | | | | | 2.78 | % | | | | | | | | 3.08 | % |
| | | | | | | | | | | | | | | | |
| | | | | | | | | | | | | | | | |
| (1) Includes average loans held for sale | | | | | | | | | | | | | | | |
| (2) Amounts calculated on a fully taxable equivalent basis using the federal tax rate in effect for the periods presented. | |
Non-GAAP Financial Measures
Tangible Common Equity to Tangible Assets Ratio
Tangible common equity to tangible assets ratio is supplemental financial information determined by a method other than in accordance with U.S. generally accepted accounting principles (“GAAP”). This non-GAAP measure is used by management in the analysis of Hanmi’s capital strength. Tangible common equity is calculated by subtracting goodwill and other intangible assets from stockholders’ equity. Banking and financial institution regulators also exclude goodwill and other intangible assets from stockholders’ equity when assessing the capital adequacy of a financial institution. Management believes the presentation of this financial measure excluding the impact of these items provides useful supplemental information that is essential to a proper understanding of the capital strength of Hanmi. This disclosure should not be viewed as a substitute for results determined in accordance with GAAP, nor is it necessarily comparable to non-GAAP performance measures that may be presented by other companies.
The following table reconciles this non-GAAP performance measure to the GAAP performance measure for the periods indicated:
Tangible Common Equity to Tangible Assets Ratio (Unaudited)
(In thousands, except share, per share data and ratios)
| | December 31, | | | September 30, | | | June 30, | | | March 31, | | | December 31, | |
| Hanmi Financial Corporation | 2024 | | | 2024 | | | 2024 | | | 2024 | | | 2023 | |
| Assets | $ | 7,677,925 | | | $ | 7,712,299 | | | $ | 7,586,347 | | | $ | 7,512,046 | | | $ | 7,570,341 | |
| Less goodwill and other intangible assets | | (11,031 | ) | | | (11,031 | ) | | | (11,048 | ) | | | (11,074 | ) | | | (11,099 | ) |
| Tangible assets | $ | 7,666,894 | | | $ | 7,701,268 | | | $ | 7,575,299 | | | $ | 7,500,972 | | | $ | 7,559,242 | |
| | | | | | | | | | | | | | | |
| Stockholders' equity (1) | $ | 732,174 | | | $ | 736,709 | | | $ | 707,059 | | | $ | 703,100 | | | $ | 701,891 | |
| Less goodwill and other intangible assets | | (11,031 | ) | | | (11,031 | ) | | | (11,048 | ) | | | (11,074 | ) | | | (11,099 | ) |
| Tangible stockholders' equity (1) | $ | 721,143 | | | $ | 725,678 | | | $ | 696,011 | | | $ | 692,026 | | | $ | 690,792 | |
| | | | | | | | | | | | | | | |
| Stockholders' equity to assets | | 9.54 | % | | | 9.55 | % | | | 9.32 | % | | | 9.36 | % | | | 9.27 | % |
| Tangible common equity to tangible assets (1) | | 9.41 | % | | | 9.42 | % | | | 9.19 | % | | | 9.23 | % | | | 9.14 | % |
| | | | | | | | | | | | | | | |
| Common shares outstanding | | 30,195,999 | | | | 30,196,755 | | | | 30,272,110 | | | | 30,276,358 | | | | 30,368,655 | |
| Tangible common equity per common share | $ | 23.88 | | | $ | 24.03 | | | $ | 22.99 | | | $ | 22.86 | | | $ | 22.75 | |
| | | | | | | | | | | | | | | |
| | | | | | | | | | | | | | | |
| (1) There were no preferred shares outstanding at the periods indicated. | | | | |
Exhibit 99.2

4Q24 Earnings Supplemental Presentation January 28, 2025 Los Angeles New York/ New Jersey Virginia Chicago Dallas Houston San Francisco San Diego
Hanmi Financial Corporation (the “Company”) cautions investors that any statements contained herein that are not historical facts are forward - looking statements within the meaning of the “safe harbor” provisions of the Private Securities Litigation Reform Act of 1995 , including, but not limited to, those statements regarding operating and financial performance, financial position and liquidity, business strategies, regulatory, economic and competitive outlook, investment and expenditure plans, capital and financing needs and availability, litigation, plans and objectives, merger or sale activity, financial condition and results of operations, and all other forecasts and statements of expectation or assumption underlying any of the foregoing . These statements involve known and unknown risks and uncertainties that are difficult to predict . Investors should not rely on any forward - looking statement and should consider risks, such as changes in governmental policy, legislation and regulations, economic uncertainty and changes in economic conditions, inflation, the effect of the imposition of tariffs, fluctuations in interest rate and credit risk, competitive pressures, our ability to access cost - effective funding, the ability to enter into new markets successfully and capitalize on growth opportunities, balance sheet management, liquidity and sources of funding, the size and composition of our deposit portfolio, and including the percentage of uninsured deposits in the portfolio, increased assessments by the Federal Deposit Insurance Corporation, risk and effect of natural disasters, a failure in or breach of our operational or security systems or infrastructure, including cyberattacks, the adequacy of and changes in the methodology of calculating our allowance for credit losses, and other operational factors . Forward - looking statements are based upon the good faith beliefs and expectations of management as of this date only and are further subject to additional risks and uncertainties, including, but not limited to, the risk factors set forth in our earnings release dated January 28 , 2025 , including the section titled “Forward Looking Statements” and the Company’s most recent Form 10 - K, 10 - Q and other filings with the Securities and Exchange Commission . The Company disclaims any obligation to update or revise the forward - looking statements herein . 2 Forward - Looking Statements
This presentation contains financial information determined by methods other than in accordance with accounting principles generally accepted in the United States of America (“GAAP”) . These non - GAAP measures include tangible common equity to tangible assets, and tangible common equity per share . Management uses these “non - GAAP” measures in its analysis of the Company’s performance . Management believes these non - GAAP financial measures allow for better comparability of period to period operating performance . Additionally, the Company believes this information is utilized by regulators and market analysts to evaluate a company’s financial condition and therefore, such information is useful to investors . These disclosures should not be viewed as a substitute for operating results determined in accordance with GAAP, nor are they necessarily comparable to non - GAAP performance measures that may be presented by other companies . A reconciliation of the non - GAAP measures used in this presentation to the most directly comparable GAAP measures is provided in the Appendix to this presentation . 3 Non - GAAP Financial Information
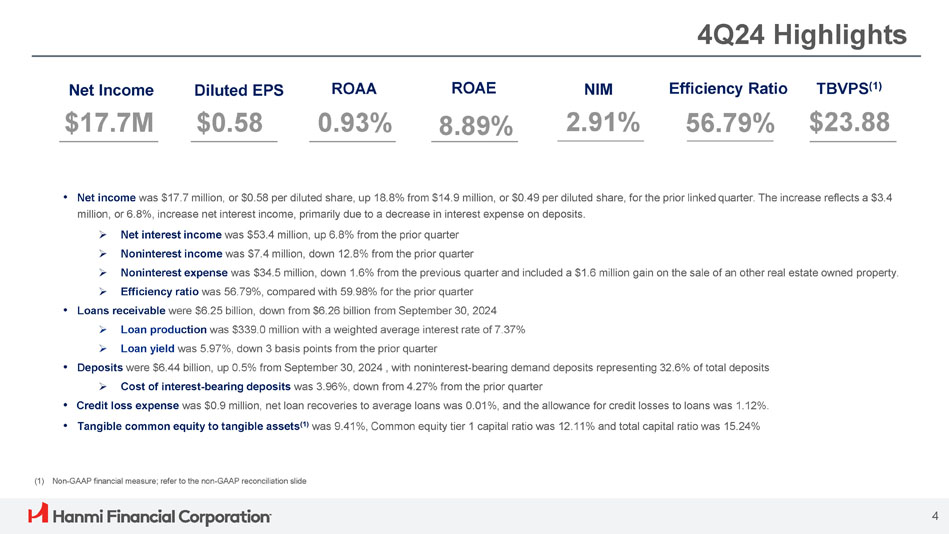
4Q24 Highlights Diluted EPS $0.58 ROAA 0.93% NIM 2.91% Efficiency Ratio 56.79% TBVPS (1) $23.88 Net Income $17.7M • Net income was $17.7 million, or $0.58 per diluted share, up 18.8% from $14.9 million, or $0.49 per diluted share, for the prior linked quarter. The increase reflects a $3.4 million, or 6.8%, increase net interest income, primarily due to a decrease in interest expense on deposits. » Net interest income was $53.4 million, up 6.8% from the prior quarter » Noninterest income was $7.4 million, down 12.8% from the prior quarter » Noninterest expense was $34.5 million, down 1.6% from the previous quarter and included a $1.6 million gain on the sale of an other real estate owned property. » Efficiency ratio was 56.79%, compared with 59.98% for the prior quarter • Loans receivable were $6.25 billion, down from $6.26 billion from September 30, 2024 » Loan produ ction was $339.0 million with a weighted average interest rate of 7.37% » Loan yield was 5.97%, down 3 basis points from the prior quarter • Deposits were $6.44 billion, up 0.5% from September 30, 2024 , with noninterest - bearing demand deposits representing 32.6% of total deposits » Cost of interest - bearing deposits was 3.96%, down from 4.27% from the prior quarter • Credit loss expense was $0.9 million, net loan recoveries to average loans was 0.01%, and the allowance for credit losses to loans was 1.12%. • Tangible common equity to tangible assets (1) was 9.41%, Common equity tier 1 capital ratio was 12.11% and total capital ratio was 15.24% ROAE 8.89% (1) Non - GAAP financial measure; refer to the non - GAAP reconciliation slide 4
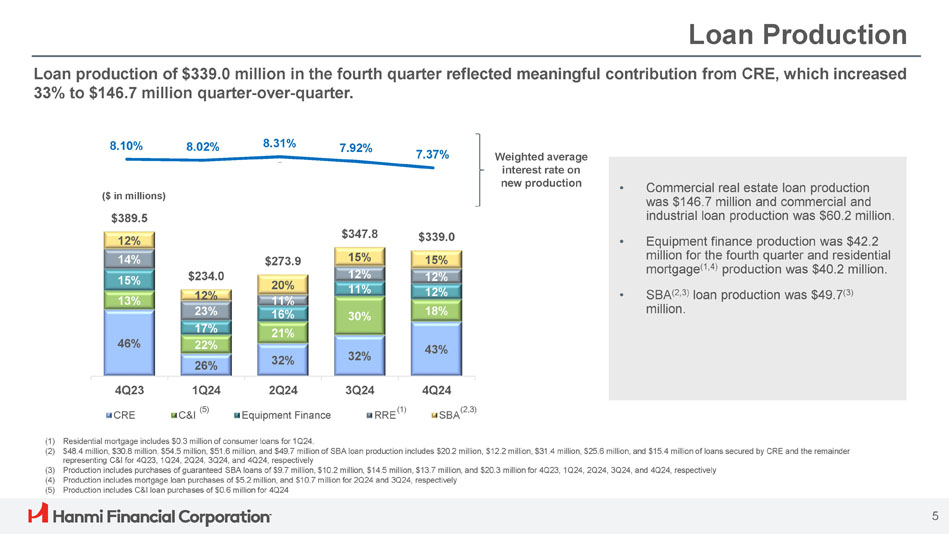
46% 32% 32% 43% 30% 15% 12% 11% $389.5 12% 14% 15% 13% $234.0 12% 23% 17% 22% 26% $273.9 20% 11% 16% 21% $347.8 $339.0 15% 12% 12% 18% 4Q23 2Q24 CRE Equipment Finance 8.10% 8.02% 8.31% 7.92% 7.37% Loan Production • Commercial real estate loan production was $146.7 million and commercial and industrial loan production was $60.2 million. • Equipment finance production was $42.2 million for the fourth quarter and residential mortgage (1,4) production was $40.2 million. • SBA (2,3) loan production was $49.7 (3) million. Loan production of $339.0 million in the fourth quarter reflected meaningful contribution from CRE, which increased 33% to $146.7 million quarter - over - quarter. Weighted average interest rate on new production (1) Residential mortgage includes $0.3 million of consumer loans for 1Q24. (2) $48.4 million, $30.8 million, $54.5 million, $51.6 million, and $49.7 million of SBA loan production includes $20.2 million, $12.2 million, $31.4 million, $25.6 million, and $15.4 million of loans secured by CRE and the remainder representing C&I for 4Q23, 1Q24, 2Q24, 3Q24, and 4Q24, respectively (3) Production includes purchases of guaranteed SBA loans of $9.7 million, $10.2 million, $14.5 million, $13.7 million, and $20.3 million for 4Q23, 1Q24, 2Q24, 3Q24, and 4Q24, respectively (4) Production includes mortgage loan purchases of $5.2 million, and $10.7 million for 2Q24 and 3Q24, respectively (5) Production includes C&I loan purchases of $0.6 million for 4Q24 5 ($ in millions) 4Q24 SBA (2,3) 3Q24 RRE (1) 1Q24 C&I (5)
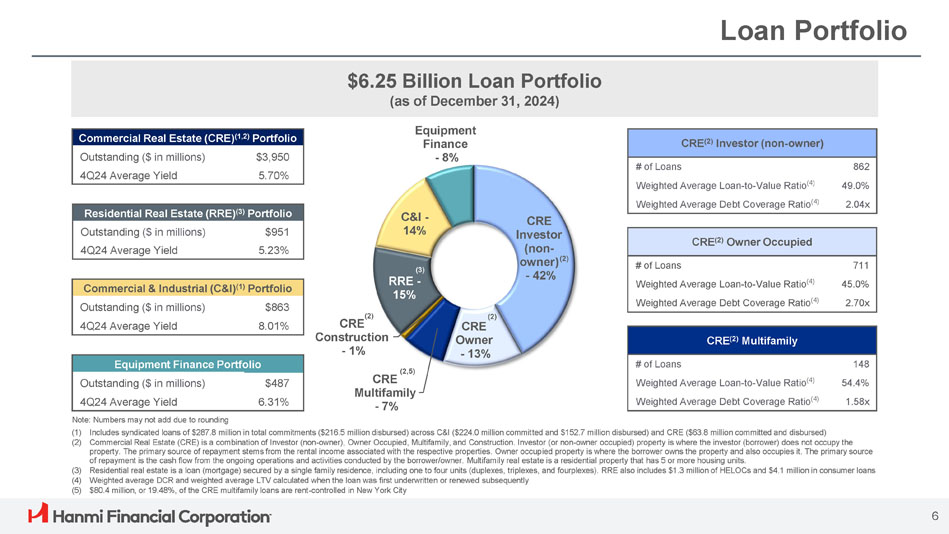
Loan Portfolio Commercial Real Estate (CRE) (1,2) Portfolio $3,950 Outstanding ($ in millions) 5.70% 4Q24 Average Yield $6.25 Billion Loan Portfolio (as of December 31, 2024) CRE 6 Owner - 13% CRE Multifamily - 7% CRE Construction - 1% C&I - 14% Equipment Finance - 8% CRE (2) Multifamily 148 # of Loans 54.4% Weighted Average Loan - to - Value Ratio (4) 1.58x Weighted Average Debt Coverage Ratio (4) CRE (2) Investor (non - owner) 862 # of Loans 49.0% Weighted Average Loan - to - Value Ratio (4) 2.04x Weighted Average Debt Coverage Ratio (4) CRE (2) Owner Occupied 711 # of Loans 45.0% Weighted Average Loan - to - Value Ratio (4) 2.70x Weighted Average Debt Coverage Ratio (4) Residential Real Estate (RRE) (3) Portfolio $951 Outstanding ($ in millions) 5.23% 4Q24 Average Yield Commercial & Industrial (C&I) (1) Portfolio $863 Outstanding ($ in millions) 8.01% 4Q24 Average Yield Equipment Finance Portfolio $487 Outstanding ($ in millions) 6.31% 4Q24 Average Yield Note: Numbers may not add due to rounding (1) Includes syndicated loans of $287.8 million in total commitments ($216.5 million disbursed) across C&I ($224.0 million committed and $152.7 million disbursed) and CRE ($63.8 million committed and disbursed) (2) Commercial Real Estate (CRE) is a combination of Investor (non - owner), Owner Occupied, Multifamily, and Construction. Investor (or non - owner occupied) property is where the investor (borrower) does not occupy the property. The primary source of repayment stems from the rental income associated with the respective properties. Owner occupied property is where the borrower owns the property and also occupies it. The primary source of repayment is the cash flow from the ongoing operations and activities conducted by the borrower/owner. Multifamily real estate is a residential property that has 5 or more housing units. (3) Residential real estate is a loan (mortgage) secured by a single family residence, including one to four units (duplexes, triplexes, and fourplexes). RRE also includes $1.3 million of HELOCs and $4.1 million in consumer loans (4) Weighted average DCR and weighted average LTV calculated when the loan was first underwritten or renewed subsequently (5) $80.4 million, or 19.48%, of the CRE multifamily loans are rent - controlled in New York City (2) (2,5) (2) CRE Investor (non - owner) (2) - 42% (3) RRE - 15%
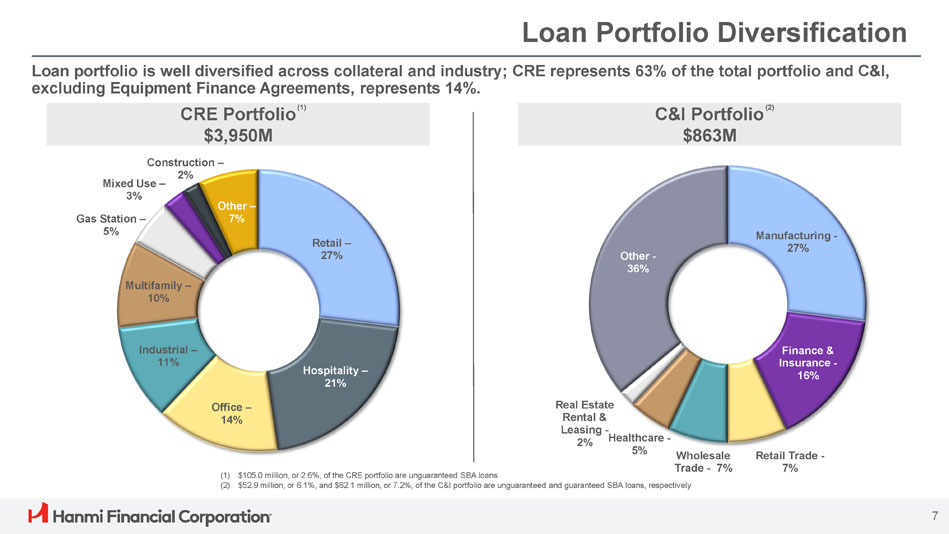
Loan Portfolio Diversification Loan portfolio is well diversified across collateral and industry; CRE represents 63% of the total portfolio and C&I, excluding Equipment Finance Agreements, represents 14%. CRE Portfolio (1) $3,950M C&I Portfolio (2) $863M Retail – 27% Hospitality – 21% Office – 14% Industrial – 11% Multifamily – 10% Gas Station – 5% Mixed Use – 3% Construction – 2% Other – 7% Manufacturing - 27% 7 Finance & Insurance - 16% Retail Trade - 7% Wholesale Trade - 7% Healthcare - 5% Real Estate Rental & Leasing - 2% Other - 36% (1) $105.0 million, or 2.6%, of the CRE portfolio are unguaranteed SBA loans (2) $52.9 million, or 6.1%, and $62.1 million, or 7.2%, of the C&I portfolio are unguaranteed and guaranteed SBA loans, respectively
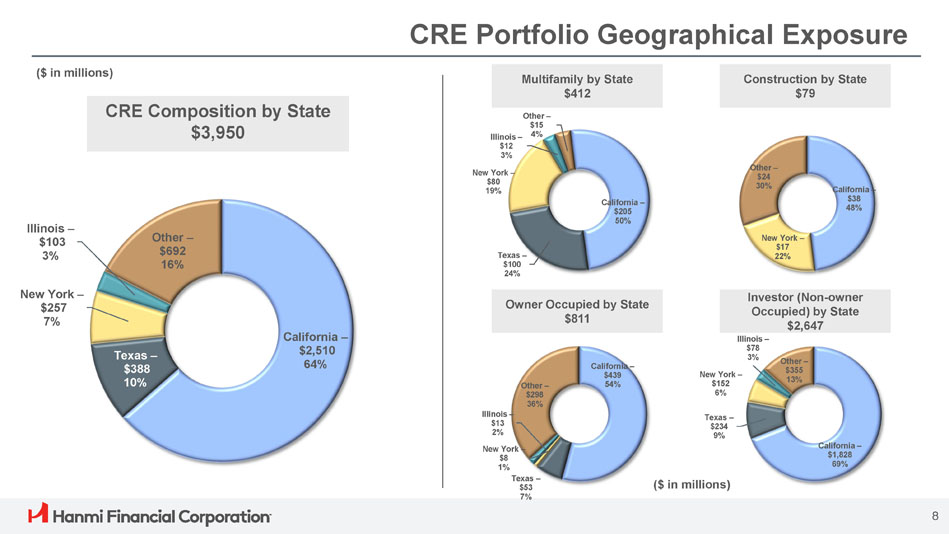
CRE Portfolio Geographical Exposure CRE Composition by State $3,950 Multifamily by State $412 Construction by State $79 Owner Occupied by State $811 Investor (Non - owner Occupied) by State $2,647 California – $2,510 64% Texas – $388 10% New York – $257 7% Illinois – $103 3% Other – $692 16% California – $205 50% Texas – $100 24% New York – $80 19% Illinois – $12 3% Other – $15 4% California – $38 48% New York – $17 22% Other – $24 30% California – $439 54% New York – $8 1% Texas – $53 7% Illinois – $13 2% Other – $298 36% California – $1,828 69% 8 Texas – $234 9% New York – $152 6% Illinois – $78 3% Other – $355 13% ($ in millions) ($ in millions)
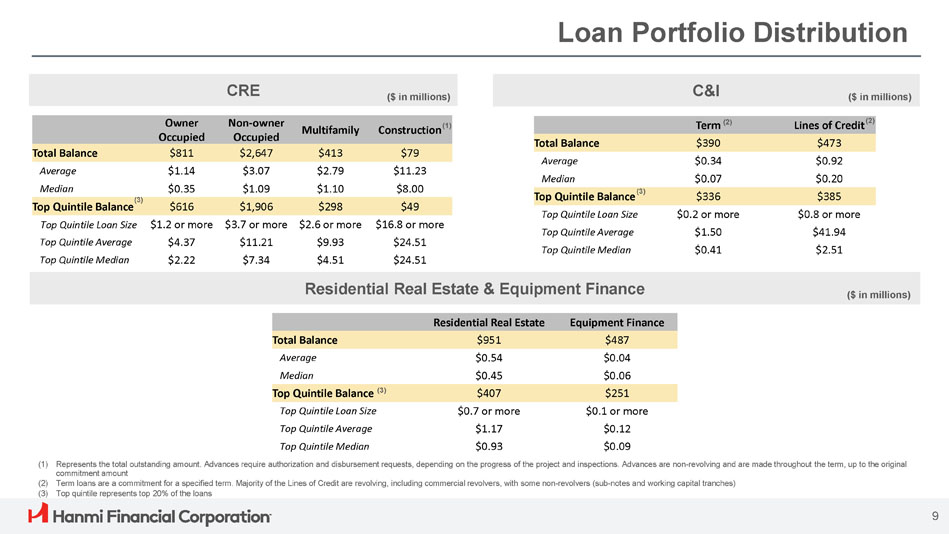
Loan Portfolio Distribution CRE C&I ($ in millions) ($ in millions) Construction (1) Multifamily Non - owner Occupied Owner Occupied $79 $413 $2,647 $811 Total Balance $11.23 $2.79 $3.07 $1.14 Average $8.00 $1.10 $1.09 $0.35 Median $49 $298 $1,906 $616 (3) Top Quintile Balance $16.8 or more $2.6 or more $3.7 or more $1.2 or more Top Quintile Loan Size $24.51 $9.93 $11.21 $4.37 Top Quintile Average $24.51 $4.51 $7.34 $2.22 Top Quintile Median Lines of Credit (2) Term (2) $473 $390 Total Balance $0.92 $0.34 Average $0.20 $0.07 Median $385 $336 (3) Top Quintile Balance $0.8 or more $0.2 or more Top Quintile Loan Size $41.94 $1.50 Top Quintile Average $2.51 $0.41 Top Quintile Median Residential Real Estate & Equipment Finance 9 Equipment Finance Residential Real Estate $487 $951 Total Balance $0.04 $0.54 Average $0.06 $0.45 Median $251 $407 Top Quintile Balance (3) $0.1 or more $0.7 or more Top Quintile Loan Size $0.12 $1.17 Top Quintile Average $0.09 $0.93 Top Quintile Median ($ in millions) (1) Represents the total outstanding amount. Advances require authorization and disbursement requests, depending on the progress of the project and inspections. Advances are non - revolving and are made throughout the term, up to the original commitment amount (2) Term loans are a commitment for a specified term. Majority of the Lines of Credit are revolving, including commercial revolvers, with some non - revolvers (sub - notes and working capital tranches) (3) Top quintile represents top 20% of the loans
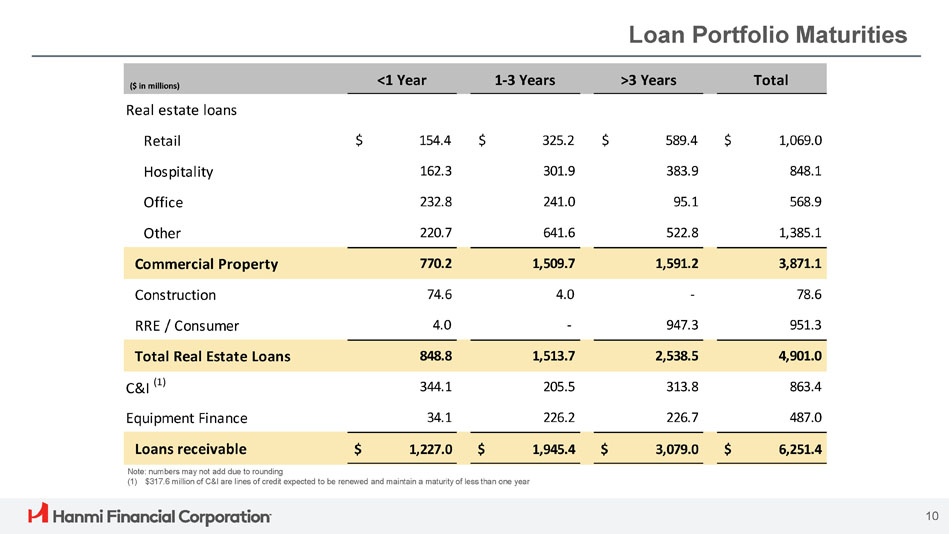
<1 Year 1 - 3 Years >3 Years Total Real estate loans $ 1,069.0 $ 589.4 $ 325.2 $ 154.4 Retail 848.1 383.9 301.9 162.3 Hospitality 568.9 95.1 241.0 232.8 Office 1,385.1 522.8 641.6 220.7 Other 3,871.1 1,591.2 1,509.7 770.2 Commercial Property 78.6 - 4.0 74.6 Construction 951.3 947.3 - 4.0 RRE / Consumer 4,901.0 2,538.5 1,513.7 848.8 Total Real Estate Loans 863.4 313.8 205.5 344.1 C&I (1) 487.0 226.7 226.2 34.1 Equipment Finance $ 6,251.4 $ 3,079.0 $ 1,945.4 $ 1,227.0 Loans receivable 10 Loan Portfolio Maturities ($ in millions) Note: numbers may not add due to rounding (1) $317.6 million of C&I are lines of credit expected to be renewed and maintain a maturity of less than one year
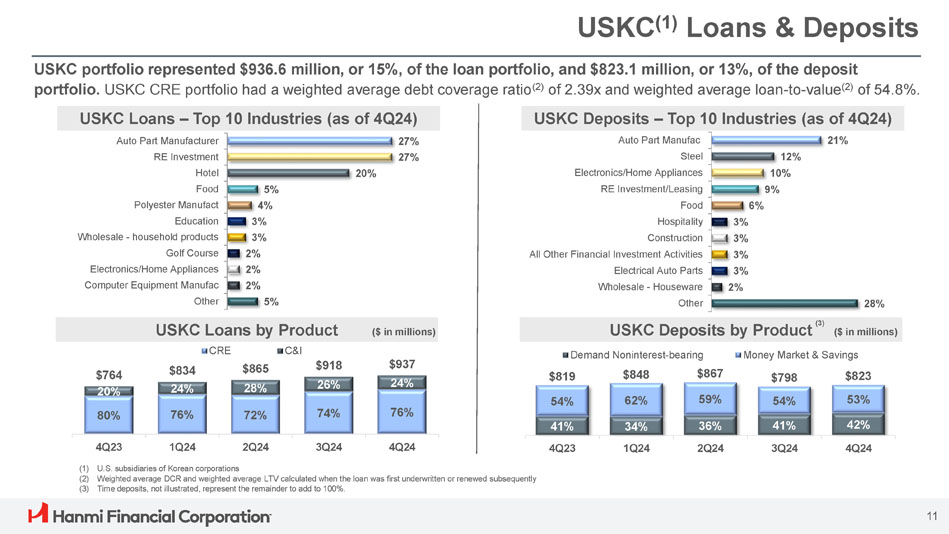
USKC (1) Loans & Deposits 27% 27% 20% 5% 4% 3% 3% 2% 2% 2% 5% Auto Part Manufacturer RE Investment Hotel Food Polyester Manufact Education Wholesale - household products Golf Course Electronics/Home Appliances Computer Equipment Manufac Other USKC portfolio represented $936.6 million, or 15%, of the loan portfolio, and $823.1 million, or 13%, of the deposit portfolio. USKC CRE portfolio had a weighted average debt coverage ratio (2) of 2.39x and weighted average loan - to - value (2) of 54.8%. USKC Loans – Top 10 Industries (as of 4Q24) 76% 72% 74% 76% $764 20% 80% $834 24% $865 28% $918 26% $937 24% CRE C&I USKC Loans by Product ($ in millions) USKC Deposits – Top 10 Industries (as of 4Q24) 21% Auto Part Manufac 12% Steel 10% Electronics/Home Appliances 9% RE Investment/Leasing 6% Food 3% Hospitality 3% Construction 3% All Other Financial Investment Activities 3% Electrical Auto Parts 2% Wholesale - Houseware 28% Other 4Q23 1Q24 2Q24 3Q24 4Q24 (1) U.S. subsidiaries of Korean corporations (2) Weighted average DCR and weighted average LTV calculated when the loan was first underwritten or renewed subsequently (3) Time deposits, not illustrated, represent the remainder to add to 100%. 41% 34% 36% 42% 54% 62% 59% $819 $848 $867 $798 54% 41% $823 53% 4Q23 1Q24 2Q24 3Q24 4Q24 Demand Noninterest - bearing Money Market & Savings 11 USKC Deposits by Product (3) ($ in millions)
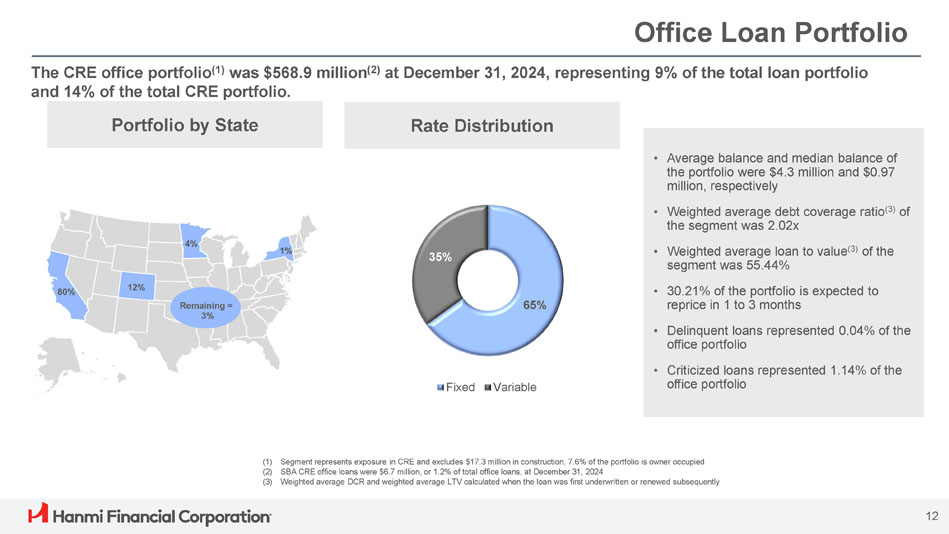
Office Loan Portfolio The CRE office portfolio (1) was $568.9 million (2) at December 31, 2024, representing 9% of the total loan portfolio and 14% of the total CRE portfolio. 80% 12% 4% Remaining = 3% 1% Portfolio by State • Average balance and median balance of the portfolio were $ 4 . 3 million and $ 0 . 97 million, respectively • Weighted average debt coverage ratio (3) of the segment was 2.02x • Weighted average loan to value (3) of the segment was 55.44% • 30.21% of the portfolio is expected to reprice in 1 to 3 months • Delinquent loans represented 0.04% of the office portfolio • Criticized loans represented 1.14% of the office portfolio Rate Distribution (1) Segment represents exposure in CRE and excludes $17.3 million in construction. 7.6% of the portfolio is owner occupied (2) SBA CRE office loans were $6.7 million, or 1.2% of total office loans, at December 31, 2024 (3) Weighted average DCR and weighted average LTV calculated when the loan was first underwritten or renewed subsequently 65% 35% Fixed Variable 12
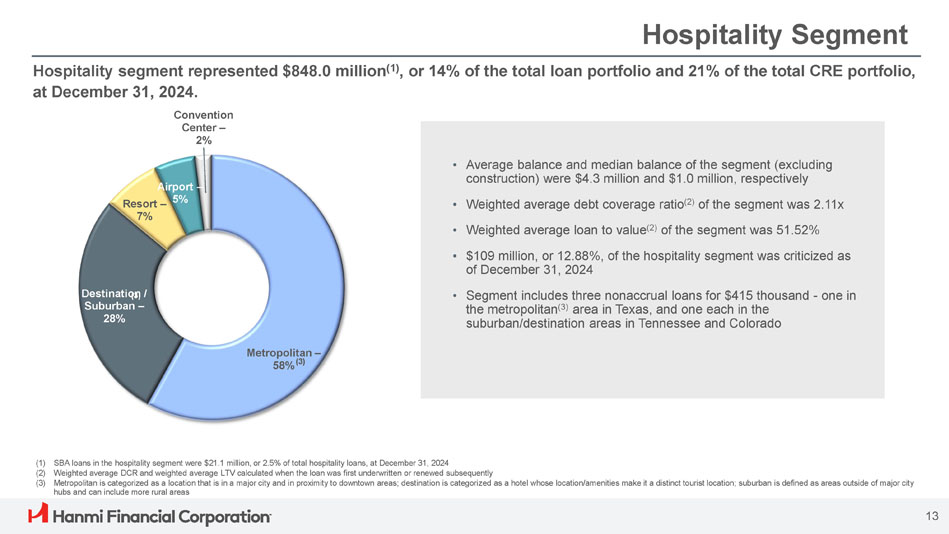
Airport – Resort – 5% 7% 13 Metropolitan – 58% (3) Destinatio (3 n ) / Suburban – 28% Center – 2% Hospitality segment represented $848.0 million (1) , or 14% of the total loan portfolio and 21% of the total CRE portfolio, at December 31, 2024. Convention Hospitality Segment (1) SBA loans in the hospitality segment were $21.1 million, or 2.5% of total hospitality loans, at December 31, 2024 (2) Weighted average DCR and weighted average LTV calculated when the loan was first underwritten or renewed subsequently (3) Metropolitan is categorized as a location that is in a major city and in proximity to downtown areas; destination is categorized as a hotel whose location/amenities make it a distinct tourist location; suburban is defined as areas outside of major city hubs and can include more rural areas • Average balance and median balance of the segment (excluding construction) were $4.3 million and $1.0 million, respectively • Weighted average debt coverage ratio (2) of the segment was 2.11x • Weighted average loan to value (2) of the segment was 51.52% • $109 million, or 12.88%, of the hospitality segment was criticized as of December 31, 2024 • Segment includes three nonaccrual loans for $415 thousand - one in the metropolitan (3) area in Texas, and one each in the suburban/destination areas in Tennessee and Colorado
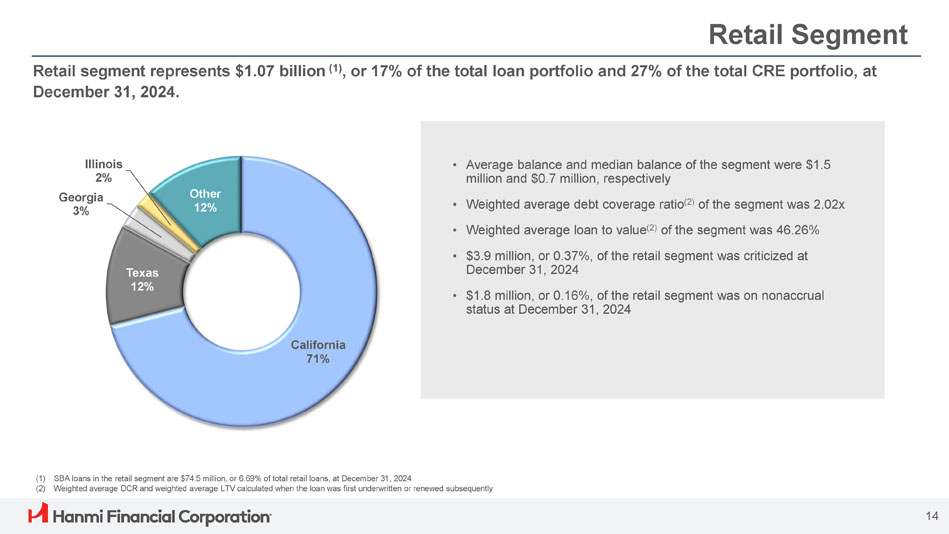
Retail Segment Retail segment represents $1.07 billion (1) , or 17% of the total loan portfolio and 27% of the total CRE portfolio, at December 31, 2024. (1) SBA loans in the retail segment are $74.5 million, or 6.69% of total retail loans, at December 31, 2024 (2) Weighted average DCR and weighted average LTV calculated when the loan was first underwritten or renewed subsequently • Average balance and median balance of the segment were $1.5 million and $0.7 million, respectively • Weighted average debt coverage ratio (2) of the segment was 2.02x • Weighted average loan to value (2) of the segment was 46.26% • $3.9 million, or 0.37%, of the retail segment was criticized at December 31, 2024 • $1.8 million, or 0.16%, of the retail segment was on nonaccrual status at December 31, 2024 California 71% 14 Texas 12% Illinois 2% Georgia 3% Other 12%
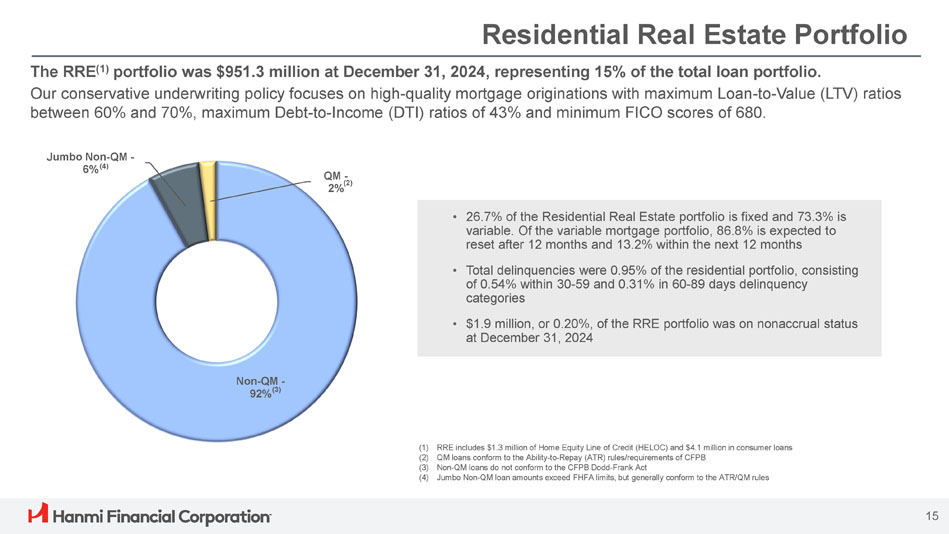
Residential Real Estate Portfolio QM - 2% (2) 15 Non - QM - 92% (3) Jumbo Non - QM - 6% (4) The RRE (1) portfolio was $951.3 million at December 31, 2024, representing 15% of the total loan portfolio. Our conservative underwriting policy focuses on high - quality mortgage originations with maximum Loan - to - Value (LTV) ratios between 60% and 70%, maximum Debt - to - Income (DTI) ratios of 43% and minimum FICO scores of 680. (1) RRE includes $1.3 million of Home Equity Line of Credit (HELOC) and $4.1 million in consumer loans (2) QM loans conform to the Ability - to - Repay (ATR) rules/requirements of CFPB (3) Non - QM loans do not conform to the CFPB Dodd - Frank Act (4) Jumbo Non - QM loan amounts exceed FHFA limits, but generally conform to the ATR/QM rules • 26.7% of the Residential Real Estate portfolio is fixed and 73.3% is variable. Of the variable mortgage portfolio, 86.8% is expected to reset after 12 months and 13.2% within the next 12 months • Total delinquencies were 0.95% of the residential portfolio, consisting of 0.54% within 30 - 59 and 0.31% in 60 - 89 days delinquency categories • $1.9 million, or 0.20%, of the RRE portfolio was on nonaccrual status at December 31, 2024
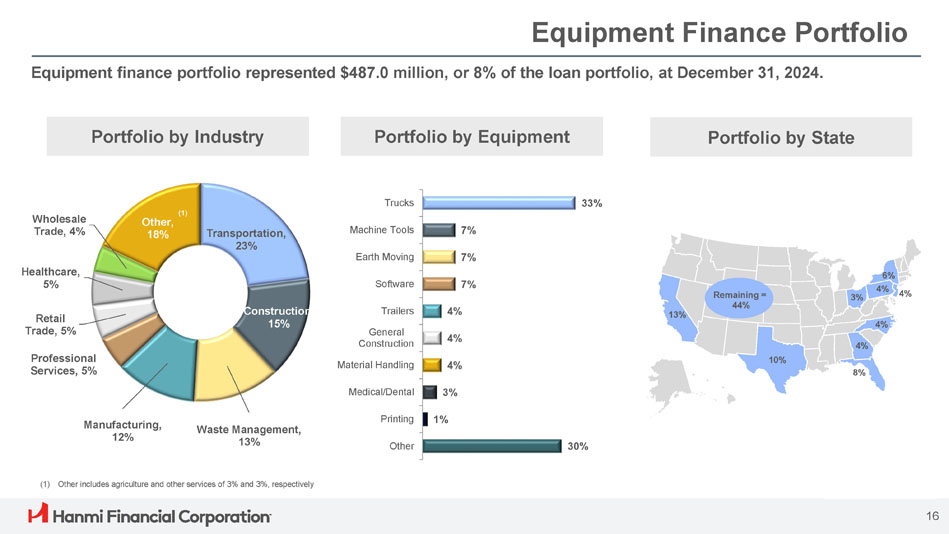
Equipment Finance Portfolio Equipment finance portfolio represented $487.0 million, or 8% of the loan portfolio, at December 31, 2024. Portfolio by Industry Portfolio by Equipment Portfolio by State 33% Trucks 7% 7% Machine Tools Earth Moving Transportation, 23% (1) Wholesale Other, Trade, 4% 18% 6% Healthcare, 4% 4% 4% 3% 4% Remaining = 44% 13% 7% 4% 4% Software Trailers General Construction Construction 15% 5% Retail Trade, 5% 8% 10% 4% Material Handling Professional Services, 5% 3% Medical/Dental 1% 30% Manufacturing, Waste Management, Printing 12% 13% Other (1) Other includes agriculture and other services of 3% and 3%, respectively 16
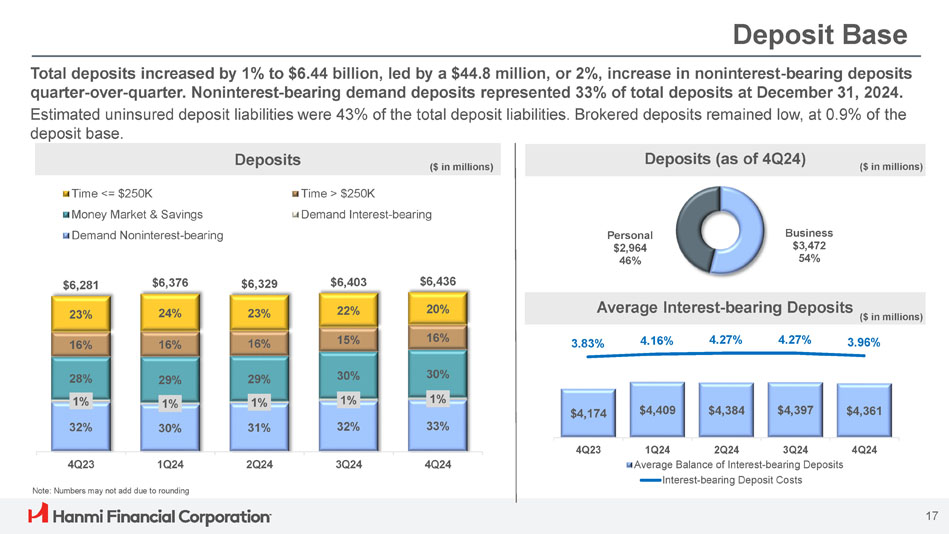
3.83% 4.16% 4.27% 4.27% 3.96% $4,174 $4,409 $4,384 $4,397 $4,361 1Q24 2Q24 3Q24 Average Balance of Interest - bearing Deposits Interest - bearing Deposit Costs 4Q23 4Q24 Deposit Base Total deposits increased by 1% to $6.44 billion, led by a $44.8 million, or 2%, increase in noninterest - bearing deposits quarter - over - quarter. Noninterest - bearing demand deposits represented 33% of total deposits at December 31, 2024. Estimated uninsured deposit liabilities were 43% of the total deposit liabilities. Brokered deposits remained low, at 0.9% of the deposit base. 4Q23 1Q24 Note: Numbers may not add due to rounding Deposits Deposits (as of 4Q24) ($ in millions) ($ in millions) Average Interest - bearing Deposits Business $3,472 54% Personal $2,964 46% ($ in millions) 32% 30% 31% 32% 33% 1% 1% 1% 1% 1% 28% 29% 29% 30% 30% 16% 16% 16% 15% 16% 23% 24% 23% 22% 20% $6,281 $6,376 $6,329 $6,403 $6,436 2Q24 3Q24 4Q24 Time <= $250K Money Market & Savings Demand Noninterest - bearing Time > $250K Demand Interest - bearing 17
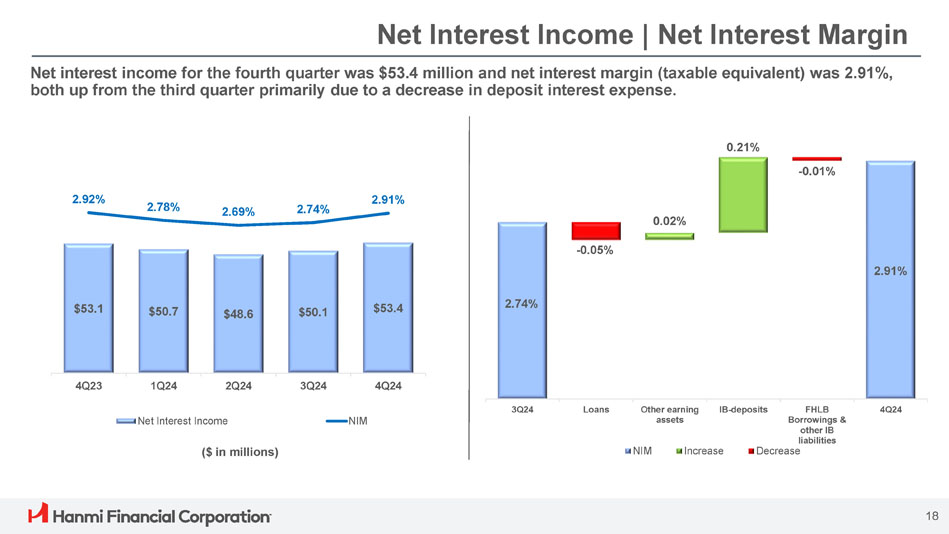
Net Interest Income | Net Interest Margin Net interest income for the fourth quarter was $53.4 million and net interest margin (taxable equivalent) was 2.91%, both up from the third quarter primarily due to a decrease in deposit interest expense. ($ in millions) 2.74% - 0.05% 0.02% 0.21% - 0.01% 2.91% 3Q24 Loans Other earning assets IB - deposits FHLB Borrowings & other IB liabilities Decrease 4Q24 NIM Increase $53.1 $50.7 $48.6 $50.1 $53.4 2.92% 2.78% 2.69% 2.74% 2.91% 4Q23 1Q24 2Q24 3Q24 4Q24 Net Interest Income NIM 18
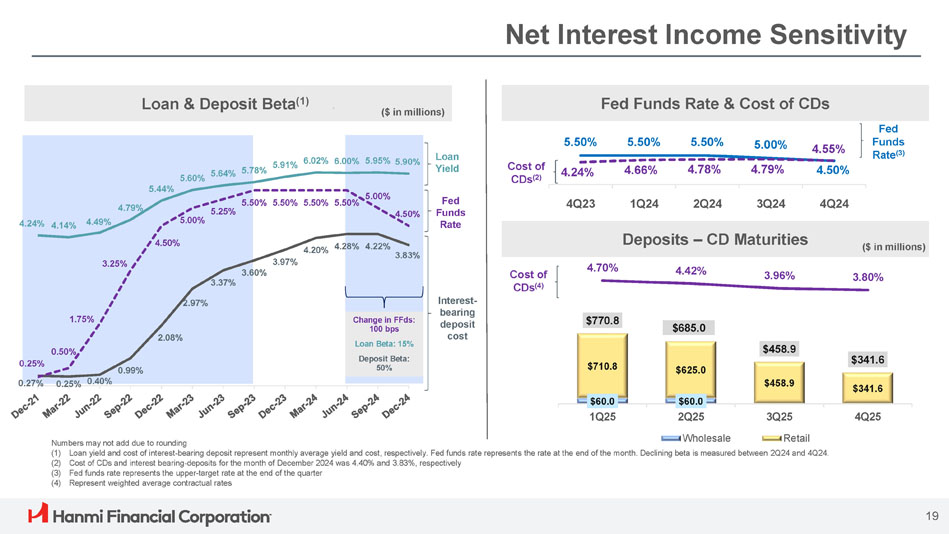
4.24% 4.14% 4.49% 4.79% 5.44% 5.60% 5.64% 5.78% 5.91% 6.02% 6.00% 5.95% 5.90% 0.27 % 0.25% 0.40% 0.99% 2.08% 2.97% 3.37% 3.60% 3.97% 4.20% 4.28% 4.22% 3.83% 0.25% 0.50% 1.75% 3.25% 4.50% 5.00% 5.25% 5.50% 5.50% 5.50% 5.50% 5.00% 4.50% Deposits – CD Maturities Net Interest Income Sensitivity Loan & Deposit Beta (1) . Fed Funds Rate & Cost of CDs $60.0 $60.0 $710.8 $625.0 $458.9 $341.6 $770.8 $685.0 $458.9 $341.6 4.70% 4.42% 3.96% 3.80% 1Q25 4Q25 2Q25 Wholesale 3Q25 Retail ($ in millions) 5.50% 5.50% 5.50% 5.00% 4.55% 4.50% 4.79% 4.78% 4.66% 4.24% 4Q24 3Q24 2Q24 1Q24 4Q23 Fed Funds Rate (3) Cost of CDs (2) ($ in millions) Cost of CDs (4) Numbers may not add due to rounding (1) Loan yield and cost of interest - bearing deposit represent monthly average yield and cost, respectively. Fed funds rate represents the rate at the end of the month. Declining beta is measured between 2Q24 and 4Q24. (2) Cost of CDs and interest bearing - deposits for the month of December 2024 was 4.40% and 3.83%, respectively (3) Fed funds rate represents the upper - target rate at the end of the quarter (4) Represent weighted average contractual rates Fed Funds Rate Loan Yield Interest - bearing deposit cost Change in FFds: 100 bps Loan Beta: 15% Deposit Beta: 50% 19
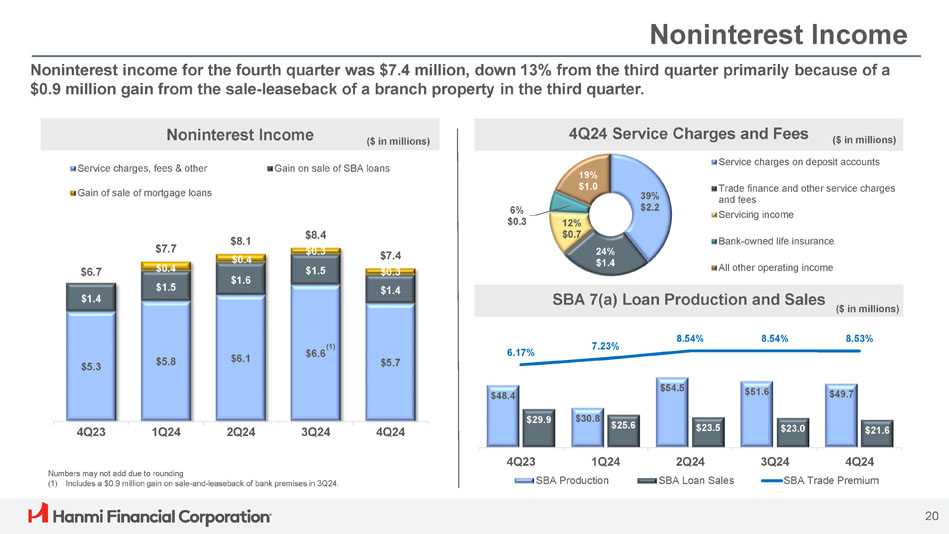
39% $2.2 24% $1.4 12% $0.7 6% $0.3 19% $1.0 Service charges on deposit accounts Trade finance and other service charges and fees Servicing income Bank - owned life insurance All other operating income Noninterest Income SBA 7(a) Loan Production and Sales ($ in millions) $48.4 $30.8 $54.5 $51.6 $49.7 $29.9 $25.6 $23.5 $23.0 $21.6 6.17% 7.23% 8.54% 8.54% 8.53% 4Q23 1Q24 2Q24 SBA Loan Sales SBA Production 3Q24 4Q24 SBA Trade Premium Noninterest income for the fourth quarter was $7.4 million, down 13% from the third quarter primarily because of a $0.9 million gain from the sale - leaseback of a branch property in the third quarter. Noninterest Income 4Q24 Service Charges and Fees ($ in millions) ($ in millions) $5.3 $5.8 $6.1 $5.7 $1.4 $0.4 $1.5 $6.7 $7.7 $8.1 $0.4 $1.6 $8.4 $0.3 $1.5 $7.4 $0.3 $1.4 4Q23 1Q24 2Q24 3Q24 4Q24 (1) $6.6 Service charges, fees & other Gain on sale of SBA loans Gain of sale of mortgage loans Numbers may not add due to rounding (1) Includes a $0.9 million gain on sale - and - leaseback of bank premises in 3Q24. 20
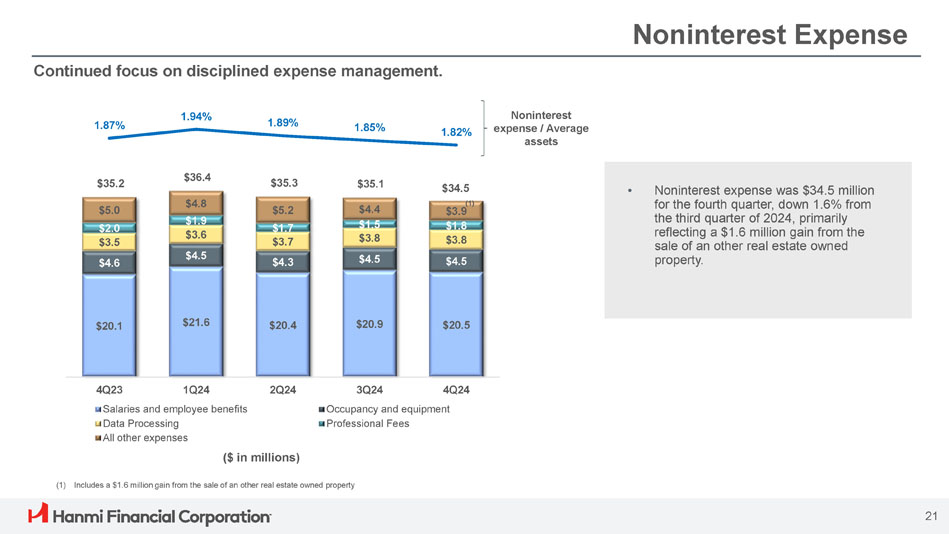
Noninterest Expense • Noninterest expense was $34.5 million for the fourth quarter, down 1.6% from the third quarter of 2024, primarily reflecting a $1.6 million gain from the sale of an other real estate owned property. Continued focus on disciplined expense management. Noninterest expense / Average assets $20.1 $21.6 $20.4 $20.9 $20.5 $5.0 $2.0 $3.5 $4.6 $4.8 $1.9 $3.6 $4.5 $5.2 $1.7 $3.7 $4.3 $4.4 $1.5 $3.8 $4.5 $35.2 $36.4 $35.3 $35.1 1.87% 1.94% 1.89% 1.85% 1.82% 3Q24 4Q24 Occupancy and equipment Professional Fees 4Q23 1Q24 2Q24 Salaries and employee benefits Data Processing All other expenses ($ in millions) 21 $34.5 (1) $3.9 $1.8 $3.8 $4.5 (1) Includes a $1.6 million gain from the sale of an other real estate owned property
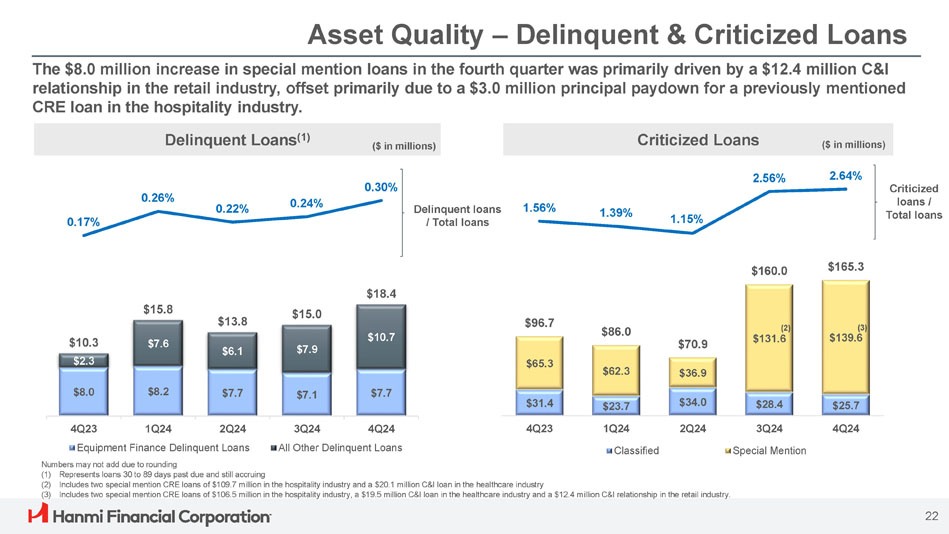
Asset Quality – Delinquent & Criticized Loans Delinquent loans / Total loans $65.3 $62.3 $36.9 $96.7 $86.0 $70.9 $160.0 $165.3 1.56% 1.39% 1.15% 2.56% 2.64% Classified Special Mention Delinquent Loans (1) Criticized Loans Criticized loans / Total loans The $8.0 million increase in special mention loans in the fourth quarter was primarily driven by a $12.4 million C&I relationship in the retail industry, offset primarily due to a $3.0 million principal paydown for a previously mentioned CRE loan in the hospitality industry. $8.0 $8.2 $7.7 $7.1 $7.7 $7.6 $6.1 $7.9 $10.7 $10.3 $2.3 $25.7 $28.4 $34.0 $23.7 $31.4 4Q24 3Q24 2Q24 1Q24 4Q23 4Q24 3Q24 2Q24 1Q24 4Q23 (2) $131.6 (3) $139.6 $15.8 $13.8 $15.0 $18.4 0.17% 0.26% 0.22% 0.24% 0.30% Equipment Finance Delinquent Loans All Other Delinquent Loans Numbers may not add due to rounding 22 ($ in millions) ($ in millions) (1) Represents loans 30 to 89 days past due and still accruing (2) Includes two special mention CRE loans of $109.7 million in the hospitality industry and a $20.1 million C&I loan in the healthcare industry (3) Includes two special mention CRE loans of $106.5 million in the hospitality industry, a $19.5 million C&I loan in the healthcare industry and a $12.4 million C&I relationship in the retail industry.
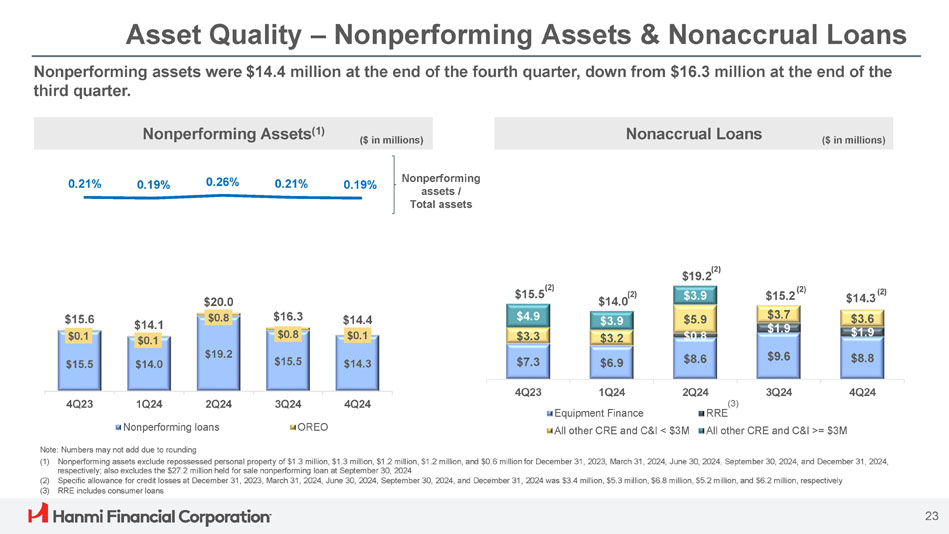
$0.1 $0.1 $0.8 $0.8 $0.1 $15.6 $14.1 $20.0 $16.3 $14.4 4Q23 3Q24 4Q24 1Q24 2Q24 Nonperforming loans OREO Asset Quality – Nonperforming Assets & Nonaccrual Loans 0.21% 0.19% 0.26% 0.21% 0.19% Nonperforming assets / Total assets Nonperforming Assets (1) Nonaccrual Loans Nonperforming assets were $14.4 million at the end of the fourth quarter, down from $16.3 million at the end of the third quarter. ($ in millions) ($ in millions) Note: Numbers may not add due to rounding (1) Nonperforming assets exclude repossessed personal property of $1.3 million, $1.3 million, $1.2 million, $1.2 million, and $0.6 million for December 31, 2023, March 31, 2024, June 30, 2024, September 30, 2024, and December 31, 2024, respectively; also excludes the $27.2 million held for sale nonperforming loan at September 30, 2024 (2) Specific allowance for credit losses at December 31, 2023, March 31, 2024, June 30, 2024, September 30, 2024, and December 31, 2024 was $3.4 million, $5.3 million, $6.8 million, $5.2 million, and $6.2 million, respectively (3) RRE includes consumer loans $14.0 $3.9 $3.2 $19.2 $3.9 $5.9 $0.8 $8.8 $9.6 $8.6 $6.9 $7.3 $14.3 $19.2 $15.5 $14.0 $15.5 4Q24 3Q24 2Q24 1Q24 4Q23 Equipment Finance All other CRE and C&I < $3M (2) 23 (3) RRE All other CRE and C&I >= $3M (2) (2) $15.5 $4.9 $3.3 $14.3 (2) $3.6 $1.9 $15.2 (2) $3.7 $1.9
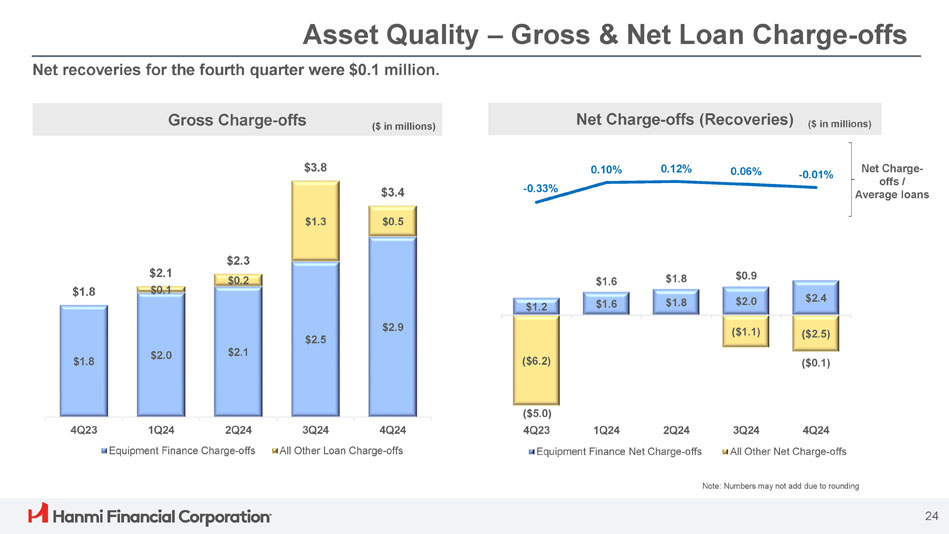
Asset Quality – Gross & Net Loan Charge - offs Gross Charge - offs Net Charge - offs (Recoveries) Net Charge - offs / Average loans Net recoveries for the fourth quarter were $0.1 million. ($ in millions) ($ in millions) $1.8 $2.0 $2.1 $2.5 $2.9 $1.3 $0.5 $1.8 $2.1 $0.1 $2.3 $0.2 $3.8 $3.4 4Q23 1Q24 2Q24 Equipment Finance Charge - offs 3Q24 4Q24 All Other Loan Charge - offs Note: Numbers may not add due to rounding $1.2 $1.6 $1.8 $2.0 $2.4 ($6.2) ($1.1) ($2.5) $1.6 $1.8 $0.9 ($0.1) - 0.33% 0.10% 0.12% 0.06% - 0.01% 3Q24 4Q24 All Other Net Charge - offs ($5.0) 4Q23 1Q24 2Q24 Equipment Finance Net Charge - offs 24
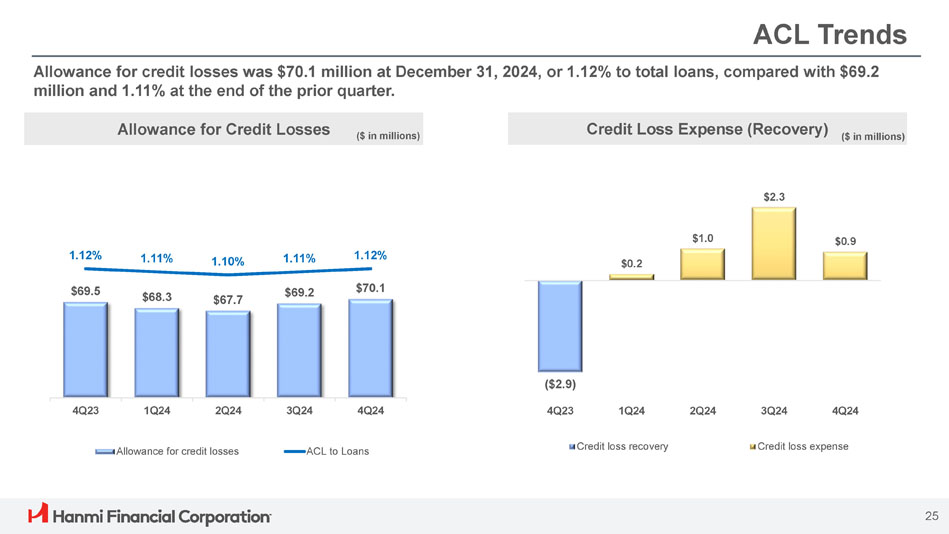
ACL Trends Allowance for credit losses was $70.1 million at December 31, 2024, or 1.12% to total loans, compared with $69.2 million and 1.11% at the end of the prior quarter. $69.5 $68.3 $67.7 $69.2 $70.1 1.12% 1.11% 1.10% 1.11% 1.12% 4Q23 1Q24 2Q24 3Q24 4Q24 Allowance for credit losses ACL to Loans ($2.9) $0.2 $1.0 $2.3 $0.9 4Q23 1Q24 2Q24 3Q24 4Q24 Credit loss recovery Credit loss expense Allowance for Credit Losses Credit Loss Expense (Recovery) 25 ($ in millions) ($ in millions)
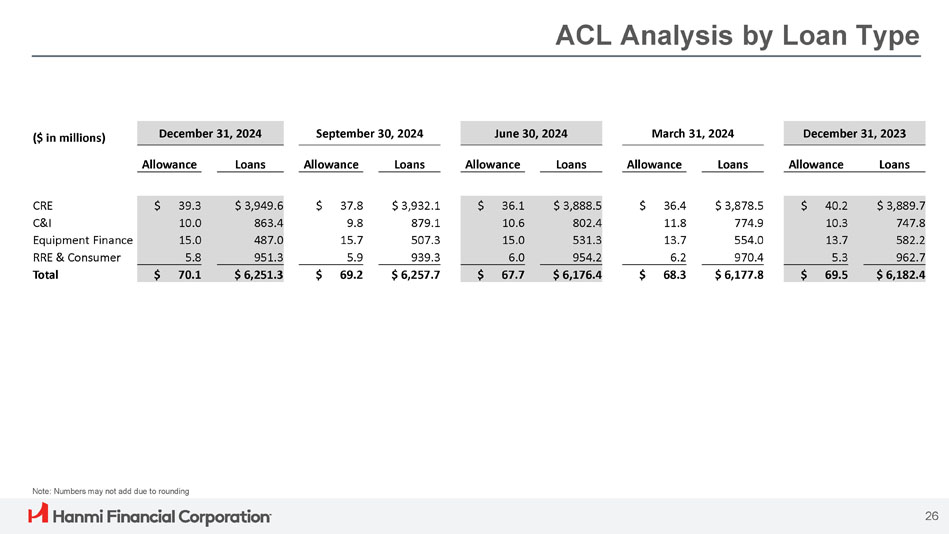
ACL Analysis by Loan Type December 31, 2023 March 31, 2024 June 30, 2024 September 30, 2024 December 31, 2024 ($ in millions) Loans Allowance Loans Allowance Loans Allowance Loans Allowance Loans Allowance $ 3,889.7 $ 40.2 $ 3,878.5 $ 36.4 $ 3,888.5 $ 36.1 $ 3,932.1 $ 37.8 $ 3,949.6 $ 39.3 CRE 747.8 10.3 774.9 11.8 802.4 10.6 879.1 9.8 863.4 10.0 C&I 582.2 13.7 554.0 13.7 531.3 15.0 507.3 15.7 487.0 15.0 Equipment Finance 962.7 5.3 970.4 6.2 954.2 6.0 939.3 5.9 951.3 5.8 RRE & Consumer $ 6,182.4 $ 69.5 $ 6,177.8 $ 68.3 $ 6,176.4 $ 67.7 $ 6,257.7 $ 69.2 $ 6,251.3 $ 70.1 Total Note: Numbers may not add due to rounding 26
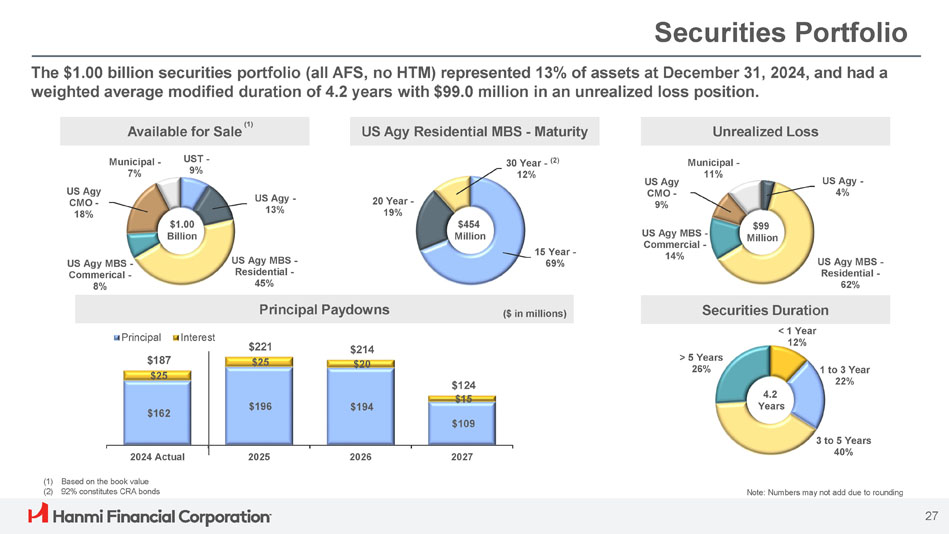
US Agy Residential MBS - Maturity 15 Year - 69% 20 Year - 19% Securities Portfolio The $1.00 billion securities portfolio (all AFS, no HTM) represented 13% of assets at December 31, 2024, and had a weighted average modified duration of 4.2 years with $99.0 million in an unrealized loss position. Principal Paydowns ($ in millions) $162 $196 $194 $109 $187 $25 $221 $25 $214 $20 $124 $15 2024 Actual 2025 2026 2027 Principal Interest Note: Numbers may not add due to rounding Unrealized Loss US Agy - 4% US Agy MBS - Residential - 62% US Agy MBS - Commercial - 14% US Agy CMO - 9% Municipal - 11% Available for Sale UST - 9% US Agy - 13% US Agy MBS - Residential - 45% US Agy MBS - Commerical - 8% US Agy CMO - 18 % Municipal - 7% $1.00 Billion Securities Duration < 1 Year 12% 1 to 3 Year 22% 3 to 5 Years 40% > 5 Years 26% 4.2 Years $454 Million 30 Year - (2) 12% $99 Million (1) Based on the book value (2) 92% constitutes CRA bonds 27 (1)
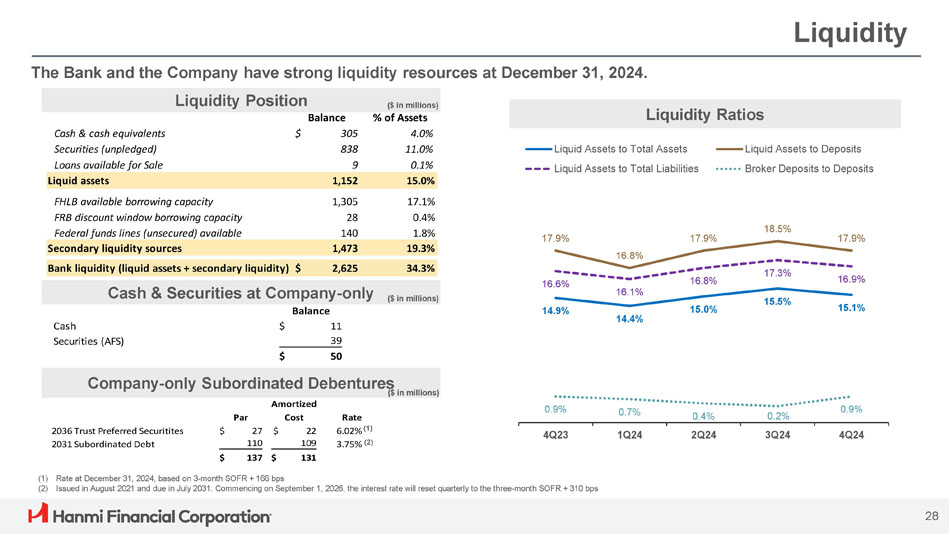
Balance 305 838 9 % of Assets 4.0% 11.0% 0.1% Cash & cash equivalents Securities (unpledged) Loans available for Sale $ Liquid assets 1,152 15.0% Liquid Assets to Total Liabilities 17.1% 1,305 FHLB available borrowing capacity 0.4% 28 FRB discount window borrowing capacity 1.8% 140 Federal funds lines (unsecured) available 19.3% 1,473 Secondary liquidity sources 34.3% 2,625 Bank liquidity (liquid assets + secondary liquidity) $ Cash & Securities at Company - only ($ in millions Liquidity The Bank and the Company have strong liquidity resources at December 31, 2024. (1) Rate at December 31, 2024, based on 3 - month SOFR + 166 bps (2) Issued in August 2021 and due in July 2031. Commencing on September 1, 2026, the interest rate will reset quarterly to the three - month SOFR + 310 bps Liquidity Position ($ in millions) 14.9% 14.4% 15.0% 15.5% 15.1% 17.9% 16.8% 17.9% 18.5% 17.9% 16.6% 16.1% 16.8% 17.3% 16.9% 0.9% 0.7% 0.4% 0.2% 0.9% 4Q23 1Q24 2Q24 3Q24 4Q24 Liquid Assets to Total Assets Liquid Assets to Deposits Broker Deposits to Deposits Liquidity Ratios Par Amortized Cost Rate 6.02% (1) 3.75% (2) 2036 Trust Preferred Securitites 2031 Subordinated Debt $ 27 $ 22 110 109 $ 137 $ 131 Company - only Subordinated Debentures 28 ($ in millions) ) Balance Cash Securities (AFS) $ 11 39 $ 50
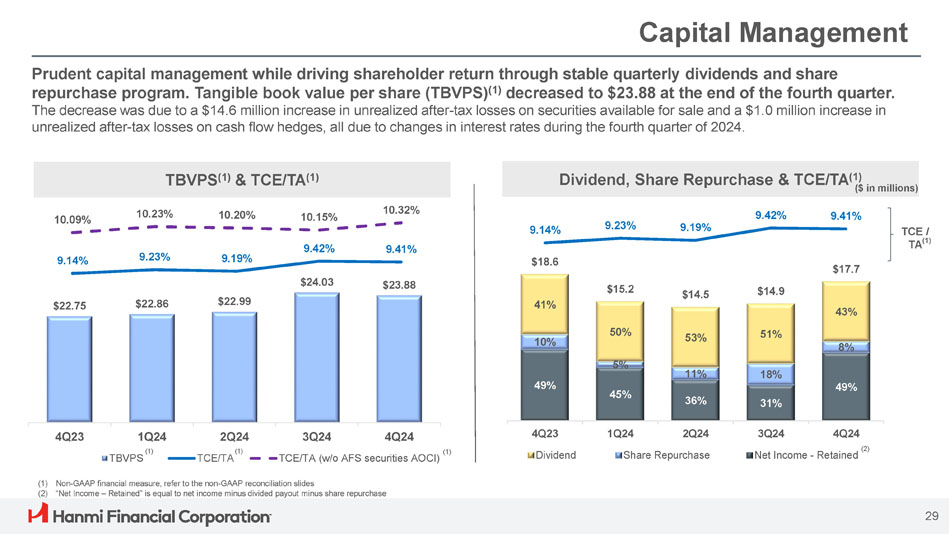
9.14% 9.23% 9.19% 9.42% 9.41% $22.75 $24.03 $23.88 4Q23 9.14% 9.42% 9.41% 10.09% 10.20% 10.23% 9.19% 9.23% $22.99 $22.86 10.15% 2Q24 (1) TCE/TA 3Q24 4Q24 (1) TCE/TA (w/o AFS securities AOCI) 1Q24 (1) TBVPS 10.32% 49% 45% 36% 31% 49% 10% 5% 11% 18% 8% 41% 50% 53% 51% 43% $18.6 $15.2 $14.5 $14.9 $17.7 3Q24 4Q24 (2) Net Income - Retained 4Q23 Dividend 1Q24 2Q24 Share Repurchase (1) Non - GAAP financial measure, refer to the non - GAAP reconciliation slides (2) “Net Income – Retained” is equal to net income minus divided payout minus share repurchase Capital Management Prudent capital management while driving shareholder return through stable quarterly dividends and share repurchase program. Tangible book value per share (TBVPS) (1) decreased to $23.88 at the end of the fourth quarter. The decrease was due to a $14.6 million increase in unrealized after - tax losses on securities available for sale and a $1.0 million increase in unrealized after - tax losses on cash flow hedges, all due to changes in interest rates during the fourth quarter of 2024. TBVPS (1) & TCE/TA (1) TCE / TA (1) Dividend, Share Repurchase & TCE/TA (1) 29 ($ in millions)
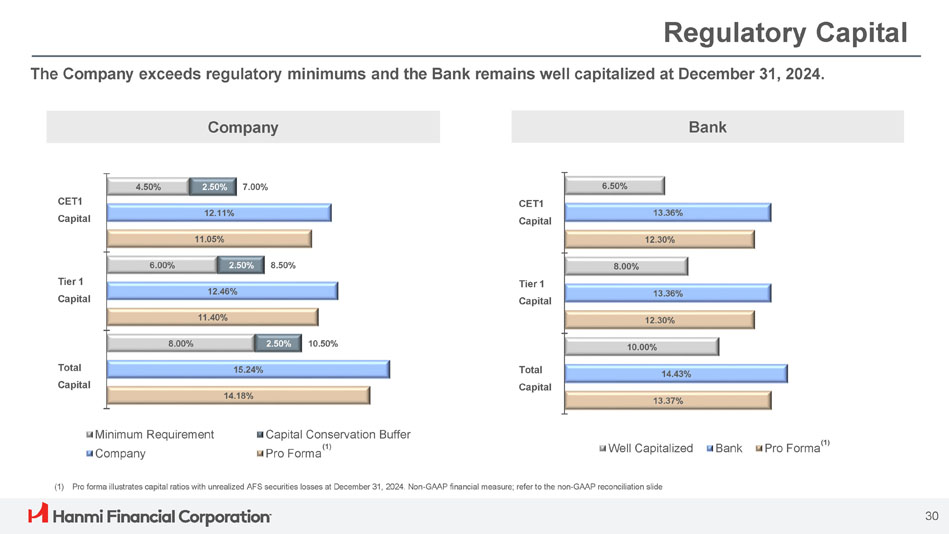
Regulatory Capital The Company exceeds regulatory minimums and the Bank remains well capitalized at December 31, 2024. 8.00% 6.00% 4.50% 2.50% 2.50% 2.50% 15.24% 12.46% 12.11% 14.18% 11.40% 11.05% 10.50% 8.50% 7.00% Minimum Requirement Capital Conservation Buffer Company Pro Forma 10.00% 8.00% 6.50% 14.43% 13.36% 13.36% 13.37% 12.30% 12.30% Well Capitalized Bank Pro Forma (1) 30 CET1 Capital Tier 1 Capital Total Capital Company Bank CET1 Capital Tier 1 Capital Total Capital (1) Pro forma illustrates capital ratios with unrealized AFS securities losses at December 31, 2024. Non - GAAP financial measure; refer to the non - GAAP reconciliation slide (1)

Appendix 31
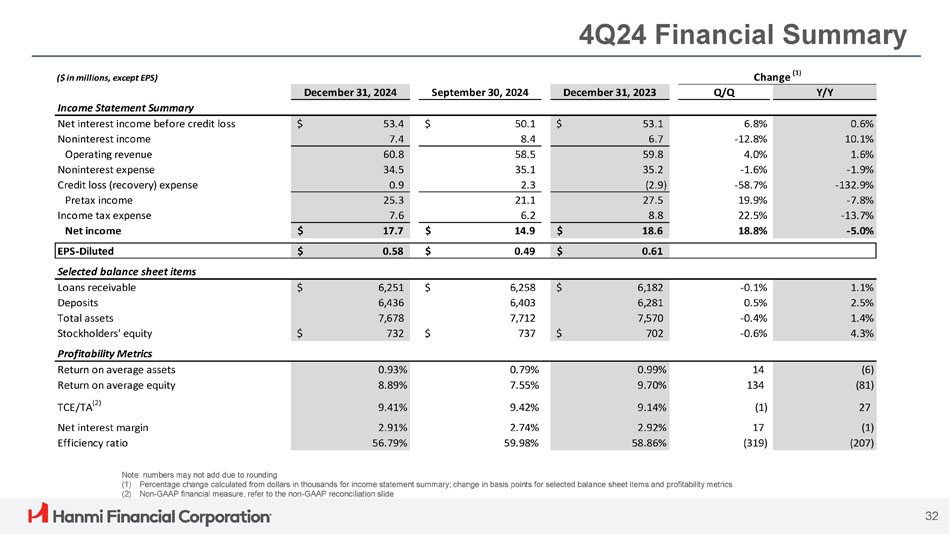
4Q24 Financial Summary Note: numbers may not add due to rounding (1) Percentage change calculated from dollars in thousands for income statement summary; change in basis points for selected balance sheet items and profitability metrics (2) Non - GAAP financial measure, refer to the non - GAAP reconciliation slide $ 0.61 $ 0.49 $ 0.58 EPS - Diluted ($ in millions, except EPS) Change (1) December 31, 2024 September 30, 2024 December 31, 2023 Q/Q Y/Y Income Statement Summary 0.6% 6.8% $ 53.1 $ 50.1 $ 53.4 Net interest income before credit loss 10.1% - 12.8% 6.7 8.4 7.4 Noninterest income 1.6% 4.0% 59.8 58.5 60.8 Operating revenue - 1.9% - 1.6% 35.2 35.1 34.5 Noninterest expense - 132.9% - 58.7% (2.9) 2.3 0.9 Credit loss (recovery) expense - 7.8% 19.9% 27.5 21.1 25.3 Pretax income - 13.7% 22.5% 8.8 6.2 7.6 Income tax expense - 5.0% 18.8% $ 18.6 $ 14.9 $ 17.7 Net income Selected balance sheet items 1.1% - 0.1% $ 6,182 $ 6,258 $ 6,251 Loans receivable 2.5% 0.5% 6,281 6,403 6,436 Deposits 1.4% - 0.4% 7,570 7,712 7,678 Total assets 4.3% - 0.6% $ 702 $ 737 $ 732 Stockholders' equity Profitability Metrics (6) 14 0.99% 0.79% 0.93% Return on average assets (81) 134 9.70% 7.55% 8.89% Return on average equity 27 (1) 9.14% 9.42% 9.41% TCE/TA (2) (1) 17 2.92% 2.74% 2.91% Net interest margin (207) (319) 58.86% 59.98% 56.79% Efficiency ratio 32
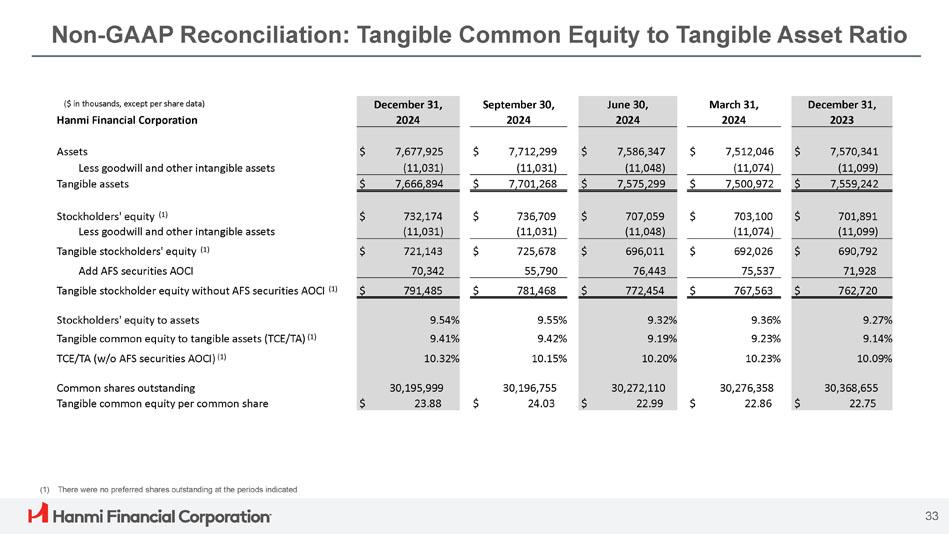
Non - GAAP Reconciliation: Tangible Common Equity to Tangible Asset Ratio 33 (1) There were no preferred shares outstanding at the periods indicated December 31, March 31, June 30, September 30, December 31, ($ in thousands, except per share data) 2023 2024 2024 2024 2024 Hanmi Financial Corporation $ 7,570,341 $ 7,512,046 $ 7,586,347 $ 7,712,299 $ 7,677,925 Assets (11,099) (11,074) (11,048) (11,031) (11,031) Less goodwill and other intangible assets $ 7,559,242 $ 7,500,972 $ 7,575,299 $ 7,701,268 $ 7,666,894 Tangible assets $ 701,891 $ 703,100 $ 707,059 $ 736,709 $ 732,174 Stockholders' equity (1) (11,099) (11,074) (11,048) (11,031) (11,031) Less goodwill and other intangible assets $ 690,792 $ 692,026 $ 696,011 $ 725,678 $ 721,143 Tangible stockholders' equity (1) 71,928 75,537 76,443 55,790 70,342 Add AFS securities AOCI $ 762,720 $ 767,563 $ 772,454 $ 781,468 $ 791,485 Tangible stockholder equity without AFS securities AOCI (1) 9.27% 9.36% 9.32% 9.55% 9.54% Stockholders' equity to assets 9.14% 9.23% 9.19% 9.42% 9.41% Tangible common equity to tangible assets (TCE/TA) (1) 10.09% 10.23% 10.20% 10.15% 10.32% TCE/TA (w/o AFS securities AOCI) (1) 30,368,655 30,276,358 30,272,110 30,196,755 30,195,999 Common shares outstanding $ 22.75 $ 22.86 $ 22.99 $ 24.03 $ 23.88 Tangible common equity per common share
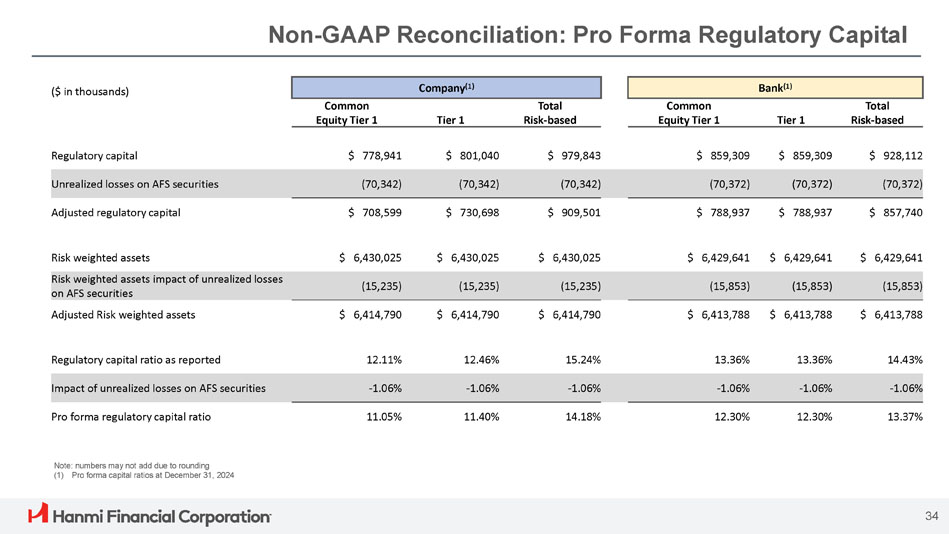
Non - GAAP Reconciliation: Pro Forma Regulatory Capital 34 Bank (1) Company (1) ($ in thousands) Total Risk - based Tier 1 Common Equity Tier 1 Total Risk - based Tier 1 Common Equity Tier 1 $ 928,112 $ 859,309 $ 859,309 $ 979,843 $ 801,040 $ 778,941 Regulatory capital (70,372) (70,372) (70,372) (70,342) (70,342) (70,342) Unrealized losses on AFS securities $ 857,740 $ 788,937 $ 788,937 $ 909,501 $ 730,698 $ 708,599 Adjusted regulatory capital $ 6,429,641 $ 6,429,641 $ 6,429,641 $ 6,430,025 $ 6,430,025 $ 6,430,025 Risk weighted assets (15,853) (15,853) (15,853) (15,235) (15,235) (15,235) Risk weighted assets impact of unrealized losses on AFS securities $ 6,413,788 $ 6,413,788 $ 6,413,788 $ 6,414,790 $ 6,414,790 $ 6,414,790 Adjusted Risk weighted assets 14.43% 13.36% 13.36% 15.24% 12.46% 12.11% Regulatory capital ratio as reported - 1.06% - 1.06% - 1.06% - 1.06% - 1.06% - 1.06% Impact of unrealized losses on AFS securities 13.37% 12.30% 12.30% 14.18% 11.40% 11.05% Pro forma regulatory capital ratio Note: numbers may not add due to rounding (1) Pro forma capital ratios at December 31, 2024
v3.24.4
| X |
- DefinitionBoolean flag that is true when the XBRL content amends previously-filed or accepted submission.
| Name: |
dei_AmendmentFlag |
| Namespace Prefix: |
dei_ |
| Data Type: |
xbrli:booleanItemType |
| Balance Type: |
na |
| Period Type: |
duration |
|
| X |
- DefinitionFor the EDGAR submission types of Form 8-K: the date of the report, the date of the earliest event reported; for the EDGAR submission types of Form N-1A: the filing date; for all other submission types: the end of the reporting or transition period. The format of the date is YYYY-MM-DD.
| Name: |
dei_DocumentPeriodEndDate |
| Namespace Prefix: |
dei_ |
| Data Type: |
xbrli:dateItemType |
| Balance Type: |
na |
| Period Type: |
duration |
|
| X |
- DefinitionThe type of document being provided (such as 10-K, 10-Q, 485BPOS, etc). The document type is limited to the same value as the supporting SEC submission type, or the word 'Other'.
| Name: |
dei_DocumentType |
| Namespace Prefix: |
dei_ |
| Data Type: |
dei:submissionTypeItemType |
| Balance Type: |
na |
| Period Type: |
duration |
|
| X |
- DefinitionAddress Line 1 such as Attn, Building Name, Street Name
| Name: |
dei_EntityAddressAddressLine1 |
| Namespace Prefix: |
dei_ |
| Data Type: |
xbrli:normalizedStringItemType |
| Balance Type: |
na |
| Period Type: |
duration |
|
| X |
- Definition
+ References
+ Details
| Name: |
dei_EntityAddressCityOrTown |
| Namespace Prefix: |
dei_ |
| Data Type: |
xbrli:normalizedStringItemType |
| Balance Type: |
na |
| Period Type: |
duration |
|
| X |
- DefinitionCode for the postal or zip code
| Name: |
dei_EntityAddressPostalZipCode |
| Namespace Prefix: |
dei_ |
| Data Type: |
xbrli:normalizedStringItemType |
| Balance Type: |
na |
| Period Type: |
duration |
|
| X |
- DefinitionName of the state or province.
| Name: |
dei_EntityAddressStateOrProvince |
| Namespace Prefix: |
dei_ |
| Data Type: |
dei:stateOrProvinceItemType |
| Balance Type: |
na |
| Period Type: |
duration |
|
| X |
- DefinitionA unique 10-digit SEC-issued value to identify entities that have filed disclosures with the SEC. It is commonly abbreviated as CIK. Reference 1: http://www.xbrl.org/2003/role/presentationRef
-Publisher SEC
-Name Exchange Act
-Number 240
-Section 12
-Subsection b-2
| Name: |
dei_EntityCentralIndexKey |
| Namespace Prefix: |
dei_ |
| Data Type: |
dei:centralIndexKeyItemType |
| Balance Type: |
na |
| Period Type: |
duration |
|
| X |
- DefinitionIndicate if registrant meets the emerging growth company criteria. Reference 1: http://www.xbrl.org/2003/role/presentationRef
-Publisher SEC
-Name Exchange Act
-Number 240
-Section 12
-Subsection b-2
| Name: |
dei_EntityEmergingGrowthCompany |
| Namespace Prefix: |
dei_ |
| Data Type: |
xbrli:booleanItemType |
| Balance Type: |
na |
| Period Type: |
duration |
|
| X |
- DefinitionCommission file number. The field allows up to 17 characters. The prefix may contain 1-3 digits, the sequence number may contain 1-8 digits, the optional suffix may contain 1-4 characters, and the fields are separated with a hyphen.
| Name: |
dei_EntityFileNumber |
| Namespace Prefix: |
dei_ |
| Data Type: |
dei:fileNumberItemType |
| Balance Type: |
na |
| Period Type: |
duration |
|
| X |
- DefinitionTwo-character EDGAR code representing the state or country of incorporation.
| Name: |
dei_EntityIncorporationStateCountryCode |
| Namespace Prefix: |
dei_ |
| Data Type: |
dei:edgarStateCountryItemType |
| Balance Type: |
na |
| Period Type: |
duration |
|
| X |
- DefinitionThe exact name of the entity filing the report as specified in its charter, which is required by forms filed with the SEC. Reference 1: http://www.xbrl.org/2003/role/presentationRef
-Publisher SEC
-Name Exchange Act
-Number 240
-Section 12
-Subsection b-2
| Name: |
dei_EntityRegistrantName |
| Namespace Prefix: |
dei_ |
| Data Type: |
xbrli:normalizedStringItemType |
| Balance Type: |
na |
| Period Type: |
duration |
|
| X |
- DefinitionThe Tax Identification Number (TIN), also known as an Employer Identification Number (EIN), is a unique 9-digit value assigned by the IRS. Reference 1: http://www.xbrl.org/2003/role/presentationRef
-Publisher SEC
-Name Exchange Act
-Number 240
-Section 12
-Subsection b-2
| Name: |
dei_EntityTaxIdentificationNumber |
| Namespace Prefix: |
dei_ |
| Data Type: |
dei:employerIdItemType |
| Balance Type: |
na |
| Period Type: |
duration |
|
| X |
- DefinitionLocal phone number for entity.
| Name: |
dei_LocalPhoneNumber |
| Namespace Prefix: |
dei_ |
| Data Type: |
xbrli:normalizedStringItemType |
| Balance Type: |
na |
| Period Type: |
duration |
|
| X |
- DefinitionBoolean flag that is true when the Form 8-K filing is intended to satisfy the filing obligation of the registrant as pre-commencement communications pursuant to Rule 13e-4(c) under the Exchange Act. Reference 1: http://www.xbrl.org/2003/role/presentationRef
-Publisher SEC
-Name Exchange Act
-Number 240
-Section 13e
-Subsection 4c
| Name: |
dei_PreCommencementIssuerTenderOffer |
| Namespace Prefix: |
dei_ |
| Data Type: |
xbrli:booleanItemType |
| Balance Type: |
na |
| Period Type: |
duration |
|
| X |
- DefinitionBoolean flag that is true when the Form 8-K filing is intended to satisfy the filing obligation of the registrant as pre-commencement communications pursuant to Rule 14d-2(b) under the Exchange Act. Reference 1: http://www.xbrl.org/2003/role/presentationRef
-Publisher SEC
-Name Exchange Act
-Number 240
-Section 14d
-Subsection 2b
| Name: |
dei_PreCommencementTenderOffer |
| Namespace Prefix: |
dei_ |
| Data Type: |
xbrli:booleanItemType |
| Balance Type: |
na |
| Period Type: |
duration |
|
| X |
- DefinitionTitle of a 12(b) registered security. Reference 1: http://www.xbrl.org/2003/role/presentationRef
-Publisher SEC
-Name Exchange Act
-Number 240
-Section 12
-Subsection b
| Name: |
dei_Security12bTitle |
| Namespace Prefix: |
dei_ |
| Data Type: |
dei:securityTitleItemType |
| Balance Type: |
na |
| Period Type: |
duration |
|
| X |
- DefinitionName of the Exchange on which a security is registered. Reference 1: http://www.xbrl.org/2003/role/presentationRef
-Publisher SEC
-Name Exchange Act
-Number 240
-Section 12
-Subsection d1-1
| Name: |
dei_SecurityExchangeName |
| Namespace Prefix: |
dei_ |
| Data Type: |
dei:edgarExchangeCodeItemType |
| Balance Type: |
na |
| Period Type: |
duration |
|
| X |
- DefinitionBoolean flag that is true when the Form 8-K filing is intended to satisfy the filing obligation of the registrant as soliciting material pursuant to Rule 14a-12 under the Exchange Act. Reference 1: http://www.xbrl.org/2003/role/presentationRef
-Publisher SEC
-Name Exchange Act
-Section 14a
-Number 240
-Subsection 12
| Name: |
dei_SolicitingMaterial |
| Namespace Prefix: |
dei_ |
| Data Type: |
xbrli:booleanItemType |
| Balance Type: |
na |
| Period Type: |
duration |
|
| X |
- DefinitionTrading symbol of an instrument as listed on an exchange.
| Name: |
dei_TradingSymbol |
| Namespace Prefix: |
dei_ |
| Data Type: |
dei:tradingSymbolItemType |
| Balance Type: |
na |
| Period Type: |
duration |
|
| X |
- DefinitionBoolean flag that is true when the Form 8-K filing is intended to satisfy the filing obligation of the registrant as written communications pursuant to Rule 425 under the Securities Act. Reference 1: http://www.xbrl.org/2003/role/presentationRef
-Publisher SEC
-Name Securities Act
-Number 230
-Section 425
| Name: |
dei_WrittenCommunications |
| Namespace Prefix: |
dei_ |
| Data Type: |
xbrli:booleanItemType |
| Balance Type: |
na |
| Period Type: |
duration |
|
Hanmi Financial (NASDAQ:HAFC)
Historical Stock Chart
From Jan 2025 to Feb 2025

Hanmi Financial (NASDAQ:HAFC)
Historical Stock Chart
From Feb 2024 to Feb 2025

