UNITED STATES
SECURITIES AND EXCHANGE COMMISSION
WASHINGTON, D.C. 20549
SCHEDULE 13E-3
RULE 13e-3 TRANSACTION STATEMENT UNDER SECTION 13(e) OF
THE SECURITIES EXCHANGE ACT OF 1934
SciPlay Corporation
(Name of the Issuer)
SciPlay Corporation
Light & Wonder, Inc.
Bern Merger Sub, Inc.
LNW Social Holding Company I, LLC
LNW Social Holding Company II, LLC
Light and Wonder International, Inc.
(Names of Persons Filing Statement)
Class A Common Stock, par value $0.001
per share
(Title of Class of Securities)
809087109
(CUSIP Number of Class of Securities)
|
Joshua J. Wilson
SciPlay Corporation
6601 Bermuda Road
Las Vegas, Nevada 89119
(702) 897-7150 |
Matthew R. Wilson
Light & Wonder, Inc.
Bern Merger Sub, Inc.
LNW Social Holding Company I, LLC
LNW Social Holding Company II, LLC
Light and Wonder International, Inc.
6601 Bermuda Road
Las
Vegas, Nevada 89119
(702) 897-7150 |
(Name, Address and Telephone Numbers of Person
Authorized to Receive Notices and Communications on Behalf of the Persons Filing Statement)
With copies to
|
Audra D. Cohen
Melissa Sawyer
Sullivan & Cromwell LLP
125 Broad Street
New York, NY 10004 |
Robert I. Townsend, III
Jin-Kyu Baek
Cravath, Swaine & Moore LLP
825 8th Avenue
New York, NY 10019 |
NEITHER THE SECURITIES AND EXCHANGE COMMISSION NOR ANY STATE SECURITIES
COMMISSION HAS APPROVED OR DISAPPROVED THIS TRANSACTION, PASSED ON THE MERITS OR THE FAIRNESS OF THE TRANSACTION OR PASSED UPON THE ADEQUACY
OR ACCURACY OF THE INFORMATION CONTAINED IN THIS DOCUMENT. ANY REPRESENTATION TO THE CONTRARY IS A CRIMINAL OFFENSE.
This statement is filed in connection
with (check the appropriate box):
| a. | x The filing of solicitation materials or an information
statement subject to Regulation 14A (§§ 240.14a-1 through 240.14b-2), Regulation
14C (§§ 240.14c-1 through 240.14c-101) or Rule 13e-3(c) (§ 240.13e-3(c))
under the Securities Exchange Act of 1934 (the “Exchange Act”). |
| b. | ¨
The filing of a registration statement under the Securities
Act of 1933. |
Check
the following box if the soliciting materials or information statement referred to in checking box (a) are preliminary copies: x
Check
the following box if the filing is a final amendment reporting the results of the transaction: ¨
INTRODUCTION
This Rule 13e-3
transaction statement on Schedule 13E-3, together with the exhibits hereto (this “Transaction Statement”), is being
filed with the Securities and Exchange Commission (the “SEC”) pursuant to Section 13(e) of the Exchange
Act, by (a) SciPlay Corporation, a Nevada corporation (the “Company”), the issuer of the shares of Class A
common stock, par value $0.001 per share (the “Class A Common Stock”), and Class B common stock, par value
$0.001 per share (the “Class B Common Stock” and, together with the Class A Common Stock, the “Common
Stock”), that are the subject of the Rule 13e-3 transaction; (b) Light & Wonder, Inc., a Nevada
corporation (“Parent”); (c) Bern Merger Sub, Inc., a Nevada corporation (“Merger Sub”);
(d) LNW Social Holding Company I, LLC, a Nevada limited liability company (the “Principal Stockholder”); (e) LNW
Social Holding Company II, LLC, a Nevada limited liability company; and (f) Light and Wonder International, Inc., a Delaware
corporation. Collectively, the persons filing this Transaction Statement are referred to as the “filing persons.”
This Transaction
Statement relates to the Agreement and Plan of Merger, dated as of August 8, 2023 (as amended or otherwise modified in accordance
with its terms, the “Merger Agreement”), by and among Parent, Merger Sub and the Company. Pursuant to the Merger Agreement,
Merger Sub will merge with and into the Company (the “Merger”), with the Company surviving the Merger as the surviving
corporation (the “Surviving Corporation”).
Upon consummation
of the Merger, on the terms and subject to the conditions set forth in the Merger Agreement and in accordance with the laws of the State
of Nevada, each share of Class A Common Stock issued and outstanding immediately prior to the effective time of the Merger (the
“Effective Time”) (other than (i) shares of Class A Common Stock held by the Company as treasury stock immediately
prior to the Effective Time, (ii) shares of Class B Common Stock issued and outstanding immediately prior to the Effective
Time and (iii) Class A Common Stock held by Parent, Merger Sub or any other direct or indirect wholly owned subsidiary of Parent
as of immediately prior to the Effective Time not held on behalf of third parties) will be converted into the right to receive $22.95
in cash, without interest (the “Merger Consideration”). Each share of Class B Common Stock issued and outstanding
immediately prior to the Effective Time will remain in existence following the Effective Time as a share of Class B common stock,
par value $0.001 per share, of the Surviving Corporation. In accordance with Section (F) of Article VI of the Amended
and Restated Articles of Incorporation of the Company and Section 11.01 of the Amended and Restated Operating Agreement of SciPlay
Parent Company, LLC, a Nevada limited liability company (“SciPlay Parent LLC”), dated as of May 2, 2019 (as amended,
restated or otherwise modified from time to time, the “SciPlay Parent LLC Agreement”), each holder of a unit of member’s
interest in SciPlay Parent LLC that is authorized and issued under the SciPlay Parent LLC Agreement and that constitutes a “Common
Unit” as defined in the SciPlay Parent LLC Agreement (such unit of member’s interest, a “Common Unit”),
that is issued and outstanding immediately prior to the Effective Time will be entitled, upon the election of such holder exercisable
no later than 10 business days after the Effective Time, to exchange each such Common Unit for the Merger Consideration that is payable
with respect to one share of Class A Common Stock under the Merger Agreement. As part of the Written Consent (as defined below)
executed and delivered by the Principal Stockholder on August 8, 2023, the Principal Stockholder, which on such date beneficially
owned all of the issued and outstanding Common Units not owned by the Company, waived any entitlement it has as a holder of Common Units
to receive the Merger Consideration that is payable under the Merger Agreement with respect to each Common Unit that it holds immediately
prior to the Effective Time. Pursuant to the Merger Agreement, the Company also waived any entitlement it has as a holder of Common Units
to receive the Merger Consideration that is payable under the Merger Agreement with respect to each Common Unit that it holds immediately
prior to the Effective Time. Treatment of outstanding equity plan awards under the Company’s equity incentive plans and award agreements
is described in greater detail in the Information Statement (as defined below) under “The Special Factors—Interests of Our
Directors and Executive Officers in the Merger” and “The Merger Agreement—Consideration to be Received in the Merger.”
Further, following completion of the Merger, the Class A Common Stock will be delisted from the Nasdaq Global Select Market and
deregistered under the Exchange Act.
The board of directors
of the Company (the “Board”) (acting, at least in part, based upon the receipt of the unanimous recommendation of
a special committee of the Board, comprised solely of independent and disinterested directors (the “Special Committee”))
has (i) determined that the Merger Agreement, the Merger and the transactions contemplated by the Merger Agreement (the “Transactions”)
are advisable and fair to, and in the best interests of, the Company and the holders of Common Stock (the “Stockholders”)
(other than Parent and its subsidiaries), (ii) adopted and approved, pursuant to Nevada Revised Statutes (“NRS”)
92A.120, and declared advisable the Merger Agreement, the Merger and the other Transactions, (iii) directed the submission of the
Merger Agreement to the Stockholders for approval and (iv) recommended that the Stockholders vote in favor of the approval of the
Merger Agreement, the Merger and the other Transactions. Ms. Antonia Korsanos, who serves as Chair of the Board and who also serves
as Executive Vice Chair of the board of directors of Parent and Ms. Constance P. James, who at the time served as a member of the
Board and who was also the Executive Vice President, Chief Financial Officer, Treasurer and Corporate Secretary of Parent, recused themselves
from the deliberations and vote of the Board regarding the Merger Agreement, the Merger and the other Transactions.
Concurrently with
the filing of this Transaction Statement, the Company is filing an information statement (the “Information Statement”)
under Section 14(c) of the Exchange Act. A copy of the Information Statement is attached hereto as Exhibit (a)(1) and
a copy of the Merger Agreement is attached as Annex A to the Information Statement. The approval of the Merger Agreement, the Merger
and the other Transactions required the affirmative vote (at a meeting or by written consent) of a majority of the voting power of the
Stockholders, with holders of Class A Common Stock and holders of Class B Common Stock voting together as a single class (the “Required
Stockholder Approval”). Following the execution of the Merger Agreement, Parent caused the Principal Stockholder, which on
such date beneficially owned all of the issued and outstanding shares of Class B Common Stock, representing a majority of the outstanding
voting power of the issued and outstanding shares of Common Stock, to execute and deliver to the Company an irrevocable written consent
approving the Merger Agreement, the Merger and the other Transactions (the “Written Consent”), thereby providing the
Required Stockholder Approval for the Merger.
Pursuant to General
Instruction F to Schedule 13E-3, the information contained in the Information Statement, including all annexes thereto, is expressly
incorporated herein by reference in its entirety, and responses to each item herein are qualified in their entirety by the information
contained in the Information Statement and the annexes thereto. The cross-references below are being supplied pursuant to General Instruction
G to Schedule 13E-3 and show the location in the Information Statement of the information required to be included in response to the
items of Schedule 13E-3. As of the date hereof, the Information Statement is in preliminary form and is subject to completion.
All information
contained in this Transaction Statement concerning any of the filing persons has been provided by such filing person and no filing person
has produced any disclosure with respect to any other filing persons.
ITEM 1. SUMMARY
TERM SHEET
The information
set forth in the Information Statement under the following captions is incorporated herein by reference:
“Summary”
“Questions
and Answers about the Merger”
ITEM 2. SUBJECT
COMPANY INFORMATION
(a) Name
and Address. The information set forth in the Information Statement under the following caption
is incorporated herein by reference:
“The Parties
to the Merger Agreement”
(b) Securities.
The information set forth in the Information Statement under the following captions is incorporated
herein by reference:
“Summary”
“Questions
and Answers about the Merger”
“Market Information,
Dividends and Certain Transactions in the Class A Common Stock”
(c) Trading
Market and Price. The information set forth in the Information Statement under the following
caption is incorporated herein by reference:
“Market Information,
Dividends and Certain Transactions in the Class A Common Stock”
(d) Dividends.
The information set forth in the Information Statement under the following caption is incorporated
herein by reference:
“Market Information,
Dividends and Certain Transactions in the Class A Common Stock”
(e) Prior
Public Offerings. The information set forth in the Information Statement under the following
captions is incorporated herein by reference:
“Summary”
“Market Information,
Dividends and Certain Transactions in the Class A Common Stock”
(f) Prior
Stock Purchases. The information set forth in the Information Statement under the following
caption is incorporated herein by reference:
“Market Information,
Dividends and Certain Transactions in the Class A Common Stock”
ITEM 3. IDENTITY
AND BACKGROUND OF FILING PERSONS
(a)–(c) Name
and Address; Business and Background of Entities; Business and Background of Natural Persons. The
information set forth in the Information Statement under the following captions is incorporated herein by reference:
“Summary”
“The Parties
to the Merger Agreement”
“Directors,
Executive Officers and Controlling Persons of the Company”
“Where You
Can Find More Information”
ITEM 4. TERMS
OF THE TRANSACTION
(a)(1) Material
Terms – Tender Offers. Not applicable.
(a)(2) Material
Terms – Merger or Similar Transactions. The information set forth in the Information Statement
under the following captions is incorporated herein by reference:
“Summary”
“Questions
and Answers about the Merger”
“The Special
Factors – Background of the Merger”
“The Special
Factors – Recommendation of the Special Committee; Reasons for the Merger; Recommendation of the Board”
“The Special
Factors – Required Stockholder Approval for the Merger”
“The Special
Factors – Opinion and Materials of Lazard”
“The Special
Factors – Certain Company Financial Forecasts”
“The Special
Factors – Opinion and Materials of Macquarie Capital”
“The Special
Factors – Position of the Company on the Fairness of the Merger”
“The Special
Factors – Position of the LNW Entities in Connection with the Merger”
“The Special
Factors – Purposes and Reasons of the Company in Connection with the Merger”
“The Special
Factors – Purposes and Reasons of the LNW Entities in Connection with the Merger”
“The Special
Factors – Accounting Treatment”
“The Special
Factors – Interests of Our Directors and Executive Officers in the Merger”
“The Special
Factors – Delisting and Deregistration of Class A Common Stock”
“The Special
Factors – Material United States Federal Income Tax Consequences of the Merger”
“The Merger
Agreement”
“Annex A:
Merger Agreement”
“Annex B:
Lazard Opinion”
“Annex C:
Macquarie Capital Opinion”
“Annex D:
Written Consent”
(c) Different
Terms. The information set forth in the Information Statement under the following captions is
incorporated herein by reference:
“Summary”
“Questions
and Answers about the Merger”
“The Special
Factors – Interests of Our Directors and Executive Officers in the Merger”
“The Merger
Agreement – Consideration to be Received in the Merger”
(d) Appraisal
Rights. The information set forth in the Information Statement under the following captions is
incorporated herein by reference:
“Summary
– No Dissenter’s Rights”
“Questions
and Answers about the Merger”
“No Dissenter’s
Rights”
(e) Provisions
for Unaffiliated Security Holders. The information set forth in the Information Statement under
the following captions is incorporated herein by reference:
“Summary”
“Questions
and Answers about the Merger”
“No Dissenter’s
Rights”
“The Special
Factors – Recommendation of the Special Committee; Reasons for the Merger; Recommendation of the Board”
“Provisions
for Unaffiliated Stockholders”
(f) Eligibility
for Listing or Trading. Not applicable.
ITEM 5. PAST
CONTACTS, TRANSACTIONS, NEGOTIATIONS AND AGREEMENTS
(a) Transactions.
The information set forth in the Information Statement under the following caption is incorporated
herein by reference:
“Market Information,
Dividends and Certain Transactions in the Class A Common Stock”
“Transactions
Between the Company and the LNW Entities”
(b)–(c) Significant
Corporate Events; Negotiations or Contacts. The information set forth in the Information
Statement under the following captions is incorporated herein by reference:
“Summary”
“Questions
and Answers about the Merger”
“The Special
Factors – Background of the Merger”
“The Special
Factors – Recommendation of the Special Committee; Reasons for the Merger; Recommendation of the Board”
“The Special
Factors – Required Stockholder Approval for the Merger”
“The Special
Factors – Financing”
“The Special
Factors – Position of the Company on the Fairness of the Merger”
“The Special
Factors – Position of the LNW Entities in Connection with the Merger”
“The Special
Factors – Purposes and Reasons of the Company in Connection with the Merger”
“The Special
Factors – Purposes and Reasons of the LNW Entities in Connection with the Merger”
“The Special
Factors – Delisting and Deregistration of Class A Common Stock”
“The Special
Factors – Fees and Expenses”
“The Merger
Agreement – Form of Merger”
“The Merger
Agreement – Consummation and Effectiveness of the Merger”
“The Merger
Agreement – Consideration to be Received in the Merger”
“The Merger
Agreement – Written Consent; Merger Sub Shareholder Consent”
“Market Information,
Dividends and Certain Transactions in the Class A Common Stock”
“Annex A:
Merger Agreement”
“Annex D:
Written Consent”
(e) Agreements
Involving the Subject Company’s Securities. The information set forth in the Information
Statement under the following captions is incorporated herein by reference:
“Summary”
“Questions
and Answers about the Merger”
“The Special
Factors – Background of the Merger”
“The Special
Factors – Recommendation of the Special Committee; Reasons for the Merger; Recommendation of the Board”
“The Special
Factors – Required Stockholder Approval for the Merger”
“The Special
Factors – Financing”
“The Special
Factors – Position of the Company on the Fairness of the Merger”
“The Special
Factors – Position of the LNW Entities in Connection with the Merger”
“The Special
Factors – Purposes and Reasons of the Company in Connection with the Merger”
“The Special
Factors – Purposes and Reasons of the LNW Entities in Connection with the Merger”
“The Special
Factors – Interests of Our Directors and Executive Officers in the Merger”
“The Special
Factors – Delisting and Deregistration of Class A Common Stock”
“The Special
Factors – Fees and Expenses”
“The Merger
Agreement – Form of Merger”
“The Merger
Agreement – Consummation and Effectiveness of the Merger”
“The Merger
Agreement – Consideration to be Received in the Merger”
“The Merger
Agreement – Written Consent; Merger Sub Shareholder Consent”
“The Merger
Agreement – Other Covenants and Agreements”
“Market Information,
Dividends and Certain Transactions in the Class A Common Stock”
“Transactions
between the Company and the LNW Entities”
“Annex A:
Merger Agreement”
“Annex D:
Written Consent”
ITEM 6. PURPOSES
OF THE TRANSACTION AND PLANS OR PROPOSALS
(b) Use
of Securities Acquired. The information set forth in the Information Statement under the following
captions is incorporated herein by reference:
“Summary”
“Questions
and Answers about the Merger”
“The Special
Factors – Delisting and Deregistration of Class A Common Stock”
“The Special
Factors – Plans for the Company After the Merger”
“The Merger
Agreement – Form of Merger”
“The Merger
Agreement – Consideration to be Received in the Merger”
(c)(1)–(8) Plans.
The information set forth in the Information Statement under the following captions is incorporated
herein by reference:
“Summary”
“Questions
and Answers about the Merger”
“The Special
Factors – Background of the Merger”
“The Special
Factors – Recommendation of the Special Committee; Reasons for the Merger; Recommendation of the Board”
“The Special
Factors – Position of the Company on the Fairness of the Merger”
“The Special
Factors – Position of the LNW Entities in Connection with the Merger”
“The Special
Factors – Purposes and Reasons of the Company in Connection with the Merger”
“The Special
Factors – Purposes and Reasons of the LNW Entities in Connection with the Merger”
“The Special
Factors – Interests of Our Directors and Executive Officers in the Merger”
“The Special
Factors – Delisting and Deregistration of Class A Common Stock”
“The Special
Factors – Plans for the Company After the Merger”
“The Special
Factors – Fees and Expenses”
“The Merger
Agreement”
“Annex A:
Merger Agreement”
ITEM 7. PURPOSES,
ALTERNATIVES, REASONS AND EFFECTS
(a) Purposes.
The information set forth in the Information Statement under the following captions is incorporated
herein by reference:
“Summary”
“The Special
Factors – Background of the Merger”
“The Special
Factors – Recommendation of the Special Committee; Reasons for the Merger; Recommendation of the Board”
“The Special
Factors – Position of the Company on the Fairness of the Merger”
“The Special
Factors – Purposes and Reasons of the Company in Connection with the Merger”
“The Special
Factors – Purposes and Reasons of the LNW Entities in Connection with the Merger”
“The Special
Factors – Plans for the Company After the Merger”
(b) Alternatives.
The information set forth in the Information Statement under the following captions is incorporated
herein by reference:
“The Special
Factors – Background of the Merger”
“The Special
Factors – Recommendation of the Special Committee; Reasons for the Merger; Recommendation of the Board”
“The Special
Factors – Opinion and Materials of Lazard”
“The Special
Factors – Purposes and Reasons of the Company in Connection with the Merger”
“The Special
Factors – Alternatives to the Merger”
(c) Reasons.
The information set forth in the Information Statement under the following captions is incorporated
herein by reference:
“Summary”
“The Special
Factors – Background of the Merger”
“The Special
Factors – Recommendation of the Special Committee; Reasons for the Merger; Recommendation of the Board”
“The Special
Factors – Position of the Company on the Fairness of the Merger”
“The Special
Factors – Position of the LNW Entities in Connection with the Merger”
“The Special
Factors – Purposes and Reasons of the Company in Connection with the Merger”
“The Special
Factors – Purposes and Reasons of the LNW Entities in Connection with the Merger”
(d) Effects.
The information set forth in the Information Statement under the following captions is incorporated
herein by reference:
“Summary”
“Questions
and Answers about the Merger”
“The Special
Factors – Background of the Merger”
“The Special
Factors – Recommendation of the Special Committee; Reasons for the Merger; Recommendation of the Board”
“The Special
Factors – Financing”
“The Special
Factors – Position of the Company on the Fairness of the Merger”
“The Special
Factors – Position of the LNW Entities in Connection with the Merger”
“The Special
Factors – Purposes and Reasons of the Company in Connection with the Merger”
“The Special
Factors – Purposes and Reasons of the LNW Entities in Connection with the Merger”
“The Special
Factors – Accounting Treatment”
“The Special
Factors – Interests of Our Directors and Executive Officers in the Merger”
“The Special
Factors – Delisting and Deregistration of Class A Common Stock”
“The Special
Factors – Plans for the Company After the Merger”
“The Special
Factors – Fees and Expenses”
“The Special
Factors – Material United States Federal Income Tax Consequences of the Merger”
“The Merger
Agreement – Form of Merger”
“The Merger
Agreement – Consummation and Effectiveness of the Merger”
“The Merger
Agreement – Consideration to be Received in the Merger”
“The
Merger Agreement – Charter; Bylaws”
“The Merger
Agreement – Directors’ and Officers’ Indemnification and Insurance”
“The
Merger Agreement – Continuing Employee Matters”
“No Dissenter’s
Rights”
“Annex A:
Merger Agreement”
ITEM 8. FAIRNESS
OF THE TRANSACTION
(a)–(b) Fairness;
Factors Considered in Determining Fairness. The information set forth in the Information Statement
under the following captions is incorporated herein by reference:
“Summary”
“Questions
and Answers about the Merger”
“The Special
Factors – Background of the Merger”
“The Special
Factors – Recommendation of the Special Committee; Reasons for the Merger; Recommendation of the Board”
“The Special
Factors – Opinion and Materials of Lazard”
“The Special
Factors – Position of the Company on the Fairness of the Merger”
“The Special
Factors – Position of the LNW Entities in Connection with the Merger”
“The Special
Factors – Purposes and Reasons of the Company in Connection with the Merger”
“The Special
Factors – Purposes and Reasons of the LNW Entities in Connection with the Merger”
“The Special
Factors – Interests of Our Directors and Executive Officers in the Merger”
“Annex B:
Lazard Opinion”
The
confidential discussion materials prepared by Lazard Frères & Co. LLC (“Lazard”) and provided to
the Special Committee, dated June 12, 2023, July 12, 2023, July 19, 2023, July 26, 2023 and August 7, 2023,
are attached hereto as Exhibits (c)(3) through and including (c)(7) and, in each case, is incorporated by reference
herein.
(c) Approval
of Security Holders. The information set forth in the Information Statement under the following
captions is incorporated herein by reference:
“Summary”
“Questions
and Answers about the Merger”
“The Special
Factors – Background of the Merger”
“The Special
Factors – Recommendation of the Special Committee; Reasons for the Merger; Recommendation of the Board”
“The Special
Factors – Required Stockholder Approval for the Merger”
“The Merger
Agreement – Written Consent; Merger Sub Shareholder Consent”
“Annex A:
Merger Agreement”
“Annex D:
Written Consent”
(d) Unaffiliated
Representative. The information set forth in the Information Statement under the following captions
is incorporated herein by reference:
“Summary”
“The Special
Factors – Background of the Merger”
“The Special
Factors – Recommendation of the Special Committee; Reasons for the Merger; Recommendation of the Board”
“The Special
Factors – Opinion and Materials of Lazard”
“The Special
Factors – Position of the Company on the Fairness of the Merger”
“The Special
Factors – Position of the LNW Entities in Connection with the Merger”
“The Special
Factors – Interests of Our Directors and Executive Officers in the Merger”
“Annex B:
Lazard Opinion”
(e) Approval
of Directors. The information set forth in the Information Statement under the following captions
is incorporated herein by reference:
“Summary”
“Questions
and Answers about the Merger”
“The Special
Factors – Background of the Merger”
“The Special
Factors – Recommendation of the Special Committee; Reasons for the Merger; Recommendation of the Board”
“The Special
Factors – Position of the Company on the Fairness of the Merger”
“The Special
Factors – Position of the LNW Entities in Connection with the Merger”
(f) Other
Offers. The information set forth in the Information Statement under the following captions
is incorporated herein by reference:
“Summary”
“The Special
Factors – Background of the Merger”
“The Special
Factors – Recommendation of the Special Committee; Reasons for the Merger; Recommendation of the Board”
“The Special
Factors – Position of the Company on the Fairness of the Merger”
“The Special
Factors – Position of the LNW Entities in Connection with the Merger”
“The Merger
Agreement – No Solicitation”
ITEM 9. REPORTS,
OPINIONS, APPRAISALS AND NEGOTIATIONS
(a)–(c) Report,
Opinion or Appraisal; Preparer and Summary of the Report, Opinion or Appraisal; Availability of Documents. The information
set forth in the Information Statement under the following captions is incorporated herein by reference:
“Summary”
“The Special
Factors – Background of the Merger”
“The Special
Factors – Recommendation of the Special Committee; Reasons for the Merger; Recommendation of the Board”
“The Special
Factors – Opinion and Materials of Lazard”
“The Special
Factors – Opinion and Materials of Macquarie Capital”
“The Special
Factors – Certain Company Financial Forecasts”
“The Special
Factors – Position of the Company on the Fairness of the Merger”
“The Special
Factors – Position of the LNW Entities in Connection with the Merger”
“Annex B:
Lazard Opinion”
“Annex C:
Macquarie Capital Opinion”
The
confidential discussion materials prepared by Lazard and provided to the Special Committee, dated June 12, 2023, July 12,
2023, July 19, 2023, July 26, 2023 and August 7, 2023, are attached hereto as Exhibits (c)(3) through and
including (c)(7) and, in each case, is incorporated by reference herein.
The
confidential discussion materials prepared by Macquarie Capital (USA) Inc. and provided to the Board of Directors of Parent, dated
May 17, 2023, August 3, 2023 and August 7, 2023, are attached hereto as Exhibits (c)(8) through and including
(c)(10) and, in each case, is incorporated by reference herein.
The reports, opinions
or appraisals referenced in this Item 9 are filed herewith or incorporated by reference herein and will be made available for inspection
and copying at the principal executive offices of the Company during its regular business hours by any interested holder of Class A
Common Stock or representative who has been designated in writing, and copies may be obtained by requesting them in writing from the
Company at the email address provided under the caption “Where You Can Find More Information” in the Information Statement,
which is incorporated herein by reference.
ITEM 10. SOURCE
AND AMOUNTS OF FUNDS OR OTHER CONSIDERATION
(a)–(b) Source
of Funds; Conditions. The information set forth in the Information Statement under the following
captions is incorporated herein by reference:
“Summary”
“Questions
and Answers about the Merger”
“The Special
Factors – Financing”
“The Special
Factors – Position of the LNW Entities in Connection with the Merger”
“The Merger
Agreement – Consummation and Effectiveness of the Merger”
“Annex A:
Merger Agreement”
(c) Expenses.
The information set forth in the Information Statement under the following caption is incorporated
herein by reference:
“The Special
Factors – Fees and Expenses”
(d) Borrowed
Funds. Not applicable.
ITEM 11. INTEREST
IN SECURITIES OF THE SUBJECT COMPANY
(a) Securities
Ownership. The information set forth in the Information Statement under the following captions
is incorporated herein by reference:
“Directors,
Executive Officers and Controlling Persons of the Company”
“Security
Ownership”
(b) Securities
Transactions. The information set forth in the Information Statement under the following captions
is incorporated herein by reference:
“The Special
Factors – Background of the Merger”
“The Special
Factors – Interests of Our Directors and Executive Officers in the Merger”
“The Merger
Agreement”
“Market Information,
Dividends and Certain Transactions in the Class A Common Stock”
“Annex A:
Merger Agreement”
ITEM 12. THE
SOLICITATION OR RECOMMENDATION
(d) Intent
to Tender or Vote in a Going-Private Transaction. Not applicable.
(e) Recommendations
of Others. Not applicable.
ITEM 13. FINANCIAL
STATEMENTS
(a) Financial
Statements. The audited financial statements set forth in the Company’s Annual Report
on Form 10-K for the fiscal year ended December 31, 2022, originally filed on March 1, 2023 (see pages 58 to 86 therein),
the unaudited consolidated statements of income, consolidated statements of comprehensive income, condensed consolidated balance sheets,
consolidated statements of changes in stockholders’ equity and condensed consolidated statements of cash flows set forth in the
Company’s Quarterly Report on Form 10-Q for the quarter ended March 31, 2023, originally filed on May 9, 2023 (see
pages 6 to 19 therein), and the unaudited consolidated statements of income, consolidated statements of comprehensive income, condensed
consolidated balance sheets, consolidated statements of changes in stockholders’ equity and condensed consolidated statements of
cash flows set forth in the Company’s Quarterly Report on Form 10-Q for the quarter ended June 30, 2023, originally filed
on August 8, 2023 (see pages 6 to 19 therein), are incorporated by reference herein. The information set forth in the Information
Statement under the following captions is incorporated herein by reference:
“Market Information,
Dividends and Certain Transactions in the Class A Common Stock”
“Where You
Can Find More Information”
(b) Pro
Forma Information. Not applicable.
ITEM 14. PERSONS/ASSETS,
RETAINED, EMPLOYED, COMPENSATED OR USED
(a) Solicitations
or Recommendations. Not applicable.
(b) Employees
and Corporate Assets. The information set forth in the Information Statement under the following
captions is incorporated herein by reference:
“Summary”
“Questions
and Answers about the Merger”
“The Special
Factors – Background of the Merger”
“The Special
Factors – Recommendation of the Special Committee; Reasons for the Merger; Recommendation of the Board”
“The Special
Factors – Opinion and Materials of Lazard”
“The Special
Factors – Interests of Our Directors and Executive Officers in the Merger”
“The Special
Factors – Fees and Expenses”
ITEM 15. ADDITIONAL
INFORMATION
(b) Golden
Parachute Compensation. The information set forth in the Information Statement under the following
caption is incorporated herein by reference:
“The Special
Factors – Interests of Our Directors and Executive Officers in the Merger”
“The Merger
Agreement—Consideration to be Received in the Merger”
(c) Other
Material Information. The information set forth in the Information Statement, including all
annexes thereto, is incorporated herein by reference.
ITEM 16. EXHIBITS
| (d)(8) | Services Agreement, dated as of May 7,
2019, by and among Scientific Games Corporation (as predecessor to Light & Wonder, Inc.),
Scientific Games International, Inc. (as predecessor to Light and Wonder International, Inc.),
Bally Gaming, Inc. (as predecessor to LNW Gaming, Inc.) and SciPlay Holding Company, LLC
(as predecessor to SciPlay Games, LLC), incorporated by reference to Exhibit 10.6 to SciPlay Corporation’s
Current Report on Form 8-K filed on May 8, 2019. |
* To be filed herewith
SIGNATURES
After due inquiry
and to the best of each of the undersigned’s knowledge and belief, each of the undersigned certifies that the information set forth
in this statement is true, complete and correct.
Dated as of September 11,
2023.
| |
SCIPLAY CORPORATION |
| |
|
|
| |
By: |
/s/ Daniel O’Quinn |
| |
Name: |
Daniel O’Quinn |
| |
Title: |
Interim Chief Financial Officer and Secretary |
| |
|
|
| |
LIGHT &
WONDER, INC. |
| |
|
|
| |
By: |
/s/
James Sottile |
| |
Name: |
James Sottile |
| |
Title: |
Executive Vice President, Chief
Legal Officer and Corporate Secretary |
| |
|
|
| |
BERN MERGER
SUB, INC. |
| |
|
|
| |
By: |
/s/
James Sottile |
| |
Name: |
James Sottile |
| |
Title: |
President, Treasurer and Secretary |
| |
|
|
| |
LNW SOCIAL
HOLDING COMPANY I, LLC |
| |
|
|
| |
By: |
LNW Social Holding Company II,
LLC, |
| |
|
its sole member |
| |
|
|
| |
By: |
Light and Wonder International,Inc., |
| |
|
its sole member |
| |
|
|
| |
By: |
/s/
James Sottile |
| |
Name: |
James Sottile |
| |
Title: |
Secretary |
| |
|
|
| |
LNW SOCIAL
HOLDING COMPANY II, LLC |
| |
|
|
| |
By: |
Light and Wonder International,Inc., |
| |
|
its sole member |
| |
|
|
| |
By: |
/s/
James Sottile |
| |
Name: |
James Sottile |
| |
Title: |
Treasurer and Secretary |
| |
|
|
| |
LIGHT AND WONDER
INTERNATIONAL, INC. |
| |
|
|
| |
By: |
/s/
James Sottile |
| |
Name: |
James Sottile |
| |
Title: |
Treasurer and Secretary |
Exhibit (c)(3)
| SPECIAL COMMITTEE DISCUSSION MATERIALS
CONFIDENTIAL 12 JUNE 2023
Project Sapphire |

| PROJECT SAPPHIRE CONFIDENTIAL
The Lazard Team for the Special Committee of Sapphire
Interactive Media & Technologies Team and Special Committee Expertise
David Higley
Managing Director, Global Head of Interactive Media & Technologies
• Based in Los Angeles, with 25+ years of investment banking experience
• Prior to Lazard, founded Bond Lane Partners, a boutique investment bank focused on
interactive media and technologies and served as Managing Director and Global Head of
Digital Media at UBS as well as a member of its Equity Commitment Committee
• Former securities lawyer
• Recent clients include Activision, Bungie, Capcom, Hearst, Lockwood Publishing (Tencent),
Miximo (Adobe), OneTwoSee (Comcast), SciPlay, Sony, Unity Software
Vivienne Zhao
Director
• Based in Los Angeles, with 8+
years of investment banking
experience
• M: +1 847 924 9422
• E: vivienne.zhao@lazard.com
• Based in Los Angeles, with 9+
years of financial advisory
experience
• M: +1 562 447 9460
• E: albert.toscano@lazard.com
Albert Toscano
Senior Associate
Selena Zhu
Associate
• Based in Los Angeles, specializing in
Interactive Media &
Technologies
• T: +1 310 367 5015
• E: selena.zhu@lazard.com
• Based in Los Angeles, specializing in
Interactive Media & Technologies
and Industrials
• T: +1 310 601 3460
• E: chandler.pearce@lazard.com
Chandler Pearce
Analyst
Joe Cassanelli
Managing Director, Co-Head of Financial Institutions Group North America
• Based in New York, with 25+ years of investment banking
and advisory experience
• Member of Lazard's Fairness Opinion Committee and
Lazard's Valuation Subcommittee
• Prior to joining Lazard, worked at Dresdner Kleinwort Wasserstein
and Wasserstein Perella & Co.
• Special Committee expertise
• Recent clients include Allstate, American Express, Ameriprise,
Apollo, Ares, Aviva, Blackstone, First Republic Bank, J.P. Morgan,
KKR, Nestle, Western Union
Capital Markets Advisory
Mary Ann Deignan
Co-Head of Capital Markets
Advisory
New York
John Buchanan
Managing Director
New York
1 |
| CONFIDENTIAL
Situation Update
PROJECT SAPPHIRE |

| Summary of Cobalt’s Proposal to Acquire Public Shares of Sapphire
PROJECT SAPPHIRE SITUATION UPDATE
• On May 18, 2023, Cobalt submitted to the Sapphire Board of Directors a proposal for Cobalt to acquire the 17% equity interest in
Sapphire that it does not currently own for $20.00 per share in cash
− Values Sapphire at $2.1 billion in enterprise value and public shares at $422 million1
• Implied multiple of 10.4x 2023E Adj. EBITDA based on consensus estimates as of May 17, 2023, the last trading day prior to the
proposal (the “unaffected date”)
− Implies a premium of 28.5% based on Sapphire’s closing stock price on the unaffected date
• Implied premium of 17.9% based on Sapphire’s 10-trading day VWAP as of unaffected date and 17.0% based on Sapphire’s 30-trading
day VWAP as of unaffected date
• Cobalt’s stated intent for the proposal based on unifying Cobalt businesses and combining balance sheets to enable greater flexibility
to invest across the enterprise; not driven by cost synergy opportunities
• Proposal conditioned upon approval of special committee of independent directors
• Proposal not conditioned upon approval of independent shareholders
− As holder of ~83% of the economic interest and ~98% of the voting interest of Sapphire, Cobalt intends to vote in favor of the proposal; does
not expect to vote in favor of any alternative sale, merger or other corporate transaction involving Sapphire nor divest or sell any portion of its
ownership interest
Source: Public information, Bloomberg
Note: Unaffected date as of May 17, 2023 (last trading day prior to proposal by Cobalt).
1. Per Cobalt press release; $425 million offer value based on publicly disclosed shares of Sapphire Class A Common Stock as of May 4, 2023, per Sapphire Q1 2023 10-Q. 2 |
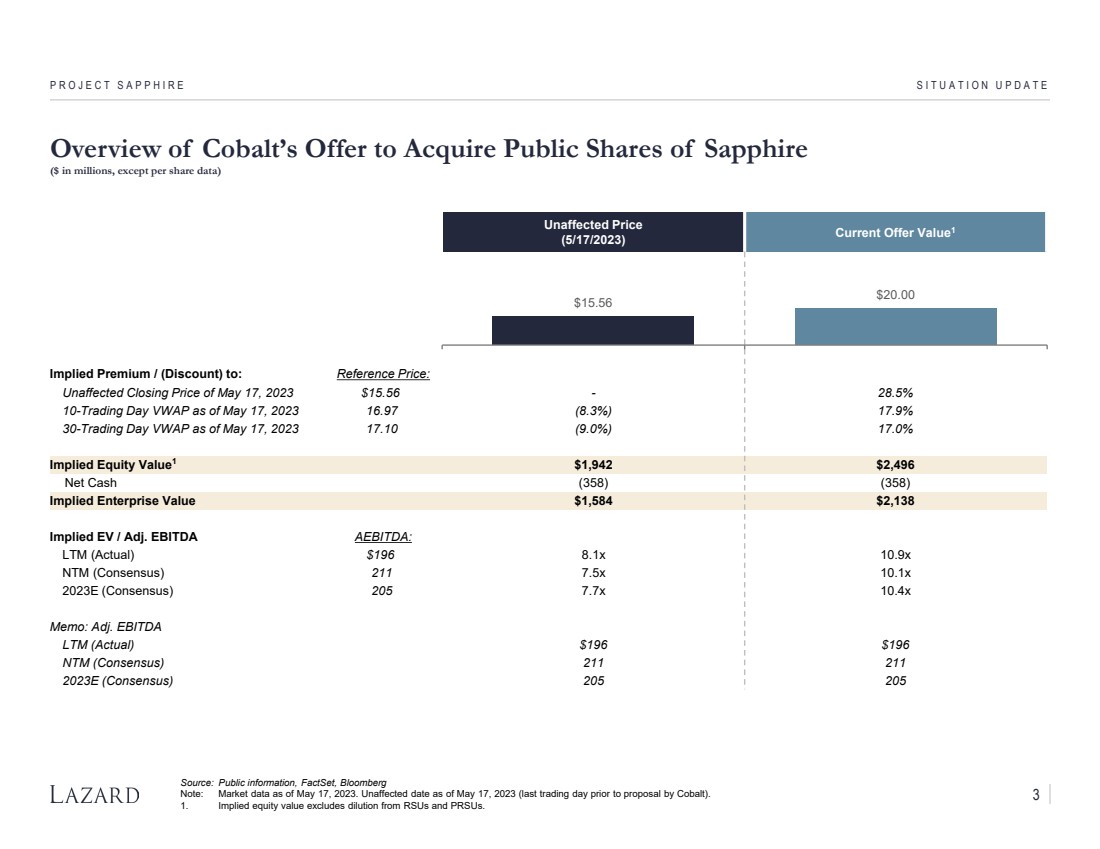
| Overview of Cobalt’s Offer to Acquire Public Shares of Sapphire
($ in millions, except per share data)
PROJECT SAPPHIRE SITUATION UPDATE
Source: Public information, FactSet, Bloomberg
Note: Market data as of May 17, 2023. Unaffected date as of May 17, 2023 (last trading day prior to proposal by Cobalt).
1. Implied equity value excludes dilution from RSUs and PRSUs.
Unaffected Price
(5/17/2023) Current Offer Value1
Implied Premium / (Discount) to: Reference Price:
Unaffected Closing Price of May 17, 2023 $15.56 - 28.5%
10-Trading Day VWAP as of May 17, 2023 16.97 (8.3%) 17.9%
30-Trading Day VWAP as of May 17, 2023 17.10 (9.0%) 17.0%
Implied Equity Value1 $1,942 $2,496
Net Cash (358) (358)
Implied Enterprise Value $1,584 $2,138
Implied EV / Adj. EBITDA AEBITDA:
LTM (Actual) $196 8.1x 10.9x
NTM (Consensus) 211 7.5x 10.1x
2023E (Consensus) 205 7.7x 10.4x
Memo: Adj. EBITDA
LTM (Actual) $196 $196
NTM (Consensus) 211 211
2023E (Consensus) 205 205
$15.56 $20.00
3 |

| 6
8
10
12
14
16
18
20
22
$24
Jan-22 Apr-22 Jul-22 Oct-22 Feb-23 May-23
Sapphire Social Casino Peers
PROJECT SAPPHIRE SITUATION UPDATE
Sapphire Trading Statistics:
Unaffected1
(5/17/2023)
Current2
(6/7/2023)
Stock Price $15.56 $19.17
Equity Value4 $1,973 $2,431
Net Cash (358) (358)
Enterprise Value $1,615 $2,073
EV / 2023E EBITDA 7.9x 10.1x
Unaffected Share Price Performance (January 3, 2022 – May 17, 2023)
3
Sapphire
$15.56
+17.4%
Social Casino
Peers
(21.0%)
Source: Public information, FactSet
Note: Market data as of June 7, 2023. Share price performance indexed to Sapphire’s starting share price. Financial projections based on median consensus estimates; balance sheet
and share count based on latest publicly available data as of share price date. Unaffected date as of May 17, 2023 (last trading day prior to proposal by Cobalt).
1. Financials and market data as of May 17, 2023.
2. Financials and market data as of June 7, 2023.
3. Social Casino peers consist of DoubleDown, Huuuge, Playstudios and Playtika.
4. Equity value on fully diluted basis, including dilution from RSUs and PRSUs.
Sapphire: Share Price Performance Since 2022
($ in millions, except per share data)
6
8
10
12
14
16
18
20
22
$24
17-May 24-May 31-May 7-Jun
Affected Share Price Performance (May 17, 2023 – June 7, 2023)
$15.56
$13.25
Sapphire
$19.17
+23.2%
Social Casino
Peers
3.2%
4 |
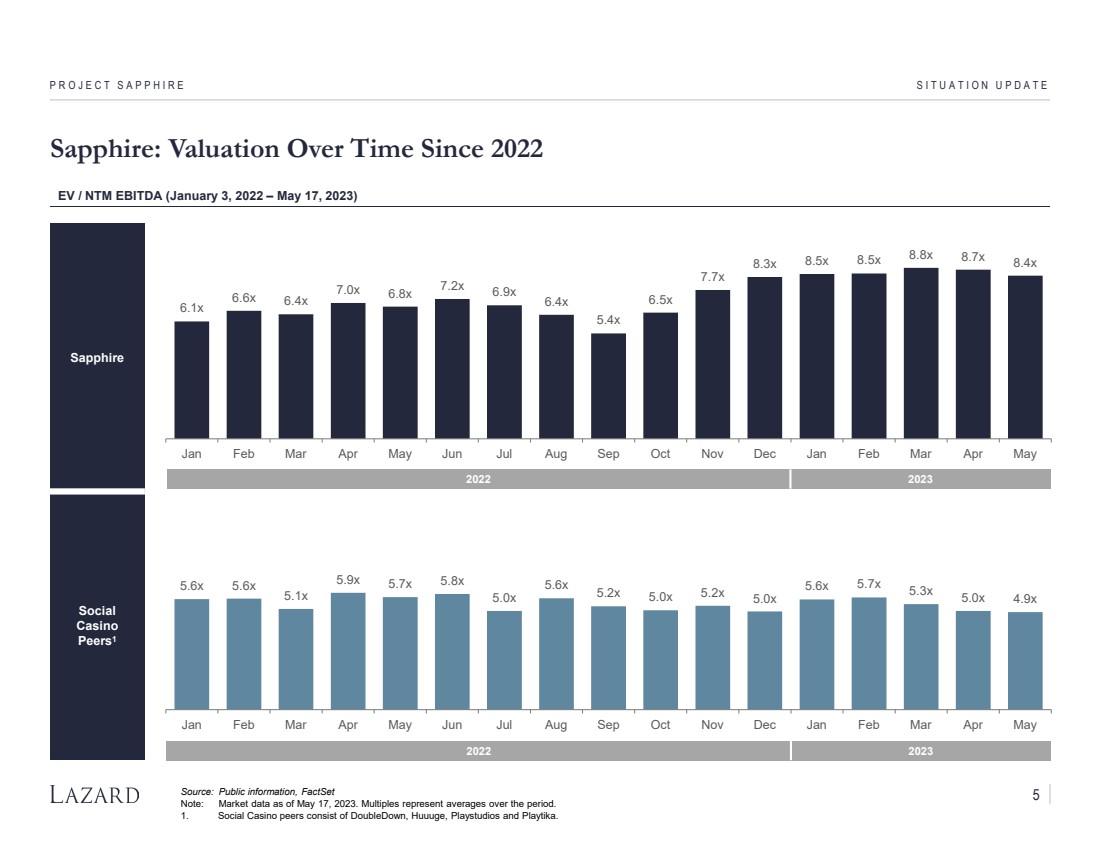
| Sapphire
Social
Casino
Peers1
6.1x
6.6x 6.4x
7.0x 6.8x 7.2x 6.9x
6.4x
5.4x
6.5x
7.7x
8.3x 8.5x 8.5x 8.8x 8.7x 8.4x
Jan Feb Mar Apr May Jun Jul Aug Sep Oct Nov Dec Jan Feb Mar Apr May
5.6x 5.6x
5.1x
5.9x 5.7x 5.8x
5.0x
5.6x 5.2x 5.0x 5.2x 5.0x
5.6x 5.7x 5.3x 5.0x 4.9x
Jan Feb Mar Apr May Jun Jul Aug Sep Oct Nov Dec Jan Feb Mar Apr May
Sapphire: Valuation Over Time Since 2022
PROJECT SAPPHIRE SITUATION UPDATE
EV / NTM EBITDA (January 3, 2022 – May 17, 2023)
Source: Public information, FactSet
Note: Market data as of May 17, 2023. Multiples represent averages over the period.
1. Social Casino peers consist of DoubleDown, Huuuge, Playstudios and Playtika.
2022 2023
2022 2023
5 |
| CONFIDENTIAL
Preliminary Financial Analysis
PROJECT SAPPHIRE |
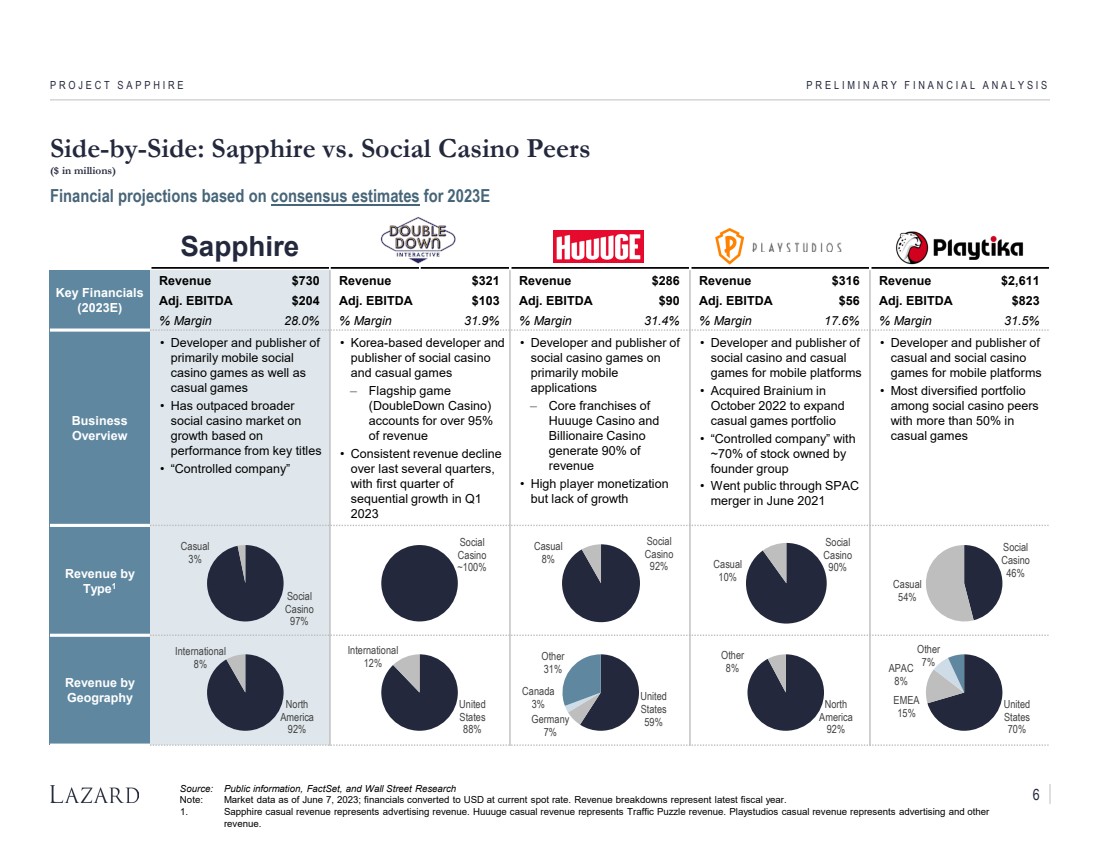
| Sapphire
Key Financials
(2023E)
Revenue $730 Revenue $321 Revenue $286 Revenue $316 Revenue $2,611
Adj. EBITDA $204 Adj. EBITDA $103 Adj. EBITDA $90 Adj. EBITDA $56 Adj. EBITDA $823
% Margin 28.0% % Margin 31.9% % Margin 31.4% % Margin 17.6% % Margin 31.5%
Business
Overview
• Developer and publisher of
primarily mobile social
casino games as well as
casual games
• Has outpaced broader
social casino market on
growth based on
performance from key titles
• “Controlled company”
• Korea-based developer and
publisher of social casino
and casual games
‒ Flagship game
(DoubleDown Casino)
accounts for over 95%
of revenue
• Consistent revenue decline
over last several quarters,
with first quarter of
sequential growth in Q1
2023
• Developer and publisher of
social casino games on
primarily mobile
applications
‒ Core franchises of
Huuuge Casino and
Billionaire Casino
generate 90% of
revenue
• High player monetization
but lack of growth
• Developer and publisher of
social casino and casual
games for mobile platforms
• Acquired Brainium in
October 2022 to expand
casual games portfolio
• “Controlled company” with
~70% of stock owned by
founder group
• Went public through SPAC
merger in June 2021
• Developer and publisher of
casual and social casino
games for mobile platforms
• Most diversified portfolio
among social casino peers
with more than 50% in
casual games
Revenue by
Type1
Revenue by
Geography
Side-by-Side: Sapphire vs. Social Casino Peers
($ in millions)
PROJECT SAPPHIRE PRELIMINARY FINANCIAL ANALYSIS
Source: Public information, FactSet, and Wall Street Research
Note: Market data as of June 7, 2023; financials converted to USD at current spot rate. Revenue breakdowns represent latest fiscal year.
1. Sapphire casual revenue represents advertising revenue. Huuuge casual revenue represents Traffic Puzzle revenue. Playstudios casual revenue represents advertising and other
revenue.
Financial projections based on consensus estimates for 2023E
North
America
92%
International
8%
Social
Casino
97%
Casual
3%
United
States
Germany 59%
7%
Canada
3%
Other
31%
Social
Casino
92%
Casual
8%
North
America
92%
Other
8%
Social
Casino
Casual 90%
10%
United
States
70%
EMEA
15%
APAC
8%
Other
7%
Social
Casino
46%
Casual
54%
United
States
88%
International
12%
Social
Casino
~100%
6 |
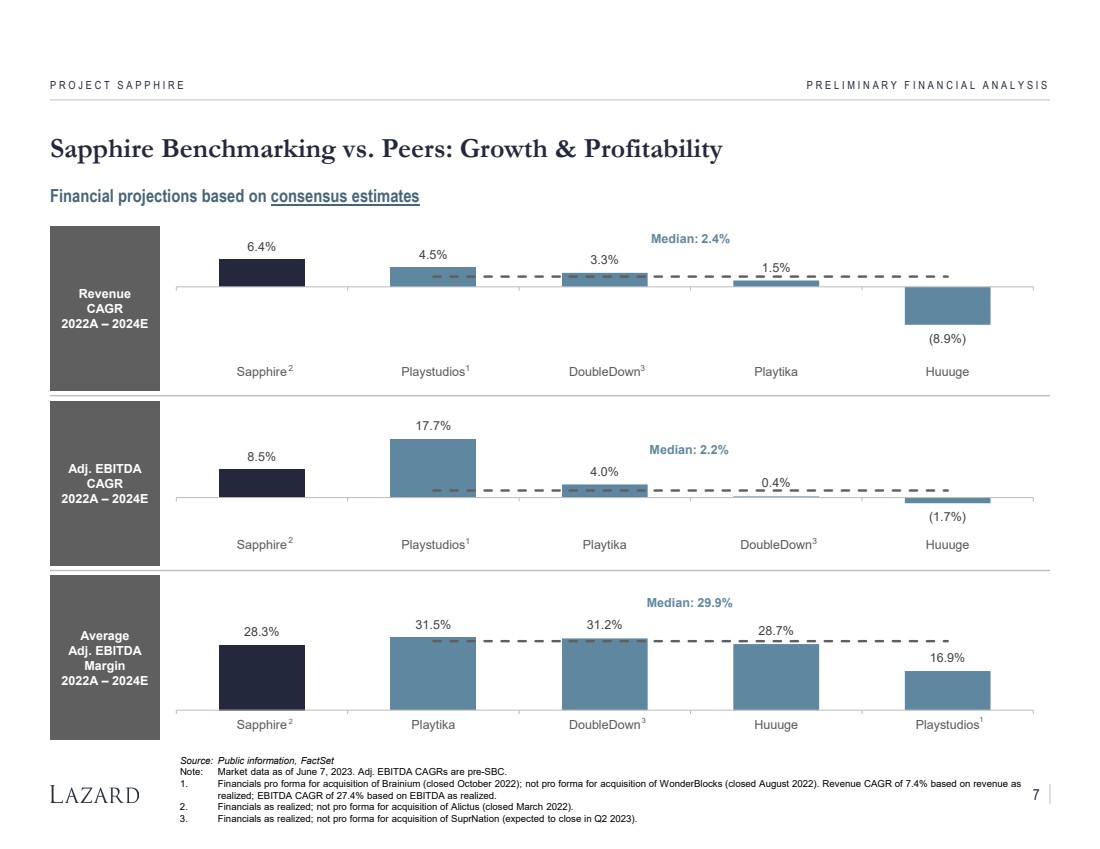
| Revenue
CAGR
2022A – 2024E
Adj. EBITDA
CAGR
2022A – 2024E
Average
Adj. EBITDA
Margin
2022A – 2024E
6.4% 4.5% 3.3% 1.5%
(8.9%)
Median: 2.4%
Sapphire Playstudios DoubleDown Playtika Huuuge
Sapphire Benchmarking vs. Peers: Growth & Profitability
PROJECT SAPPHIRE PRELIMINARY FINANCIAL ANALYSIS
Source: Public information, FactSet
Note: Market data as of June 7, 2023. Adj. EBITDA CAGRs are pre-SBC.
1. Financials pro forma for acquisition of Brainium (closed October 2022); not pro forma for acquisition of WonderBlocks (closed August 2022). Revenue CAGR of 7.4% based on revenue as
realized; EBITDA CAGR of 27.4% based on EBITDA as realized.
2. Financials as realized; not pro forma for acquisition of Alictus (closed March 2022).
3. Financials as realized; not pro forma for acquisition of SuprNation (expected to close in Q2 2023).
Financial projections based on consensus estimates
2 1 3
7
8.5%
17.7%
4.0%
0.4%
(1.7%)
Median: 2.2%
Sapphire Playstudios Playtika DoubleDown Huuuge 2 1 3
28.3% 31.5% 31.2% 28.7%
16.9%
Median: 29.9%
Sapphire Playtika DoubleDown Huuuge Playstudios 2 3 1 |

| Social Casino Peers
FY2022A
Average Daily
Active Users
(in millions)
FY2022A
ARPDAU1
FY2022A
Payer
Conversion
Rate
9.6%
6.3%
5.3%
3.3%
1.5%
Median: 4.3%
Sapphire Huuuge DoubleDown Playtika Playstudios
$0.78
$1.43
$0.97
$0.76
$0.41
Median: $0.87
Sapphire Huuuge DoubleDown Playtika Playstudios
Sapphire Benchmarking vs. Peers: Selected KPIs
PROJECT SAPPHIRE PRELIMINARY FINANCIAL ANALYSIS
Source: Public information
1. Average Revenue Per Daily Active User.
2.3
9.4
1.9 1.0 0.6
Median: 1.5 million
Sapphire Playtika Playstudios DoubleDown Huuuge
KPIs measured as of latest fiscal year
8 |
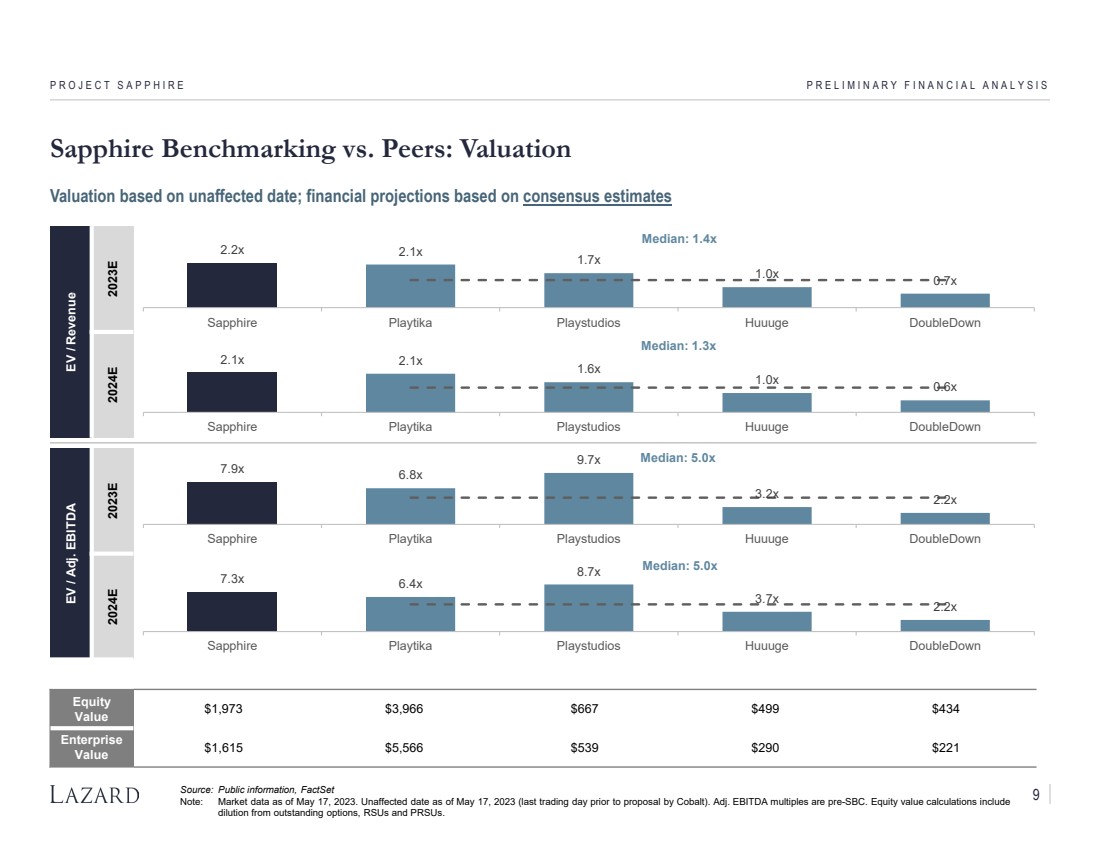
| Social Casino Peers
EV / Revenue
2023E 2024E
EV / Adj. EBITDA
2023E 2024E
Equity
Value $1,973 $3,966 $667 $499 $434
Enterprise
Value $1,615 $5,566 $539 $290 $221
2.1x 2.1x 1.6x
1.0x 0.6x
Median: 1.3x
Sapphire Playtika Playstudios Huuuge DoubleDown
7.3x 6.4x
8.7x
3.7x 2.2x
Median: 5.0x
Sapphire Playtika Playstudios Huuuge DoubleDown
7.9x 6.8x
9.7x
3.2x 2.2x
Median: 5.0x
Sapphire Playtika Playstudios Huuuge DoubleDown
Sapphire Benchmarking vs. Peers: Valuation
PROJECT SAPPHIRE PRELIMINARY FINANCIAL ANALYSIS
Source: Public information, FactSet
Note: Market data as of May 17, 2023. Unaffected date as of May 17, 2023 (last trading day prior to proposal by Cobalt). Adj. EBITDA multiples are pre-SBC. Equity value calculations include
dilution from outstanding options, RSUs and PRSUs.
2.2x 2.1x 1.7x
1.0x 0.7x
Median: 1.4x
Sapphire Playtika Playstudios Huuuge DoubleDown
Valuation based on unaffected date; financial projections based on consensus estimates
9 |

| CONFIDENTIAL
Key Process Workstreams
PROJECT SAPPHIRE |
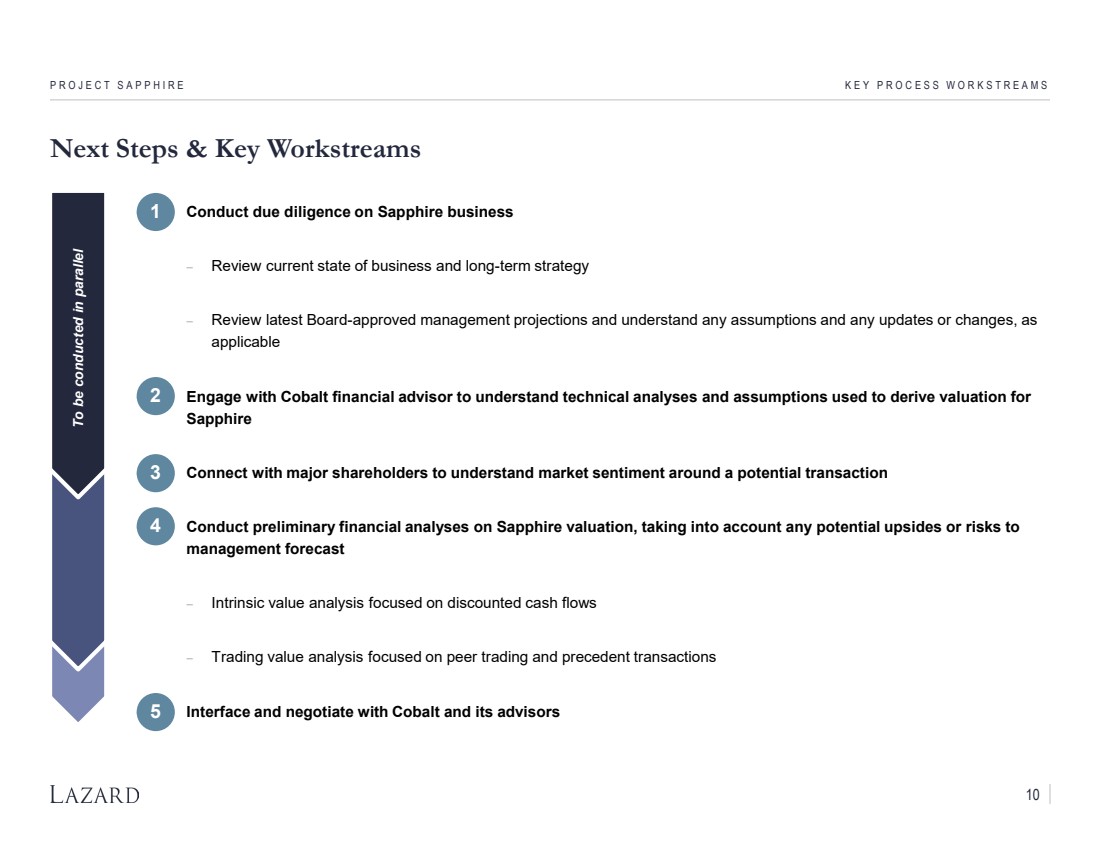
| Next Steps & Key Workstreams
• Conduct due diligence on Sapphire business
− Review current state of business and long-term strategy
− Review latest Board-approved management projections and understand any assumptions and any updates or changes, as
applicable
• Engage with Cobalt financial advisor to understand technical analyses and assumptions used to derive valuation for
Sapphire
• Connect with major shareholders to understand market sentiment around a potential transaction
• Conduct preliminary financial analyses on Sapphire valuation, taking into account any potential upsides or risks to
management forecast
− Intrinsic value analysis focused on discounted cash flows
− Trading value analysis focused on peer trading and precedent transactions
• Interface and negotiate with Cobalt and its advisors
PROJECT SAPPHIRE KEY PROCESS WORKSTREAMS
1
2
3
4
5
To be conducted in parallel
10 |
| CONFIDENTIAL
Appendix
PROJECT SAPPHIRE |

| $23.00
$23.00
$21.00
$20.00
$20.00
$20.00
$19.00
$19.00
$18.00
Sapphire: Analyst Price Targets
PROJECT SAPPHIRE APPENDIX
Target Price Range $18.00 - $23.00 Buy: 33.3%
Mean Target Price $20.33 Hold: 66.7%
Current Price $19.17 Sell: 0.0%
Broker Target Date
Target Price Current Price Targets
Rating Evolution Over Time
Current:
$19.17
Mean:
$20.33
1 1 1 1 1 1 1 1 1
5
4 5 5
4
5 5 4 4 4
6 6
6 6 6 6
7
6 6 6 6 6
3 3
Jul-22 Aug-22Sep-22 Oct-22 Nov-22Dec-22 Jan-23 Feb-23 Mar-23 Apr-23 May-23 Jun-23
Share Price Price Target
Buy Hold Sell
$16.30
$13.64
$20.33
$19.17
5/18/2023
5/18/2023
5/10/2023
5/18/2023
5/18/2023
5/22/2023
5/26/2023
6/3/2023
5/15/2023
Source: Wall Street Research, FactSet, Public information
Note: Price targets and share price as of June 7, 2023.
1. D.A. Davidson updated price target following the proposal from Cobalt (Previous
Price Target: $20).
2. Wedbush maintained price target and rating following the proposal from Cobalt.
3. Craig-Hallum updated rating following the proposal from Cobalt (Previous Rating:
Buy).
4. Deutsche Bank updated price target and rating following the proposal from Cobalt
(Previous Price Target: $21; Previous Rating: Buy).
5. Morgan Stanley updated price target following the proposal from Cobalt (Previous
Price Target: $15).
6. J.P.Morgan updated price target following the proposal from Cobalt (Previous Price
Target: $18).
7. Stifel Nicolaus maintained price target and rating following the proposal from Cobalt.
Cobalt Offer:
$20.00
1
3
4
5
2
6
7
11 |
| APPENDIX
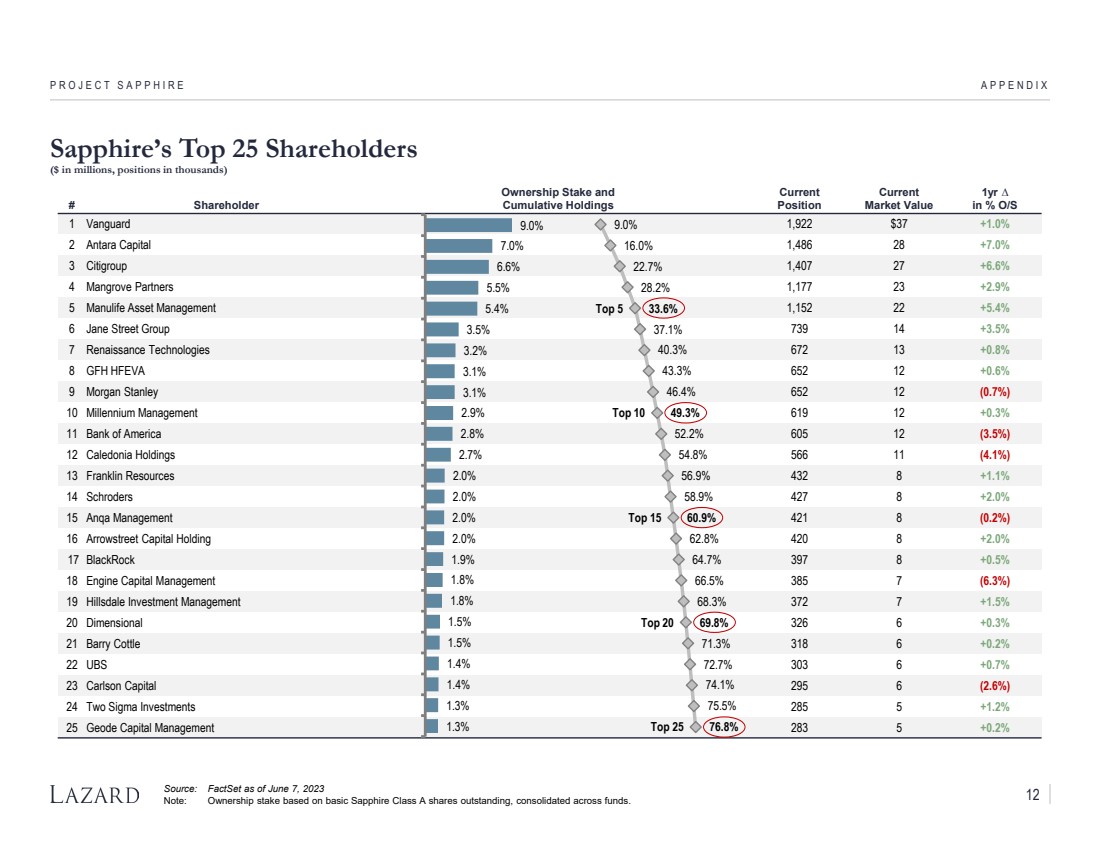
Sapphire’s Top 25 Shareholders
($ in millions, positions in thousands)
Source: FactSet as of June 7, 2023
Note: Ownership stake based on basic Sapphire Class A shares outstanding, consolidated across funds.
PROJECT SAPPHIRE
# Shareholder
Ownership Stake and
Cumulative Holdings
Current
Position
Current
Market Value
1yr ∆
in % O/S
1 Vanguard 1,922 $37 +1.0%
2 Antara Capital 1,486 28 +7.0%
3 Citigroup 1,407 27 +6.6%
4 Mangrove Partners 1,177 23 +2.9%
5 Manulife Asset Management 1,152 22 +5.4%
6 Jane Street Group 739 14 +3.5%
7 Renaissance Technologies 672 13 +0.8%
8 GFH HFEVA 652 12 +0.6%
9 Morgan Stanley 652 12 (0.7%)
10 Millennium Management 619 12 +0.3%
11 Bank of America 605 12 (3.5%)
12 Caledonia Holdings 566 11 (4.1%)
13 Franklin Resources 432 8 +1.1%
14 Schroders 427 8 +2.0%
15 Anqa Management 421 8 (0.2%)
16 Arrowstreet Capital Holding 420 8 +2.0%
17 BlackRock 397 8 +0.5%
18 Engine Capital Management 385 7 (6.3%)
19 Hillsdale Investment Management 372 7 +1.5%
20 Dimensional 326 6 +0.3%
21 Barry Cottle 318 6 +0.2%
22 UBS 303 6 +0.7%
23 Carlson Capital 295 6 (2.6%)
24 Two Sigma Investments 285 5 +1.2%
25 Geode Capital Management 283 5 +0.2%
9.0%
7.0%
6.6%
5.5%
5.4%
3.5%
3.2%
3.1%
3.1%
2.9%
2.8%
2.7%
2.0%
2.0%
2.0%
2.0%
1.9%
1.8%
1.8%
1.5%
1.5%
1.4%
1.4%
1.3%
1.3%
9.0%
16.0%
22.7%
28.2%
33.6%
37.1%
40.3%
43.3%
46.4%
49.3%
52.2%
54.8%
56.9%
58.9%
60.9%
62.8%
64.7%
66.5%
68.3%
69.8%
71.3%
72.7%
74.1%
75.5%
76.8%
Top 5
Top 10
Top 15
Top 20
Top 25
12 |
Exhibit (c)(4)
| P R E L I M I N A R Y B E N C H M A R K I N G A N A LY S I S
C O N F I D E N T I A L J U L Y 2 0 2 3
Project Sapphire |
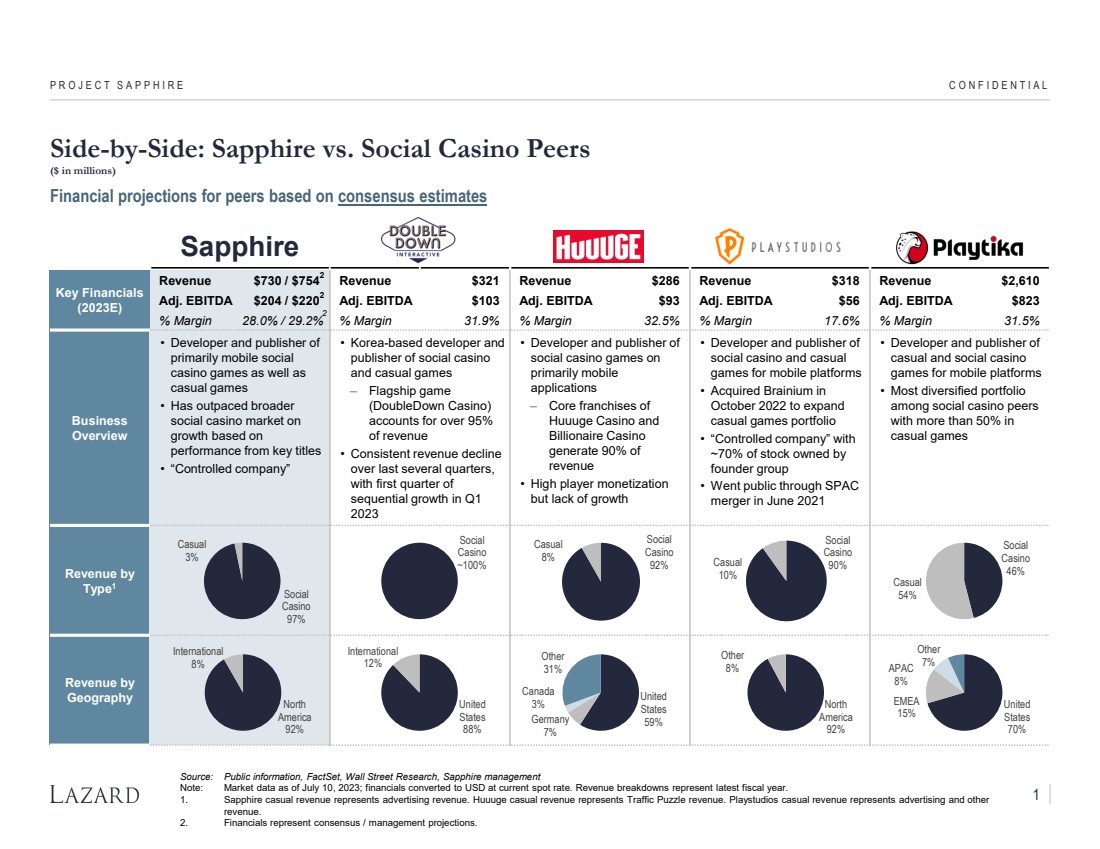
| Sapphire
Key Financials
(2023E)
Revenue $730 / $754 Revenue $321 Revenue $286 Revenue $318 Revenue $2,610
Adj. EBITDA $204 / $220 Adj. EBITDA $103 Adj. EBITDA $93 Adj. EBITDA $56 Adj. EBITDA $823
% Margin 28.0% / 29.2% % Margin 31.9% % Margin 32.5% % Margin 17.6% % Margin 31.5%
Business
Overview
• Developer and publisher of
primarily mobile social
casino games as well as
casual games
• Has outpaced broader
social casino market on
growth based on
performance from key titles
• “Controlled company”
• Korea-based developer and
publisher of social casino
and casual games
‒ Flagship game
(DoubleDown Casino)
accounts for over 95%
of revenue
• Consistent revenue decline
over last several quarters,
with first quarter of
sequential growth in Q1
2023
• Developer and publisher of
social casino games on
primarily mobile
applications
‒ Core franchises of
Huuuge Casino and
Billionaire Casino
generate 90% of
revenue
• High player monetization
but lack of growth
• Developer and publisher of
social casino and casual
games for mobile platforms
• Acquired Brainium in
October 2022 to expand
casual games portfolio
• “Controlled company” with
~70% of stock owned by
founder group
• Went public through SPAC
merger in June 2021
• Developer and publisher of
casual and social casino
games for mobile platforms
• Most diversified portfolio
among social casino peers
with more than 50% in
casual games
Revenue by
Type1
Revenue by
Geography
Side-by-Side: Sapphire vs. Social Casino Peers
($ in millions)
P R O J E C T S A P P H I R E C O N F I D E N T I A L
Source: Public information, FactSet, Wall Street Research, Sapphire management
Note: Market data as of July 10, 2023; financials converted to USD at current spot rate. Revenue breakdowns represent latest fiscal year.
1. Sapphire casual revenue represents advertising revenue. Huuuge casual revenue represents Traffic Puzzle revenue. Playstudios casual revenue represents advertising and other
revenue.
2. Financials represent consensus / management projections.
Financial projections for peers based on consensus estimates
North
America
92%
International
8%
Social
Casino
97%
Casual
3%
United
States
Germany 59%
7%
Canada
3%
Other
31%
Social
Casino
92%
Casual
8%
North
America
92%
Other
8%
Social
Casino
Casual 90%
10%
United
States
70%
EMEA
15%
APAC
8%
Other
7%
Social
Casino
46%
Casual
54%
United
States
88%
International
12%
Social
Casino
~100%
2
2
2
1 |

| Company HQ
Exchange
Traded
Mobile
Revenue % Description
Sydney, AU
Australian
Securities
Exchange
46%1
• Engages in the design, development and distribution of gaming content, platforms and systems,
including electronic gaming machines, casino management systems and free-to-play mobile
games
Redwood City,
CA NASDAQ 17% • Develops PC, console and mobile games across various genres such as sports, FPS, action,
role-playing and simulation
Cobalt Las Vegas, NV NASDAQ 27%2 • Creates content and products for land-based casino gaming, digital gaming (iGaming) and
mobile gaming
Stockholm, SE NASDAQ
Stockholm
73% • Owns and operates gaming studios with popular global IPs across a wide range of casual and
mid-core genres
San Mateo, CA NYSE 50% • Operates a free-to-play online gaming platform and game creation system
Stockholm, SE NASDAQ
Stockholm
76% • Owns and operates 23 studios that develop and publish games across various genres such as
strategy, casual & mashup, simulation, RPG and action
New York, NY NASDAQ 47% • Develops and publishes PC, console and mobile games through Rockstar Games, 2K, Private
Division and Zynga
Saint-Mandé,
FR Euronext Paris 31% • Established video game developer and publisher that primarily focuses on AAA PC, console
and mobile titles
P R O J E C T S A P P H I R E C O N F I D E N T I A L
Overview of Broader Interactive Entertainment Players
Source: Public information, FactSet
Note: Mobile revenue breakdowns represent latest fiscal year.
1. Represents Pixel United revenue as a % of total Aristocrat revenue.
2. Represents Sapphire revenue as a % of total Cobalt revenue.
2 |
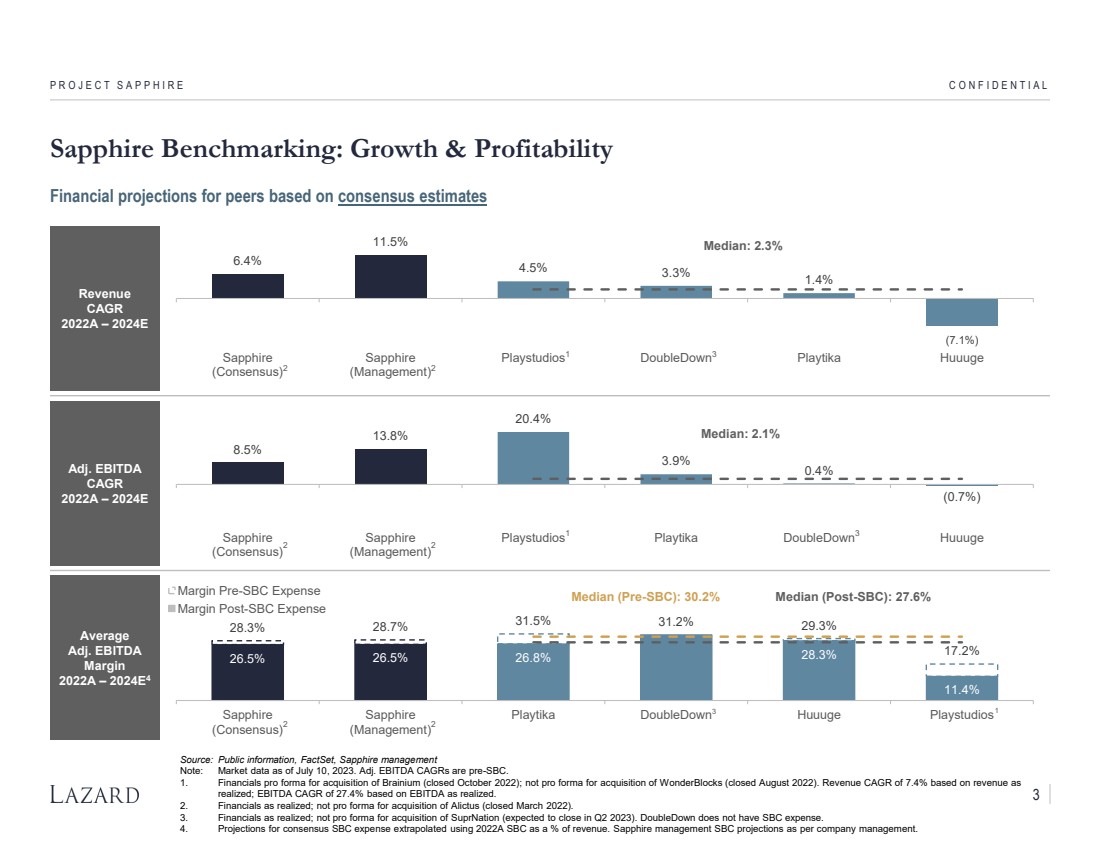
| Revenue
CAGR
2022A – 2024E
Adj. EBITDA
CAGR
2022A – 2024E
Average
Adj. EBITDA
Margin
2022A – 2024E4
(7.1%)
6.4%
11.5%
4.5% 3.3% 1.4%
Median: 2.3%
Sapphire
(Consensus)
Sapphire
(Management)
Playstudios DoubleDown Playtika Huuuge
Sapphire Benchmarking: Growth & Profitability
P R O J E C T S A P P H I R E C O N F I D E N T I A L
Source: Public information, FactSet, Sapphire management
Note: Market data as of July 10, 2023. Adj. EBITDA CAGRs are pre-SBC.
1. Financials pro forma for acquisition of Brainium (closed October 2022); not pro forma for acquisition of WonderBlocks (closed August 2022). Revenue CAGR of 7.4% based on revenue as
realized; EBITDA CAGR of 27.4% based on EBITDA as realized.
2. Financials as realized; not pro forma for acquisition of Alictus (closed March 2022).
3. Financials as realized; not pro forma for acquisition of SuprNation (expected to close in Q2 2023). DoubleDown does not have SBC expense.
4. Projections for consensus SBC expense extrapolated using 2022A SBC as a % of revenue. Sapphire management SBC projections as per company management.
Financial projections for peers based on consensus estimates
1
2
3
(0.7%)
8.5%
13.8%
20.4%
3.9%
0.4%
Median: 2.1%
Sapphire
(Consensus)
Sapphire
(Management)
Playstudios Playtika DoubleDown Huuuge 1 3
26.5% 26.5% 26.8% 28.3%
11.4%
28.3% 28.7% 31.5% 31.2% 29.3%
17.2%
Median (Pre-SBC): 30.2% Median (Post-SBC): 27.6%
Sapphire
(Consensus)
Sapphire
(Management)
Playtika DoubleDown Huuuge Playstudios
Margin Pre-SBC Expense
Margin Post-SBC Expense
3 1
2
2 2
2 2
3 |
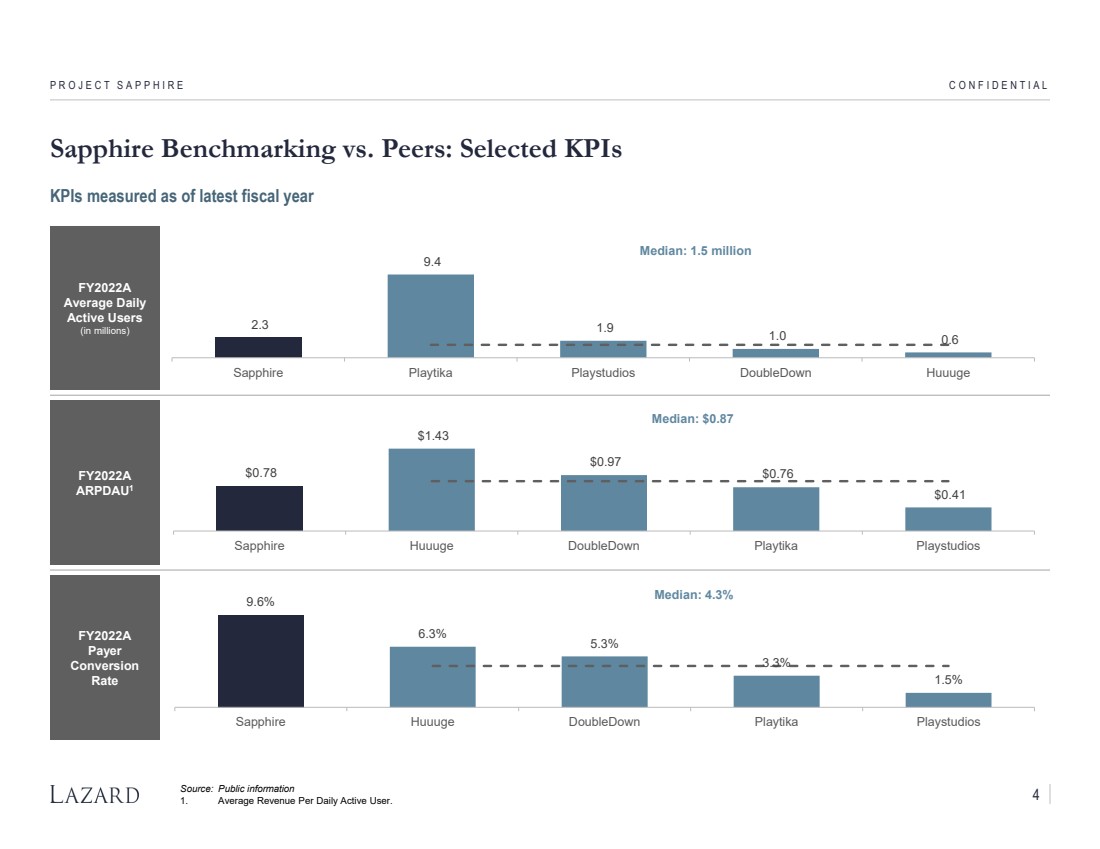
| Social Casino Peers
FY2022A
Average Daily
Active Users
(in millions)
FY2022A
ARPDAU1
FY2022A
Payer
Conversion
Rate
9.6%
6.3%
5.3%
3.3%
1.5%
Median: 4.3%
Sapphire Huuuge DoubleDown Playtika Playstudios
$0.78
$1.43
$0.97
$0.76
$0.41
Median: $0.87
Sapphire Huuuge DoubleDown Playtika Playstudios
Sapphire Benchmarking vs. Peers: Selected KPIs
P R O J E C T S A P P H I R E C O N F I D E N T I A L
Source: Public information
1. Average Revenue Per Daily Active User.
2.3
9.4
1.9 1.0 0.6
Median: 1.5 million
Sapphire Playtika Playstudios DoubleDown Huuuge
KPIs measured as of latest fiscal year
4 |

| P R O J E C T S A P P H I R E
Sapphire: Direct-to-Consumer Benchmarking
C O N F I D E N T I A L
Sapphire
Assumed DTC
Adoption
Playtika DTC
Sales as % of
Total Sales
Huuuge DTC
Sales as % of
Total Sales
(Core
Franchises)
Stillfront DTC
Sales as % of
Total Active
Portfolio and
by Genre2
-
1.5% 2.2%
5.8% 5.8%
0%
5%
10%
2023E 2024E 2025E 2026E 2027E
4.0%
7.3% 10.3%
13.6%
20.5% 23.2%
0%
15%
30%
2017A 2018A 2019A 2020A 2021A 2022A
0%
4%
8%
Jan-22 Feb-22 Mar-22 Apr-22 May-22 Jun-22 Jul-22 Aug-22 Sep-22 Oct-22 Nov-22 Dec-22 Jan-23 Feb-23 Mar-23 Apr-23 May-23
Sapphire DTC assumptions per management estimates; social casino peers and other interactive entertainment players DTC adoption based
on public information
Source: Public information, Sapphire management
1. Estimate per discussion with management.
2. Data from Stillfront Q1 2023 Investor Presentation. Stillfront did not disclose direct-to-consumer revenue prior to Q1 2023.
1
24.0% 25.0%
42.0%
12.0%
0%
25%
50%
Total Active Portfolio Strategy Sim / RPG / Action Mashup / Casual
5 |
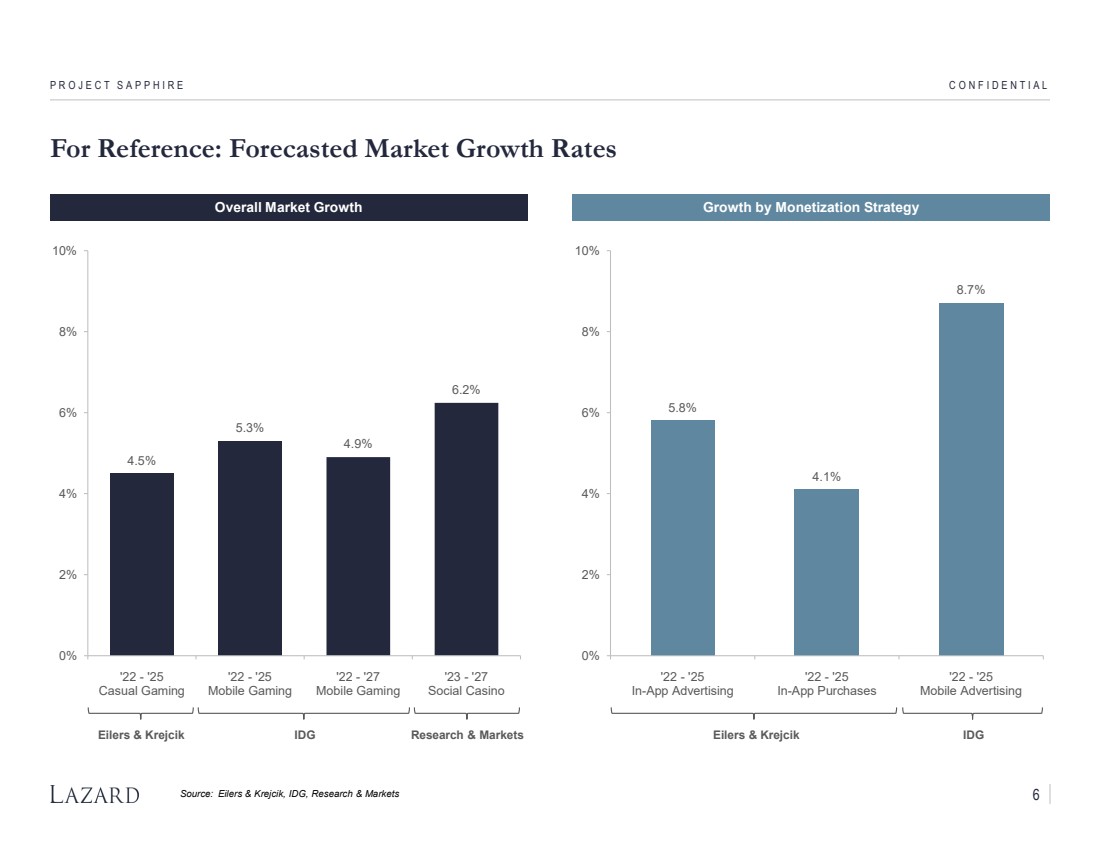
| P R O J E C T S A P P H I R E
For Reference: Forecasted Market Growth Rates
C O N F I D E N T I A L
4.5%
5.3%
4.9%
6.2%
0%
2%
4%
6%
8%
10%
'22 - '25
Casual Gaming
'22 - '25
Mobile Gaming
'22 - '27
Mobile Gaming
'23 - '27
Social Casino
Source: Eilers & Krejcik, IDG, Research & Markets
Overall Market Growth Growth by Monetization Strategy
Eilers & Krejcik IDG Research & Markets
5.8%
4.1%
8.7%
0%
2%
4%
6%
8%
10%
'22 - '25
In-App Advertising
'22 - '25
In-App Purchases
'22 - '25
Mobile Advertising
Eilers & Krejcik IDG
6 |
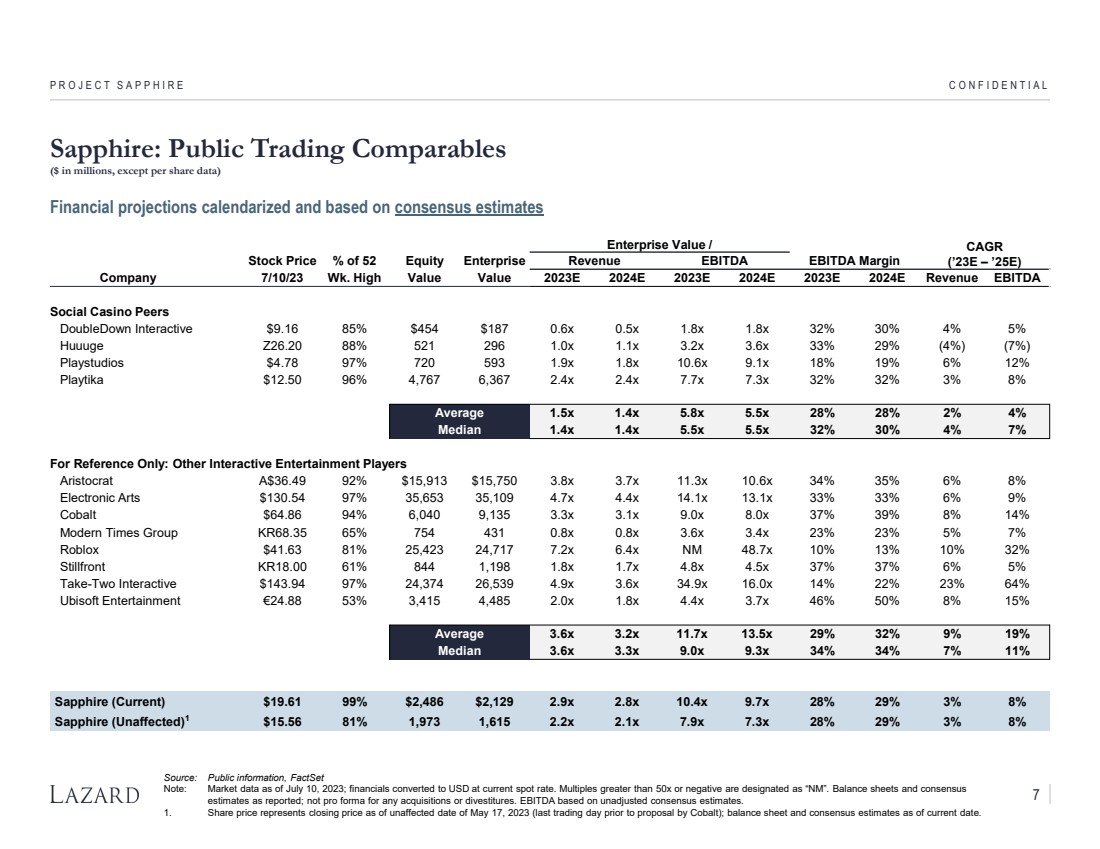
| Enterprise Value / CAGR
Stock Price % of 52 Equity Enterprise Revenue EBITDA EBITDA Margin (’23E – ’25E)
Company 7/10/23 Wk. High Value Value 2023E 2024E 2023E 2024E 2023E 2024E Revenue EBITDA
Social Casino Peers
DoubleDown Interactive $9.16 85% $454 $187 0.6x 0.5x 1.8x 1.8x 32% 30% 4% 5%
Huuuge Z26.20 88% 521 296 1.0x 1.1x 3.2x 3.6x 33% 29% (4%) (7%)
Playstudios $4.78 97% 720 593 1.9x 1.8x 10.6x 9.1x 18% 19% 6% 12%
Playtika $12.50 96% 4,767 6,367 2.4x 2.4x 7.7x 7.3x 32% 32% 3% 8%
Average 1.5x 1.4x 5.8x 5.5x 28% 28% 2% 4%
Median 1.4x 1.4x 5.5x 5.5x 32% 30% 4% 7%
For Reference Only: Other Interactive Entertainment Players
Aristocrat A$36.49 92% $15,913 $15,750 3.8x 3.7x 11.3x 10.6x 34% 35% 6% 8%
Electronic Arts $130.54 97% 35,653 35,109 4.7x 4.4x 14.1x 13.1x 33% 33% 6% 9%
Cobalt $64.86 94% 6,040 9,135 3.3x 3.1x 9.0x 8.0x 37% 39% 8% 14%
Modern Times Group KR68.35 65% 754 431 0.8x 0.8x 3.6x 3.4x 23% 23% 5% 7%
Roblox $41.63 81% 25,423 24,717 7.2x 6.4x NM 48.7x 10% 13% 10% 32%
Stillfront KR18.00 61% 844 1,198 1.8x 1.7x 4.8x 4.5x 37% 37% 6% 5%
Take-Two Interactive $143.94 97% 24,374 26,539 4.9x 3.6x 34.9x 16.0x 14% 22% 23% 64%
Ubisoft Entertainment €24.88 53% 3,415 4,485 2.0x 1.8x 4.4x 3.7x 46% 50% 8% 15%
Average 3.6x 3.2x 11.7x 13.5x 29% 32% 9% 19%
Median 3.6x 3.3x 9.0x 9.3x 34% 34% 7% 11%
Sapphire (Current) $19.61 99% $2,486 $2,129 2.9x 2.8x 10.4x 9.7x 28% 29% 3% 8%
Sapphire (Unaffected)1
$15.56 81% 1,973 1,615 2.2x 2.1x 7.9x 7.3x 28% 29% 3% 8%
Sapphire: Public Trading Comparables
($ in millions, except per share data)
P R O J E C T S A P P H I R E C O N F I D E N T I A L
Source: Public information, FactSet
Note: Market data as of July 10, 2023; financials converted to USD at current spot rate. Multiples greater than 50x or negative are designated as “NM”. Balance sheets and consensus
estimates as reported; not pro forma for any acquisitions or divestitures. EBITDA based on unadjusted consensus estimates.
1. Share price represents closing price as of unaffected date of May 17, 2023 (last trading day prior to proposal by Cobalt); balance sheet and consensus estimates as of current date.
Financial projections calendarized and based on consensus estimates
7 |
Exhibit (c)(5)
| Privileged & Confidential
Preliminary Analysis; to be Further Diligenced and Refined
Presentation to the Special Committee
PROJECT SAPPHIRE
CONFIDENTIAL 19 JULY 2023 |
| Privileged & Confidential
Preliminary Analysis; to be Further Diligenced and Refined
The information herein has been prepared by Lazard Frères & Co. LLC (“Lazard”) based upon information supplied by you (the “Company”) or
publicly available information, and portions of the information herein may be based upon certain statements, estimates and forecasts provided by
the Company with respect to the anticipated future performance of the Company. Lazard has relied upon the accuracy and completeness of the
foregoing information, and has not assumed any responsibility for any independent verification of such information or any independent valuation or
appraisal of any of the assets or liabilities of the Company, or any other entity, or concerning solvency or fair value of the Company or any other
entity. With respect to financial forecasts, Lazard has assumed that they have been reasonably prepared on bases reflecting the best currently
available estimates and judgments as to the future financial performance of the Company. Lazard assumes no responsibility for and expresses no
view as to such forecasts or the assumptions on which they are based. The information set forth herein is based upon economic, monetary, market
and other conditions as in effect on, and the information made available to us as of, the date hereof, unless indicated otherwise. Lazard is not
making any assessment regarding the impact or economic effects of the COVID-19 virus, including with respect to the potential impact or effects on
the future financial performance of the Company. Subsequent developments, including, without limitation, in relation to COVID-19, may affect the
forecasts and other information set out in this document and Lazard assumes no responsibility for updating or revising this document based on
circumstances or events after the date hereof. These materials and the information contained herein are confidential and may not be disclosed
publicly or made available to third parties without the prior written consent of Lazard; provided, however, that you may disclose to any and all
persons the U.S. federal income tax treatment and tax structure of the transaction described herein and the portions of these materials that relate to
such tax treatment or structure. Lazard is acting as financial advisor to the special committee of the board of directors of the Company, and will not
be responsible for and will not provide any tax, accounting, actuarial, legal or other specialist advice.
Disclaimer
CONFIDENTIAL PRESENTATION TO THE SPECIAL COMMITTEE |
| Privileged & Confidential
Preliminary Analysis; to be Further Diligenced and Refined
CONFIDENTIAL
Situation Update
PRESENTATION TO THE SPECIAL COMMITTEE |

| Privileged & Confidential
Preliminary Analysis; to be Further Diligenced and Refined
Overview of Cobalt’s Offer to Acquire Public Shares of Sapphire
($ in millions, except per share data)
PRESENTATION TO THE SPECIAL COMMITTEE SITUATION UPDATE
Source: Public information, FactSet, Bloomberg
Note: Unaffected date as of May 17, 2023 (last trading day prior to receipt of proposal from Cobalt); current date as of July 17, 2023. Adj. EBITDA excludes stock-based compensation (“SBC”)
expense.
1. Share count based on information from latest public filings; includes dilution from unvested stock units.
2. Projections represent consensus Adj. EBITDA estimates as of July 17, 2023.
Unaffected Price
(5/17/2023)
Current Price
(7/17/2023)
Current
Offer Value
Implied Premium / (Discount) to: Reference Price:
Unaffected Closing Price $15.56 - 27.3% 28.5%
Unaffected 10-Trading Day VWAP 16.97 (8.3%) 16.8% 17.9%
Unaffected 30-Trading Day VWAP 17.10 (9.0%) 15.9% 17.0%
Unaffected 60-Trading Day VWAP 16.96 (8.3%) 16.8% 17.9%
Implied Equity Value1 $1,973 $2,512 $2,536
Net Cash (3/31/2023) (358) (358) (358)
Implied Enterprise Value $1,615 $2,154 $2,178
Implied EV / Adj. EBITDA (Consensus) Adj. EBITDA:2
2023E $204 7.9x 10.5x 10.7x
2024E 220 7.3x 9.8x 9.9x
Implied EV / Adj. EBITDA (Management) Adj. EBITDA:
2023E $220 7.3x 9.8x 9.9x
2024E 242 6.7x 8.9x 9.0x
$15.56
$19.81 $20.00
On May 18, 2023, Cobalt submitted to the Sapphire Board of Directors and concurrently publicly announced a new proposal for Cobalt to
acquire the 17% equity interest in Sapphire that it does not currently own for $20.00 per share in cash
• Proposal conditioned upon approval of special committee of independent directors; not conditioned upon approval of independent
shareholders
1 |
| Privileged & Confidential
Preliminary Analysis; to be Further Diligenced and Refined
6
8
10
12
14
16
18
20
22
$24
Jan-22 Apr-22 Jul-22 Oct-22 Feb-23 May-23
Sapphire Social Casino Peers Other Interactive Entertainment Players
6
8
10
12
14
16
18
20
22
$24
17-May 29-May 10-Jun 22-Jun 4-Jul 17-Jul
PRESENTATION TO THE SPECIAL COMMITTEE SITUATION UPDATE
Sapphire Trading Statistics:
Unaffected
(5/17/2023)
Current
(7/17/2023)
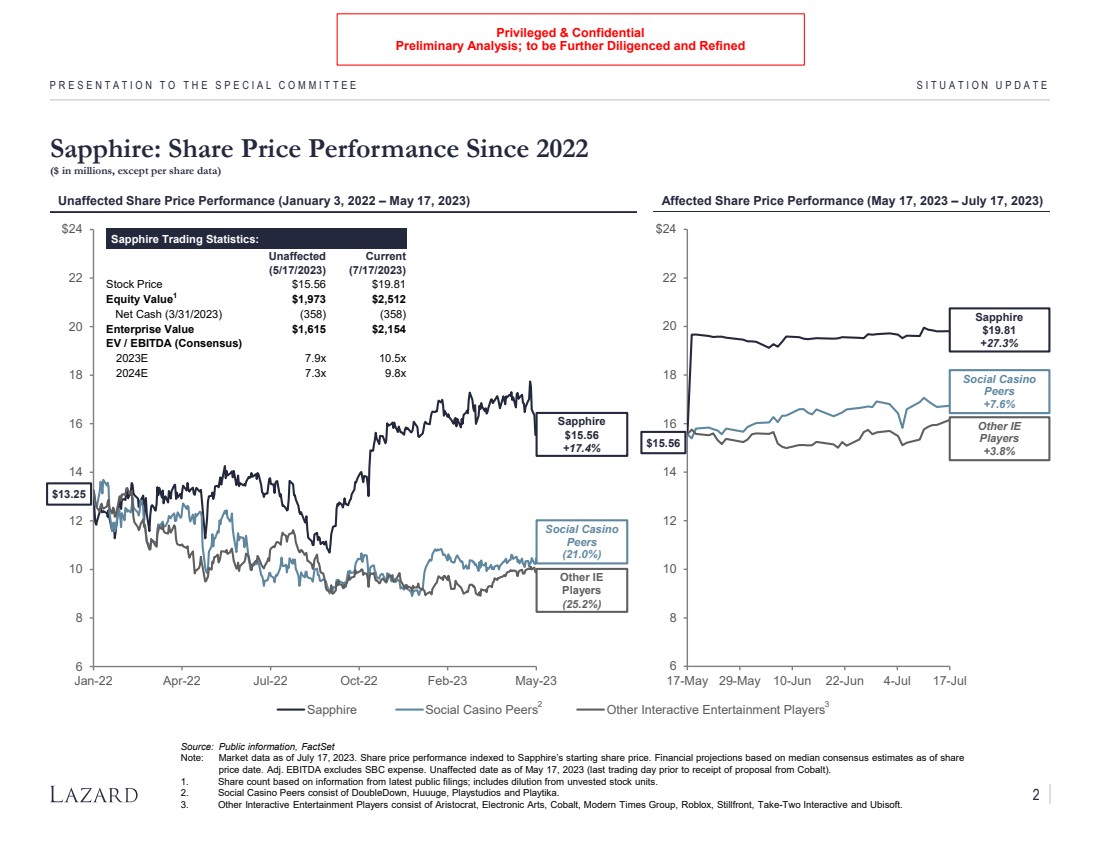
Stock Price $15.56 $19.81
Equity Value1 $1,973 $2,512
Net Cash (3/31/2023) (358) (358)
Enterprise Value $1,615 $2,154
EV / EBITDA (Consensus)
2023E 7.9x 10.5x
2024E 7.3x 9.8x
Unaffected Share Price Performance (January 3, 2022 – May 17, 2023)
2
Sapphire
$15.56
+17.4%
Social Casino
Peers
(21.0%)
Source: Public information, FactSet
Note: Market data as of July 17, 2023. Share price performance indexed to Sapphire’s starting share price. Financial projections based on median consensus estimates as of share
price date. Adj. EBITDA excludes SBC expense. Unaffected date as of May 17, 2023 (last trading day prior to receipt of proposal from Cobalt).
1. Share count based on information from latest public filings; includes dilution from unvested stock units.
2. Social Casino Peers consist of DoubleDown, Huuuge, Playstudios and Playtika.
3. Other Interactive Entertainment Players consist of Aristocrat, Electronic Arts, Cobalt, Modern Times Group, Roblox, Stillfront, Take-Two Interactive and Ubisoft.
Sapphire: Share Price Performance Since 2022
($ in millions, except per share data)
Affected Share Price Performance (May 17, 2023 – July 17, 2023)
$15.56
$13.25
Sapphire
$19.81
+27.3%
Social Casino
Peers
+7.6%
Other IE
Players
(25.2%)
Other IE
Players
+3.8%
3
2 |
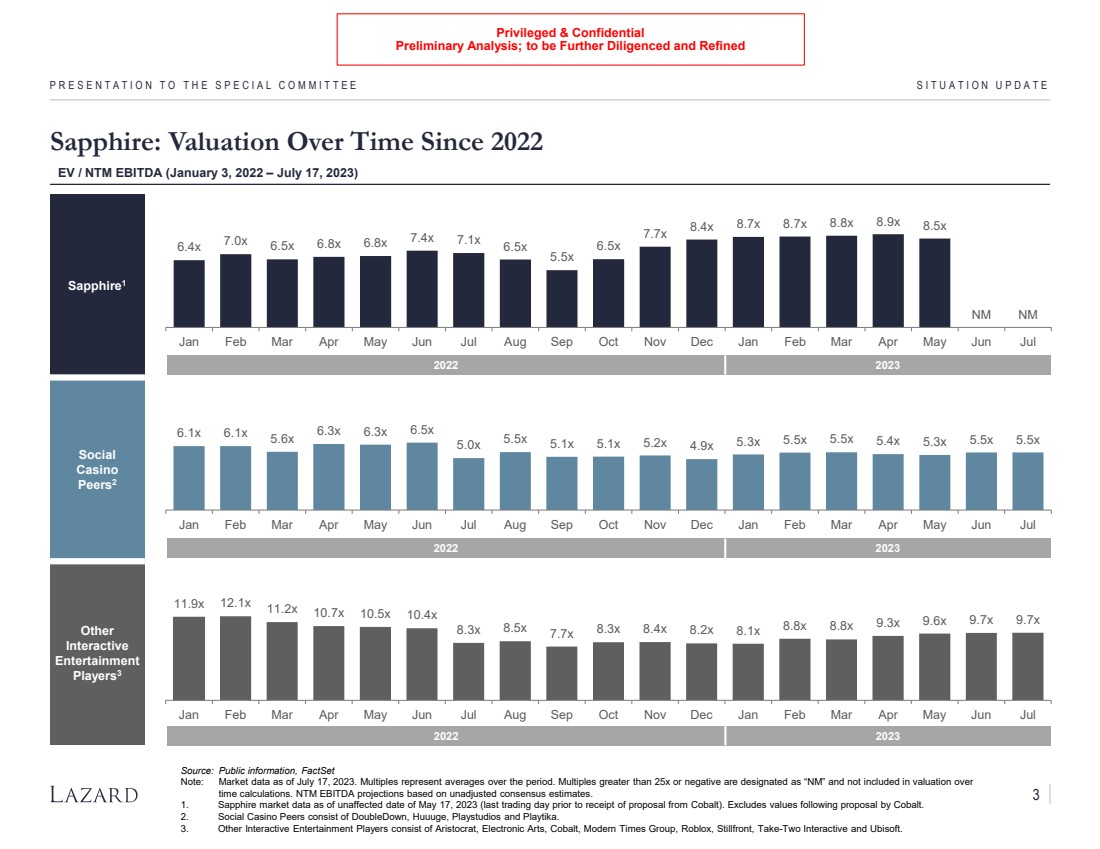
| Privileged & Confidential
Preliminary Analysis; to be Further Diligenced and Refined
Sapphire1
Social
Casino
Peers2
Other
Interactive
Entertainment
Players3
6.4x 7.0x 6.5x 6.8x 6.8x 7.4x 7.1x 6.5x
5.5x
6.5x
7.7x 8.4x 8.7x 8.7x 8.8x 8.9x 8.5x
NM NM
Jan Feb Mar Apr May Jun Jul Aug Sep Oct Nov Dec Jan Feb Mar Apr May Jun Jul
Sapphire: Valuation Over Time Since 2022
PRESENTATION TO THE SPECIAL COMMITTEE SITUATION UPDATE
EV / NTM EBITDA (January 3, 2022 – July 17, 2023)
Source: Public information, FactSet
Note: Market data as of July 17, 2023. Multiples represent averages over the period. Multiples greater than 25x or negative are designated as “NM” and not included in valuation over
time calculations. NTM EBITDA projections based on unadjusted consensus estimates.
1. Sapphire market data as of unaffected date of May 17, 2023 (last trading day prior to receipt of proposal from Cobalt). Excludes values following proposal by Cobalt.
2. Social Casino Peers consist of DoubleDown, Huuuge, Playstudios and Playtika.
3. Other Interactive Entertainment Players consist of Aristocrat, Electronic Arts, Cobalt, Modern Times Group, Roblox, Stillfront, Take-Two Interactive and Ubisoft.
2022 2023
2022 2023
2022 2023
11.9x 12.1x 11.2x 10.7x 10.5x 10.4x
8.3x 8.5x 7.7x 8.3x 8.4x 8.2x 8.1x 8.8x 8.8x 9.3x 9.6x 9.7x 9.7x
Jan Feb Mar Apr May Jun Jul Aug Sep Oct Nov Dec Jan Feb Mar Apr May Jun Jul
6.1x 6.1x 5.6x 6.3x 6.3x 6.5x
5.0x 5.5x 5.1x 5.1x 5.2x 4.9x 5.3x 5.5x 5.5x 5.4x 5.3x 5.5x 5.5x
Jan Feb Mar Apr May Jun Jul Aug Sep Oct Nov Dec Jan Feb Mar Apr May Jun Jul
3 |
| Privileged & Confidential
Preliminary Analysis; to be Further Diligenced and Refined
CONFIDENTIAL
Preliminary Financial Analysis
PRESENTATION TO THE SPECIAL COMMITTEE |
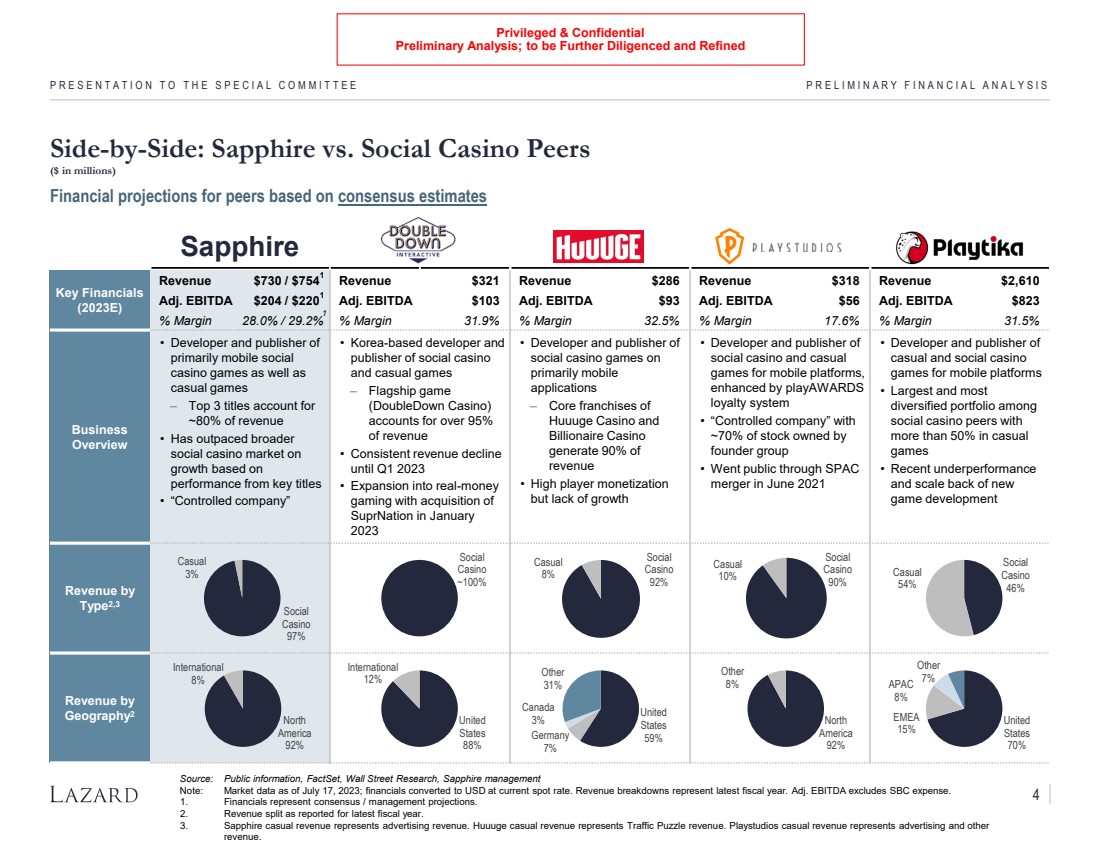
| Privileged & Confidential
Preliminary Analysis; to be Further Diligenced and Refined
Sapphire
Key Financials
(2023E)
Revenue $730 / $754 Revenue $321 Revenue $286 Revenue $318 Revenue $2,610
Adj. EBITDA $204 / $220 Adj. EBITDA $103 Adj. EBITDA $93 Adj. EBITDA $56 Adj. EBITDA $823
% Margin 28.0% / 29.2% % Margin 31.9% % Margin 32.5% % Margin 17.6% % Margin 31.5%
Business
Overview
• Developer and publisher of
primarily mobile social
casino games as well as
casual games
‒ Top 3 titles account for
~80% of revenue
• Has outpaced broader
social casino market on
growth based on
performance from key titles
• “Controlled company”
• Korea-based developer and
publisher of social casino
and casual games
‒ Flagship game
(DoubleDown Casino)
accounts for over 95%
of revenue
• Consistent revenue decline
until Q1 2023
• Expansion into real-money
gaming with acquisition of
SuprNation in January
2023
• Developer and publisher of
social casino games on
primarily mobile
applications
‒ Core franchises of
Huuuge Casino and
Billionaire Casino
generate 90% of
revenue
• High player monetization
but lack of growth
• Developer and publisher of
social casino and casual
games for mobile platforms,
enhanced by playAWARDS
loyalty system
• “Controlled company” with
~70% of stock owned by
founder group
• Went public through SPAC
merger in June 2021
• Developer and publisher of
casual and social casino
games for mobile platforms
• Largest and most
diversified portfolio among
social casino peers with
more than 50% in casual
games
• Recent underperformance
and scale back of new
game development
Revenue by
Type2,3
Revenue by
Geography2
Side-by-Side: Sapphire vs. Social Casino Peers
($ in millions)
PRESENTATION TO THE SPECIAL COMMITTEE PRELIMINARY FINANCIAL ANALYSIS
Source: Public information, FactSet, Wall Street Research, Sapphire management
Note: Market data as of July 17, 2023; financials converted to USD at current spot rate. Revenue breakdowns represent latest fiscal year. Adj. EBITDA excludes SBC expense.
1. Financials represent consensus / management projections.
2. Revenue split as reported for latest fiscal year.
3. Sapphire casual revenue represents advertising revenue. Huuuge casual revenue represents Traffic Puzzle revenue. Playstudios casual revenue represents advertising and other
revenue.
Financial projections for peers based on consensus estimates
North
America
92%
International
8%
Social
Casino
97%
Casual
3%
United
States
Germany 59%
7%
Canada
3%
Other
31%
Social
Casino
92%
Casual
8%
North
America
92%
Other
8%
Social
Casino
90%
Casual
10%
United
States
70%
EMEA
15%
APAC
8%
Other
7%
Social
Casino
46%
Casual
54%
United
States
88%
International
12%
Social
Casino
~100%
1
1
1
4 |
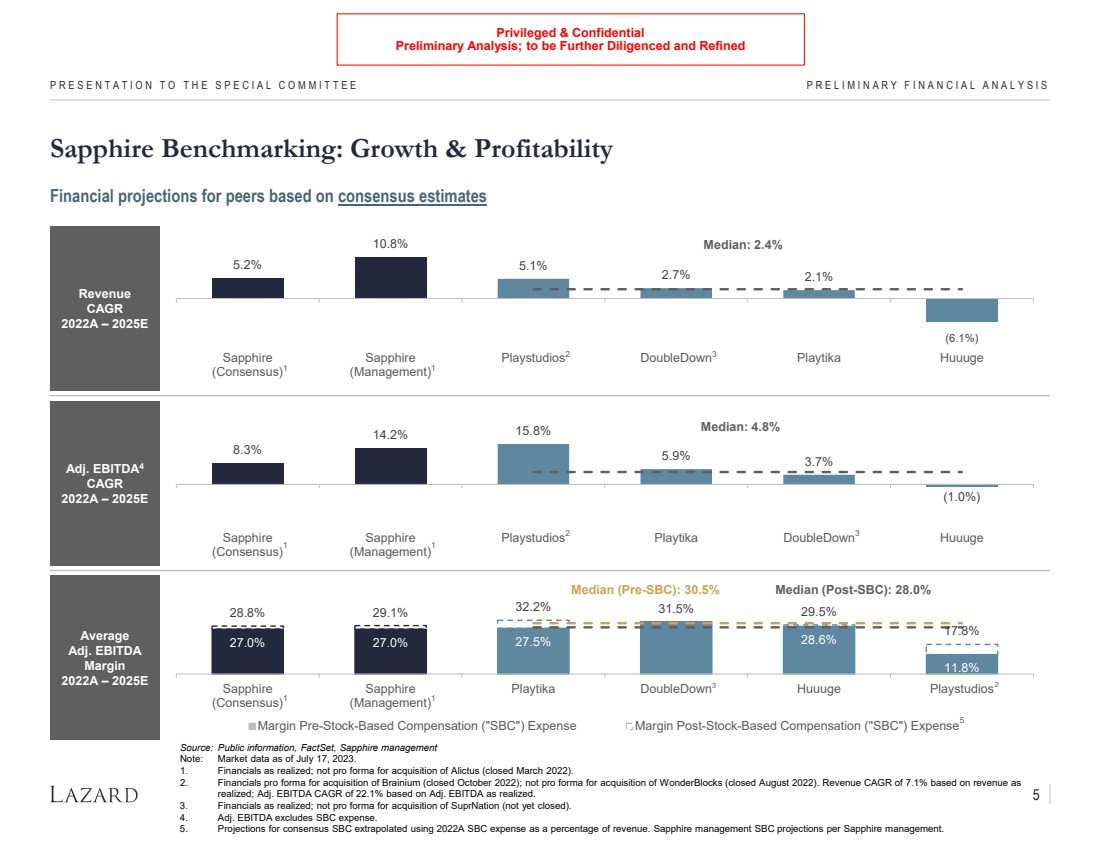
| Privileged & Confidential
Preliminary Analysis; to be Further Diligenced and Refined
Revenue
CAGR
2022A – 2025E
Adj. EBITDA4
CAGR
2022A – 2025E
Average
Adj. EBITDA
Margin
2022A – 2025E
(6.1%)
5.2%
10.8%
5.1% 2.7% 2.1%
Median: 2.4%
Sapphire
(Consensus)
Sapphire
(Management)
Playstudios DoubleDown Playtika Huuuge
Sapphire Benchmarking: Growth & Profitability
PRESENTATION TO THE SPECIAL COMMITTEE PRELIMINARY FINANCIAL ANALYSIS
Source: Public information, FactSet, Sapphire management
Note: Market data as of July 17, 2023.
1. Financials as realized; not pro forma for acquisition of Alictus (closed March 2022).
2. Financials pro forma for acquisition of Brainium (closed October 2022); not pro forma for acquisition of WonderBlocks (closed August 2022). Revenue CAGR of 7.1% based on revenue as
realized; Adj. EBITDA CAGR of 22.1% based on Adj. EBITDA as realized.
3. Financials as realized; not pro forma for acquisition of SuprNation (not yet closed).
4. Adj. EBITDA excludes SBC expense.
5. Projections for consensus SBC extrapolated using 2022A SBC expense as a percentage of revenue. Sapphire management SBC projections per Sapphire management.
Financial projections for peers based on consensus estimates
2
1
3
(1.0%)
8.3%
14.2% 15.8%
5.9% 3.7%
Median: 4.8%
Sapphire
(Consensus)
Sapphire
(Management)
Playstudios Playtika DoubleDown Huuuge 2 3
27.0% 27.0% 27.5% 28.6%
11.8%
28.8% 29.1% 32.2% 31.5% 29.5%
17.8%
Median (Pre-SBC): 30.5% Median (Post-SBC): 28.0%
Sapphire
(Consensus)
Sapphire
(Management)
Playtika DoubleDown Huuuge Playstudios
Margin Pre-Stock-Based Compensation ("SBC") Expense Margin Post-Stock-Based Compensation ("SBC") Expense
3 2
1
1 1
1 1
5
5 |
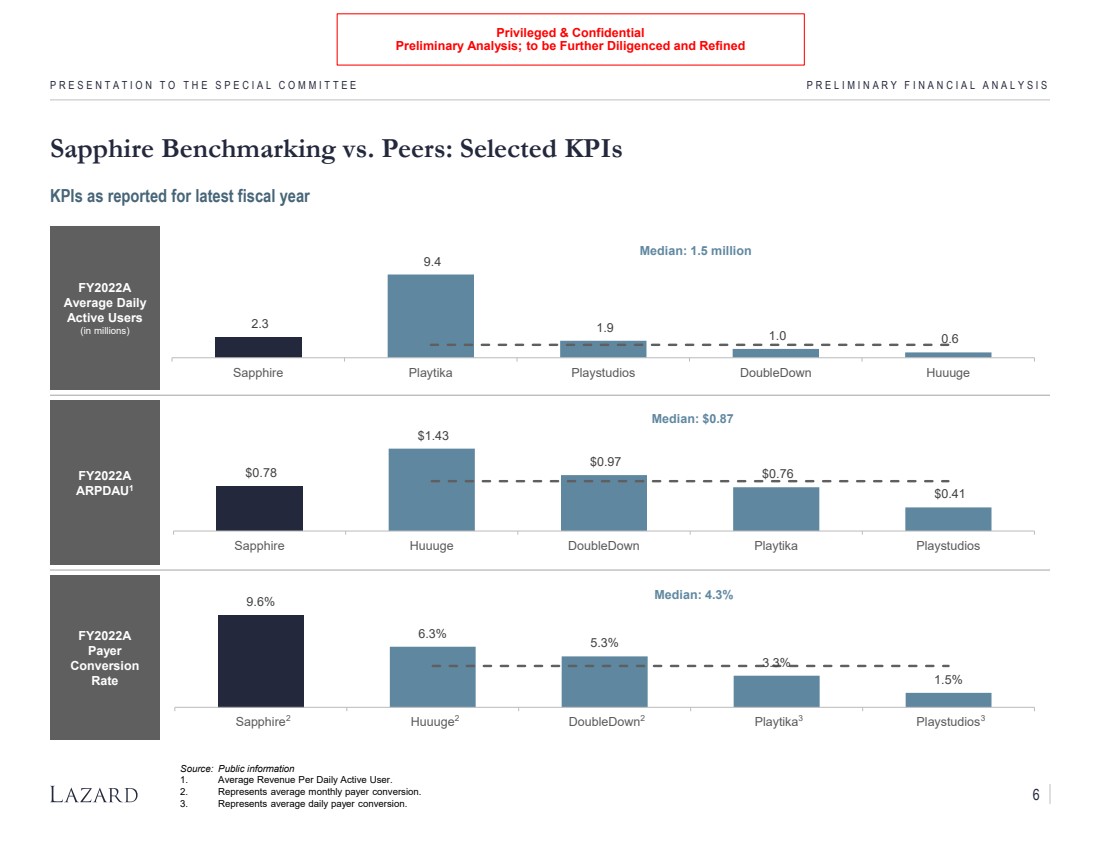
| Privileged & Confidential
Preliminary Analysis; to be Further Diligenced and Refined
Social Casino Peers
FY2022A
Average Daily
Active Users
(in millions)
FY2022A
ARPDAU1
FY2022A
Payer
Conversion
Rate
9.6%
6.3%
5.3%
3.3%
1.5%
Median: 4.3%
Sapphire Huuuge DoubleDown Playtika Playstudios
$0.78
$1.43
$0.97
$0.76
$0.41
Median: $0.87
Sapphire Huuuge DoubleDown Playtika Playstudios
Sapphire Benchmarking vs. Peers: Selected KPIs
PRESENTATION TO THE SPECIAL COMMITTEE PRELIMINARY FINANCIAL ANALYSIS
Source: Public information
1. Average Revenue Per Daily Active User.
2. Represents average monthly payer conversion.
3. Represents average daily payer conversion.
2.3
9.4
1.9 1.0 0.6
Median: 1.5 million
Sapphire Playtika Playstudios DoubleDown Huuuge
KPIs as reported for latest fiscal year
2 2 2 3 3
6 |

| Privileged & Confidential
Preliminary Analysis; to be Further Diligenced and Refined
Social Casino Peers
EV / Revenue
2023E 2024E
Equity
Value $1,973 $4,790 $722 $490 $468
Enterprise
Value $1,615 $6,390 $594 $265 $201
2.1x 1.9x
2.4x
1.8x
1.0x
0.6x
Median: 1.4x
Sapphire
(Consensus)
Sapphire
(Management)
Playtika Playstudios Huuuge DoubleDown
Sapphire Benchmarking vs. Peers: Valuation (EV / Revenue)
PRESENTATION TO THE SPECIAL COMMITTEE PRELIMINARY FINANCIAL ANALYSIS
Source: Public information, FactSet, Sapphire management
Note: Sapphire valuation as of unaffected date of May 17, 2023 (last trading day prior to receipt of proposal from Cobalt); peer valuation as of July 17, 2023. Balance sheet and share count
data based on public information. Equity value calculations include dilution from outstanding options and unvested stock units.
2.2x 2.1x
2.4x
1.9x
0.9x
0.6x
Median: 1.4x
Sapphire
(Consensus)
Sapphire
(Management)
Playtika Playstudios Huuuge DoubleDown
Financial projections for peers based on consensus estimates
7 |

| Privileged & Confidential
Preliminary Analysis; to be Further Diligenced and Refined
Social Casino Peers
EV / Adj. EBITDA (Pre-SBC)
2023E 2024E
EV / Adj. EBITDA (Post-SBC)1
2023E 2024E
Equity
Value $1,973 $722 $4,790 $490 $468
Enterprise
Value $1,615 $594 $6,390 $265 $201
7.8x 7.2x
13.3x
8.6x
3.4x 2.0x
Median: 6.0x
Sapphire
(Consensus)
Sapphire
(Management)
Playstudios Playtika Huuuge DoubleDown
8.4x 8.0x
16.3x
9.1x
2.9x 2.0x
Median: 6.0x
Sapphire
(Consensus)
Sapphire
(Management)
Playstudios Playtika Huuuge DoubleDown
Sapphire Benchmarking vs. Peers: Valuation (EV / Adj. EBITDA)
PRESENTATION TO THE SPECIAL COMMITTEE PRELIMINARY FINANCIAL ANALYSIS
Source: Public information, FactSet, Sapphire management
Note: Sapphire valuation as of unaffected date of May 17, 2023 (last trading day prior to receipt of proposal from Cobalt); peer valuation as of July 17, 2023. Balance sheet and share count
data based on public information. Equity value calculations include dilution from outstanding options and unvested stock units.
1. Projections for consensus SBC extrapolated using 2022A SBC expense as a percentage of revenue. Sapphire management SBC projections per Sapphire management.
Financial projections for peers based on consensus estimates
7.3x 6.7x
9.1x 7.4x
3.3x 2.0x
Median: 5.3x
Sapphire
(Consensus)
Sapphire
(Management)
Playstudios Playtika Huuuge DoubleDown
7.9x 7.3x
10.6x
7.8x
2.9x 2.0x
Median: 5.3x
Sapphire
(Consensus)
Sapphire
(Management)
Playstudios Playtika Huuuge DoubleDown
Sapphire and social casino peers trade on EV / Adj. EBITDA (pre-SBC) basis
8 |
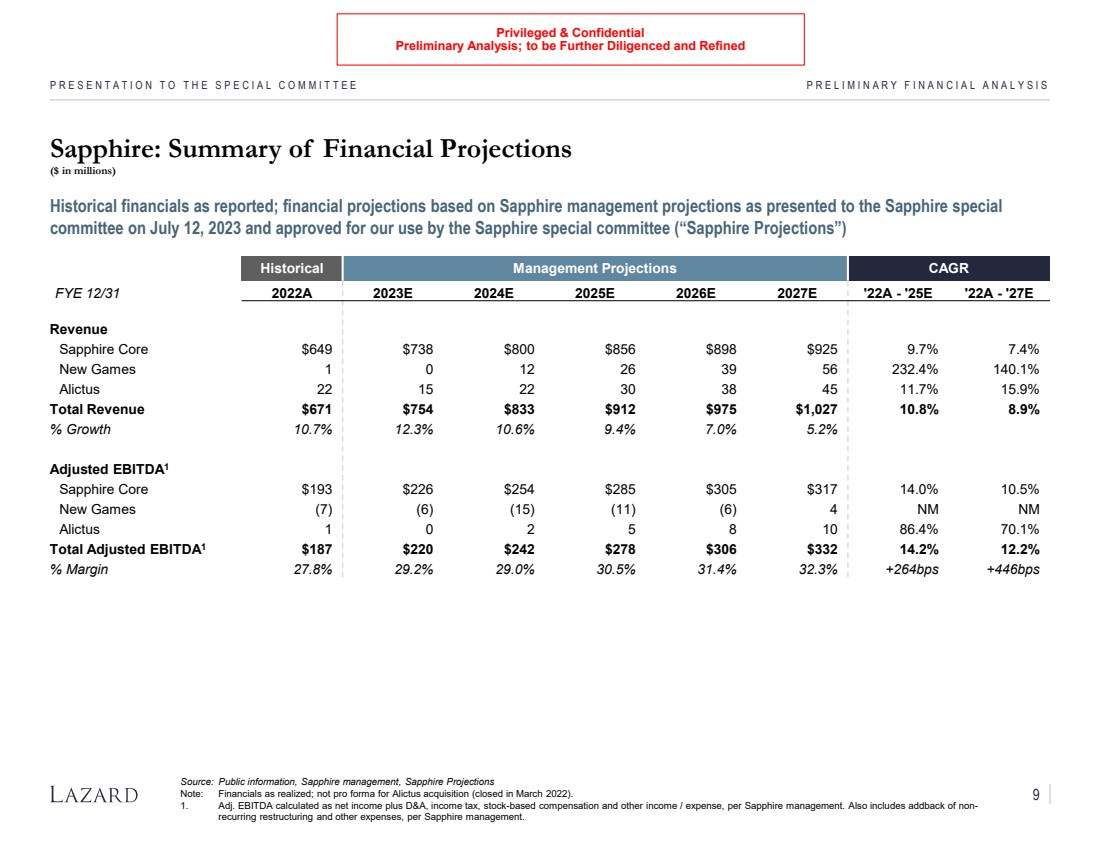
| Privileged & Confidential
Preliminary Analysis; to be Further Diligenced and Refined
PRESENTATION TO THE SPECIAL COMMITTEE PRELIMINARY FINANCIAL ANALYSIS
Sapphire: Summary of Financial Projections
($ in millions)
Source: Public information, Sapphire management, Sapphire Projections
Note: Financials as realized; not pro forma for Alictus acquisition (closed in March 2022).
1. Adj. EBITDA calculated as net income plus D&A, income tax, stock-based compensation and other income / expense, per Sapphire management. Also includes addback of non-recurring restructuring and other expenses, per Sapphire management.
Historical financials as reported; financial projections based on Sapphire management projections as presented to the Sapphire special
committee on July 12, 2023 and approved for our use by the Sapphire special committee (“Sapphire Projections”)
Historical Management Projections CAGR
FYE 12/31 2022A 2023E 2024E 2025E 2026E 2027E '22A - '25E '22A - '27E
Revenue
Sapphire Core $649 $738 $800 $856 $898 $925 9.7% 7.4%
New Games 1 0 12 26 39 56 232.4% 140.1%
Alictus 22 15 22 30 38 45 11.7% 15.9%
Total Revenue $671 $754 $833 $912 $975 $1,027 10.8% 8.9%
% Growth 10.7% 12.3% 10.6% 9.4% 7.0% 5.2%
Adjusted EBITDA1
Sapphire Core $193 $226 $254 $285 $305 $317 14.0% 10.5%
New Games (7) (6) (15) (11) (6) 4 NM NM
Alictus 1 0 2 5 8 10 86.4% 70.1%
Total Adjusted EBITDA1 $187 $220 $242 $278 $306 $332 14.2% 12.2%
% Margin 27.8% 29.2% 29.0% 30.5% 31.4% 32.3% +264bps +446bps
9 |
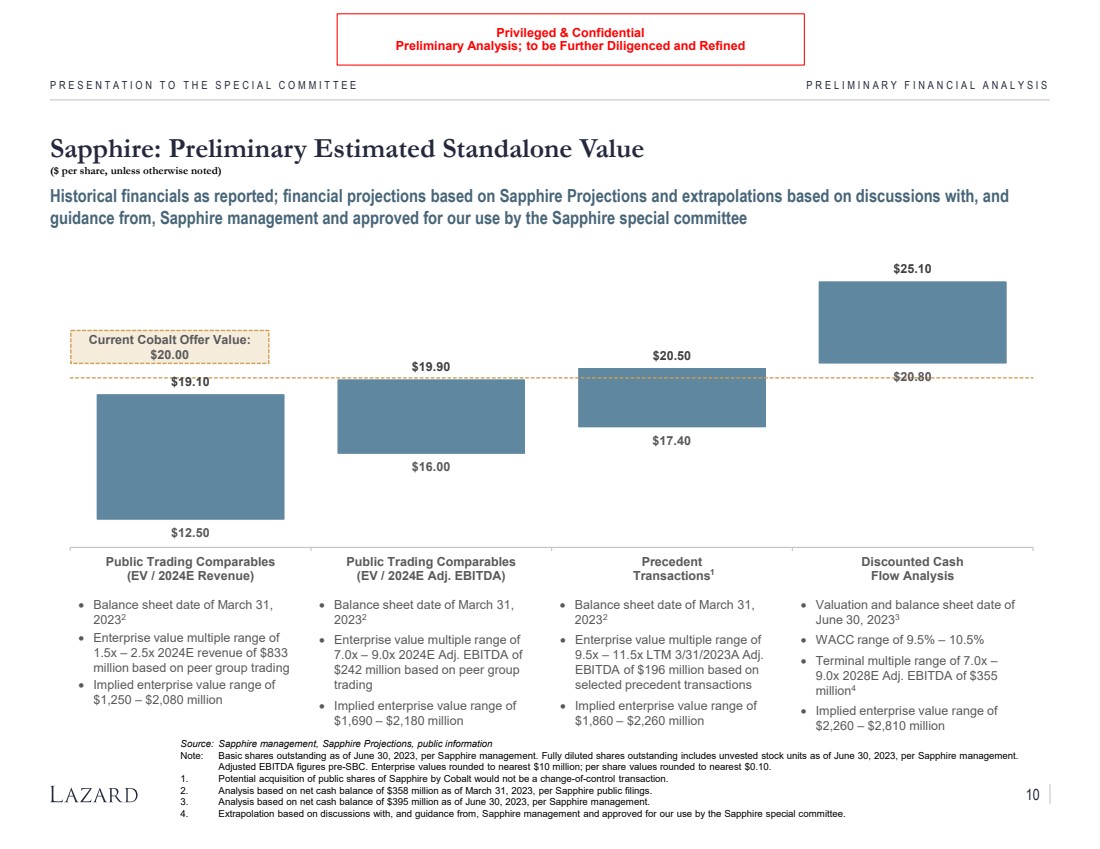
| Privileged & Confidential
Preliminary Analysis; to be Further Diligenced and Refined
Sapphire: Preliminary Estimated Standalone Value
($ per share, unless otherwise noted)
PRESENTATION TO THE SPECIAL COMMITTEE PRELIMINARY FINANCIAL ANALYSIS
Historical financials as reported; financial projections based on Sapphire Projections and extrapolations based on discussions with, and
guidance from, Sapphire management and approved for our use by the Sapphire special committee
$12.50
$16.00
$17.40
$20.80 $19.10
$19.90
$20.50
$25.10
Current Cobalt Offer Value:
$20.00
Public Trading Comparables
(EV / 2024E Revenue)
Public Trading Comparables
(EV / 2024E Adj. EBITDA)
Precedent
Transactions
Discounted Cash
Flow Analysis
Source: Sapphire management, Sapphire Projections, public information
Note: Basic shares outstanding as of June 30, 2023, per Sapphire management. Fully diluted shares outstanding includes unvested stock units as of June 30, 2023, per Sapphire management.
Adjusted EBITDA figures pre-SBC. Enterprise values rounded to nearest $10 million; per share values rounded to nearest $0.10.
1. Potential acquisition of public shares of Sapphire by Cobalt would not be a change-of-control transaction.
2. Analysis based on net cash balance of $358 million as of March 31, 2023, per Sapphire public filings.
3. Analysis based on net cash balance of $395 million as of June 30, 2023, per Sapphire management.
4. Extrapolation based on discussions with, and guidance from, Sapphire management and approved for our use by the Sapphire special committee.
• Balance sheet date of March 31,
20232
• Enterprise value multiple range of
1.5x – 2.5x 2024E revenue of $833
million based on peer group trading
• Implied enterprise value range of
$1,250 – $2,080 million
• Balance sheet date of March 31,
20232
• Enterprise value multiple range of
7.0x – 9.0x 2024E Adj. EBITDA of
$242 million based on peer group
trading
• Implied enterprise value range of
$1,690 – $2,180 million
• Balance sheet date of March 31,
20232
• Enterprise value multiple range of
9.5x – 11.5x LTM 3/31/2023A Adj.
EBITDA of $196 million based on
selected precedent transactions
• Implied enterprise value range of
$1,860 – $2,260 million
• Valuation and balance sheet date of
June 30, 20233
• WACC range of 9.5% – 10.5%
• Terminal multiple range of 7.0x –
9.0x 2028E Adj. EBITDA of $355
million4
• Implied enterprise value range of
$2,260 – $2,810 million
1
10 |
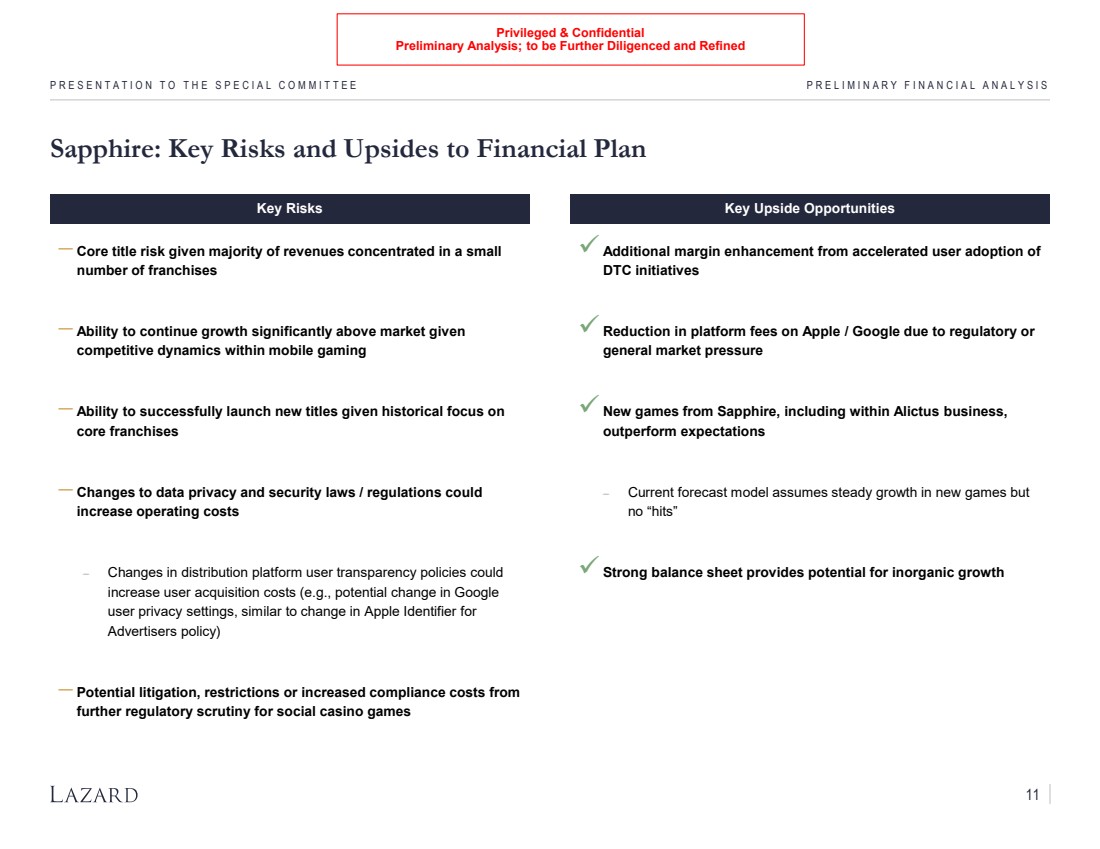
| Privileged & Confidential
Preliminary Analysis; to be Further Diligenced and Refined
Sapphire: Key Risks and Upsides to Financial Plan
PRESENTATION TO THE SPECIAL COMMITTEE PRELIMINARY FINANCIAL ANALYSIS
Key Risks Key Upside Opportunities
Additional margin enhancement from accelerated user adoption of
DTC initiatives
Reduction in platform fees on Apple / Google due to regulatory or
general market pressure
New games from Sapphire, including within Alictus business,
outperform expectations
− Current forecast model assumes steady growth in new games but
no “hits”
Strong balance sheet provides potential for inorganic growth
− Core title risk given majority of revenues concentrated in a small
number of franchises
− Ability to continue growth significantly above market given
competitive dynamics within mobile gaming
− Ability to successfully launch new titles given historical focus on
core franchises
− Changes to data privacy and security laws / regulations could
increase operating costs
− Changes in distribution platform user transparency policies could
increase user acquisition costs (e.g., potential change in Google
user privacy settings, similar to change in Apple Identifier for
Advertisers policy)
− Potential litigation, restrictions or increased compliance costs from
further regulatory scrutiny for social casino games
11 |
| Privileged & Confidential
Preliminary Analysis; to be Further Diligenced and Refined
CONFIDENTIAL
Appendix
PRESENTATION TO THE SPECIAL COMMITTEE |
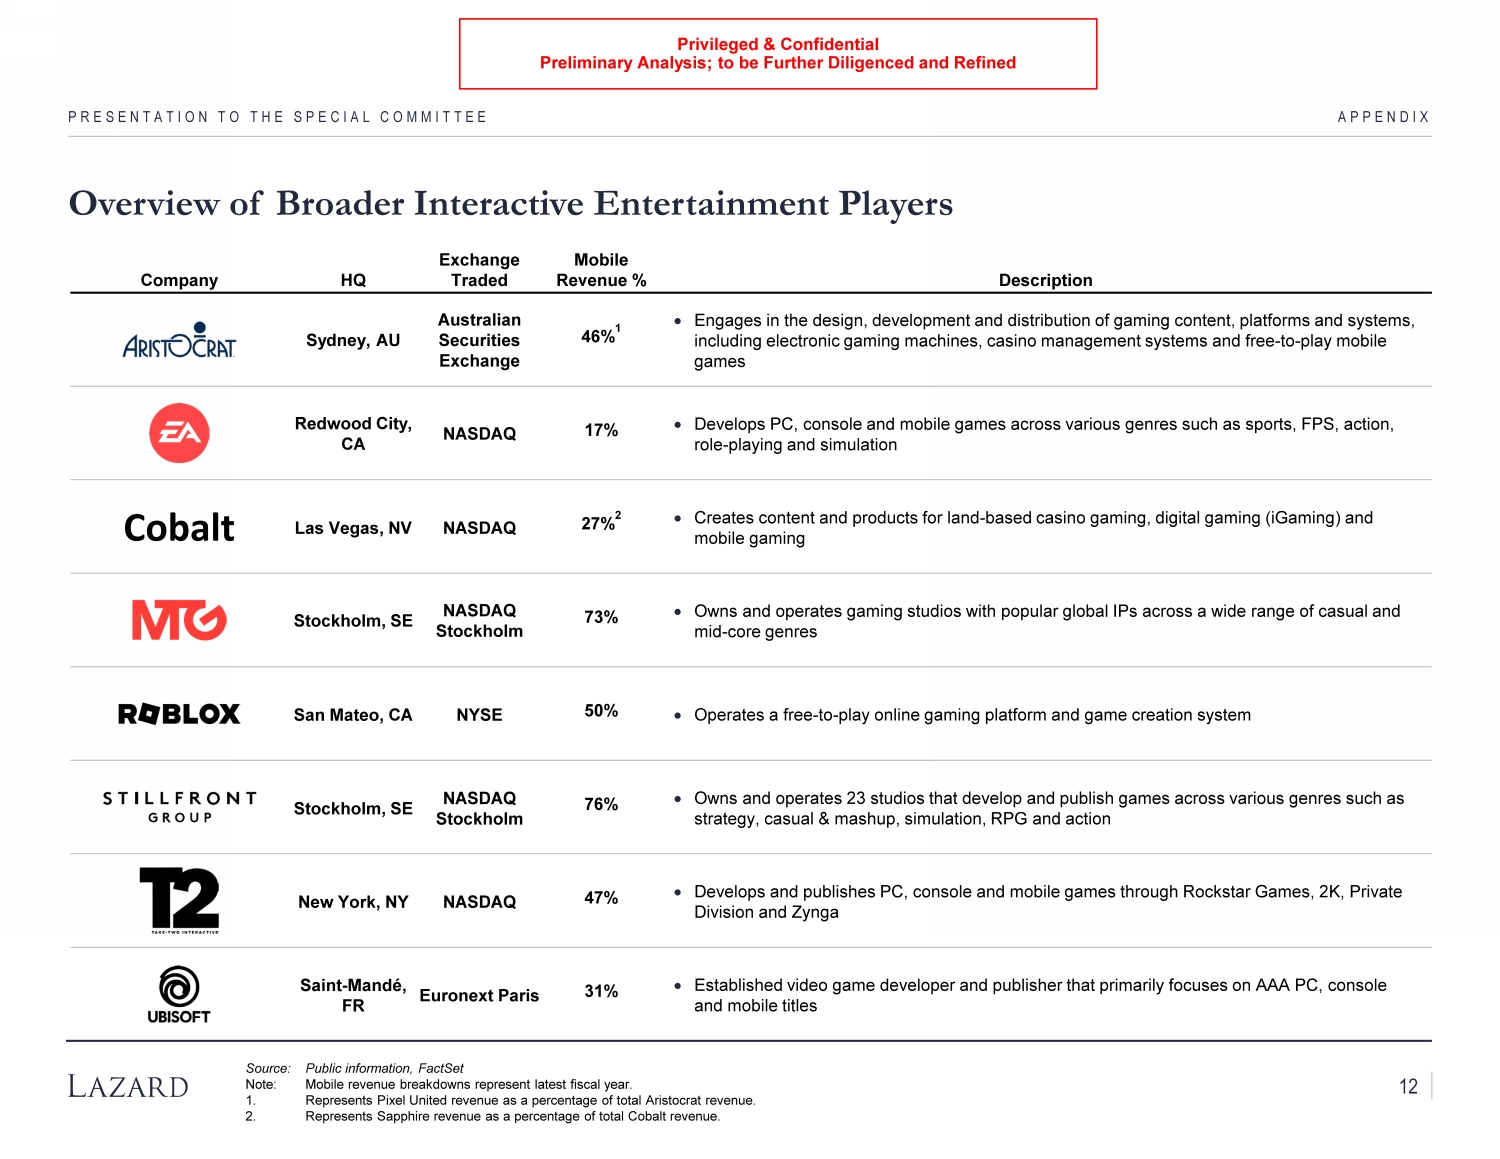
| Privileged & Confidential
Preliminary Analysis; to be Further Diligenced and Refined
Company HQ
Exchange
Traded
Mobile
Revenue % Description
Sydney, AU
Australian
Securities
Exchange
46%1 • Engages in the design, development and distribution of gaming content, platforms and systems,
including electronic gaming machines, casino management systems and free-to-play mobile
games
Redwood City,
CA NASDAQ 17% • Develops PC, console and mobile games across various genres such as sports, FPS, action,
role-playing and simulation
Cobalt Las Vegas, NV NASDAQ 27%2 • Creates content and products for land-based casino gaming, digital gaming (iGaming) and
mobile gaming
Stockholm, SE NASDAQ
Stockholm
73% • Owns and operates gaming studios with popular global IPs across a wide range of casual and
mid-core genres
San Mateo, CA NYSE 50% • Operates a free-to-play online gaming platform and game creation system
Stockholm, SE NASDAQ
Stockholm
76% • Owns and operates 23 studios that develop and publish games across various genres such as
strategy, casual & mashup, simulation, RPG and action
New York, NY NASDAQ 47% • Develops and publishes PC, console and mobile games through Rockstar Games, 2K, Private
Division and Zynga
Saint-Mandé,
FR Euronext Paris 31% • Established video game developer and publisher that primarily focuses on AAA PC, console
and mobile titles
PRESENTATION TO THE SPECIAL COMMITTEE APPENDIX
Overview of Broader Interactive Entertainment Players
Source: Public information, FactSet
Note: Mobile revenue breakdowns represent latest fiscal year.
1. Represents Pixel United revenue as a percentage of total Aristocrat revenue.
2. Represents Sapphire revenue as a percentage of total Cobalt revenue.
12 |
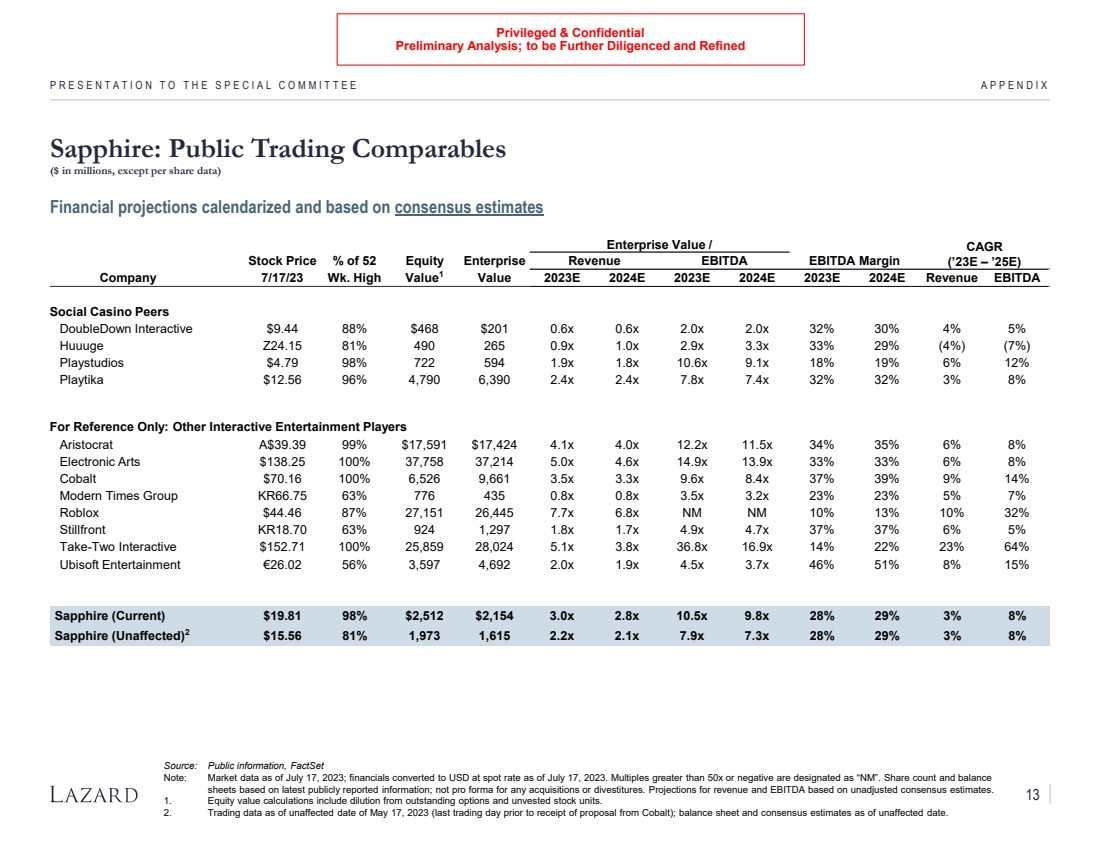
| Privileged & Confidential
Preliminary Analysis; to be Further Diligenced and Refined
Enterprise Value / CAGR
Stock Price % of 52 Equity Enterprise Revenue EBITDA EBITDA Margin (’23E – ’25E)
Company 7/17/23 Wk. High Value1 Value 2023E 2024E 2023E 2024E 2023E 2024E Revenue EBITDA
Social Casino Peers
DoubleDown Interactive $9.44 88% $468 $201 0.6x 0.6x 2.0x 2.0x 32% 30% 4% 5%
Huuuge Z24.15 81% 490 265 0.9x 1.0x 2.9x 3.3x 33% 29% (4%) (7%)
Playstudios $4.79 98% 722 594 1.9x 1.8x 10.6x 9.1x 18% 19% 6% 12%
Playtika $12.56 96% 4,790 6,390 2.4x 2.4x 7.8x 7.4x 32% 32% 3% 8%
For Reference Only: Other Interactive Entertainment Players
Aristocrat A$39.39 99% $17,591 $17,424 4.1x 4.0x 12.2x 11.5x 34% 35% 6% 8%
Electronic Arts $138.25 100% 37,758 37,214 5.0x 4.6x 14.9x 13.9x 33% 33% 6% 8%
Cobalt $70.16 100% 6,526 9,661 3.5x 3.3x 9.6x 8.4x 37% 39% 9% 14%
Modern Times Group KR66.75 63% 776 435 0.8x 0.8x 3.5x 3.2x 23% 23% 5% 7%
Roblox $44.46 87% 27,151 26,445 7.7x 6.8x NM NM 10% 13% 10% 32%
Stillfront KR18.70 63% 924 1,297 1.8x 1.7x 4.9x 4.7x 37% 37% 6% 5%
Take-Two Interactive $152.71 100% 25,859 28,024 5.1x 3.8x 36.8x 16.9x 14% 22% 23% 64%
Ubisoft Entertainment €26.02 56% 3,597 4,692 2.0x 1.9x 4.5x 3.7x 46% 51% 8% 15%
Sapphire (Current) $19.81 98% $2,512 $2,154 3.0x 2.8x 10.5x 9.8x 28% 29% 3% 8%
Sapphire (Unaffected)2 $15.56 81% 1,973 1,615 2.2x 2.1x 7.9x 7.3x 28% 29% 3% 8%
Sapphire: Public Trading Comparables
($ in millions, except per share data)
PRESENTATION TO THE SPECIAL COMMITTEE APPENDIX
Source: Public information, FactSet
Note: Market data as of July 17, 2023; financials converted to USD at spot rate as of July 17, 2023. Multiples greater than 50x or negative are designated as “NM”. Share count and balance
sheets based on latest publicly reported information; not pro forma for any acquisitions or divestitures. Projections for revenue and EBITDA based on unadjusted consensus estimates.
1. Equity value calculations include dilution from outstanding options and unvested stock units.
2. Trading data as of unaffected date of May 17, 2023 (last trading day prior to receipt of proposal from Cobalt); balance sheet and consensus estimates as of unaffected date.
Financial projections calendarized and based on consensus estimates
13 |
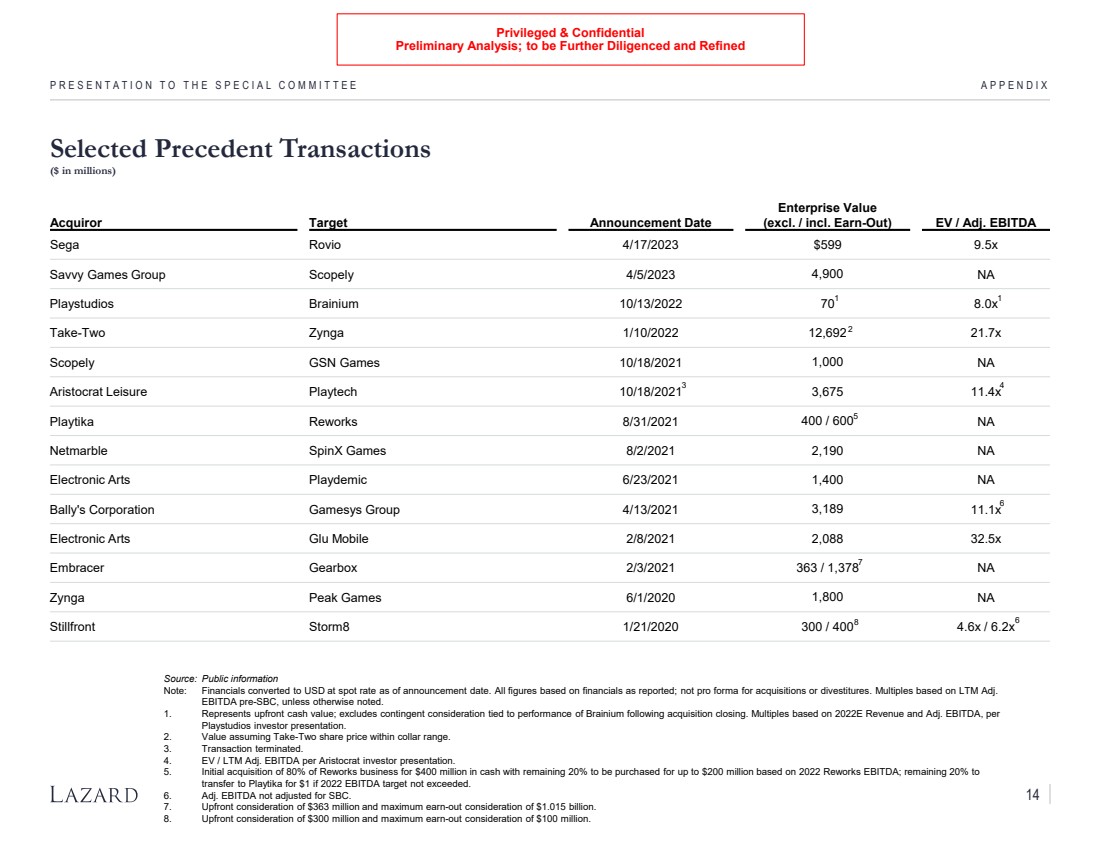
| Privileged & Confidential
Preliminary Analysis; to be Further Diligenced and Refined
Selected Precedent Transactions
($ in millions)
PRESENTATION TO THE SPECIAL COMMITTEE APPENDIX
Source: Public information
Note: Financials converted to USD at spot rate as of announcement date. All figures based on financials as reported; not pro forma for acquisitions or divestitures. Multiples based on LTM Adj.
EBITDA pre-SBC, unless otherwise noted.
1. Represents upfront cash value; excludes contingent consideration tied to performance of Brainium following acquisition closing. Multiples based on 2022E Revenue and Adj. EBITDA, per
Playstudios investor presentation.
2. Value assuming Take-Two share price within collar range.
3. Transaction terminated.
4. EV / LTM Adj. EBITDA per Aristocrat investor presentation.
5. Initial acquisition of 80% of Reworks business for $400 million in cash with remaining 20% to be purchased for up to $200 million based on 2022 Reworks EBITDA; remaining 20% to
transfer to Playtika for $1 if 2022 EBITDA target not exceeded.
6. Adj. EBITDA not adjusted for SBC.
7. Upfront consideration of $363 million and maximum earn-out consideration of $1.015 billion.
8. Upfront consideration of $300 million and maximum earn-out consideration of $100 million.
Acquiror Target Announcement Date
Enterprise Value
(excl. / incl. Earn-Out) EV / Adj. EBITDA
Sega Rovio 4/17/2023 $599 9.5x
Savvy Games Group Scopely 4/5/2023 4,900 NA
Playstudios Brainium 10/13/2022 70 8.0x
Take-Two Zynga 1/10/2022 12,692 21.7x
Scopely GSN Games 10/18/2021 1,000 NA
Aristocrat Leisure Playtech 10/18/2021 3,675 11.4x
Playtika Reworks 8/31/2021 400 / 600 NA
Netmarble SpinX Games 8/2/2021 2,190 NA
Electronic Arts Playdemic 6/23/2021 1,400 NA
Bally's Corporation Gamesys Group 4/13/2021 3,189 11.1x
Electronic Arts Glu Mobile 2/8/2021 2,088 32.5x
Embracer Gearbox 2/3/2021 363 / 1,378 NA
Zynga Peak Games 6/1/2020 1,800 NA
Stillfront Storm8 1/21/2020 300 / 400 4.6x / 6.2x
1 1
2
3
6
5
7
8 6
4
14 |
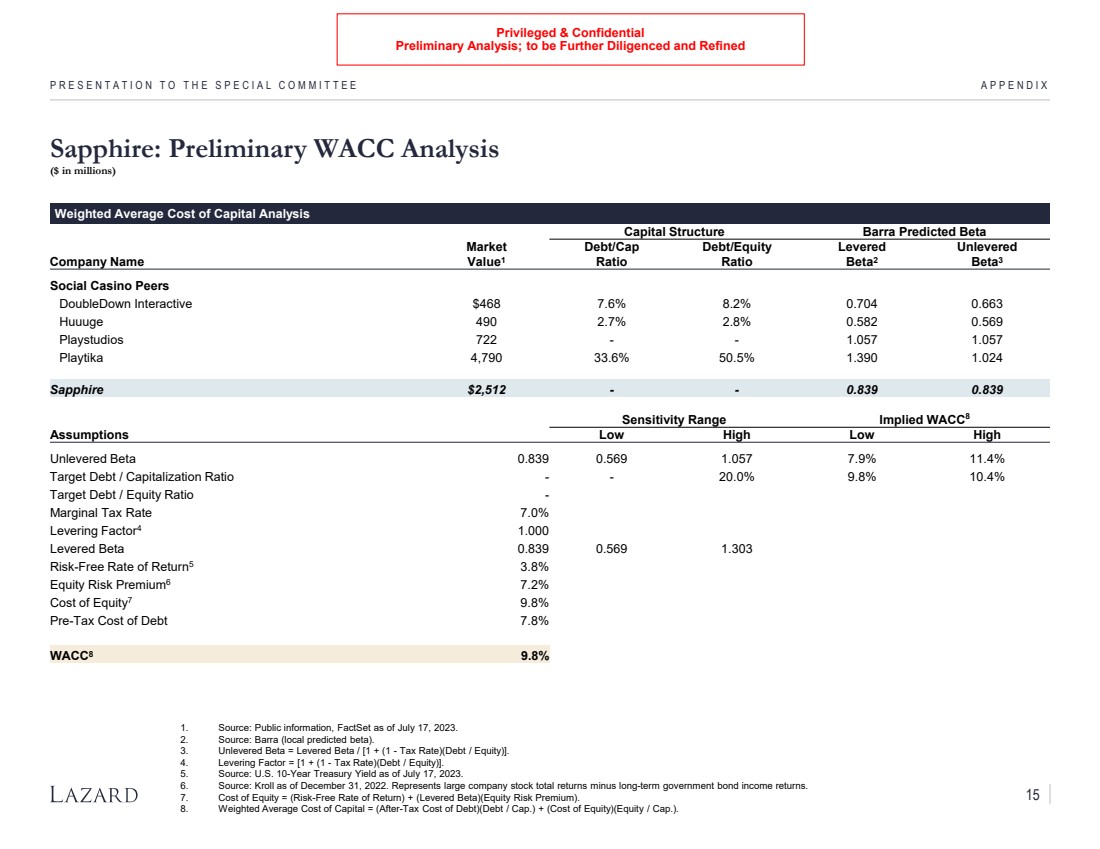
| Privileged & Confidential
Preliminary Analysis; to be Further Diligenced and Refined
PRESENTATION TO THE SPECIAL COMMITTEE APPENDIX
1. Source: Public information, FactSet as of July 17, 2023.
2. Source: Barra (local predicted beta).
3. Unlevered Beta = Levered Beta / [1 + (1 - Tax Rate)(Debt / Equity)].
4. Levering Factor = [1 + (1 - Tax Rate)(Debt / Equity)].
5. Source: U.S. 10-Year Treasury Yield as of July 17, 2023.
6. Source: Kroll as of December 31, 2022. Represents large company stock total returns minus long-term government bond income returns.
7. Cost of Equity = (Risk-Free Rate of Return) + (Levered Beta)(Equity Risk Premium).
8. Weighted Average Cost of Capital = (After-Tax Cost of Debt)(Debt / Cap.) + (Cost of Equity)(Equity / Cap.).
Weighted Average Cost of Capital Analysis
Capital Structure Barra Predicted Beta
Market Debt/Cap Debt/Equity Levered Unlevered
Company Name Value1 Ratio Ratio Beta2 Beta3
Social Casino Peers
DoubleDown Interactive $468 7.6% 8.2% 0.704 0.663
Huuuge 490 2.7% 2.8% 0.582 0.569
Playstudios 722 - - 1.057 1.057
Playtika 4,790 33.6% 50.5% 1.390 1.024
Sapphire $2,512 - - 0.839 0.839
Sensitivity Range Implied WACC8
Assumptions Low High Low High
Unlevered Beta 0.839 0.569 1.057 7.9% 11.4%
Target Debt / Capitalization Ratio - - 20.0% 9.8% 10.4%
Target Debt / Equity Ratio -
Marginal Tax Rate 7.0%
Levering Factor4 1.000
Levered Beta 0.839 0.569 1.303
Risk-Free Rate of Return5 3.8%
Equity Risk Premium6 7.2%
Cost of Equity7 9.8%
Pre-Tax Cost of Debt 7.8%
WACC8 9.8%
Sapphire: Preliminary WACC Analysis
($ in millions)
15 |
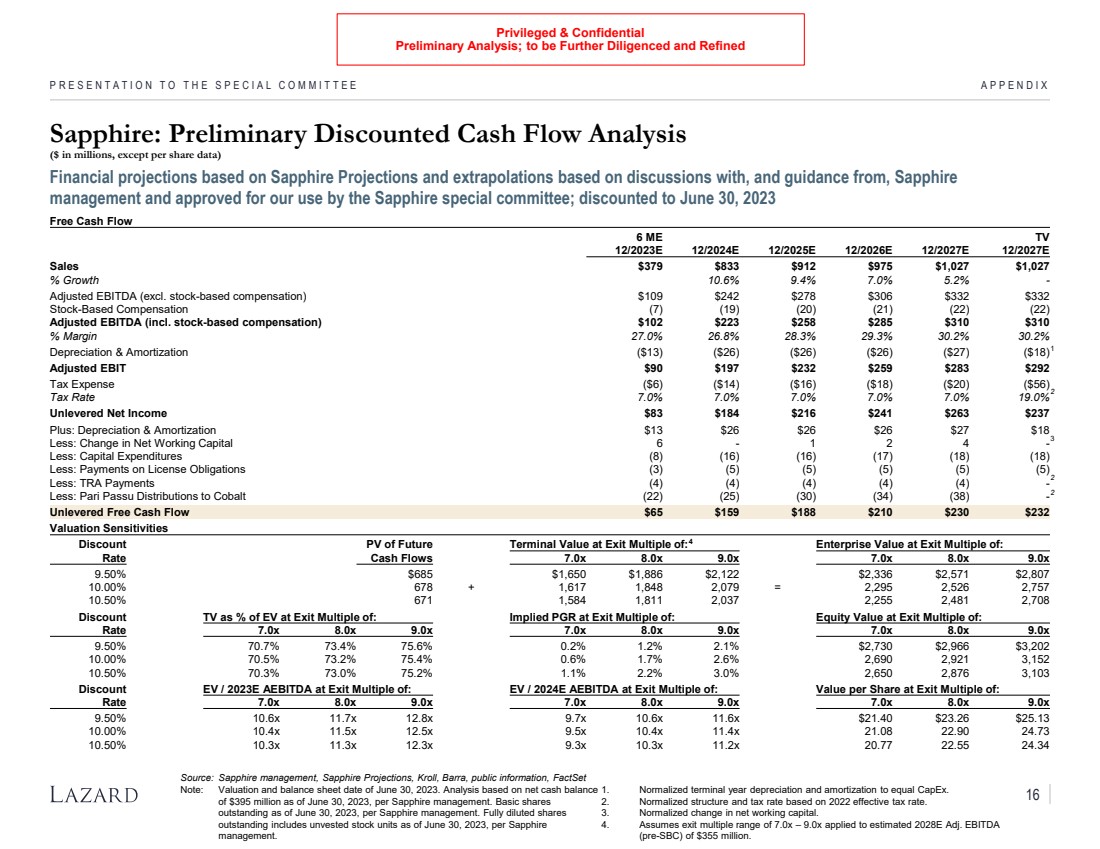
| Privileged & Confidential
Preliminary Analysis; to be Further Diligenced and Refined
Free Cash Flow
6 ME TV
12/2023E 12/2024E 12/2025E 12/2026E 12/2027E 12/2027E
Sales $379 $833 $912 $975 $1,027 $1,027
% Growth 10.6% 9.4% 7.0% 5.2% -
Adjusted EBITDA (excl. stock-based compensation) $109 $242 $278 $306 $332 $332
Stock-Based Compensation (7) (19) (20) (21) (22) (22)
Adjusted EBITDA (incl. stock-based compensation) $102 $223 $258 $285 $310 $310
% Margin 27.0% 26.8% 28.3% 29.3% 30.2% 30.2%
Depreciation & Amortization ($13) ($26) ($26) ($26) ($27) ($18)
Adjusted EBIT $90 $197 $232 $259 $283 $292
Tax Expense ($6) ($14) ($16) ($18) ($20) ($56)
Tax Rate 7.0% 7.0% 7.0% 7.0% 7.0% 19.0%
Unlevered Net Income $83 $184 $216 $241 $263 $237
Plus: Depreciation & Amortization $13 $26 $26 $26 $27 $18
Less: Change in Net Working Capital 6 - 1 2 4 -
Less: Capital Expenditures (8) (16) (16) (17) (18) (18)
Less: Payments on License Obligations (3) (5) (5) (5) (5) (5)
Less: TRA Payments (4) (4) (4) (4) (4) -
Less: Pari Passu Distributions to Cobalt (22) (25) (30) (34) (38) -
Unlevered Free Cash Flow $65 $159 $188 $210 $230 $232
Valuation Sensitivities
Discount PV of Future Terminal Value at Exit Multiple of: Enterprise Value at Exit Multiple of:
Rate Cash Flows 7.0x 8.0x 9.0x 7.0x 8.0x 9.0x
9.50% $685 $1,650 $1,886 $2,122 $2,336 $2,571 $2,807
10.00% 678 + 1,617 1,848 2,079 = 2,295 2,526 2,757
10.50% 671 1,584 1,811 2,037 2,255 2,481 2,708
Discount TV as % of EV at Exit Multiple of: Implied PGR at Exit Multiple of: Equity Value at Exit Multiple of:
Rate 7.0x 8.0x 9.0x 7.0x 8.0x 9.0x 7.0x 8.0x 9.0x
9.50% 70.7% 73.4% 75.6% 0.2% 1.2% 2.1% $2,730 $2,966 $3,202
10.00% 70.5% 73.2% 75.4% 0.6% 1.7% 2.6% 2,690 2,921 3,152
10.50% 70.3% 73.0% 75.2% 1.1% 2.2% 3.0% 2,650 2,876 3,103
Discount EV / 2023E AEBITDA at Exit Multiple of: EV / 2024E AEBITDA at Exit Multiple of: Value per Share at Exit Multiple of:
Rate 7.0x 8.0x 9.0x 7.0x 8.0x 9.0x 7.0x 8.0x 9.0x
9.50% 10.6x 11.7x 12.8x 9.7x 10.6x 11.6x $21.40 $23.26 $25.13
10.00% 10.4x 11.5x 12.5x 9.5x 10.4x 11.4x 21.08 22.90 24.73
10.50% 10.3x 11.3x 12.3x 9.3x 10.3x 11.2x 20.77 22.55 24.34
Financial projections based on Sapphire Projections and extrapolations based on discussions with, and guidance from, Sapphire
management and approved for our use by the Sapphire special committee; discounted to June 30, 2023
Sapphire: Preliminary Discounted Cash Flow Analysis
($ in millions, except per share data)
PRESENTATION TO THE SPECIAL COMMITTEE APPENDIX
Source: Sapphire management, Sapphire Projections, Kroll, Barra, public information, FactSet
Note: Valuation and balance sheet date of June 30, 2023. Analysis based on net cash balance
of $395 million as of June 30, 2023, per Sapphire management. Basic shares
outstanding as of June 30, 2023, per Sapphire management. Fully diluted shares
outstanding includes unvested stock units as of June 30, 2023, per Sapphire
management.
1. Normalized terminal year depreciation and amortization to equal CapEx.
2. Normalized structure and tax rate based on 2022 effective tax rate.
3. Normalized change in net working capital.
4. Assumes exit multiple range of 7.0x – 9.0x applied to estimated 2028E Adj. EBITDA
(pre-SBC) of $355 million.
1
3
4
2
2
2
16 |
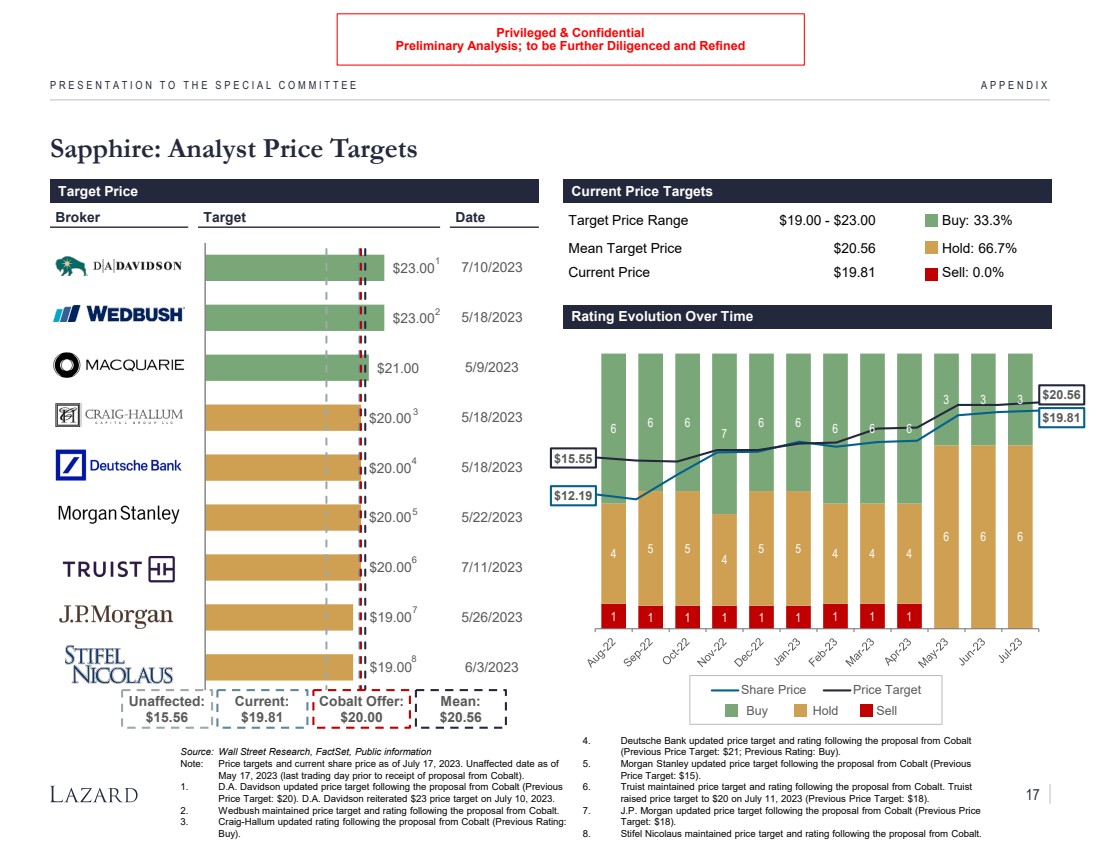
| Privileged & Confidential
Preliminary Analysis; to be Further Diligenced and Refined
$23.00
$23.00
$21.00
$20.00
$20.00
$20.00
$20.00
$19.00
$19.00
PRESENTATION TO THE SPECIAL COMMITTEE APPENDIX
Sapphire: Analyst Price Targets
Target Price Range $19.00 - $23.00 Buy: 33.3%
Mean Target Price $20.56 Hold: 66.7%
Current Price $19.81 Sell: 0.0%
Broker Target Date
Target Price Current Price Targets
Rating Evolution Over Time
Current:
$19.81
Mean:
$20.56
1 1 1 1 1 1 1 1 1
4 5 5
4
5 5 4 4 4
6 6 6
6 6 6
7
6 6 6 6 6
3 3 3
Share Price Price Target
Buy Hold Sell
$15.55
$12.19
$20.56
$19.81
7/10/2023
5/18/2023
5/9/2023
5/18/2023
5/18/2023
5/22/2023
7/11/2023
5/26/2023
6/3/2023
Source: Wall Street Research, FactSet, Public information
Note: Price targets and current share price as of July 17, 2023. Unaffected date as of
May 17, 2023 (last trading day prior to receipt of proposal from Cobalt).
1. D.A. Davidson updated price target following the proposal from Cobalt (Previous
Price Target: $20). D.A. Davidson reiterated $23 price target on July 10, 2023.
2. Wedbush maintained price target and rating following the proposal from Cobalt.
3. Craig-Hallum updated rating following the proposal from Cobalt (Previous Rating:
Buy).
4. Deutsche Bank updated price target and rating following the proposal from Cobalt
(Previous Price Target: $21; Previous Rating: Buy).
5. Morgan Stanley updated price target following the proposal from Cobalt (Previous
Price Target: $15).
6. Truist maintained price target and rating following the proposal from Cobalt. Truist
raised price target to $20 on July 11, 2023 (Previous Price Target: $18).
7. J.P. Morgan updated price target following the proposal from Cobalt (Previous Price
Target: $18).
8. Stifel Nicolaus maintained price target and rating following the proposal from Cobalt.
Cobalt Offer:
$20.00
1
3
4
5
2
6
8
7
Unaffected:
$15.56
17 |
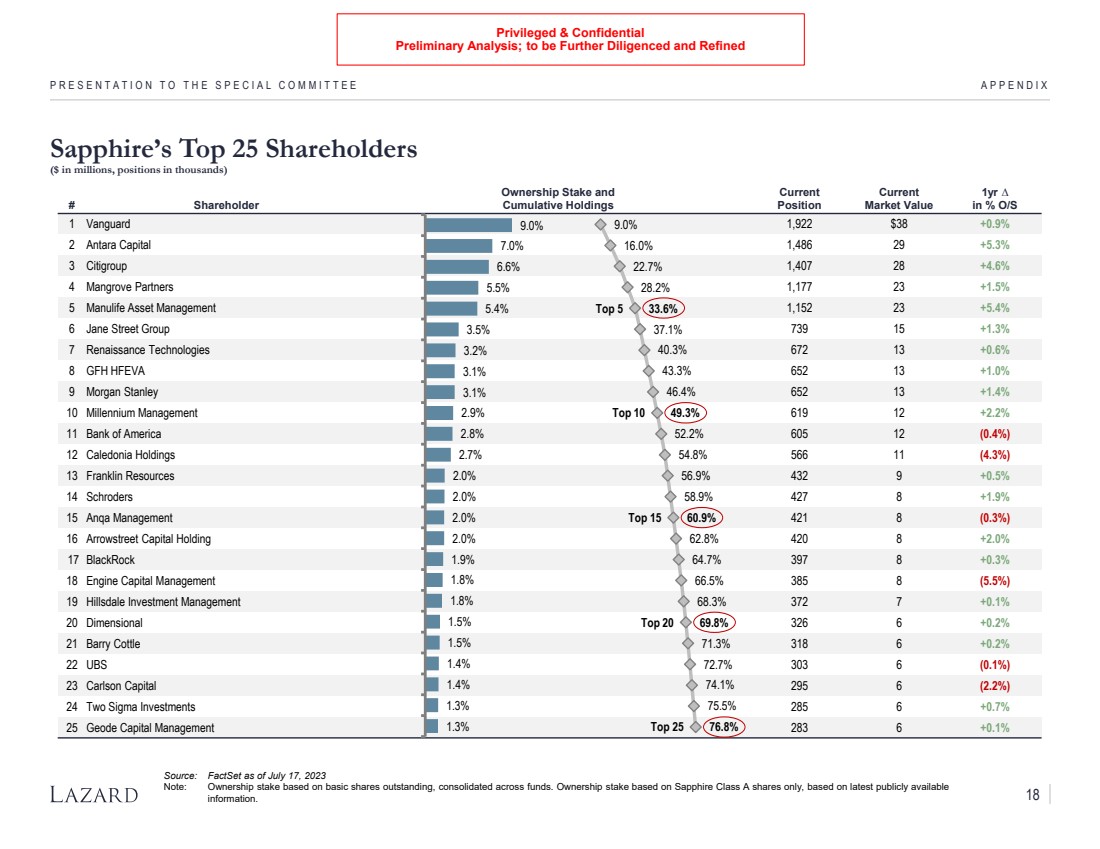
| Privileged & Confidential
Preliminary Analysis; to be Further Diligenced and Refined
APPENDIX
Sapphire’s Top 25 Shareholders
($ in millions, positions in thousands)
Source: FactSet as of July 17, 2023
Note: Ownership stake based on basic shares outstanding, consolidated across funds. Ownership stake based on Sapphire Class A shares only, based on latest publicly available
information.
PRESENTATION TO THE SPECIAL COMMITTEE
# Shareholder
Ownership Stake and
Cumulative Holdings
Current
Position
Current
Market Value
1yr ∆
in % O/S
1 Vanguard 1,922 $38 +0.9%
2 Antara Capital 1,486 29 +5.3%
3 Citigroup 1,407 28 +4.6%
4 Mangrove Partners 1,177 23 +1.5%
5 Manulife Asset Management 1,152 23 +5.4%
6 Jane Street Group 739 15 +1.3%
7 Renaissance Technologies 672 13 +0.6%
8 GFH HFEVA 652 13 +1.0%
9 Morgan Stanley 652 13 +1.4%
10 Millennium Management 619 12 +2.2%
11 Bank of America 605 12 (0.4%)
12 Caledonia Holdings 566 11 (4.3%)
13 Franklin Resources 432 9 +0.5%
14 Schroders 427 8 +1.9%
15 Anqa Management 421 8 (0.3%)
16 Arrowstreet Capital Holding 420 8 +2.0%
17 BlackRock 397 8 +0.3%
18 Engine Capital Management 385 8 (5.5%)
19 Hillsdale Investment Management 372 7 +0.1%
20 Dimensional 326 6 +0.2%
21 Barry Cottle 318 6 +0.2%
22 UBS 303 6 (0.1%)
23 Carlson Capital 295 6 (2.2%)
24 Two Sigma Investments 285 6 +0.7%
25 Geode Capital Management 283 6 +0.1%
9.0%
7.0%
6.6%
5.5%
5.4%
3.5%
3.2%
3.1%
3.1%
2.9%
2.8%
2.7%
2.0%
2.0%
2.0%
2.0%
1.9%
1.8%
1.8%
1.5%
1.5%
1.4%
1.4%
1.3%
1.3%
9.0%
16.0%
22.7%
28.2%
33.6%
37.1%
40.3%
43.3%
46.4%
49.3%
52.2%
54.8%
56.9%
58.9%
60.9%
62.8%
64.7%
66.5%
68.3%
69.8%
71.3%
72.7%
74.1%
75.5%
76.8%
Top 5
Top 10
Top 15
Top 20
Top 25
18 |
Exhibit (c)(6)
| Privileged & Confidential
Preliminary Analysis; to be Further Diligenced and Refined
Sensitivity Analysis
P R O J E C T S A P P H I R E
C O N F I D E N T I A L J U L Y 2 0 2 3 |
| Privileged & Confidential
Preliminary Analysis; to be Further Diligenced and Refined
The information herein has been prepared by Lazard Frères & Co. LLC (“Lazard”) based upon information supplied by Sapphire (the “Company”) or
publicly available information, and portions of the information herein may be based upon certain statements, estimates and forecasts provided by
the Company with respect to the anticipated future performance of the Company. Lazard has relied upon the accuracy and completeness of the
foregoing information, and has not assumed any responsibility for any independent verification of such information or any independent valuation or
appraisal of any of the assets or liabilities of the Company, or any other entity, or concerning solvency or fair value of the Company or any other
entity. With respect to financial forecasts, Lazard has assumed that they have been reasonably prepared on bases reflecting the best currently
available estimates and judgments as to the future financial performance of the Company. Lazard assumes no responsibility for and expresses no
view as to such forecasts or the assumptions on which they are based. The information set forth herein is based upon economic, monetary, market
and other conditions as in effect on, and the information made available to us as of, the date hereof, unless indicated otherwise. Lazard is not
making any assessment regarding the impact or economic effects of the COVID-19 virus, including with respect to the potential impact or effects on
the future financial performance of the Company. Subsequent developments, including, without limitation, in relation to COVID-19, may affect the
forecasts and other information set out in this document and Lazard assumes no responsibility for updating or revising this document based on
circumstances or events after the date hereof. These materials and the information contained herein are confidential and may not be disclosed
publicly or made available to third parties without the prior written consent of Lazard; provided, however, that you may disclose to any and all
persons the U.S. federal income tax treatment and tax structure of the transaction described herein and the portions of these materials that relate to
such tax treatment or structure. Lazard is acting as financial advisor to the special committee of the board of directors of the Company, and will not
be responsible for and will not provide any tax, accounting, actuarial, legal or other specialist advice.
Disclaimer
C O N F I D E N T I A L S E N S I T I V I T Y A N A L Y S I S |
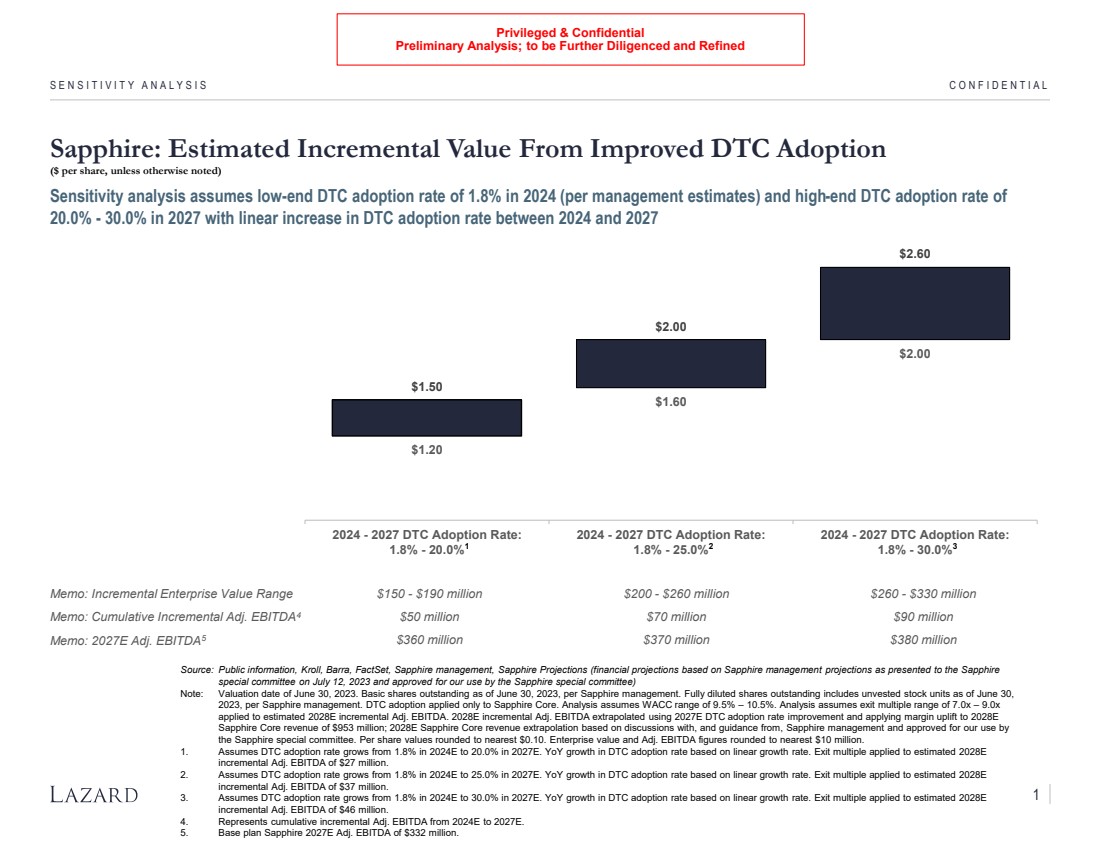
| Privileged & Confidential
Preliminary Analysis; to be Further Diligenced and Refined
Memo: Incremental Enterprise Value Range $150 - $190 million $200 - $260 million $260 - $330 million
Memo: Cumulative Incremental Adj. EBITDA4 $50 million $70 million $90 million
Memo: 2027E Adj. EBITDA5 $360 million $370 million $380 million
Sapphire: Estimated Incremental Value From Improved DTC Adoption
($ per share, unless otherwise noted)
S E N S I T I V I T Y A N A L Y S I S C O N F I D E N T I A L
Sensitivity analysis assumes low-end DTC adoption rate of 1.8% in 2024 (per management estimates) and high-end DTC adoption rate of
20.0% - 30.0% in 2027 with linear increase in DTC adoption rate between 2024 and 2027
Source: Public information, Kroll, Barra, FactSet, Sapphire management, Sapphire Projections (financial projections based on Sapphire management projections as presented to the Sapphire
special committee on July 12, 2023 and approved for our use by the Sapphire special committee)
Note: Valuation date of June 30, 2023. Basic shares outstanding as of June 30, 2023, per Sapphire management. Fully diluted shares outstanding includes unvested stock units as of June 30,
2023, per Sapphire management. DTC adoption applied only to Sapphire Core. Analysis assumes WACC range of 9.5% – 10.5%. Analysis assumes exit multiple range of 7.0x – 9.0x
applied to estimated 2028E incremental Adj. EBITDA. 2028E incremental Adj. EBITDA extrapolated using 2027E DTC adoption rate improvement and applying margin uplift to 2028E
Sapphire Core revenue of $953 million; 2028E Sapphire Core revenue extrapolation based on discussions with, and guidance from, Sapphire management and approved for our use by
the Sapphire special committee. Per share values rounded to nearest $0.10. Enterprise value and Adj. EBITDA figures rounded to nearest $10 million.
1. Assumes DTC adoption rate grows from 1.8% in 2024E to 20.0% in 2027E. YoY growth in DTC adoption rate based on linear growth rate. Exit multiple applied to estimated 2028E
incremental Adj. EBITDA of $27 million.
2. Assumes DTC adoption rate grows from 1.8% in 2024E to 25.0% in 2027E. YoY growth in DTC adoption rate based on linear growth rate. Exit multiple applied to estimated 2028E
incremental Adj. EBITDA of $37 million.
3. Assumes DTC adoption rate grows from 1.8% in 2024E to 30.0% in 2027E. YoY growth in DTC adoption rate based on linear growth rate. Exit multiple applied to estimated 2028E
incremental Adj. EBITDA of $46 million.
4. Represents cumulative incremental Adj. EBITDA from 2024E to 2027E.
5. Base plan Sapphire 2027E Adj. EBITDA of $332 million.
$1.20
$1.60
$2.00
$1.50
$2.00
$2.60
2024 - 2027 DTC Adoption Rate:
1.8% - 20.0%
2024 - 2027 DTC Adoption Rate:
1.8% - 25.0%
2024 - 2027 DTC Adoption Rate:
1 2 1.8% - 30.0%3
1 |
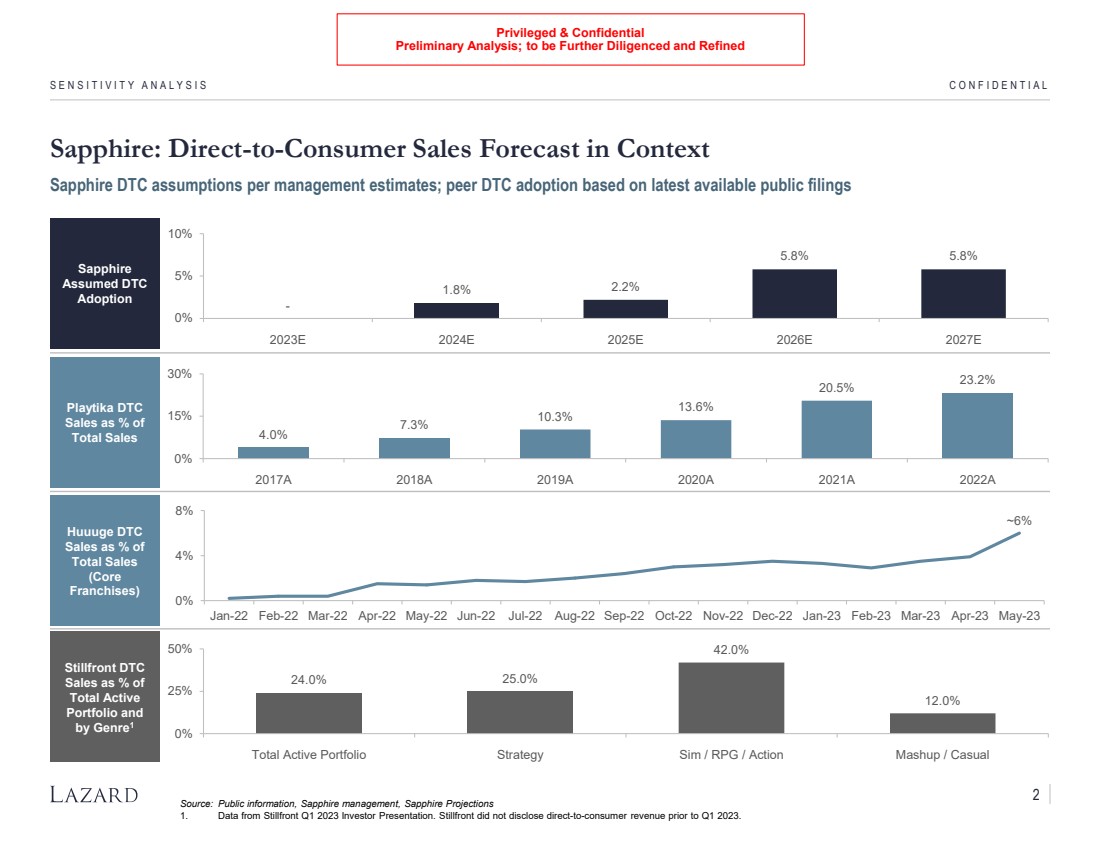
| Privileged & Confidential
Preliminary Analysis; to be Further Diligenced and Refined
S E N S I T I V I T Y A N A L Y S I S
Sapphire: Direct-to-Consumer Sales Forecast in Context
C O N F I D E N T I A L
Sapphire
Assumed DTC
Adoption
Playtika DTC
Sales as % of
Total Sales
Huuuge DTC
Sales as % of
Total Sales
(Core
Franchises)
Stillfront DTC
Sales as % of
Total Active
Portfolio and
by Genre1
-
1.8% 2.2%
5.8% 5.8%
0%
5%
10%
2023E 2024E 2025E 2026E 2027E
4.0%
7.3% 10.3%
13.6%
20.5% 23.2%
0%
15%
30%
2017A 2018A 2019A 2020A 2021A 2022A
0%
4%
8%
Jan-22 Feb-22 Mar-22 Apr-22 May-22 Jun-22 Jul-22 Aug-22 Sep-22 Oct-22 Nov-22 Dec-22 Jan-23 Feb-23 Mar-23 Apr-23 May-23
Sapphire DTC assumptions per management estimates; peer DTC adoption based on latest available public filings
Source: Public information, Sapphire management, Sapphire Projections
1. Data from Stillfront Q1 2023 Investor Presentation. Stillfront did not disclose direct-to-consumer revenue prior to Q1 2023.
24.0% 25.0%
42.0%
12.0%
0%
25%
50%
Total Active Portfolio Strategy Sim / RPG / Action Mashup / Casual
~6%
2 |
Exhibit (c)(7)
| Project Sapphire
PRESENTATION TO THE SPECIAL COMMITTEE
CONFIDENTIAL 7 AUGUST 2023 |
| These materials have been prepared by Lazard Frères & Co. LLC (“Lazard”) for the information and assistance of the Special Committee of the
Board of Directors of Sapphire in connection with their consideration of the matters referred to herein. These materials are based upon information
supplied by you (the “Company”) or publicly available information, and portions of the information herein may be based upon certain statements,
estimates and forecasts provided by the Company with respect to the anticipated future performance of the Company. Lazard has relied upon the
accuracy and completeness of the foregoing information, and has not assumed any responsibility for any independent verification of such
information or any independent valuation or appraisal of any of the assets or liabilities of the Company, or any other entity, or concerning solvency
or fair value of the Company or any other entity. With respect to financial forecasts, Lazard has assumed that they have been reasonably prepared
on bases reflecting the best currently available estimates and judgments as to the future financial performance of the Company. Lazard assumes
no responsibility for and expresses no view as to such forecasts or the assumptions on which they are based. The information set forth herein is
based upon economic, monetary, market and other conditions as in effect on, and the information made available to us as of, the date hereof,
unless indicated otherwise. Lazard is not making any assessment regarding the impact or economic effects of the COVID-19 virus, including with
respect to the potential impact or effects on the future financial performance of the Company. Subsequent developments, including, without
limitation, in relation to COVID-19, may affect the forecasts and other information set out in this document and Lazard assumes no responsibility for
updating or revising this document based on circumstances or events after the date hereof. These materials and the information contained herein
are confidential and may not be disclosed publicly or made available to third parties without the prior written consent of Lazard; provided, however,
that you may disclose to any and all persons the U.S. federal income tax treatment and tax structure of the transaction described herein and the
portions of these materials that relate to such tax treatment or structure. Lazard is acting as financial advisor to the special committee of the board
of directors of the Company, and will not be responsible for and will not provide any tax, accounting, actuarial, legal or other specialist advice.
Disclaimer
CONFIDENTIAL PROJECT SAPPHIRE |

| PROJECT SAPPHIRE CONFIDENTIAL
Source: Sapphire management, public information, FactSet, Bloomberg
Note: Unaffected date as of May 17, 2023 (last trading day prior to receipt and public
announcement of proposal from Cobalt). Adj. EBITDA excludes stock-based
compensation (“SBC”) expense.
1. Based on basic shares outstanding as of August 3, 2023, per Sapphire management.
Fully diluted shares outstanding includes unvested stock units as of August 3, 2023.
2. Adj. EBITDA based on Sapphire management projections.
Initial Cobalt
Proposal
First Cobalt
Counterproposal
Second Cobalt
Counterproposal Final Offer
Implied Premium / (Discount) to: Reference Price:
Unaffected Closing Price $15.56 28.5% 38.2% 43.0% 47.5%
Unaffected 10-Trading Day VWAP 16.97 17.9% 26.7% 31.1% 35.3%
Unaffected 30-Trading Day VWAP 17.10 17.0% 25.8% 30.1% 34.2%
Unaffected 60-Trading Day VWAP 16.96 17.9% 26.7% 31.2% 35.3%
Implied Equity Value1 $2,532 $2,722 $2,816 $2,905
Net Cash (6/30/2023) (395) (395) (395) (395)
Implied Enterprise Value $2,137 $2,327 $2,422 $2,510
Implied EV / Adj. EBITDA Adj. EBITDA:
LTM 6/30/2023A $214 10.0x 10.9x 11.3x 11.7x
2023E2 220 9.7x 10.6x 11.0x 11.4x
2024E2 242 8.8x 9.6x 10.0x 10.4x
$20.00 $21.50 $22.25 $22.95
Final value of $22.95 per share in cash for outstanding public shares of Sapphire not owned by Cobalt
• Over the course of July and August 2023, the special committee of Sapphire and management of Cobalt held negotiations regarding the proposed
acquisition by Cobalt of the public shares of Sapphire not owned by Cobalt (the “Proposed Transaction”)
− On May 18, 2023, Cobalt submitted to the Sapphire Board of Directors and concurrently publicly announced its initial offer price of $20.00 in cash per
Sapphire share (“Initial Cobalt Proposal”)
− On July 21, 2023, Sapphire indicated to Cobalt that the value delivered to Cobalt from the Proposed Transaction, including elimination of estimated public
company costs, would be ~$26.20 per share
− On July 25, 2023, Cobalt verbally communicated an increased offer price of $21.50 in cash per share (“First Cobalt Counterproposal”)
− On July 28, 2023, Sapphire verbally communicated its counterproposal of $23.75 in cash per share
− On July 30, 2023, Cobalt verbally communicated its updated offer price of $22.25 in cash per share (“Second Cobalt Counterproposal”)
− On August 2, 2023, Sapphire and Cobalt verbally negotiated a purchase price of $22.95 in cash per share (“Final Offer”), subject to approval by the
Sapphire Special Committee, Sapphire Board of Directors and Cobalt Board of Directors
Analysis of Cobalt’s Final Negotiated Offer
($ in millions, except per share data)
1 |
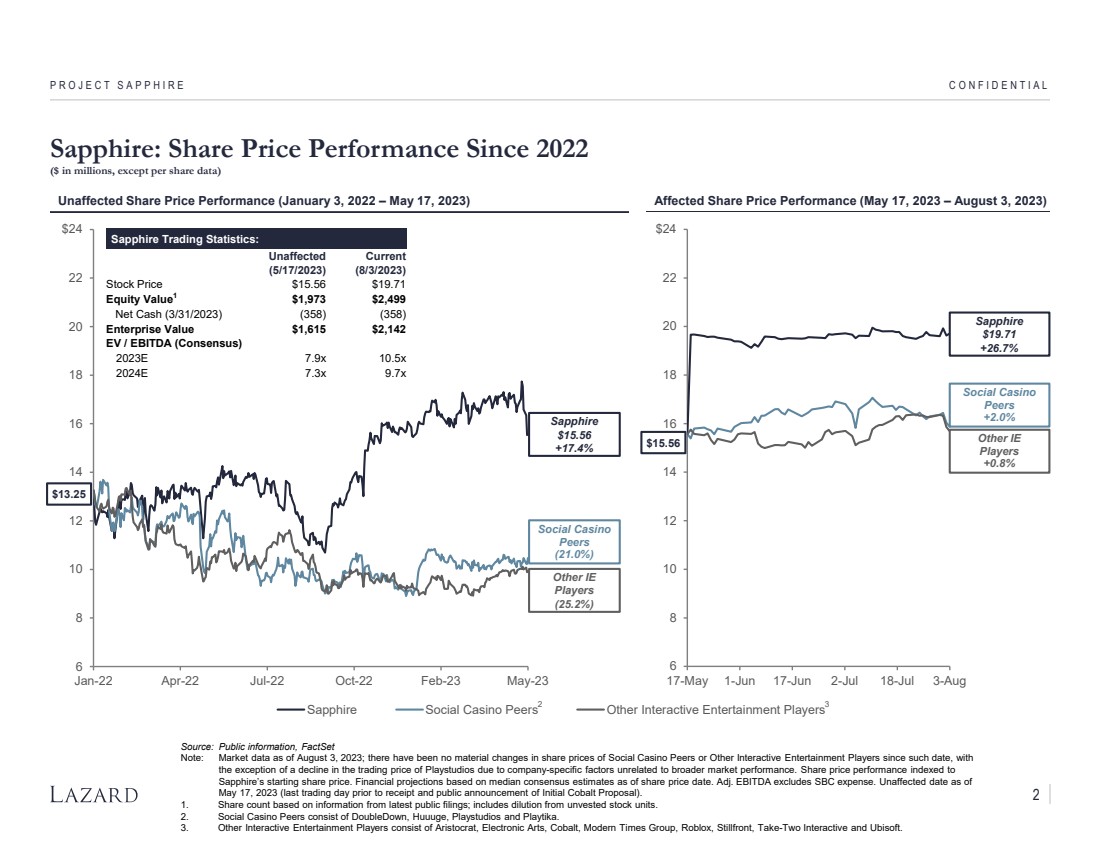
| 6
8
10
12
14
16
18
20
22
$24
Jan-22 Apr-22 Jul-22 Oct-22 Feb-23 May-23
Sapphire Social Casino Peers Other Interactive Entertainment Players
6
8
10
12
14
16
18
20
22
$24
17-May 1-Jun 17-Jun 2-Jul 18-Jul 3-Aug
PROJECT SAPPHIRE CONFIDENTIAL
Sapphire Trading Statistics:
Unaffected
(5/17/2023)
Current
(8/3/2023)
Stock Price $15.56 $19.71
Equity Value1 $1,973 $2,499
Net Cash (3/31/2023) (358) (358)
Enterprise Value $1,615 $2,142
EV / EBITDA (Consensus)
2023E 7.9x 10.5x
2024E 7.3x 9.7x
Unaffected Share Price Performance (January 3, 2022 – May 17, 2023)
2
Sapphire
$15.56
+17.4%
Social Casino
Peers
(21.0%)
Source: Public information, FactSet
Note: Market data as of August 3, 2023; there have been no material changes in share prices of Social Casino Peers or Other Interactive Entertainment Players since such date, with
the exception of a decline in the trading price of Playstudios due to company-specific factors unrelated to broader market performance. Share price performance indexed to
Sapphire’s starting share price. Financial projections based on median consensus estimates as of share price date. Adj. EBITDA excludes SBC expense. Unaffected date as of
May 17, 2023 (last trading day prior to receipt and public announcement of Initial Cobalt Proposal).
1. Share count based on information from latest public filings; includes dilution from unvested stock units.
2. Social Casino Peers consist of DoubleDown, Huuuge, Playstudios and Playtika.
3. Other Interactive Entertainment Players consist of Aristocrat, Electronic Arts, Cobalt, Modern Times Group, Roblox, Stillfront, Take-Two Interactive and Ubisoft.
Sapphire: Share Price Performance Since 2022
($ in millions, except per share data)
Affected Share Price Performance (May 17, 2023 – August 3, 2023)
$15.56
$13.25
Sapphire
$19.71
+26.7%
Social Casino
Peers
+2.0%
Other IE
Players
(25.2%)
Other IE
Players
+0.8%
3
2 |
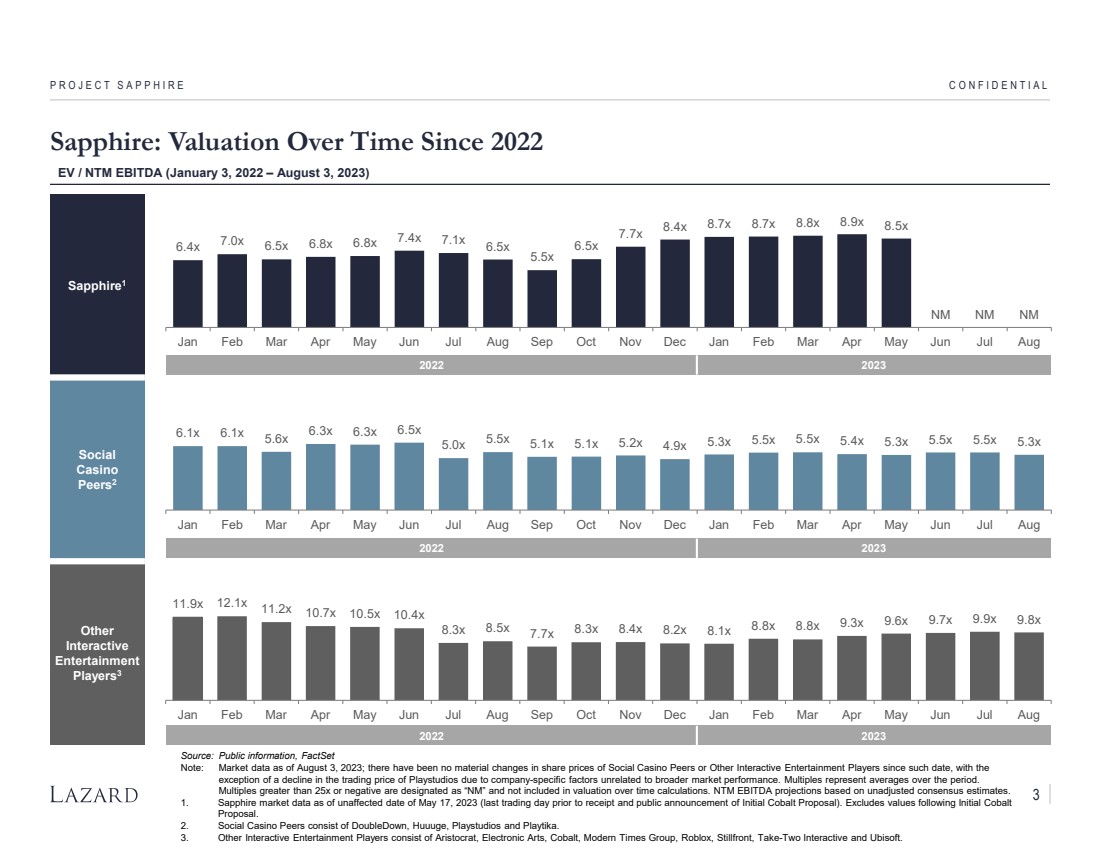
| Sapphire1
Social
Casino
Peers2
Other
Interactive
Entertainment
Players3
6.4x 7.0x 6.5x 6.8x 6.8x 7.4x 7.1x 6.5x
5.5x
6.5x
7.7x 8.4x 8.7x 8.7x 8.8x 8.9x 8.5x
NM NM NM
Jan Feb Mar Apr May Jun Jul Aug Sep Oct Nov Dec Jan Feb Mar Apr May Jun Jul Aug
Sapphire: Valuation Over Time Since 2022
PROJECT SAPPHIRE CONFIDENTIAL
EV / NTM EBITDA (January 3, 2022 – August 3, 2023)
Source: Public information, FactSet
Note: Market data as of August 3, 2023; there have been no material changes in share prices of Social Casino Peers or Other Interactive Entertainment Players since such date, with the
exception of a decline in the trading price of Playstudios due to company-specific factors unrelated to broader market performance. Multiples represent averages over the period.
Multiples greater than 25x or negative are designated as “NM” and not included in valuation over time calculations. NTM EBITDA projections based on unadjusted consensus estimates.
1. Sapphire market data as of unaffected date of May 17, 2023 (last trading day prior to receipt and public announcement of Initial Cobalt Proposal). Excludes values following Initial Cobalt
Proposal.
2. Social Casino Peers consist of DoubleDown, Huuuge, Playstudios and Playtika.
3. Other Interactive Entertainment Players consist of Aristocrat, Electronic Arts, Cobalt, Modern Times Group, Roblox, Stillfront, Take-Two Interactive and Ubisoft.
2022 2023
11.9x 12.1x 11.2x 10.7x 10.5x 10.4x
8.3x 8.5x 7.7x 8.3x 8.4x 8.2x 8.1x 8.8x 8.8x 9.3x 9.6x 9.7x 9.9x 9.8x
Jan Feb Mar Apr May Jun Jul Aug Sep Oct Nov Dec Jan Feb Mar Apr May Jun Jul Aug
6.1x 6.1x 5.6x 6.3x 6.3x 6.5x
5.0x 5.5x 5.1x 5.1x 5.2x 4.9x 5.3x 5.5x 5.5x 5.4x 5.3x 5.5x 5.5x 5.3x
Jan Feb Mar Apr May Jun Jul Aug Sep Oct Nov Dec Jan Feb Mar Apr May Jun Jul Aug
2022 2023
2022 2023
3 |
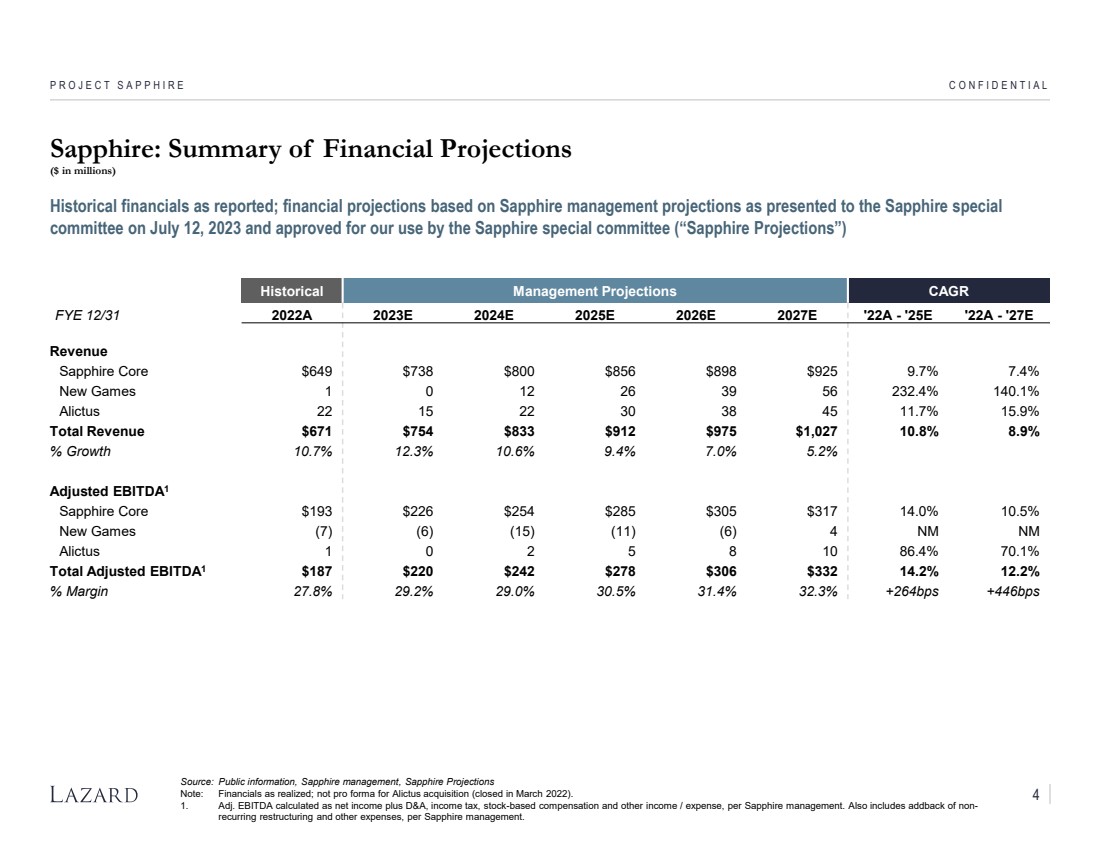
| PROJECT SAPPHIRE CONFIDENTIAL
Sapphire: Summary of Financial Projections
($ in millions)
Source: Public information, Sapphire management, Sapphire Projections
Note: Financials as realized; not pro forma for Alictus acquisition (closed in March 2022).
1. Adj. EBITDA calculated as net income plus D&A, income tax, stock-based compensation and other income / expense, per Sapphire management. Also includes addback of non-recurring restructuring and other expenses, per Sapphire management.
Historical financials as reported; financial projections based on Sapphire management projections as presented to the Sapphire special
committee on July 12, 2023 and approved for our use by the Sapphire special committee (“Sapphire Projections”)
Historical Management Projections CAGR
FYE 12/31 2022A 2023E 2024E 2025E 2026E 2027E '22A - '25E '22A - '27E
Revenue
Sapphire Core $649 $738 $800 $856 $898 $925 9.7% 7.4%
New Games 1 0 12 26 39 56 232.4% 140.1%
Alictus 22 15 22 30 38 45 11.7% 15.9%
Total Revenue $671 $754 $833 $912 $975 $1,027 10.8% 8.9%
% Growth 10.7% 12.3% 10.6% 9.4% 7.0% 5.2%
Adjusted EBITDA1
Sapphire Core $193 $226 $254 $285 $305 $317 14.0% 10.5%
New Games (7) (6) (15) (11) (6) 4 NM NM
Alictus 1 0 2 5 8 10 86.4% 70.1%
Total Adjusted EBITDA1 $187 $220 $242 $278 $306 $332 14.2% 12.2%
% Margin 27.8% 29.2% 29.0% 30.5% 31.4% 32.3% +264bps +446bps
4 |
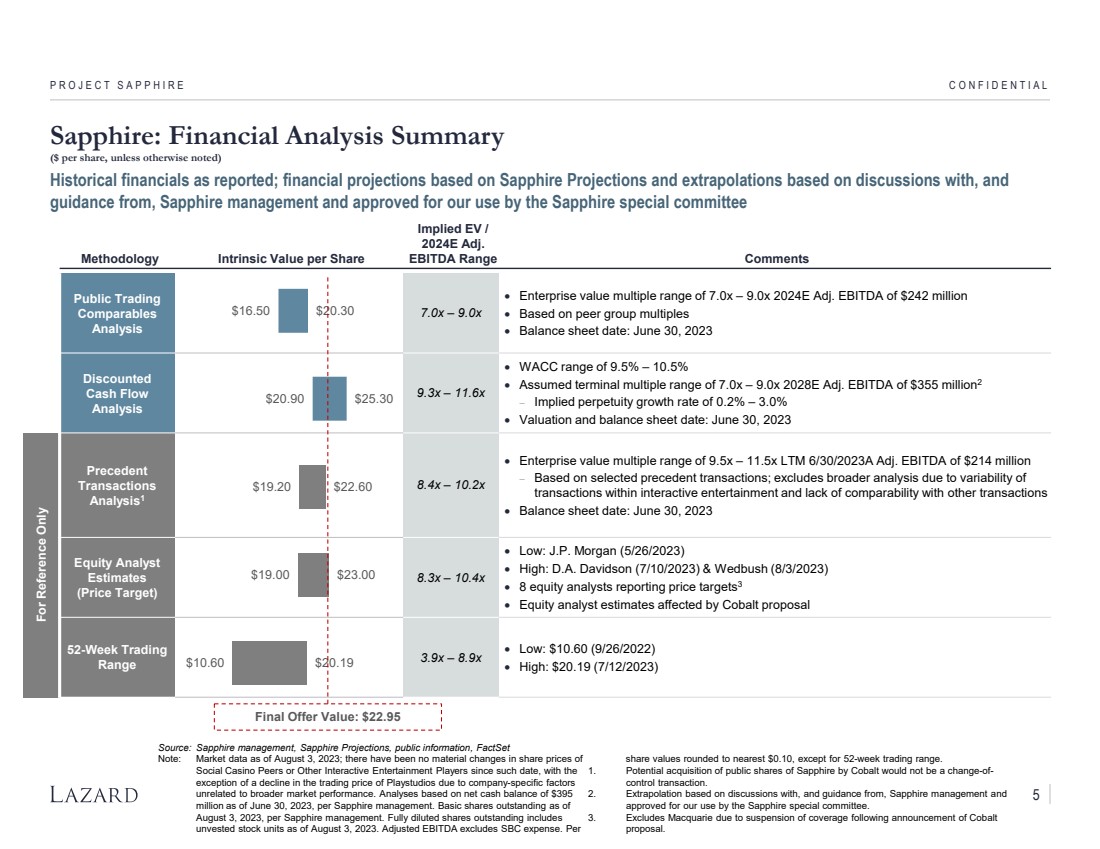
| PROJECT SAPPHIRE CONFIDENTIAL
Methodology Intrinsic Value per Share
Implied EV /
2024E Adj.
EBITDA Range Comments
Public Trading
Comparables
Analysis
7.0x – 9.0x
• Enterprise value multiple range of 7.0x – 9.0x 2024E Adj. EBITDA of $242 million
• Based on peer group multiples
• Balance sheet date: June 30, 2023
Discounted
Cash Flow
Analysis
9.3x – 11.6x
• WACC range of 9.5% – 10.5%
• Assumed terminal multiple range of 7.0x – 9.0x 2028E Adj. EBITDA of $355 million2
− Implied perpetuity growth rate of 0.2% – 3.0%
• Valuation and balance sheet date: June 30, 2023
For Reference Only
Precedent
Transactions
Analysis1
8.4x – 10.2x
• Enterprise value multiple range of 9.5x – 11.5x LTM 6/30/2023A Adj. EBITDA of $214 million
− Based on selected precedent transactions; excludes broader analysis due to variability of
transactions within interactive entertainment and lack of comparability with other transactions
• Balance sheet date: June 30, 2023
Equity Analyst
Estimates
(Price Target)
8.3x – 10.4x
• Low: J.P. Morgan (5/26/2023)
• High: D.A. Davidson (7/10/2023) & Wedbush (8/3/2023)
• 8 equity analysts reporting price targets3
• Equity analyst estimates affected by Cobalt proposal
52-Week Trading
Range 3.9x – 8.9x • Low: $10.60 (9/26/2022)
• High: $20.19 (7/12/2023)
$16.50
$20.90
$19.20
$19.00
$10.60
$20.30
$25.30
$22.60
$23.00
$20.19
Source: Sapphire management, Sapphire Projections, public information, FactSet
Note: Market data as of August 3, 2023; there have been no material changes in share prices of
Social Casino Peers or Other Interactive Entertainment Players since such date, with the
exception of a decline in the trading price of Playstudios due to company-specific factors
unrelated to broader market performance. Analyses based on net cash balance of $395
million as of June 30, 2023, per Sapphire management. Basic shares outstanding as of
August 3, 2023, per Sapphire management. Fully diluted shares outstanding includes
unvested stock units as of August 3, 2023. Adjusted EBITDA excludes SBC expense. Per
share values rounded to nearest $0.10, except for 52-week trading range.
1. Potential acquisition of public shares of Sapphire by Cobalt would not be a change-of-control transaction.
2. Extrapolation based on discussions with, and guidance from, Sapphire management and
approved for our use by the Sapphire special committee.
3. Excludes Macquarie due to suspension of coverage following announcement of Cobalt
proposal.
Final Offer Value: $22.95
Sapphire: Financial Analysis Summary
($ per share, unless otherwise noted)
Historical financials as reported; financial projections based on Sapphire Projections and extrapolations based on discussions with, and
guidance from, Sapphire management and approved for our use by the Sapphire special committee
5 |

| CONFIDENTIAL
Appendix
PROJECT SAPPHIRE |
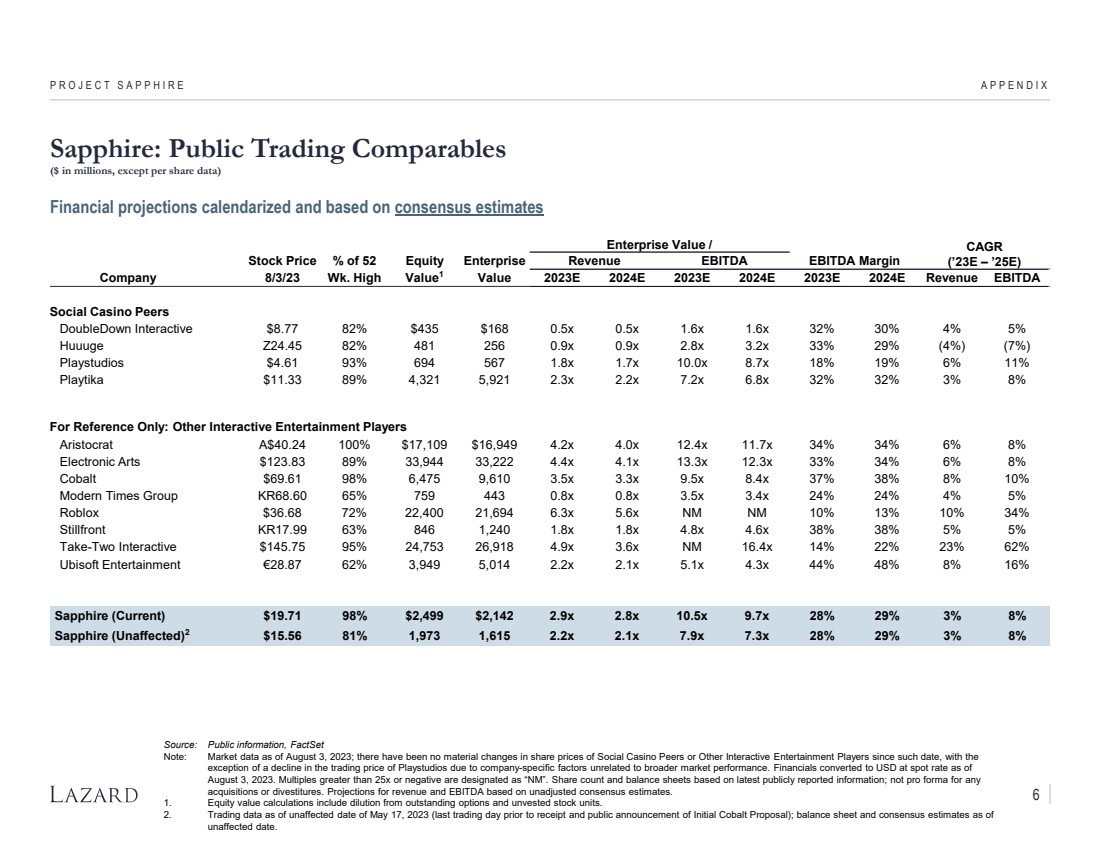
| Enterprise Value / CAGR
Stock Price % of 52 Equity Enterprise Revenue EBITDA EBITDA Margin (’23E – ’25E)
Company 8/3/23 Wk. High Value1 Value 2023E 2024E 2023E 2024E 2023E 2024E Revenue EBITDA
Social Casino Peers
DoubleDown Interactive $8.77 82% $435 $168 0.5x 0.5x 1.6x 1.6x 32% 30% 4% 5%
Huuuge Z24.45 82% 481 256 0.9x 0.9x 2.8x 3.2x 33% 29% (4%) (7%)
Playstudios $4.61 93% 694 567 1.8x 1.7x 10.0x 8.7x 18% 19% 6% 11%
Playtika $11.33 89% 4,321 5,921 2.3x 2.2x 7.2x 6.8x 32% 32% 3% 8%
For Reference Only: Other Interactive Entertainment Players
Aristocrat A$40.24 100% $17,109 $16,949 4.2x 4.0x 12.4x 11.7x 34% 34% 6% 8%
Electronic Arts $123.83 89% 33,944 33,222 4.4x 4.1x 13.3x 12.3x 33% 34% 6% 8%
Cobalt $69.61 98% 6,475 9,610 3.5x 3.3x 9.5x 8.4x 37% 38% 8% 10%
Modern Times Group KR68.60 65% 759 443 0.8x 0.8x 3.5x 3.4x 24% 24% 4% 5%
Roblox $36.68 72% 22,400 21,694 6.3x 5.6x NM NM 10% 13% 10% 34%
Stillfront KR17.99 63% 846 1,240 1.8x 1.8x 4.8x 4.6x 38% 38% 5% 5%
Take-Two Interactive $145.75 95% 24,753 26,918 4.9x 3.6x NM 16.4x 14% 22% 23% 62%
Ubisoft Entertainment €28.87 62% 3,949 5,014 2.2x 2.1x 5.1x 4.3x 44% 48% 8% 16%
Sapphire (Current) $19.71 98% $2,499 $2,142 2.9x 2.8x 10.5x 9.7x 28% 29% 3% 8%
Sapphire (Unaffected)2 $15.56 81% 1,973 1,615 2.2x 2.1x 7.9x 7.3x 28% 29% 3% 8%
Sapphire: Public Trading Comparables
($ in millions, except per share data)
PROJECT SAPPHIRE APPENDIX
Source: Public information, FactSet
Note: Market data as of August 3, 2023; there have been no material changes in share prices of Social Casino Peers or Other Interactive Entertainment Players since such date, with the
exception of a decline in the trading price of Playstudios due to company-specific factors unrelated to broader market performance. Financials converted to USD at spot rate as of
August 3, 2023. Multiples greater than 25x or negative are designated as “NM”. Share count and balance sheets based on latest publicly reported information; not pro forma for any
acquisitions or divestitures. Projections for revenue and EBITDA based on unadjusted consensus estimates.
1. Equity value calculations include dilution from outstanding options and unvested stock units.
2. Trading data as of unaffected date of May 17, 2023 (last trading day prior to receipt and public announcement of Initial Cobalt Proposal); balance sheet and consensus estimates as of
unaffected date.
Financial projections calendarized and based on consensus estimates
6 |
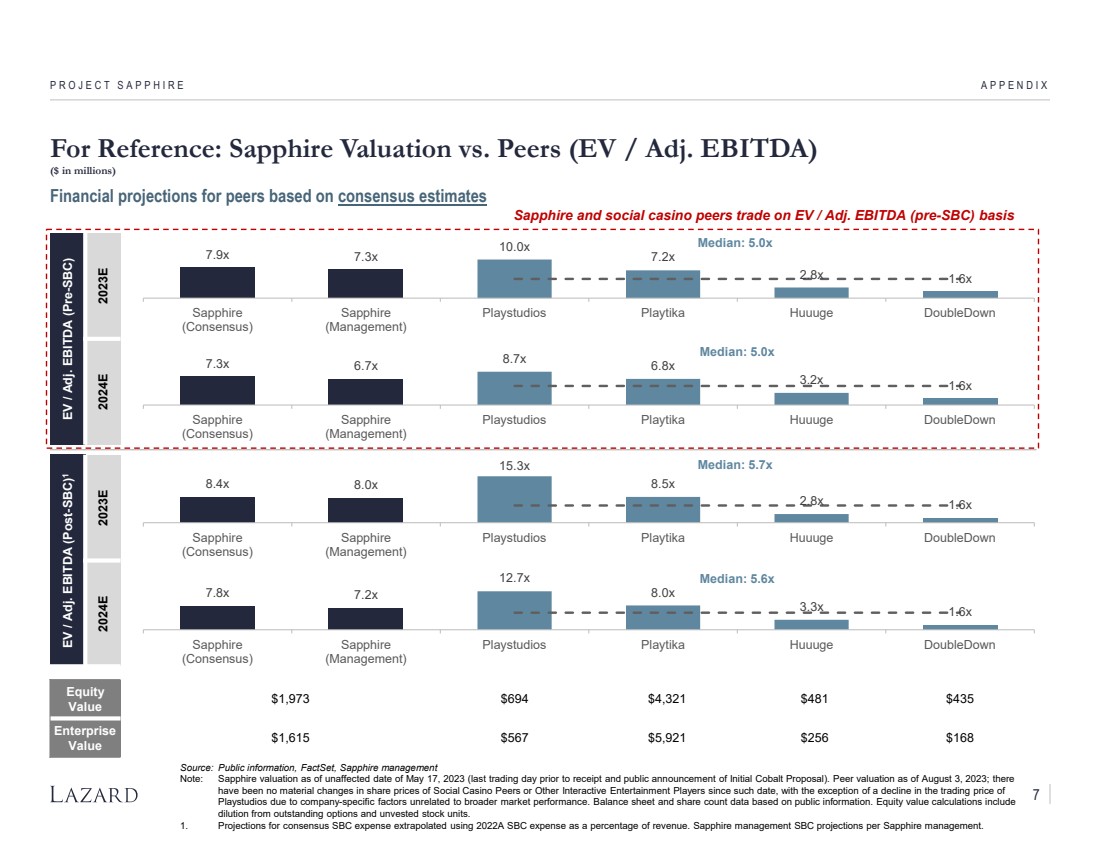
| Social Casino Peers
EV / Adj. EBITDA (Pre-SBC)
2023E 2024E
EV / Adj. EBITDA (Post-SBC)1
2023E 2024E
Equity
Value $1,973 $694 $4,321 $481 $435
Enterprise
Value $1,615 $567 $5,921 $256 $168
7.8x 7.2x
12.7x
8.0x
3.3x 1.6x
Median: 5.6x
Sapphire
(Consensus)
Sapphire
(Management)
Playstudios Playtika Huuuge DoubleDown
8.4x 8.0x
15.3x
8.5x
2.8x 1.6x
Median: 5.7x
Sapphire
(Consensus)
Sapphire
(Management)
Playstudios Playtika Huuuge DoubleDown
For Reference: Sapphire Valuation vs. Peers (EV / Adj. EBITDA)
($ in millions)
PROJECT SAPPHIRE APPENDIX
Source: Public information, FactSet, Sapphire management
Note: Sapphire valuation as of unaffected date of May 17, 2023 (last trading day prior to receipt and public announcement of Initial Cobalt Proposal). Peer valuation as of August 3, 2023; there
have been no material changes in share prices of Social Casino Peers or Other Interactive Entertainment Players since such date, with the exception of a decline in the trading price of
Playstudios due to company-specific factors unrelated to broader market performance. Balance sheet and share count data based on public information. Equity value calculations include
dilution from outstanding options and unvested stock units.
1. Projections for consensus SBC expense extrapolated using 2022A SBC expense as a percentage of revenue. Sapphire management SBC projections per Sapphire management.
Financial projections for peers based on consensus estimates
7.3x 6.7x 8.7x 6.8x
3.2x 1.6x
Median: 5.0x
Sapphire
(Consensus)
Sapphire
(Management)
Playstudios Playtika Huuuge DoubleDown
7.9x 7.3x
10.0x
7.2x
2.8x 1.6x
Median: 5.0x
Sapphire
(Consensus)
Sapphire
(Management)
Playstudios Playtika Huuuge DoubleDown
Sapphire and social casino peers trade on EV / Adj. EBITDA (pre-SBC) basis
7 |

| PROJECT SAPPHIRE APPENDIX
1. Source: Public information, FactSet as of August 3, 2023; there have been no material changes in share prices of Social Casino Peers or Other Interactive Entertainment Players since
such date, with the exception of a decline in the trading price of Playstudios due to company-specific factors unrelated to broader market performance.
2. Source: Barra (local predicted beta).
3. Unlevered Beta = Levered Beta / [1 + (1 - Tax Rate)(Debt / Equity)].
4. Levering Factor = [1 + (1 - Tax Rate)(Debt / Equity)].
5. Source: U.S. 10-Year Treasury Yield as of August 3, 2023.
6. Source: Kroll as of December 31, 2022. Represents large company stock total returns minus long-term government bond income returns.
7. Cost of Equity = (Risk-Free Rate of Return) + (Levered Beta)(Equity Risk Premium).
8. Weighted Average Cost of Capital = (After-Tax Cost of Debt)(Debt / Cap.) + (Cost of Equity)(Equity / Cap.).
Weighted Average Cost of Capital Analysis
Capital Structure Barra Predicted Beta
Market Debt/Cap Debt/Equity Levered Unlevered
Company Name Value1 Ratio Ratio Beta2 Beta3
Social Casino Peers
DoubleDown Interactive $435 8.1% 8.8% 0.704 0.660
Huuuge 481 2.7% 2.8% 0.582 0.569
Playstudios 694 - - 1.057 1.057
Playtika 4,321 35.9% 56.0% 1.390 0.993
Sapphire $2,499 - - 0.839 0.839
Sensitivity Range Implied WACC8
Assumptions Low High Low High
Unlevered Beta 0.839 0.569 1.057 8.1% 11.6%
Target Debt / Capitalization Ratio - - 20.0% 10.1% 10.6%
Target Debt / Equity Ratio -
Marginal Tax Rate 7.0%
Levering Factor4 1.000
Levered Beta 0.839 0.569 1.303
Risk-Free Rate of Return5 4.1%
Equity Risk Premium6 7.2%
Cost of Equity7 10.1%
Pre-Tax Cost of Debt 7.8%
WACC8 10.1%
Sapphire: WACC Analysis
($ in millions)
8 |

| Financial projections based on Sapphire Projections and extrapolations based on discussions with, and guidance from, Sapphire
management and approved for our use by the Sapphire special committee; discounted to June 30, 2023
Sapphire: Discounted Cash Flow Analysis
($ in millions, except per share data)
PROJECT SAPPHIRE APPENDIX
1
3
4
2
2
2
Source: Sapphire management, Sapphire Projections, Kroll, Barra, public information, FactSet
Note: Valuation and balance sheet date of June 30, 2023. Analysis based on net cash
balance of $395 million as of June 30, 2023, per Sapphire management. Basic shares
outstanding as of August 3, 2023, per Sapphire management. Fully diluted shares
outstanding includes unvested stock units as of August 3, 2023.
1. Normalized terminal year depreciation and amortization equal to CapEx.
2. Normalized structure and tax rate based on 2022 effective tax rate.
3. Normalized change in net working capital.
4. Assumes exit multiple range applied to estimated 2028E Adj. EBITDA (excluding SBC
expense) of $355 million (extrapolated based on discussions with, and guidance from,
Sapphire management and approved for our use by the Sapphire special committee).
9
Free Cash Flow
6 ME TV
12/2023E 12/2024E 12/2025E 12/2026E 12/2027E 12/2027E
Sales $377 $833 $912 $975 $1,027 $1,027
% Growth 10.6% 9.4% 7.0% 5.2% -
Adjusted EBITDA (excl. stock-based compensation) $107 $242 $278 $306 $332 $332
Stock-Based Compensation (4) (19) (20) (21) (22) (22)
Adjusted EBITDA (incl. stock-based compensation) $103 $223 $258 $285 $310 $310
% Margin 27.3% 26.8% 28.3% 29.3% 30.2% 30.2%
Depreciation & Amortization ($13) ($26) ($26) ($26) ($27) ($18)
Adjusted EBIT $90 $197 $232 $259 $283 $292
Tax Expense ($6) ($14) ($16) ($18) ($20) ($56)
Tax Rate 7.0% 7.0% 7.0% 7.0% 7.0% 19.0%
Unlevered Net Income $84 $184 $216 $241 $263 $237
Plus: Depreciation & Amortization $13 $26 $26 $26 $27 $18
Less: Change in Net Working Capital 6 - 1 2 4 -
Less: Capital Expenditures (7) (16) (16) (17) (18) (18)
Less: Payments on License Obligations (3) (5) (5) (5) (5) (5)
Less: TRA Payments (4) (4) (4) (4) (4) -
Less: Pari Passu Distributions to Cobalt (22) (25) (30) (34) (38) -
Unlevered Free Cash Flow $66 $159 $188 $210 $230 $232
Valuation Sensitivities
Discount PV of Future Terminal Value at Exit Multiple of: Enterprise Value at Exit Multiple of:
Rate Cash Flows 7.0x 8.0x 9.0x 7.0x 8.0x 9.0x
9.50% $687 $1,650 $1,886 $2,122 $2,337 $2,573 $2,809
10.00% 679 + 1,617 1,848 2,079 = 2,296 2,527 2,758
10.50% 672 1,584 1,811 2,037 2,257 2,483 2,709
Discount TV as % of EV at Exit Multiple of: Implied PGR at Exit Multiple of: Equity Value at Exit Multiple of:
Rate 7.0x 8.0x 9.0x 7.0x 8.0x 9.0x 7.0x 8.0x 9.0x
9.50% 70.6% 73.3% 75.6% 0.2% 1.2% 2.1% $2,732 $2,968 $3,204
10.00% 70.4% 73.1% 75.4% 0.6% 1.7% 2.6% 2,691 2,922 3,153
10.50% 70.2% 72.9% 75.2% 1.1% 2.2% 3.0% 2,652 2,878 3,104
Discount EV / 2023E AEBITDA at Exit Multiple of: EV / 2024E AEBITDA at Exit Multiple of: Value per Share at Exit Multiple of:
Rate 7.0x 8.0x 9.0x 7.0x 8.0x 9.0x 7.0x 8.0x 9.0x
9.50% 10.6x 11.7x 12.8x 9.7x 10.6x 11.6x $21.58 $23.44 $25.31
10.00% 10.4x 11.5x 12.5x 9.5x 10.4x 11.4x 21.26 23.09 24.91
10.50% 10.3x 11.3x 12.3x 9.3x 10.3x 11.2x 20.95 22.73 24.52 |

| Selected Precedent Transactions
($ in millions)
PROJECT SAPPHIRE APPENDIX
Source: Public information
Note: Financials converted to USD at spot rate as of announcement date. All figures based on financials as reported; not pro forma for acquisitions or divestitures. Multiples based on LTM Adj.
EBITDA pre-SBC, unless otherwise noted.
1. Represents upfront cash value; excludes contingent consideration tied to performance of Brainium following acquisition closing. Multiples based on 2022E Revenue and Adj. EBITDA, per
Playstudios investor presentation.
2. Value assuming Take-Two share price within collar range.
3. Transaction terminated.
4. EV / LTM Adj. EBITDA per Aristocrat investor presentation.
5. Initial acquisition of 80% of Reworks business for $400 million in cash with remaining 20% to be purchased for up to $200 million based on 2022 Reworks EBITDA; remaining 20% to
transfer to Playtika for $1 if 2022 EBITDA target not exceeded.
6. Adj. EBITDA not adjusted for SBC.
7. Upfront consideration of $363 million and maximum earn-out consideration of $1.015 billion.
8. Upfront consideration of $300 million and maximum earn-out consideration of $100 million.
Acquiror Target Announcement Date
Enterprise Value
(excl. / incl. Earn-Out) EV / Adj. EBITDA
Sega Rovio 4/17/2023 $599 9.5x
Savvy Games Group Scopely 4/5/2023 4,900 NA
Playstudios Brainium 10/13/2022 70 8.0x
Take-Two Zynga 1/10/2022 12,692 21.7x
Scopely GSN Games 10/18/2021 1,000 NA
Aristocrat Leisure Playtech 10/18/2021 3,675 11.4x
Playtika Reworks 8/31/2021 400 / 600 NA
Netmarble SpinX Games 8/2/2021 2,190 NA
Electronic Arts Playdemic 6/23/2021 1,400 NA
Bally's Corporation Gamesys Group 4/13/2021 3,189 11.1x
Electronic Arts Glu Mobile 2/8/2021 2,088 32.5x
Embracer Gearbox 2/3/2021 363 / 1,378 NA
Zynga Peak Games 6/1/2020 1,800 NA
Stillfront Storm8 1/21/2020 300 / 400 4.6x / 6.2x
1 1
2
3
6
5
7
8 6
4
10 |
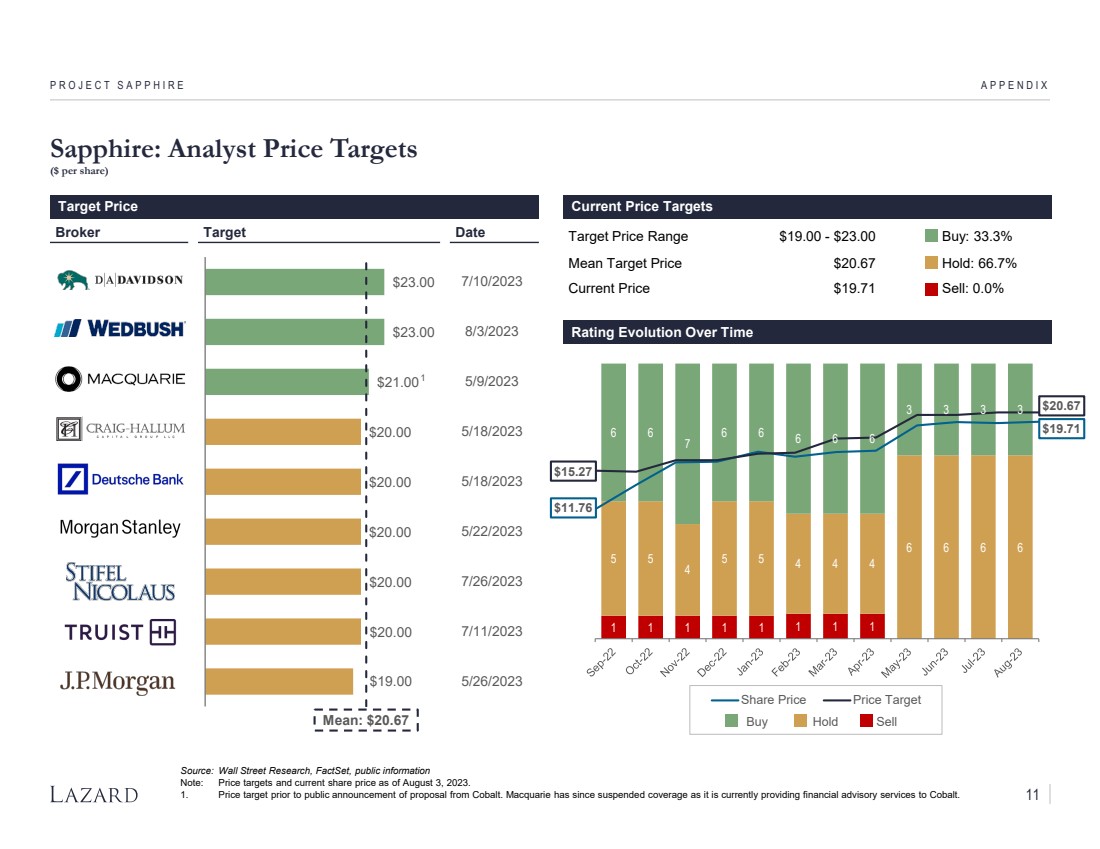
| $23.00
$23.00
$21.00
$20.00
$20.00
$20.00
$20.00
$20.00
$19.00
PROJECT SAPPHIRE APPENDIX
Sapphire: Analyst Price Targets
($ per share)
Target Price Range $19.00 - $23.00 Buy: 33.3%
Mean Target Price $20.67 Hold: 66.7%
Current Price $19.71 Sell: 0.0%
Broker Target Date
Target Price Current Price Targets
Rating Evolution Over Time
Mean: $20.67
1 1 1 1 1 1 1 1
5 5
4
5 5 4 4 4
6 6 6 6
6 6
7
6 6 6 6 6
3 3 3 3
Share Price Price Target
Buy Hold Sell
$15.27
$11.76
$20.67
$19.71
7/10/2023
8/3/2023
5/9/2023
5/18/2023
5/18/2023
5/22/2023
7/26/2023
7/11/2023
5/26/2023
1
Source: Wall Street Research, FactSet, public information
Note: Price targets and current share price as of August 3, 2023.
1. Price target prior to public announcement of proposal from Cobalt. Macquarie has since suspended coverage as it is currently providing financial advisory services to Cobalt. 11 |

| APPENDIX
Sapphire’s Top 25 Shareholders
($ in millions, positions in thousands)
Source: FactSet as of August 3, 2023
Note: Ownership stake based on basic shares outstanding, consolidated across funds. Ownership stake based on Sapphire Class A shares only, based on latest publicly available
information.
PROJECT SAPPHIRE
# Shareholder
Ownership Stake and
Cumulative Holdings
Current
Position
Current
Market Value
1yr ∆
in % O/S
1 Vanguard 1,922 $38 +0.9%
2 Antara Capital 1,486 29 +5.3%
3 Citigroup 1,407 28 +4.6%
4 Mangrove Partners 1,177 23 +1.5%
5 Manulife Asset Management 1,152 23 +5.4%
6 Jane Street Group 739 15 +1.3%
7 Renaissance Technologies 672 13 +0.6%
8 GFH HFEVA 652 13 +1.0%
9 Morgan Stanley 652 13 +1.4%
10 Millennium Management 619 12 +2.2%
11 Bank of America 605 12 (0.4%)
12 Caledonia Holdings 566 11 (4.3%)
13 Franklin Resources 432 9 +0.5%
14 Schroders 427 8 +1.9%
15 Anqa Management 421 8 (0.3%)
16 Arrowstreet Capital Holding 420 8 +2.0%
17 BlackRock 397 8 +0.3%
18 Engine Capital Management 385 8 (5.5%)
19 Hillsdale Investment Management 372 7 +0.1%
20 Dimensional 326 6 +0.2%
21 Barry Cottle 318 6 +0.2%
22 UBS 303 6 (0.1%)
23 Carlson Capital 295 6 (2.2%)
24 Two Sigma Investments 285 6 +0.7%
25 Geode Capital Management 283 6 +0.1%
9.0%
7.0%
6.6%
5.5%
5.4%
3.5%
3.2%
3.1%
3.1%
2.9%
2.8%
2.7%
2.0%
2.0%
2.0%
2.0%
1.9%
1.8%
1.8%
1.5%
1.5%
1.4%
1.4%
1.3%
1.3%
9.0%
16.0%
22.7%
28.2%
33.6%
37.1%
40.3%
43.3%
46.4%
49.3%
52.2%
54.8%
56.9%
58.9%
60.9%
62.8%
64.7%
66.5%
68.3%
69.8%
71.3%
72.7%
74.1%
75.5%
76.8%
Top 5
Top 10
Top 15
Top 20
Top 25
12 |
Exhibit (c)(8)
| Strictly confidential | © Macquarie Group Limited 1
Preliminary Draft; Subject to Continued Review and Revision
Project Bern
May 17, 2023
Discussion Materials |
| Strictly confidential | © Macquarie Group Limited 2
Preliminary Draft; Subject to Continued Review and Revision
Important Notice and Disclaimer
The following presentation contains material provided to the Board of Directors (the “Board”) of Light & Wonder, Inc. (the “Company”) by Macquarie Capital
(USA) Inc. (“Macquarie Capital”) in connection with the acquisition of SciPlay Corporation (“Bern”).
This presentation was prepared on a confidential basis in connection with an oral presentation to the Board and not with a view toward complying with the
disclosure standards under federal or state securities laws. This presentation is solely for use of the Board and may not be used for any other purpose or
disclosed to any party without Macquarie Capital’s prior written consent.
The information provided herein comes or has been derived from several sources, but Macquarie Capital does not warrant its accuracy or completeness. In
preparing these materials, Macquarie Capital has relied upon and assumed, without independent verification, the accuracy and completeness of all
information available from public sources. Without limiting the generality of the foregoing, no audit or review has been undertaken by an independent third
party of the financial assumptions, data, results, calculations and forecasts contained, presented or referred to in this presentation. You should conduct your
own independent investigation and assessment as to the validity of the information contained in this presentation and the economic, financial, regulatory,
legal, tax, investment and accounting implications of that information. Macquarie Capital, its affiliates and any of its and their respective employees,
directors, officers, contractors, consultants, advisors, members, successors, representatives and agents make no representation or warranty as to the
accuracy or completeness of the information contained in this presentation, and take no responsibility under any circumstances for any loss or damage
suffered as a result of any omission, inadequacy, or inaccuracy in this presentation.
Neither Macquarie Capital nor any of its affiliates is an advisor as to regulatory, legal, tax, investment or accounting matters in any jurisdiction. Any recipient
of the information contained herein should seek advice from its own independent tax advisor, legal counsel and/or other advisor with respect to such
matters. These materials are not and should not be construed as a fairness opinion.
Macquarie Capital is not an authorized deposit-taking institution for the purposes of the Banking Act 1959 (Commonwealth of Australia). The obligations of
Macquarie Capital do not represent deposits or other liabilities of Macquarie Bank Limited ABN 46 008 583 542 (“MBL”). MBL does not guarantee or otherwise
provide assurance in respect of the obligations of Macquarie Capital.
© 2023 Macquarie Capital (USA) Inc. |
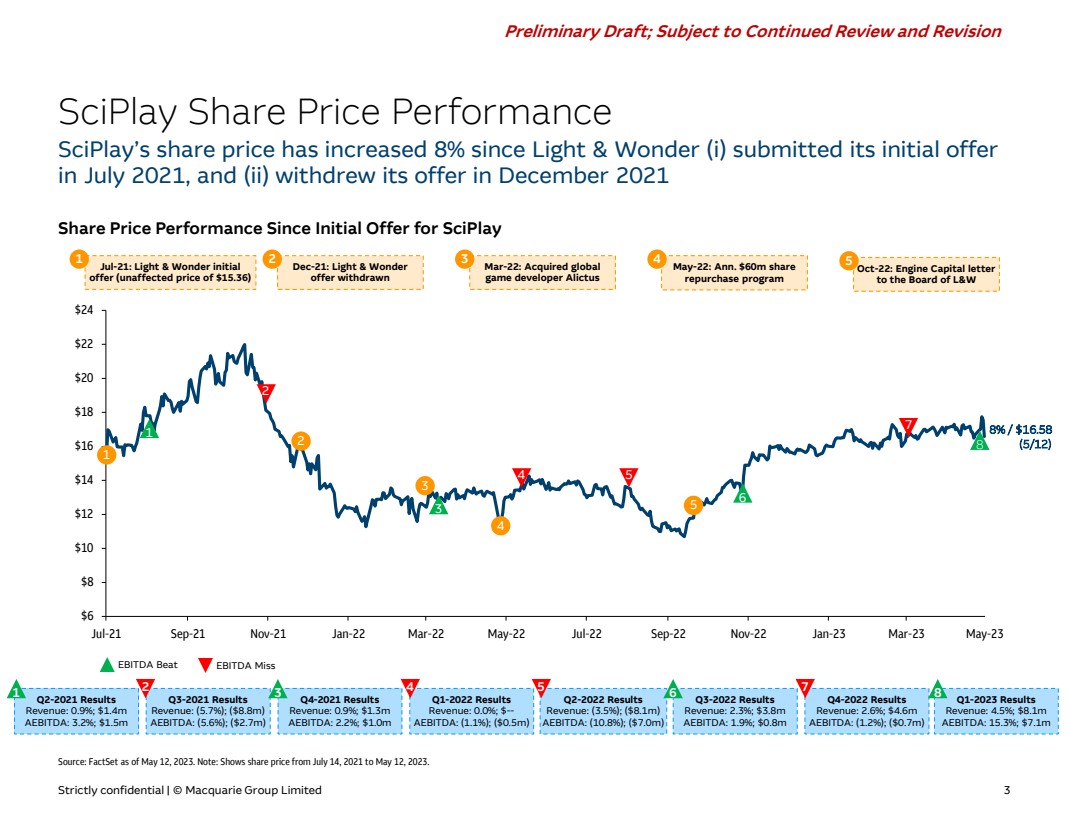
| Strictly confidential | © Macquarie Group Limited 3
Preliminary Draft; Subject to Continued Review and Revision
$6
$8
$10
$12
$14
$16
$18
$20
$22
$24
Jul-21 Sep-21 Nov-21 Jan-22 Mar-22 May-22 Jul-22 Sep-22 Nov-22 Jan-23 Mar-23
SciPlay Share Price Performance
SciPlay’s share price has increased 8% since Light & Wonder (i) submitted its initial offer
in July 2021, and (ii) withdrew its offer in December 2021
Share Price Performance Since Initial Offer for SciPlay
Source: FactSet as of May 12, 2023. Note: Shows share price from July 14, 2021 to May 12, 2023.
Dec-21: Light & Wonder
offer withdrawn
2 Mar-22: Acquired global
game developer Alictus
3 May-22: Ann. $60m share
repurchase program
4
Oct-22: Engine Capital letter
to the Board of L&W
5 Jul-21: Light & Wonder initial
offer (unaffected price of $15.36)
1
EBITDA Beat EBITDA Miss
Q2-2021 Results
Revenue: 0.9%; $1.4m
AEBITDA: 3.2%; $1.5m
Q3-2021 Results
Revenue: (5.7%); ($8.8m)
AEBITDA: (5.6%); ($2.7m)
Q4-2021 Results
Revenue: 0.9%; $1.3m
AEBITDA: 2.2%; $1.0m
Q1-2022 Results
Revenue: 0.0%; $--
AEBITDA: (1.1%); ($0.5m)
Q2-2022 Results
Revenue: (3.5%); ($8.1m)
AEBITDA: (10.8%); ($7.0m)
Q3-2022 Results
Revenue: 2.3%; $3.8m
AEBITDA: 1.9%; $0.8m
1 3 6 2 4 5
Q4-2022 Results
Revenue: 2.6%; $4.6m
AEBITDA: (1.2%); ($0.7m)
7
Q1-2023 Results
Revenue: 4.5%; $8.1m
AEBITDA: 15.3%; $7.1m
8
1
3
6
8% / $16.58
3
4
2
5
1
2
4 5
7
8 (5/12)
May-23 |
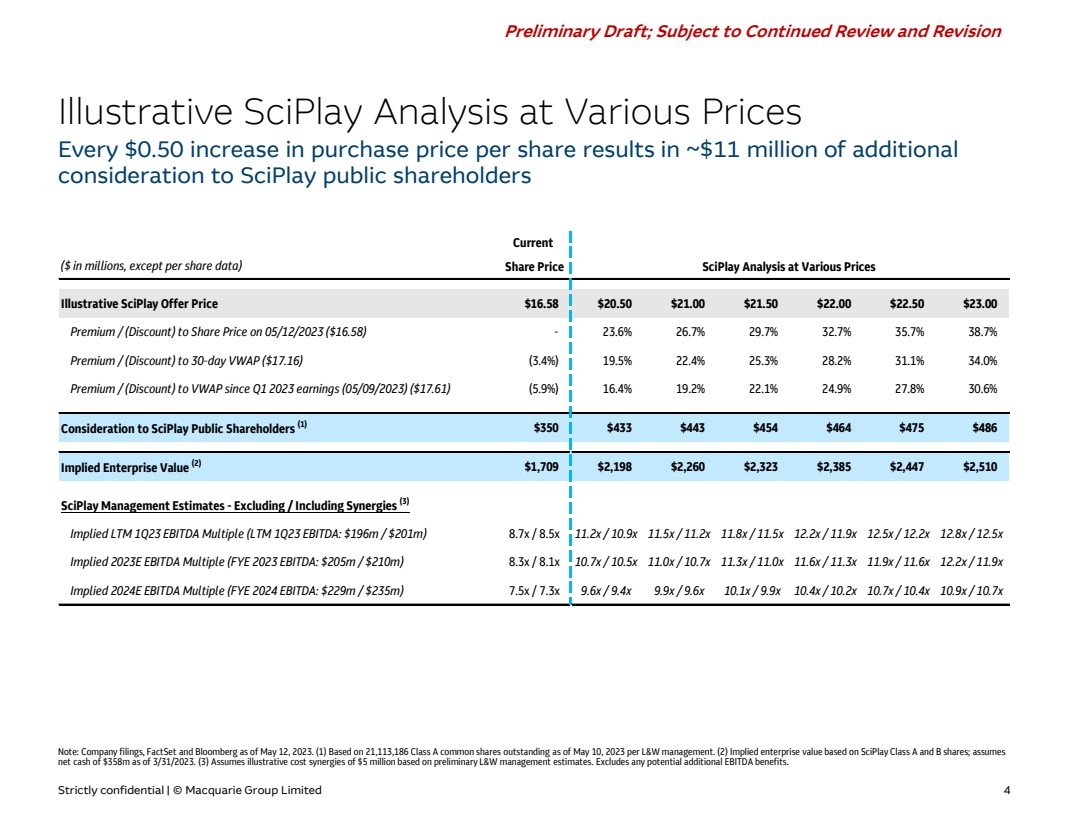
| Strictly confidential | © Macquarie Group Limited 4
Preliminary Draft; Subject to Continued Review and Revision
Illustrative SciPlay Analysis at Various Prices
Note: Company filings, FactSet and Bloomberg as of May 12, 2023. (1) Based on 21,113,186 Class A common shares outstanding as of May 10, 2023 per L&W management. (2) Implied enterprise value based on SciPlay Class A and B shares; assumes
net cash of $358m as of 3/31/2023. (3) Assumes illustrative cost synergies of $5 million based on preliminary L&W management estimates. Excludes any potential additional EBITDA benefits.
Every $0.50 increase in purchase price per share results in ~$11 million of additional
consideration to SciPlay public shareholders
Current
($ in millions, except per share data) Share Price SciPlay Analysis at Various Prices
Illustrative SciPlay Offer Price $16.58 $20.50 $21.00 $21.50 $22.00 $22.50 $23.00
Premium / (Discount) to Share Price on 05/12/2023 ($16.58) - 23.6% 26.7% 29.7% 32.7% 35.7% 38.7%
Premium / (Discount) to 30-day VWAP ($17.16) (3.4%) 19.5% 22.4% 25.3% 28.2% 31.1% 34.0%
Premium / (Discount) to VWAP since Q1 2023 earnings (05/09/2023) ($17.61) (5.9%) 16.4% 19.2% 22.1% 24.9% 27.8% 30.6%
Consideration to SciPlay Public Shareholders (1) $350 $433 $443 $454 $464 $475 $486
Implied Enterprise Value (2) $1,709 $2,198 $2,260 $2,323 $2,385 $2,447 $2,510
SciPlay Management Estimates - Excluding / Including Synergies (3)
Implied LTM 1Q23 EBITDA Multiple (LTM 1Q23 EBITDA: $196m / $201m) 8.7x / 8.5x 11.2x / 10.9x 11.5x / 11.2x 11.8x / 11.5x 12.2x / 11.9x 12.5x / 12.2x 12.8x / 12.5x
Implied 2023E EBITDA Multiple (FYE 2023 EBITDA: $205m / $210m) 8.3x / 8.1x 10.7x / 10.5x 11.0x / 10.7x 11.3x / 11.0x 11.6x / 11.3x 11.9x / 11.6x 12.2x / 11.9x
Implied 2024E EBITDA Multiple (FYE 2024 EBITDA: $229m / $235m) 7.5x / 7.3x 9.6x / 9.4x 9.9x / 9.6x 10.1x / 9.9x 10.4x / 10.2x 10.7x / 10.4x 10.9x / 10.7x |
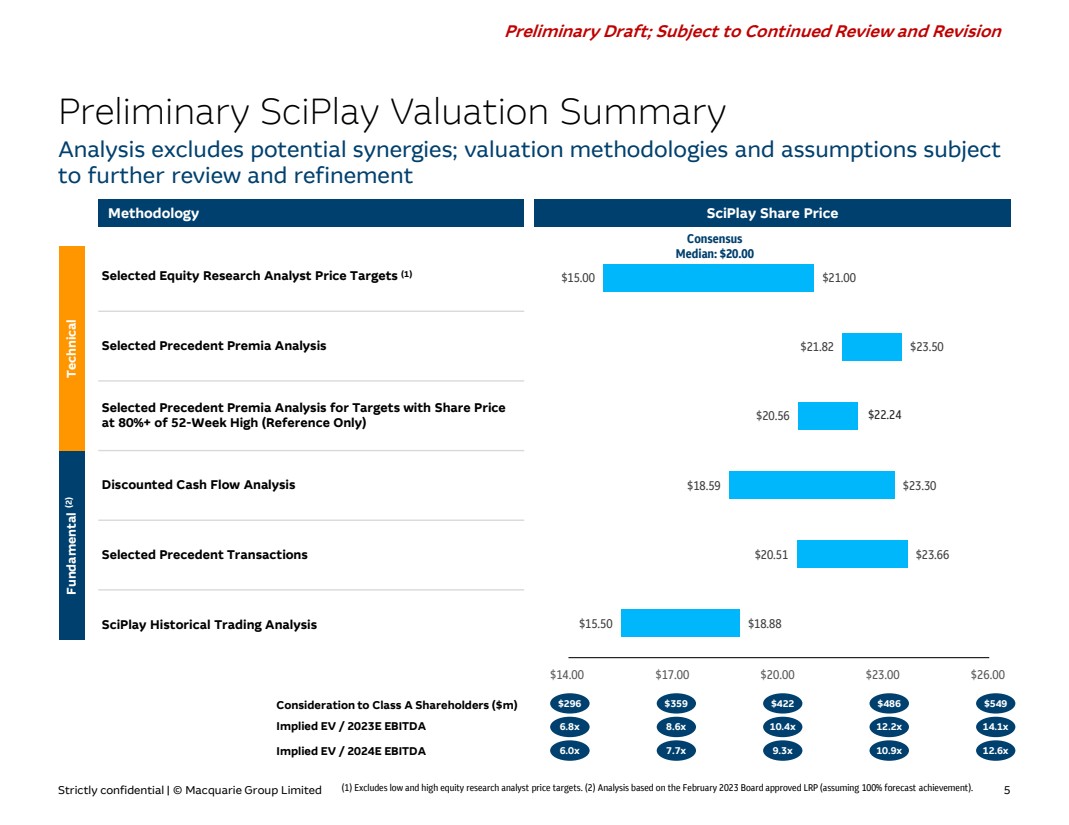
| Strictly confidential | © Macquarie Group Limited 5
Preliminary Draft; Subject to Continued Review and Revision
$15.50
$20.51
$18.59
$20.56
$21.82
$15.00
$18.88
$23.66
$23.30
$22.89
$23.50
$21.00
$14.00 $17.00 $20.00 $23.00 $26.00
Preliminary SciPlay Valuation Summary
Selected Equity Research Analyst Price Targets (1)
Selected Precedent Premia Analysis
Selected Precedent Premia Analysis for Targets with Share Price
at 80%+ of 52-Week High (Reference Only)
Discounted Cash Flow Analysis
Selected Precedent Transactions
SciPlay Historical Trading Analysis
Methodology SciPlay Share Price
Technical Fundamental (2)
Consideration to Class A Shareholders ($m)
Implied EV / 2024E EBITDA
Implied EV / 2023E EBITDA
Consensus
Median: $20.00
$422 $549
10.4x
9.3x
14.1x
12.6x
$486
12.2x
10.9x
$359
8.6x
7.7x
$296
6.8x
6.0x
Analysis excludes potential synergies; valuation methodologies and assumptions subject
to further review and refinement
(1) Excludes low and high equity research analyst price targets. (2) Analysis based on the February 2023 Board approved LRP (assuming 100% forecast achievement).
$22.24 |

| Strictly confidential | © Macquarie Group Limited 6
Preliminary Draft; Subject to Continued Review and Revision
Median consensus price target of $20.00 represents a 20.6% (1) premium to current share price
Selected SciPlay Equity Research Perspectives
Note: Includes selected equity research analyst reports published post Q1 2023 earnings. (1) Based on May 12, 2023 closing price of $16.58. (2) March 2022 price target based on research published post Q1 2022 earnings.
(2) (1)
($ in millions, except per share data) Date of Price Target Premium / Revenue Adjusted EBITDA
Firm Report Rating Mar-22 Current Δ (Discount) 2023E 2024E 2023E 2024E
Goldman Sachs 5/11/23 Buy NA $22.00 NA 32.7% $730 $770 $201 $224
BofA Securities 5/11/23 Underperform 10.00 12.00 20.0% (27.6%) 680 707 175 202
Craig Hallum 5/10/23 Buy 14.50 20.00 37.9% 20.6% 725 752 203 220
Macquarie Research 5/10/23 Outperform 14.00 21.00 50.0% 26.7% 730 751 204 224
DA Davidson 5/10/23 Buy 14.00 20.00 42.9% 20.6% 735 765 206 220
Deutsche Bank 5/10/23 Buy 13.00 21.00 61.5% 26.7% 735 759 213 222
Stifel Nicolaus 5/10/23 Hold NA 19.00 NA 14.6% 732 758 205 217
Morgan Stanley 5/10/23 Neutral 16.00 15.00 (6.3%) (9.5%) 693 714 191 198
Consensus Median $14.00 $20.00 40.4% 20.6% $730 $755 $204 $220
Consensus Mean $13.58 $18.75 34.3% 13.1% $720 $747 $200 $216 |
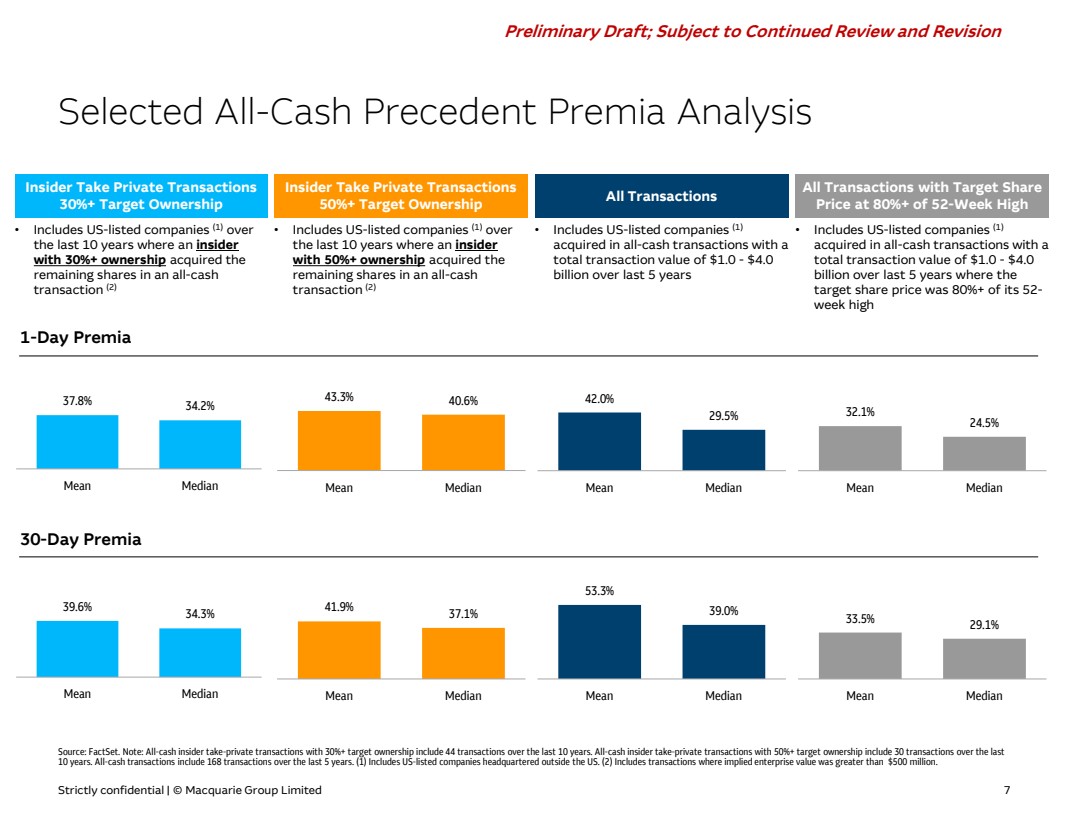
| Strictly confidential | © Macquarie Group Limited 7
Preliminary Draft; Subject to Continued Review and Revision
32.1%
24.5%
Mean Median
33.5% 29.1%
Mean Median
Selected All-Cash Precedent Premia Analysis
Source: FactSet. Note: All-cash insider take-private transactions with 30%+ target ownership include 44 transactions over the last 10 years. All-cash insider take-private transactions with 50%+ target ownership include 30 transactions over the last
10 years. All-cash transactions include 168 transactions over the last 5 years. (1) Includes US-listed companies headquartered outside the US. (2) Includes transactions where implied enterprise value was greater than $500 million.
30-Day Premia
1-Day Premia
Insider Take Private Transactions
30%+ Target Ownership
• Includes US-listed companies (1) over
the last 10 years where an insider
with 30%+ ownership acquired the
remaining shares in an all-cash
transaction (2)
37.8% 34.2%
Mean Median
39.6% 34.3%
Mean Median
All Transactions
• Includes US-listed companies (1)
acquired in all-cash transactions with a
total transaction value of $1.0 - $4.0
billion over last 5 years
42.0%
29.5%
Mean Median
53.3%
39.0%
Mean Median
Insider Take Private Transactions
50%+ Target Ownership
• Includes US-listed companies (1) over
the last 10 years where an insider
with 50%+ ownership acquired the
remaining shares in an all-cash
transaction (2)
43.3% 40.6%
Mean Median
41.9% 37.1%
Mean Median
All Transactions with Target Share
Price at 80%+ of 52-Week High
• Includes US-listed companies (1)
acquired in all-cash transactions with a
total transaction value of $1.0 - $4.0
billion over last 5 years where the
target share price was 80%+ of its 52-
week high |
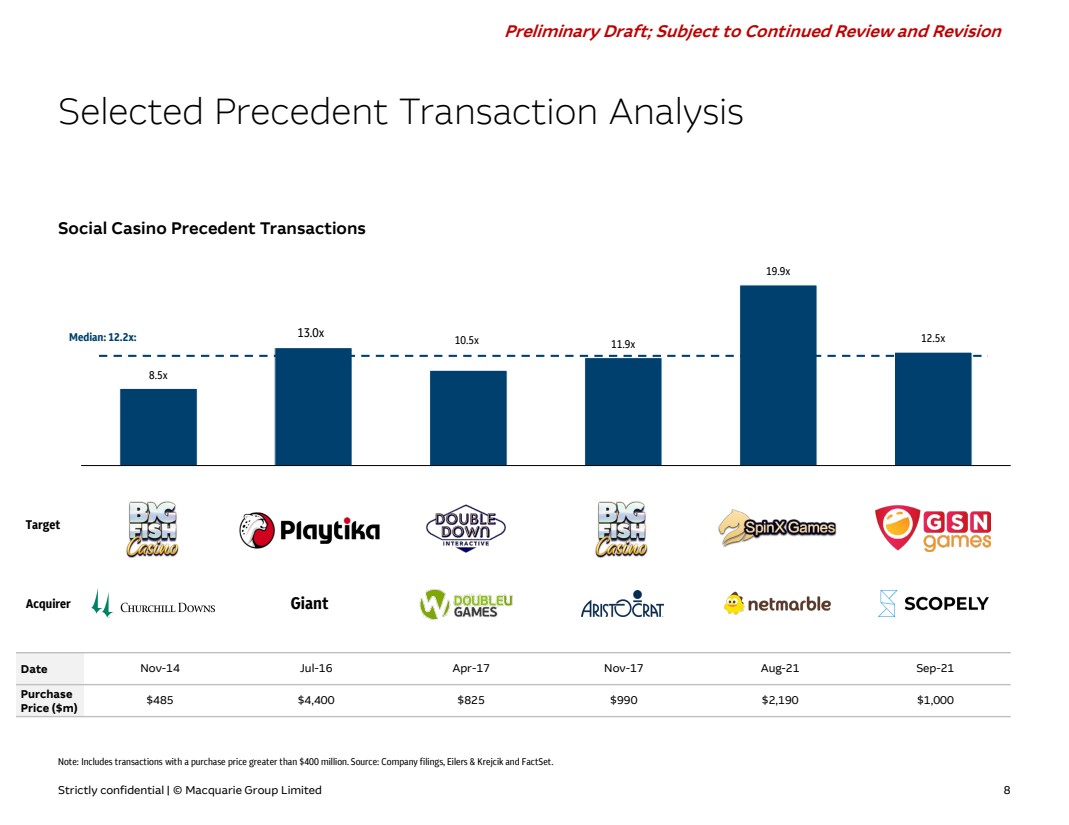
| Strictly confidential | © Macquarie Group Limited 8
Preliminary Draft; Subject to Continued Review and Revision
8.5x
10.5x 11.9x
19.9x
12.5x
Selected Precedent Transaction Analysis
Note: Includes transactions with a purchase price greater than $400 million. Source: Company filings, Eilers & Krejcik and FactSet.
Target
Acquirer Giant
Median: 12.2x:
Date Nov-14 Jul-16 Apr-17 Nov-17 Aug-21 Sep-21
Purchase
Price ($m) $485 $4,400 $825 $990 $2,190 $1,000
13.0x
Social Casino Precedent Transactions |

| Strictly confidential | © Macquarie Group Limited 9
Preliminary Draft; Subject to Continued Review and Revision
4.0x
6.0x
8.0x
10.0x
12.0x
14.0x
16.0x
May-19 Aug-19 Oct-19 Jan-20 Apr-20 Jul-20 Oct-20 Jan-21 Apr-21 Jul-21 Oct-21 Jan-22 Apr-22 Jul-22 Oct-22 Jan-23 Apr-23
Bern Average Average Since Q3 2022 Earnings
L&W submitted its initial offer on July 15,
2021 (pre-market) and withdrew it on
December 22, 2021 (post-market)
SciPlay Historical Trading Analysis
Average EV / NTM AEBITDA of 8.5x excludes period during which L&W’s initial offer was
outstanding
SciPlay EV / NTM AEBITDA Since IPO
Source: FactSet and public filings as of May 12, 2023.
8.2x
8.5x
8.5x |
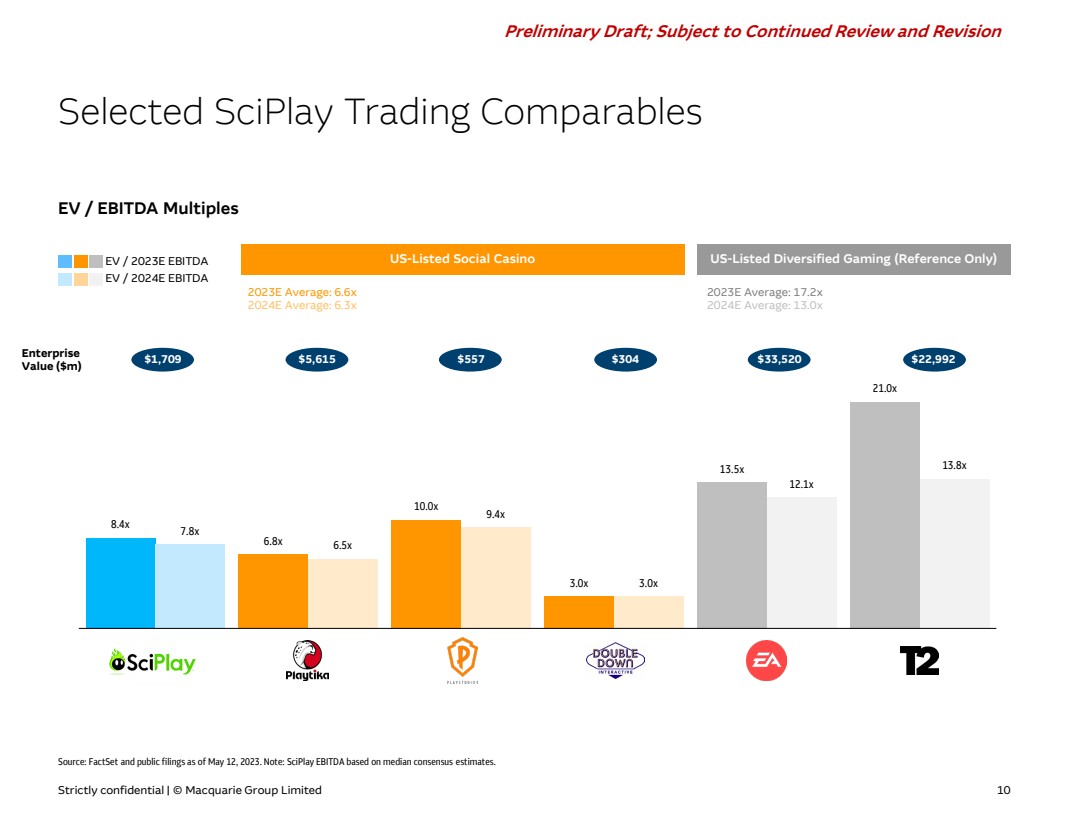
| Strictly confidential | © Macquarie Group Limited 10
Preliminary Draft; Subject to Continued Review and Revision
8.4x
6.8x
10.0x
3.0x
13.5x
21.0x
7.8x
6.5x
9.4x
3.0x
12.1x
13.8x
Selected SciPlay Trading Comparables
Source: FactSet and public filings as of May 12, 2023. Note: SciPlay EBITDA based on median consensus estimates.
Enterprise
Value ($m) $1,709 $5,615 $557 $304 $33,520 $22,992
EV / 2023E EBITDA US-Listed Social Casino US-Listed Diversified Gaming (Reference Only)
EV / 2024E EBITDA
2023E Average: 6.6x
2024E Average: 6.3x
2023E Average: 17.2x
2024E Average: 13.0x
EV / EBITDA Multiples |
Exhibit (c)(9)
| Strictly confidential | © Macquarie Group Limited 1
Preliminary Draft; Subject to Continued Review and Revision
Project Bern
August 3, 2023
Discussion Materials for the Board of
Light & Wonder, Inc. |
| Strictly confidential | © Macquarie Group Limited 2
Preliminary Draft; Subject to Continued Review and Revision
Important Notice and Disclaimer
“Macquarie Capital” refers to Macquarie Corporate Holdings Pty Limited and its worldwide direct and indirect subsidiaries. Macquarie Corporate Holdings Pty
Limited is an indirect, wholly-owned subsidiary of Macquarie Group Limited.
The following presentation contains material provided to the Board of Directors (the “Board”) of Light & Wonder, Inc. (“Light & Wonder”, the “Company”) by
Macquarie Capital in connection with the acquisition of the publicly held shares of SciPlay Corporation (“Bern”).
This presentation was prepared on a confidential basis in connection with an oral presentation to the Board and not with a view toward complying with the
disclosure standards under federal or state securities laws. This presentation is for use of the Board and may not be used for any other purpose or disclosed
to any party without Macquarie Capital’s prior written consent.
The information provided herein comes or has been derived from several sources, but Macquarie Capital does not warrant its accuracy or completeness. In
preparing these materials, Macquarie Capital has relied upon and assumed, without independent verification, the accuracy and completeness of all
information available from public sources. Without limiting the generality of the foregoing, no audit or review has been undertaken by an independent third
party of the financial assumptions, data, results, calculations and forecasts contained, presented or referred to in this presentation. You should conduct your
own independent investigation and assessment as to the validity of the information contained in this presentation and the economic, financial, regulatory,
legal, tax, investment and accounting implications of that information. Macquarie Capital, its affiliates and any of its and their respective employees,
directors, officers, contractors, consultants, advisors, members, successors, representatives and agents make no representation or warranty as to the
accuracy or completeness of the information contained in this presentation, and take no responsibility under any circumstances for any loss or damage
suffered as a result of any omission, inadequacy, or inaccuracy in this presentation.
This presentation includes preliminary financial analysis and does not constitute a fairness opinion of Macquarie Capital as to the value of Bern, and as such,
should not be relied on by the Company or by any other person as such.
Neither Macquarie Capital nor any of its affiliates is an advisor as to regulatory, legal, tax, investment or accounting matters in any jurisdiction. Any recipient
of the information contained herein should seek advice from its own independent tax advisor, legal counsel and/or other advisor with respect to such
matters.
Macquarie Capital is not an authorized deposit-taking institution for the purposes of the Banking Act 1959 (Commonwealth of Australia). The obligations of
Macquarie Capital do not represent deposits or other liabilities of Macquarie Bank Limited ABN 46 008 583 542 (“MBL”). MBL does not guarantee or otherwise
provide assurance in respect of the obligations of Macquarie Capital.
© 2023 Macquarie Capital (USA) Inc. |
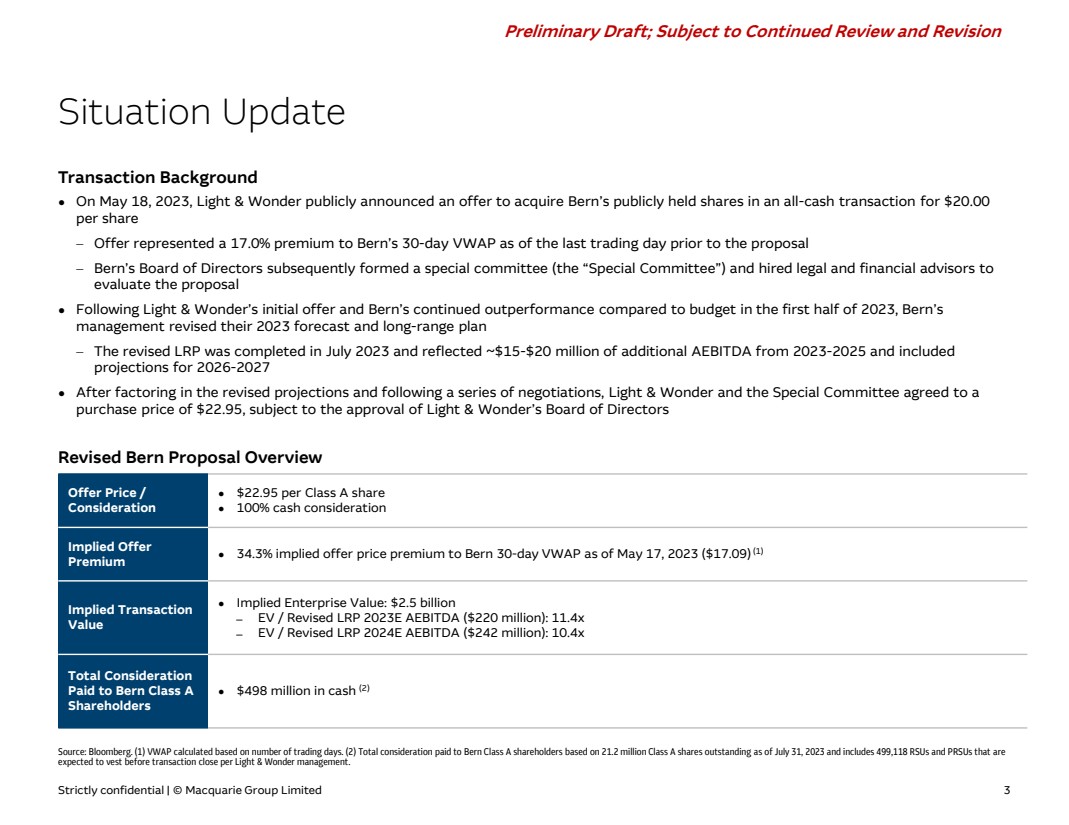
| Strictly confidential | © Macquarie Group Limited 3
Preliminary Draft; Subject to Continued Review and Revision
● On May 18, 2023, Light & Wonder publicly announced an offer to acquire Bern’s publicly held shares in an all-cash transaction for $20.00
per share
− Offer represented a 17.0% premium to Bern’s 30-day VWAP as of the last trading day prior to the proposal
− Bern’s Board of Directors subsequently formed a special committee (the “Special Committee”) and hired legal and financial advisors to
evaluate the proposal
● Following Light & Wonder’s initial offer and Bern’s continued outperformance compared to budget in the first half of 2023, Bern’s
management revised their 2023 forecast and long-range plan
− The revised LRP was completed in July 2023 and reflected ~$15-$20 million of additional AEBITDA from 2023-2025 and included
projections for 2026-2027
● After factoring in the revised projections and following a series of negotiations, Light & Wonder and the Special Committee agreed to a
purchase price of $22.95, subject to the approval of Light & Wonder’s Board of Directors
Situation Update
Revised Bern Proposal Overview
Source: Bloomberg. (1) VWAP calculated based on number of trading days. (2) Total consideration paid to Bern Class A shareholders based on 21.2 million Class A shares outstanding as of July 31, 2023 and includes 499,118 RSUs and PRSUs that are
expected to vest before transaction close per Light & Wonder management.
Transaction Background
Offer Price /
Consideration
● $22.95 per Class A share
● 100% cash consideration
Implied Offer
Premium ● 34.3% implied offer price premium to Bern 30-day VWAP as of May 17, 2023 ($17.09)(1)
Implied Transaction
Value
● Implied Enterprise Value: $2.5 billion
̶ EV / Revised LRP 2023E AEBITDA ($220 million): 11.4x
̶ EV / Revised LRP 2024E AEBITDA ($242 million): 10.4x
Total Consideration
Paid to Bern Class A
Shareholders
● $498 million in cash (2) |

| Strictly confidential | © Macquarie Group Limited 4
Preliminary Draft; Subject to Continued Review and Revision
$729 $803
$882
NA NA
$754
$833
$912 $975 $1,027
2023E 2024E 2025E 2026E 2027E
Bern Financial Comparison
AEBITDA
Revenue ’23E – ’25E
CAGR:
Margins:
’23E – ’27E
CAGR:
($ in millions)
28%
10.0% NA
11.9% NA
Revised Bern LRP (July 2023)
Comparison of Bern’s July 2023 Revised LRP to March 2023 LRP
29% 29% 29% 29% 30%
12.4% 10.8%
10.0% 8.0%
Prior Bern LRP (March 2023)
($ in millions)
’23E – ’25E
CAGR:
’23E – ’27E
CAGR:
$205
$229
$257
NA NA
$220 $242
$278
$306
$332
2023E 2024E 2025E 2026E 2027E
31% 32%
+3.4% +3.8%
+3.3%
+7.2% +5.4%
+8.1% |
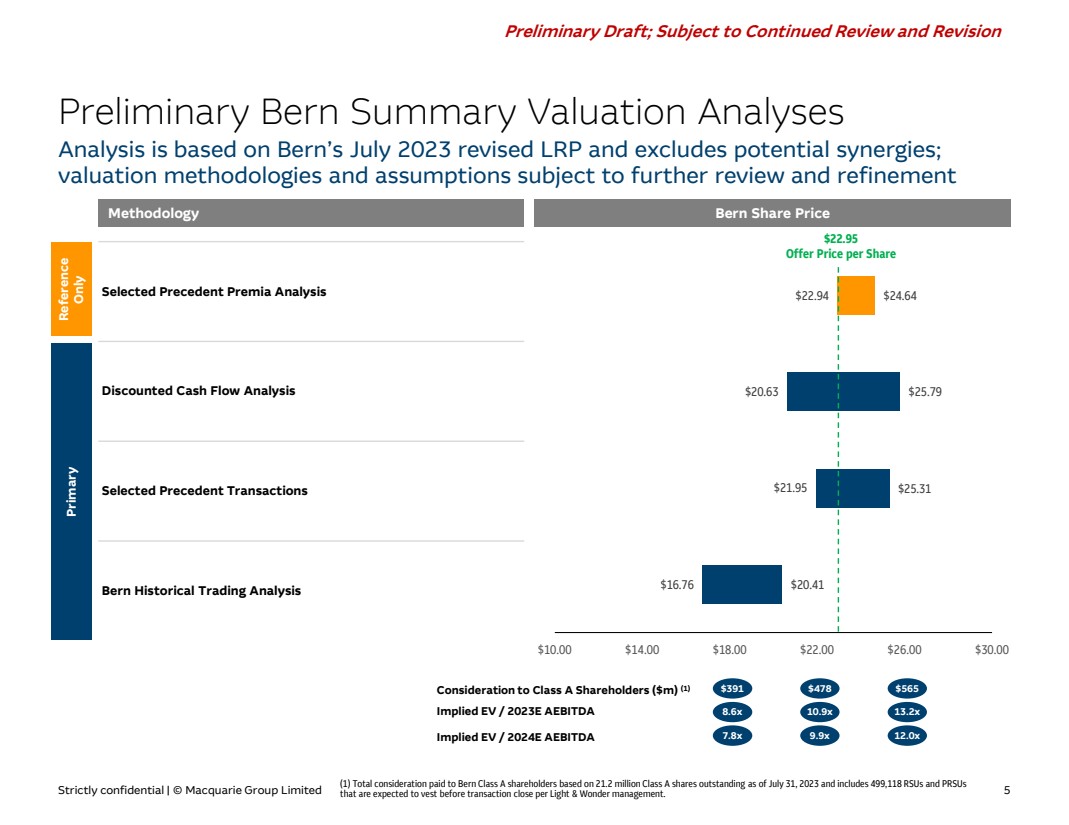
| Strictly confidential | © Macquarie Group Limited 5
Preliminary Draft; Subject to Continued Review and Revision
Selected Precedent Premia Analysis
Discounted Cash Flow Analysis
Selected Precedent Transactions
Bern Historical Trading Analysis
Preliminary Bern Summary Valuation Analyses
Methodology Bern Share Price
Reference
Only Primary
Consideration to Class A Shareholders ($m) (1)
Implied EV / 2024E AEBITDA
Implied EV / 2023E AEBITDA
$478
10.9x
9.9x
$565
13.2x
12.0x
$391
8.6x
7.8x
Analysis is based on Bern’s July 2023 revised LRP and excludes potential synergies;
valuation methodologies and assumptions subject to further review and refinement
(1) Total consideration paid to Bern Class A shareholders based on 21.2 million Class A shares outstanding as of July 31, 2023 and includes 499,118 RSUs and PRSUs
that are expected to vest before transaction close per Light & Wonder management.
$16.76
$21.95
$20.63
$22.94
$20.41
$25.31
$25.79
$24.64
$10.00 $14.00 $18.00 $22.00 $26.00 $30.00
$22.95
Offer Price per Share |

| Strictly confidential | © Macquarie Group Limited 6
Preliminary Draft; Subject to Continued Review and Revision
8.5x
10.5x 11.9x
19.9x
12.5x
Selected Precedent Transaction Analysis
Note: Analysis includes transactions with a purchase price greater than $400 million; purchase price excludes earnout consideration. Source: Company filings, Eilers & Krejcik and FactSet.
Target
Acquirer Giant
Median: 12.2x:
Date Nov-14 Jul-16 Apr-17 Nov-17 Aug-21 Sep-21
Purchase
Price ($m) $485 $4,400 $825 $990 $2,190 $1,000
13.0x
Social Casino Precedent Transactions – EV / LTM EBITDA Multiples |
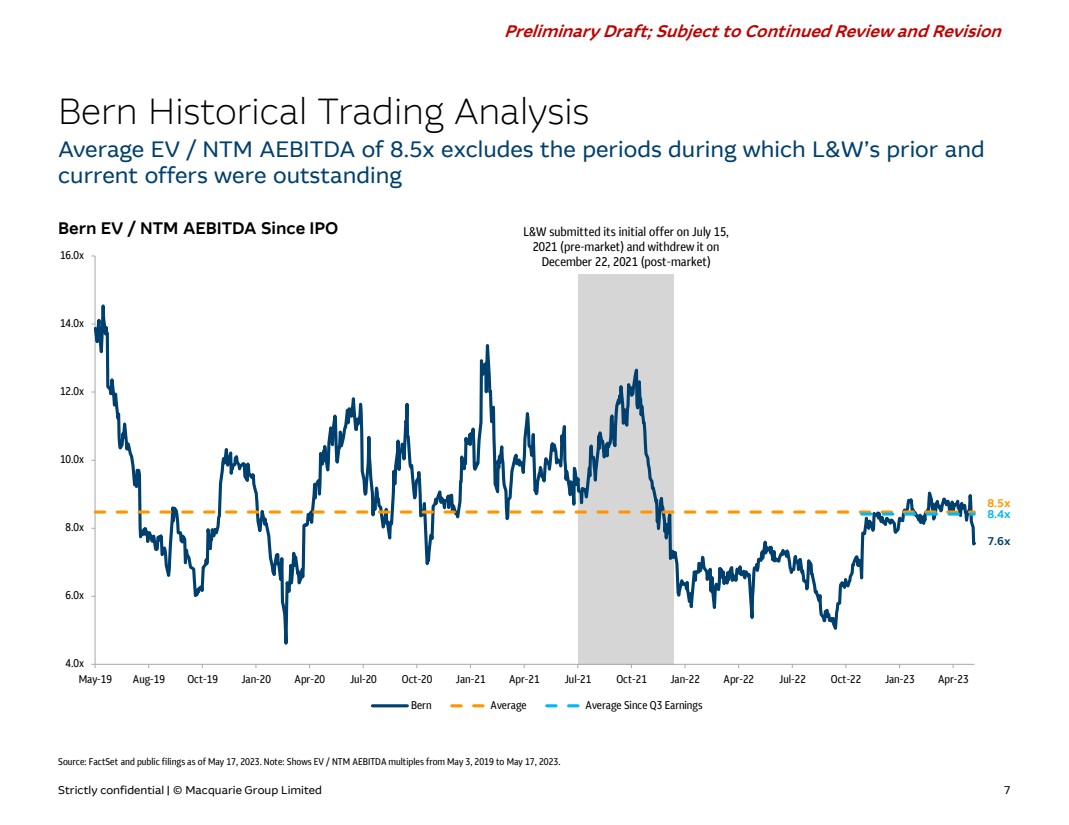
| Strictly confidential | © Macquarie Group Limited 7
Preliminary Draft; Subject to Continued Review and Revision
4.0x
6.0x
8.0x
10.0x
12.0x
14.0x
16.0x
May-19 Aug-19 Oct-19 Jan-20 Apr-20 Jul-20 Oct-20 Jan-21 Apr-21 Jul-21 Oct-21 Jan-22 Apr-22 Jul-22 Oct-22 Jan-23 Apr-23
Bern Average Average Since Q3 Earnings
L&W submitted its initial offer on July 15,
2021 (pre-market) and withdrew it on
December 22, 2021 (post-market)
Bern Historical Trading Analysis
Average EV / NTM AEBITDA of 8.5x excludes the periods during which L&W’s prior and
current offers were outstanding
Bern EV / NTM AEBITDA Since IPO
Source: FactSet and public filings as of May 17, 2023. Note: Shows EV / NTM AEBITDA multiples from May 3, 2019 to May 17, 2023.
7.6x
8.5x
8.4x |

| Strictly confidential | © Macquarie Group Limited 8
Preliminary Draft; Subject to Continued Review and Revision
APPENDIX
A
Appendix |
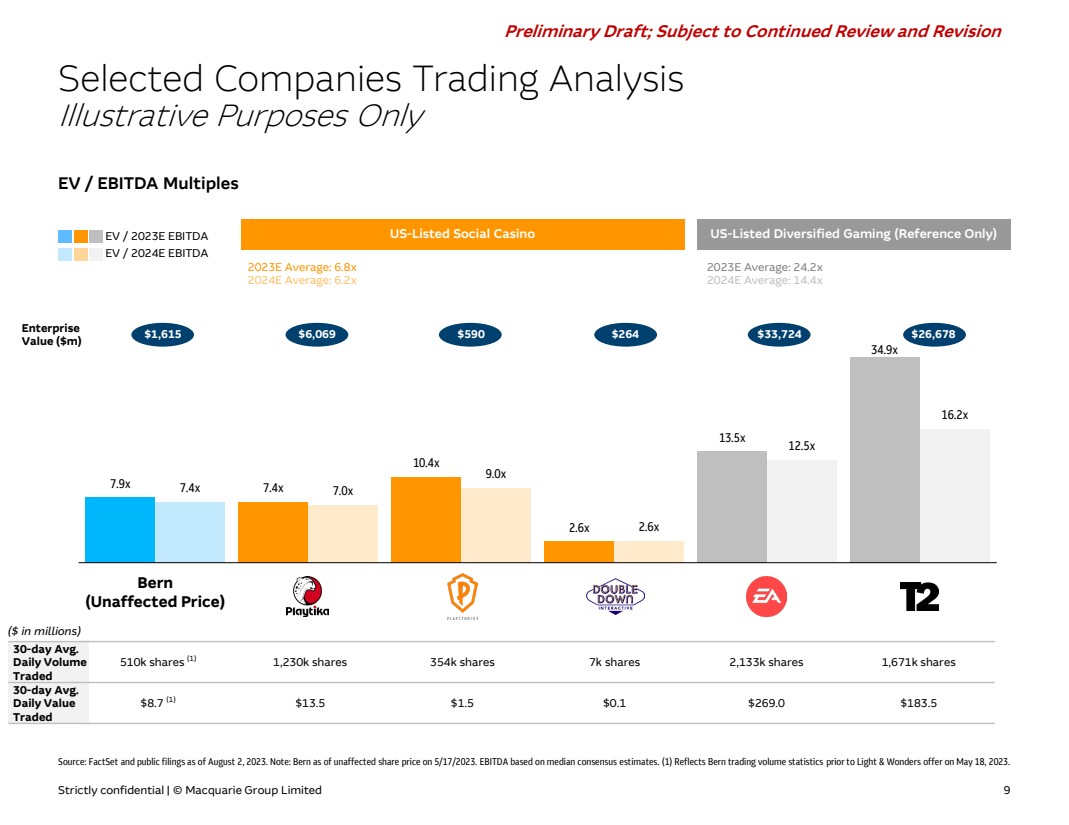
| Strictly confidential | © Macquarie Group Limited 9
Preliminary Draft; Subject to Continued Review and Revision
7.9x 7.4x
10.4x
2.6x
13.5x
7.4x 7.0x
9.0x
2.6x
12.5x
16.2x
Selected Companies Trading Analysis
Illustrative Purposes Only
Source: FactSet and public filings as of August 2, 2023. Note: Bern as of unaffected share price on 5/17/2023. EBITDA based on median consensus estimates. (1) Reflects Bern trading volume statistics prior to Light & Wonders offer on May 18, 2023.
Enterprise
Value ($m) $1,615 $6,069 $590 $264 $33,724 $26,678
EV / 2023E EBITDA US-Listed Social Casino US-Listed Diversified Gaming (Reference Only)
EV / 2024E EBITDA
2023E Average: 6.8x
2024E Average: 6.2x
2023E Average: 24.2x
2024E Average: 14.4x
EV / EBITDA Multiples
34.9x
Bern
(Unaffected Price)
510k shares (1) 1,230k shares 354k shares 7k shares 2,133k shares 1,671k shares
$8.7 (1) $13.5 $1.5 $0.1 $269.0 $183.5
30-day Avg.
Daily Volume
Traded
30-day Avg.
Daily Value
Traded
($ in millions) |
Exhibit (c)(10)
| Strictly confidential | © Macquarie Group Limited 1
Project Bern
August 7, 2023
Board Materials |
| Strictly confidential | © Macquarie Group Limited 2
Important Notice and Disclaimer
“Macquarie Capital” refers to Macquarie Corporate Holdings Pty Limited and its worldwide direct and indirect subsidiaries. Macquarie Corporate Holdings Pty
Limited is an indirect, wholly-owned subsidiary of Macquarie Group Limited.
The following presentation contains material provided to the Board of Directors (the “Board”) of Light & Wonder, Inc. (“Light & Wonder”, the “Company”) by
Macquarie Capital in connection with the acquisition of the publicly held shares of SciPlay Corporation (“Bern”).
This presentation was prepared on a confidential basis in connection with an oral presentation to the Board and not with a view toward complying with the
disclosure standards under federal or state securities laws. This presentation is for use of the Board and may not be used for any other purpose or disclosed
to any party without Macquarie Capital’s prior written consent.
The information provided herein comes or has been derived from several sources, but Macquarie Capital does not warrant its accuracy or completeness. In
preparing these materials, Macquarie Capital has relied upon and assumed, without independent verification, the accuracy and completeness of all
information available from public sources. Without limiting the generality of the foregoing, no audit or review has been undertaken by an independent third
party of the financial assumptions, data, results, calculations and forecasts contained, presented or referred to in this presentation. You should conduct your
own independent investigation and assessment as to the validity of the information contained in this presentation and the economic, financial, regulatory,
legal, tax, investment and accounting implications of that information. Macquarie Capital, its affiliates and any of its and their respective employees,
directors, officers, contractors, consultants, advisors, members, successors, representatives and agents make no representation or warranty as to the
accuracy or completeness of the information contained in this presentation, and take no responsibility under any circumstances for any loss or damage
suffered as a result of any omission, inadequacy, or inaccuracy in this presentation.
Neither Macquarie Capital nor any of its affiliates is an advisor as to regulatory, legal, tax, investment or accounting matters in any jurisdiction. Any recipient
of the information contained herein should seek advice from its own independent tax advisor, legal counsel and/or other advisor with respect to such
matters. These materials are not and should not be construed as a fairness opinion.
Macquarie Capital is not an authorized deposit-taking institution for the purposes of the Banking Act 1959 (Commonwealth of Australia). The obligations of
Macquarie Capital do not represent deposits or other liabilities of Macquarie Bank Limited ABN 46 008 583 542 (“MBL”). MBL does not guarantee or otherwise
provide assurance in respect of the obligations of Macquarie Capital.
© 2023 Macquarie Capital (USA) Inc. |
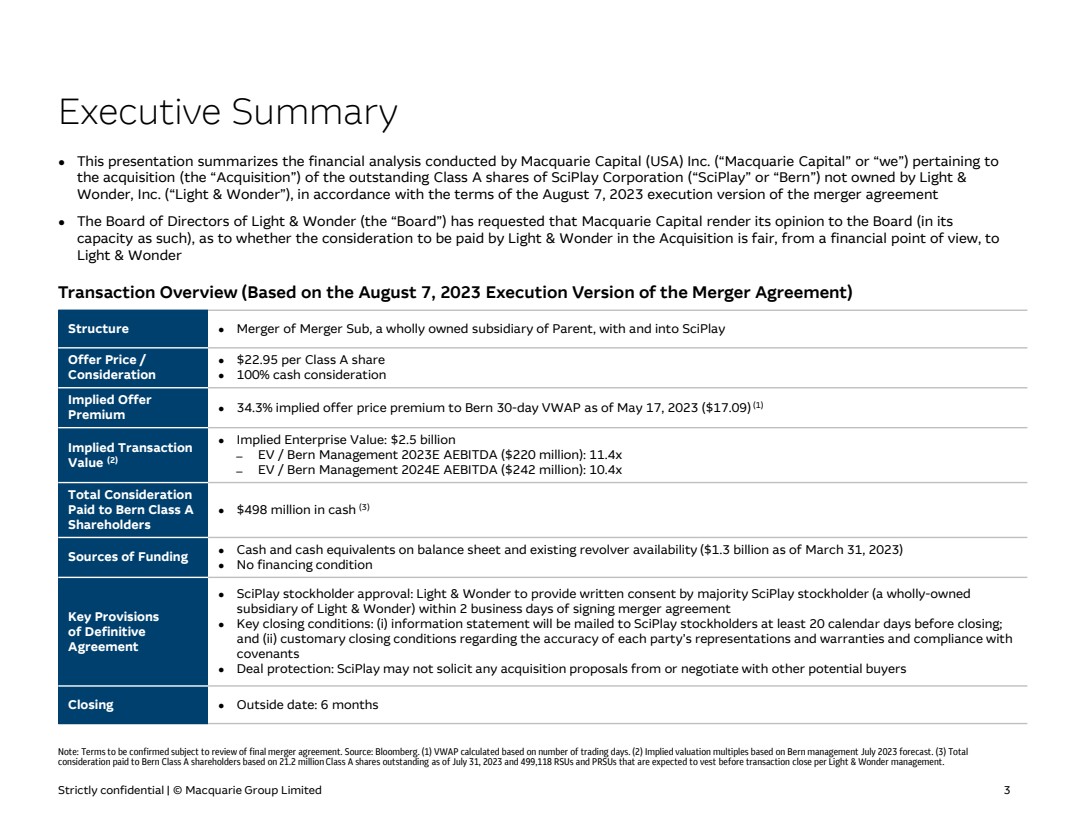
| Strictly confidential | © Macquarie Group Limited 3
Executive Summary
Transaction Overview (Based on the August 7, 2023 Execution Version of the Merger Agreement)
Note: Terms to be confirmed subject to review of final merger agreement. Source: Bloomberg. (1) VWAP calculated based on number of trading days. (2) Implied valuation multiples based on Bern management July 2023 forecast. (3) Total
consideration paid to Bern Class A shareholders based on 21.2 million Class A shares outstanding as of July 31, 2023 and 499,118 RSUs and PRSUs that are expected to vest before transaction close per Light & Wonder management.
● This presentation summarizes the financial analysis conducted by Macquarie Capital (USA) Inc. (“Macquarie Capital” or “we”) pertaining to
the acquisition (the “Acquisition”) of the outstanding Class A shares of SciPlay Corporation (“SciPlay” or “Bern”) not owned by Light &
Wonder, Inc. (“Light & Wonder”), in accordance with the terms of the August 7, 2023 execution version of the merger agreement
● The Board of Directors of Light & Wonder (the “Board”) has requested that Macquarie Capital render its opinion to the Board (in its
capacity as such), as to whether the consideration to be paid by Light & Wonder in the Acquisition is fair, from a financial point of view, to
Light & Wonder
Structure ● Merger of Merger Sub, a wholly owned subsidiary of Parent, with and into SciPlay
Offer Price /
Consideration
● $22.95 per Class A share
● 100% cash consideration
Implied Offer
Premium ● 34.3% implied offer price premium to Bern 30-day VWAP as of May 17, 2023 ($17.09)(1)
Implied Transaction
Value (2)
● Implied Enterprise Value: $2.5 billion
̶ EV / Bern Management 2023E AEBITDA ($220 million): 11.4x
̶ EV / Bern Management 2024E AEBITDA ($242 million): 10.4x
Total Consideration
Paid to Bern Class A
Shareholders
● $498 million in cash (3)
Sources of Funding ● Cash and cash equivalents on balance sheet and existing revolver availability ($1.3 billion as of March 31, 2023)
● No financing condition
Key Provisions
of Definitive
Agreement
● SciPlay stockholder approval: Light & Wonder to provide written consent by majority SciPlay stockholder (a wholly-owned
subsidiary of Light & Wonder) within 2 business days of signing merger agreement
● Key closing conditions: (i) information statement will be mailed to SciPlay stockholders at least 20 calendar days before closing;
and (ii) customary closing conditions regarding the accuracy of each party’s representations and warranties and compliance with
covenants
● Deal protection: SciPlay may not solicit any acquisition proposals from or negotiate with other potential buyers
Closing ● Outside date: 6 months |
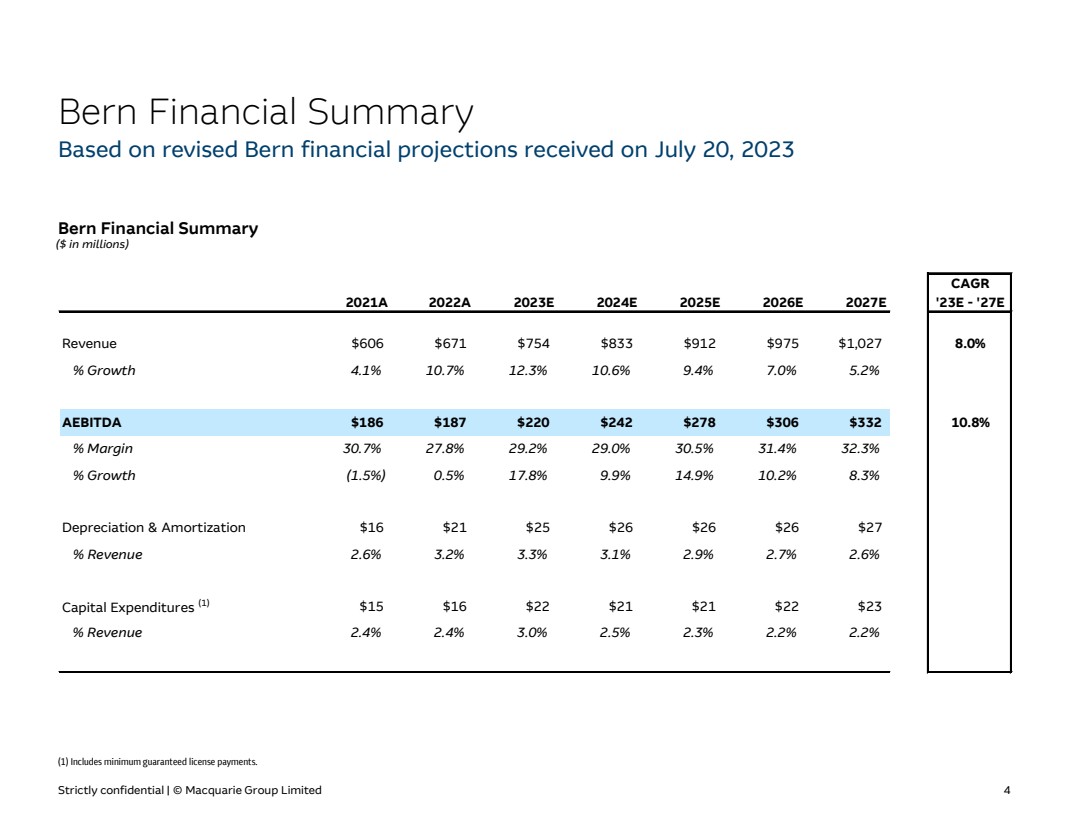
| Strictly confidential | © Macquarie Group Limited 4
Bern Financial Summary
Based on revised Bern financial projections received on July 20, 2023
Bern Financial Summary
(1) Includes minimum guaranteed license payments.
($ in millions)
CAGR
2021A 2022A 2023E 2024E 2025E 2026E 2027E '23E - '27E
Revenue $606 $671 $754 $833 $912 $975 $1,027 8.0%
% Growth 4.1% 10.7% 12.3% 10.6% 9.4% 7.0% 5.2%
AEBITDA $186 $187 $220 $242 $278 $306 $332 10.8%
% Margin 30.7% 27.8% 29.2% 29.0% 30.5% 31.4% 32.3%
% Growth (1.5%) 0.5% 17.8% 9.9% 14.9% 10.2% 8.3%
Depreciation & Amortization $16 $21 $25 $26 $26 $26 $27
% Revenue 2.6% 3.2% 3.3% 3.1% 2.9% 2.7% 2.6%
Capital Expenditures (1) $15 $16 $22 $21 $21 $22 $23
% Revenue 2.4% 2.4% 3.0% 2.5% 2.3% 2.2% 2.2% |

| Strictly confidential | © Macquarie Group Limited 5
$22.62
$16.76
$21.95
$20.75
$24.31
$20.41
$25.31
$26.02
$10.00 $14.00 $18.00 $22.00 $26.00 $30.00
Discounted Cash Flow Analysis
● 8.8% - 10.8% WACC (1)
● 8.0x – 9.0x 2026E NTM Terminal AEBITDA Multiple (50% Weighting)
● 1.5% - 2.5% Perpetuity Growth Rate (50% Weighting)
Selected Precedent Transactions Analysis
● LTM 6/30/23 AEBITDA of $213 million (2)
● EV / LTM 6/30/23 AEBITDA Multiple of 11.2x – 13.2x
Bern Historical EV / NTM AEBITDA Trading Analysis
● NTM 6/30/23E AEBITDA of $231 million
● EV / NTM 6/30/23E AEBITDA Multiple of 7.5x – 9.5x (3)
Selected All-Cash Precedent Premia Analysis
● Based on Median 30-day Premia for All-cash Transactions (4)
● 34% - 44% Premia to the Share Price 30 Trading Days Prior to the Offer
($16.86)
Bern Summary of Valuation Analyses
Methodology Bern Implied Value Ranges per Share
Reference Only Primary
Consideration to Class A Shareholders ($m) (5)
Implied EV / 2024E AEBITDA
Implied EV / 2023E AEBITDA
$478
10.9x
9.9x
$565
13.2x
12.0x
$391
8.6x
7.8x
$22.95
Merger Consideration
(1) See page 13 for more details on WACC. (2) LTM June 30, 2023 AEBITDA per Bern management. (3) Based on average multiple of 8.5x from IPO through Light & Wonder’s May 18, 2023 proposal; excludes the period during which Light & Wonder’s
initial offer was outstanding (July 15, 2021 – December 22, 2021). (4) See page 10 for precedent premia analysis. (5) Total consideration paid to Bern Class A shareholders based on 21.2 million Class A shares outstanding as of July 31, 2023 and
499,118 RSUs and PRSUs that are expected to vest before transaction close per Light & Wonder management.
Analysis based on Bern financial projections received on July 20, 2023 and excludes potential synergies |
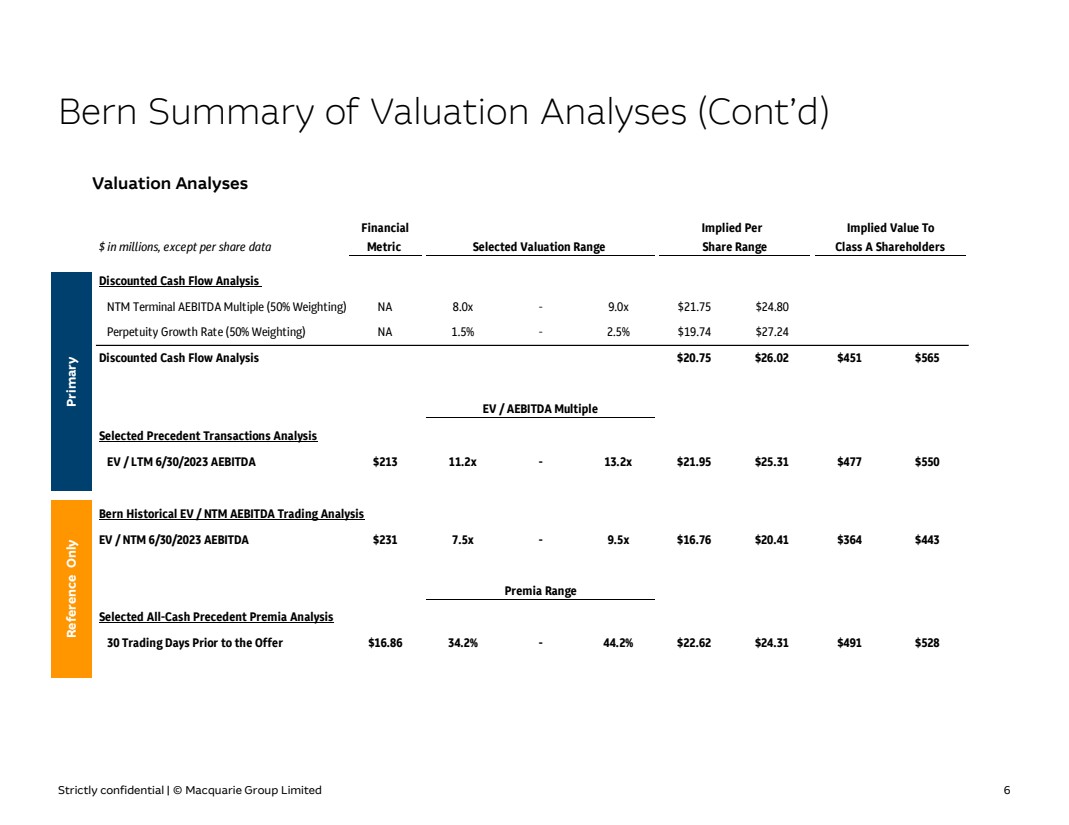
| Strictly confidential | © Macquarie Group Limited 6
Bern Summary of Valuation Analyses (Cont’d) Reference Only Primary
Financial Implied Per Implied Value To
$ in millions, except per share data Metric Selected Valuation Range Share Range Class A Shareholders
Discounted Cash Flow Analysis
NTM Terminal AEBITDA Multiple (50% Weighting) NA 8.0x - 9.0x $21.75 $24.80
Perpetuity Growth Rate (50% Weighting) NA 1.5% - 2.5% $19.74 $27.24
Discounted Cash Flow Analysis $20.75 $26.02 $451 $565
EV / AEBITDA Multiple
Selected Precedent Transactions Analysis
EV / LTM 6/30/2023 AEBITDA $213 11.2x - 13.2x $21.95 $25.31 $477 $550
Bern Historical EV / NTM AEBITDA Trading Analysis
EV / NTM 6/30/2023 AEBITDA $231 7.5x - 9.5x $16.76 $20.41 $364 $443
Premia Range
Selected All-Cash Precedent Premia Analysis
30 Trading Days Prior to the Offer $16.86 34.2% - 44.2% $22.62 $24.31 $491 $528
Valuation Analyses |

| Strictly confidential | © Macquarie Group Limited 7
Perpetuity Growth Rate
$22.77 1.5% 2.0% 2.5%
8.8% $24.36 $25.69 $27.24
9.3% $22.98 $24.13 $25.46
9.8% $21.77 $22.77 $23.91
10.3% $20.70 $21.58 $22.57
10.8% $19.74 $20.52 $21.39
WACC
NTM Terminal AEBITDA Multiple
$23.24 8.0x 8.5x 9.0x
8.8% $22.85 $23.82 $24.80
9.3% $22.57 $23.53 $24.49
9.8% $22.29 $23.24 $24.18
10.3% $22.02 $22.95 $23.88
10.8% $21.75 $22.67 $23.58
WACC
Note: Discounted cash flow analysis assumes a valuation date of 6/30/2023 and mid-year convention. Implied share price based on 126.6 million shares outstanding (21.2 million Class A shares, 103.5 million Class B shares and 1.8 million
unvested stock units outstanding as of July 31, 2023 per Light & Wonder management) and net cash of $395 million per Light & Wonder management. See page 13 for more details on WACC.
Discounted Cash Flow Analysis
Discounted Cash Flow Analysis Sensitivity Analysis – Implied Price per Share
Sensitivity Analysis – Implied Price per Share
$ in millions, except per share data Revised Bern LRP
3Q'23 4Q'23 Dec-24E Dec-25E Dec-26E
Revenue $187 $193 $833 $912 $975
AEBITDA $185 $52 $57 $242 $278 $306
(-) Depreciation & Amortization (6) (6) (26) (26) (26)
(-) Stock Based Compensation (3) (3) (19) (20) (21)
Profit Before Taxes $43 $47 $197 $232 $259
(-) Taxes (3) (3) (14) (16) (18)
NOPAT $40 $44 $184 $216 $241
(+) Depreciation & Amortization 6 6 26 26 26
(-) Capex (includes payments on license obligations) (7) (4) (21) (21) (22)
(+/-) Changes in Net Working Capital 3 3 - 1 2
(-) TRA Payments (4) - (4) (4) (4)
(-) Pari Passu Distributions to L&W (22) - (25) (30) (34)
Free Cash Flow $16 $48 $159 $188 $210
Present Value of Cash Flow (9.8% Midpoint WACC) $16 $47 $145 $156 $158
2027E AEBITDA 332
NTM Terminal AEBITDA Multiple (Midpoint) 8.5x
Terminal Value 2,811
Present Value of Terminal Value (9.8% Midpoint WACC) $2,024
Terminal Value as a % of Total Present Value 79.5%
Present Value of Cash Flow and Terminal Value $2,546
(+) 6/30/2023 Net Cash $395
Implied Equity Value $2,941
Implied Share Price $23.24
% Premium to Offer Price ($22.95) 1.2%
Analysis based on Bern financial projections received on July 20, 2023 and excludes potential synergies |
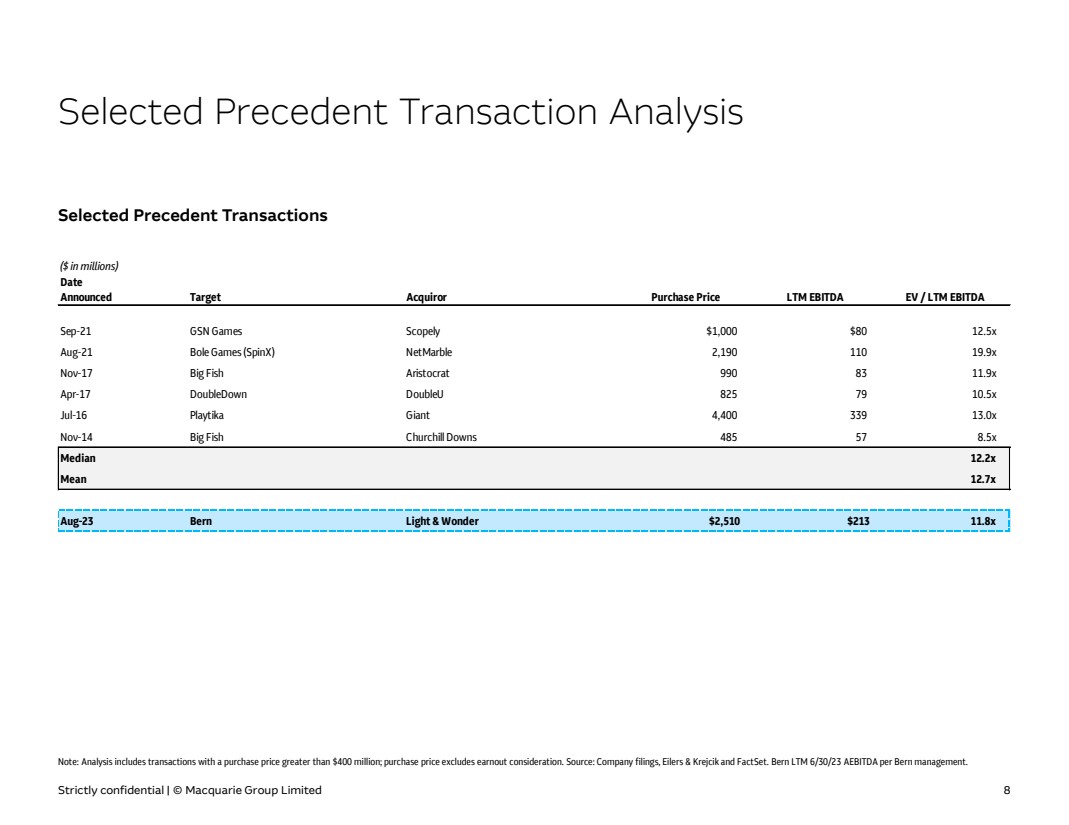
| Strictly confidential | © Macquarie Group Limited 8
Selected Precedent Transaction Analysis
Note: Analysis includes transactions with a purchase price greater than $400 million; purchase price excludes earnout consideration. Source: Company filings, Eilers & Krejcik and FactSet. Bern LTM 6/30/23 AEBITDA per Bern management.
($ in millions)
Date
Announced Target Acquiror Purchase Price LTM EBITDA EV / LTM EBITDA
Sep-21 GSN Games Scopely $1,000 $80 12.5x
Aug-21 Bole Games (SpinX) NetMarble 2,190 110 19.9x
Nov-17 Big Fish Aristocrat 990 83 11.9x
Apr-17 DoubleDown DoubleU 825 79 10.5x
Jul-16 Playtika Giant 4,400 339 13.0x
Nov-14 Big Fish Churchill Downs 485 57 8.5x
Median 12.2x
Mean 12.7x
Aug-23 Bern Light & Wonder $2,510 $213 11.8x
Selected Precedent Transactions |

| Strictly confidential | © Macquarie Group Limited 9
Light & Wonder submitted its initial offer on
July 15, 2021 (pre-market) and withdrew it on
December 22, 2021 (post-market)
Bern Historical Trading Analysis
Reference Only
Average EV / NTM AEBITDA of 8.5x excludes period during which Light & Wonder’s initial
offer was outstanding
Bern EV / NTM AEBITDA Since IPO
Source: FactSet and public filings as of May 17, 2023. Note: Shows EV / NTM AEBITDA multiples from May 3, 2019 to May 17, 2023.
7.6x
8.5x
8.4x
4.0x
6.0x
8.0x
10.0x
12.0x
14.0x
16.0x
May-19 Jul-19 Oct-19 Jan-20 Apr-20 Jul-20 Sep-20 Dec-20 Mar-21 Jun-21 Sep-21 Dec-21 Feb-22 May-22 Aug-22 Nov-22 Feb-23 May-23
Bern Average Average Since Q3 Earnings |
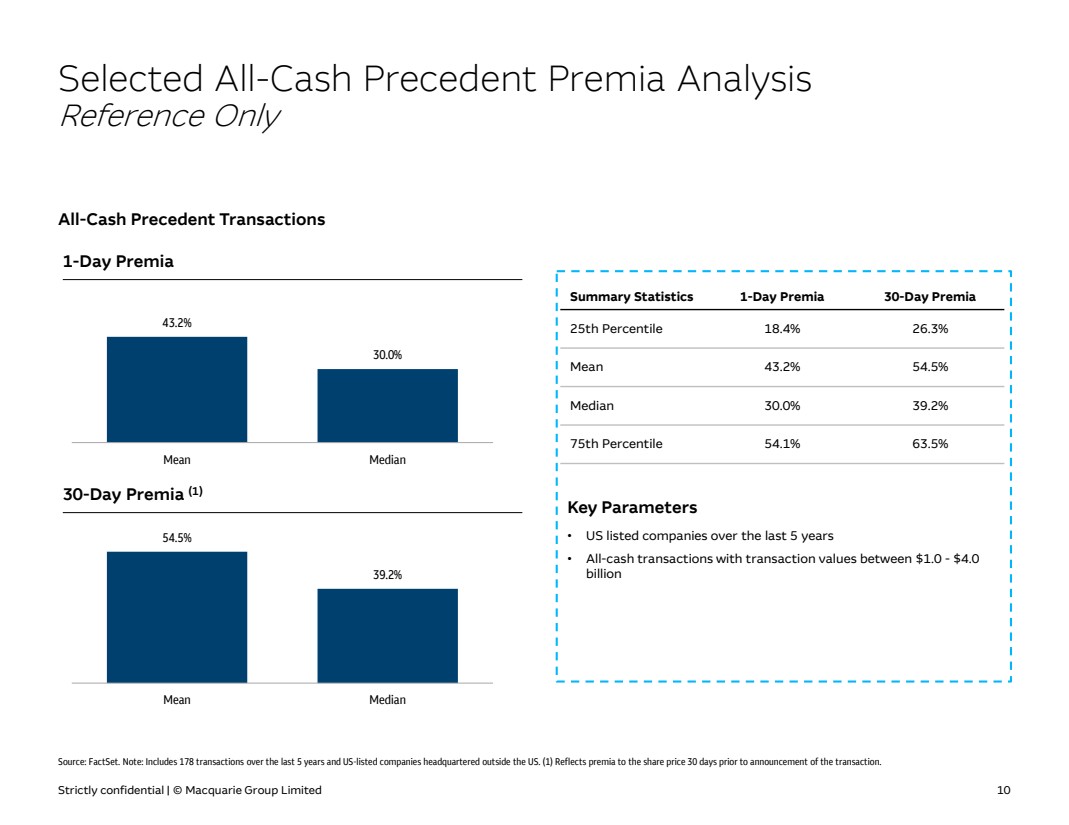
| Strictly confidential | © Macquarie Group Limited 10
54.5%
39.2%
Mean Median
43.2%
30.0%
Mean Median
All Transactions
Selected All-Cash Precedent Premia Analysis
Reference Only
Source: FactSet. Note: Includes 178 transactions over the last 5 years and US-listed companies headquartered outside the US. (1) Reflects premia to the share price 30 days prior to announcement of the transaction.
1-Day Premia
30-Day Premia (1)
• US listed companies over the last 5 years
• All-cash transactions with transaction values between $1.0 - $4.0
billion
Key Parameters
Summary Statistics 1-Day Premia 30-Day Premia
25th Percentile 18.4% 26.3%
Mean 43.2% 54.5%
Median 30.0% 39.2%
75th Percentile 54.1% 63.5%
All-Cash Precedent Transactions |

| Strictly confidential | © Macquarie Group Limited 11
APPENDIX A
Appendix |
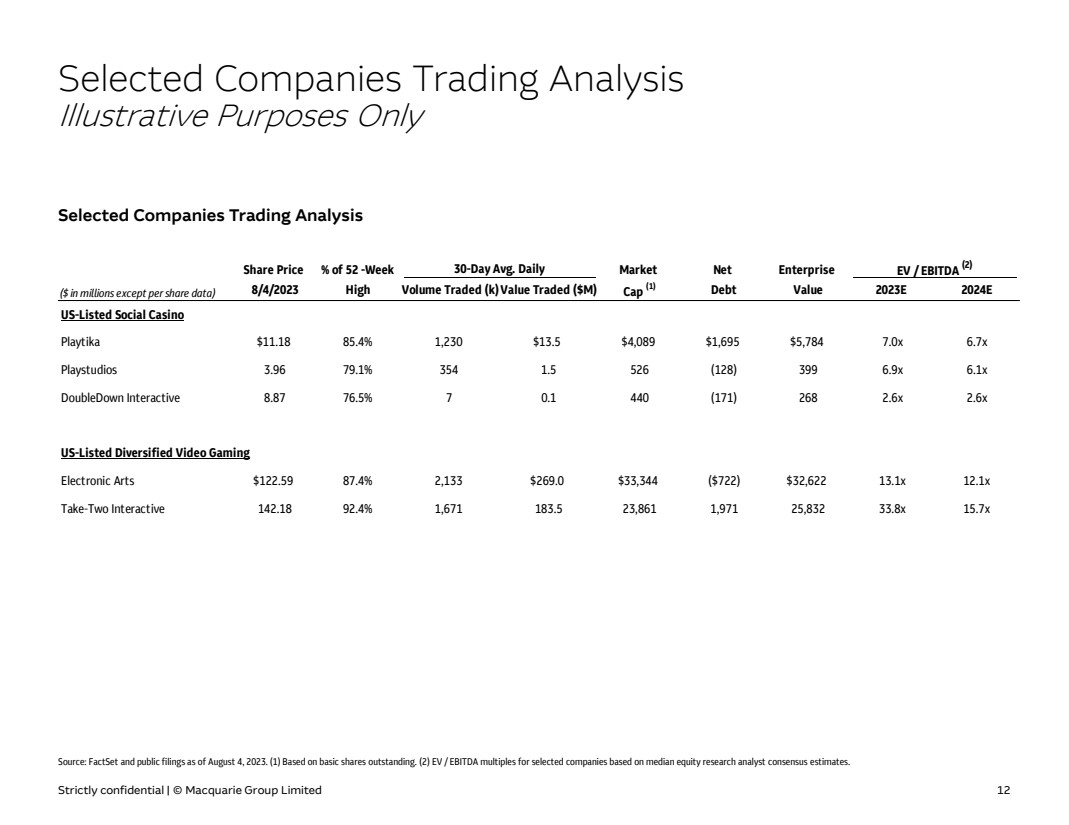
| Strictly confidential | © Macquarie Group Limited 12
Share Price % of 52 -Week 30-Day Avg. Daily Market Net Enterprise EV / EBITDA (2)
($ in millions except per share data) 8/4/2023 High Volume Traded (k)Value Traded ($M) Cap (1) Debt Value 2023E 2024E
US-Listed Social Casino
Playtika $11.18 85.4% 1,230 $13.5 $4,089 $1,695 $5,784 7.0x 6.7x
Playstudios 3.96 79.1% 354 1.5 526 (128) 399 6.9x 6.1x
DoubleDown Interactive 8.87 76.5% 7 0.1 440 (171) 268 2.6x 2.6x
US-Listed Diversified Video Gaming
Electronic Arts $122.59 87.4% 2,133 $269.0 $33,344 ($722) $32,622 13.1x 12.1x
Take-Two Interactive 142.18 92.4% 1,671 183.5 23,861 1,971 25,832 33.8x 15.7x
Selected Companies Trading Analysis
Illustrative Purposes Only
Source: FactSet and public filings as of August 4, 2023. (1) Based on basic shares outstanding. (2) EV / EBITDA multiples for selected companies based on median equity research analyst consensus estimates.
Selected Companies Trading Analysis |
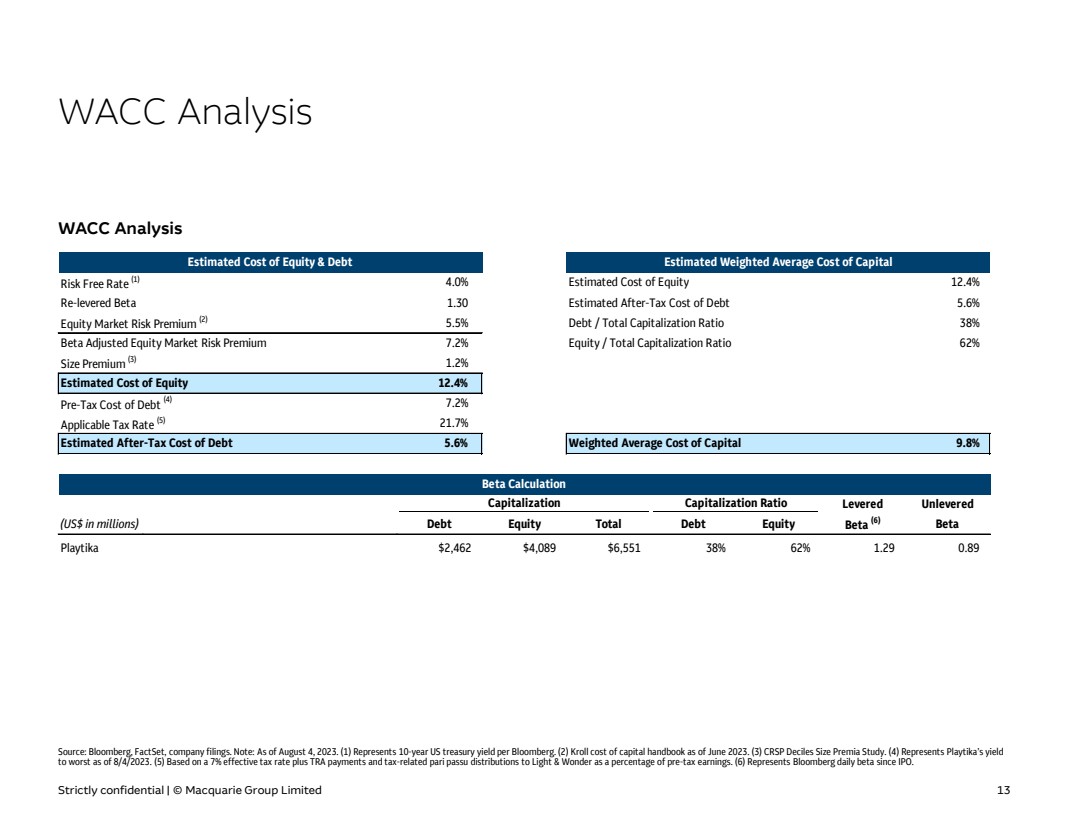
| Strictly confidential | © Macquarie Group Limited 13
WACC Analysis
Source: Bloomberg, FactSet, company filings. Note: As of August 4, 2023. (1) Represents 10-year US treasury yield per Bloomberg. (2) Kroll cost of capital handbook as of June 2023. (3) CRSP Deciles Size Premia Study. (4) Represents Playtika’s yield
to worst as of 8/4/2023. (5) Based on a 7% effective tax rate plus TRA payments and tax-related pari passu distributions to Light & Wonder as a percentage of pre-tax earnings. (6) Represents Bloomberg daily beta since IPO.
WACC Analysis
Estimated Cost of Equity & Debt Estimated Weighted Average Cost of Capital
Risk Free Rate (1) 4.0% Estimated Cost of Equity 12.4%
Re-levered Beta 1.30 Estimated After-Tax Cost of Debt 5.6%
Equity Market Risk Premium (2) 5.5% Debt / Total Capitalization Ratio 38%
Beta Adjusted Equity Market Risk Premium 7.2% Equity / Total Capitalization Ratio 62%
Size Premium (3) 1.2%
Estimated Cost of Equity 12.4%
Pre-Tax Cost of Debt (4) 7.2%
Applicable Tax Rate (5) 21.7%
Estimated After-Tax Cost of Debt 5.6% Weighted Average Cost of Capital 9.8%
Beta Calculation
Capitalization Capitalization Ratio Levered Unlevered
(US$ in millions) Debt Equity Total Debt Equity Beta (6) Beta
Playtika $2,462 $4,089 $6,551 38% 62% 1.29 0.89 |
Exhibit 107
EX-FILING FEES
CALCULATION OF FILING FEE TABLES
SC 13E3
(Form Type)
SciPlay Corporation
(Exact Name of Registrant as Specified in its Charter)
Table 1 to Paragraph (a)(7)
| | |
Transaction
Valuation | | |
Fee
rate | | |
Amount
of
Filing Fee | |
| Fees
to Be Paid | |
$ | 489,164,722.65 | (1) | |
| 0.00011020 | | |
$ | 53,905.95 | (2) |
| Fees
Previously Paid | |
$ | 489,164,722.65 | | |
| | | |
$ | 53,905.95 | (3) |
| Total
Transaction Valuation | |
$ | 489,164,722.65 | | |
| | | |
| | |
| Total
Fees Due for Filing | |
| | | |
| | | |
$ | 0 | |
| Total
Fees Previously Paid | |
| | | |
| | | |
$ | 53,905.95 | |
| Total
Fee Offsets | |
| | | |
| | | |
$ | 53,905.95 | |
| Net
Fee Due | |
| | | |
| | | |
$ | 0 | |
Table 2 to Paragraph (a)(7)
| | |
Registrant
or Filer Name | |
Form or
Filing Type | |
File
Number | | |
Initial
Filing Date | |
Filing
Date | |
Fee
Offset
Claimed | | |
Fee
Paid with
Fee Offset Source |
|
| Fee
Offset Claims | |
| |
PREM14C | |
| | | |
September 11,
2023 | |
| |
$ | 53,905.95 | |
|
|
|
| Fee Offset
Sources | |
SciPlay
Corporation | |
PREM14C | |
| | | |
| |
September 11,
2023 | |
| | | $ |
53,905.95 |
(3) |
| (1) |
Solely for the purpose of calculating the filing
fee, the aggregate value of the transaction was calculated by multiplying 21,314,367, which is the number of shares of SciPlay Corporation
Class A common stock, par value $0.001 per share (the “Class A Common Stock”), entitled to receive the per
share merger consideration, by $22.95, which is the per share merger consideration. The number of shares of Class A Common Stock
included in the calculation includes 44,964 shares of Class A Common Stock underlying outstanding non-employee director restricted
stock units entitled to receive the per share merger consideration. |
| (2) |
The amount of the filing fee, calculated in accordance
with Rule 0-11 of the Exchange Act, was calculated by multiplying $489,164,722.65 by 0.00011020. |
| (3) |
SciPlay Corporation previously paid $53,905.95
upon the filing of its Preliminary Information Statement on Schedule 14C on September 11, 2023, in connection with the
transaction reported hereby. |
SciPlay (NASDAQ:SCPL)
Historical Stock Chart
From Jun 2024 to Jul 2024

SciPlay (NASDAQ:SCPL)
Historical Stock Chart
From Jul 2023 to Jul 2024
