false
0001531978
0001531978
2024-08-05
2024-08-05
iso4217:USD
xbrli:shares
iso4217:USD
xbrli:shares
UNITED STATES
SECURITIES AND EXCHANGE COMMISSION
Washington, D.C. 20549
FORM
8-K
CURRENT REPORT
Pursuant
to Section 13 or 15(d)
of the Securities Exchange Act of 1934
Date of Report (Date of earliest event reported):
August 5, 2024
Paragon 28, Inc.
(Exact
name of Registrant as Specified in its Charter)
| Delaware |
001-40902 |
27-3170186 |
|
(State or Other Jurisdiction
of Incorporation) |
(Commission
File Number) |
(IRS Employer
Identification No.) |
| |
14445 Grasslands Drive
Englewood, Colorado |
80112 |
|
| |
(Address of Principal Executive Offices) |
(Zip Code) |
|
Registrant’s Telephone Number, Including
Area Code: (720) 399-3400
Not Applicable
(Former name or former address, if changed since last report.)
Check the appropriate box below if the Form 8-K filing is intended
to simultaneously satisfy the filing obligation of the registrant under any of the following provisions:
¨ Written
communications pursuant to Rule 425 under the Securities Act (17 CFR 230.425)
¨ Soliciting
material pursuant to Rule 14a-12 under the Exchange Act (17 CFR 240.14a-12)
¨
Pre-commencement communications pursuant to Rule 14d-2(b) under the Exchange Act (17 CFR 240.14d-2(b))
¨
Pre-commencement communications pursuant to Rule 13e-4(c) under the Exchange Act (17 CFR 240.13e-4(c))
Securities registered pursuant to Section 12(b) of the Act:
| Title of each class |
|
Trading Symbol(s) |
|
Name of each exchange on which registered |
| Common Stock, $0.01 par value |
|
FNA |
|
The New York Stock Exchange |
Indicate by check mark whether the registrant is an emerging growth
company as defined in Rule 405 of the Securities Act of 1933 (17 CFR §230.405 of this chapter) or Rule 12b-2 of the Securities Exchange
Act of 1934 (17 CFR §240.12b-2 of this chapter).
Emerging growth company ¨
If an emerging growth company, indicate by check mark if the registrant
has elected not to use the extended transition period for complying with any new or revised financial accounting standards provided pursuant
to Section 13(a) of the Exchange Act. ¨
Item 2.02 Results of Operations and Financial Condition.
On August 8, 2024, Paragon 28, Inc. (“Paragon 28”
or the “Company”) issued a press release announcing its financial results for the second quarter ended June 30, 2024. A
copy of the press release is attached hereto as Exhibit 99.1 and is incorporated herein by reference.
The information in this Item 2.02 of this Current Report on Form 8-K
and the Exhibit 99.1 attached hereto shall not be deemed “filed” for purposes of Section 18 of the Securities Exchange
Act of 1934, as amended (the “Exchange Act”), or otherwise subject to the liabilities of that Section or Sections 11
and 12(a)(2) of the Securities Act of 1933, as amended (the “Securities Act”), or incorporated by reference in any filing
of Paragon 28 under the Securities Act or the Exchange Act, whether made before or after the date hereof, regardless of any general incorporation
language in such filing.
Item 5.02 Departure of Directors or Certain Officers; Election of
Directors; Appointment of Certain Officers; Compensatory Arrangements of Certain Officers.
| (1) | Effective August 5, 2024, Chadi Chahine, age 51, has been appointed as Chief Financial Officer (“CFO”) and EVP of
Supply Chain Operations of Paragon 28. Mr. Chahine will become a member of the Company’s executive leadership team, reporting
directly to Albert DaCosta, Chief Executive Officer and will lead all aspects of the Company’s finance function including business
planning and analysis, accounting, SEC reporting, internal audit, tax, and treasury as well as its information technology and operations
teams. Kristina Wright has concurrently stepped down as Interim Chief Financial Officer and will continue as a member of the Company’s
Board of Directors. |
Mr. Chahine brings over 25 years of extensive global
experience in finance and business operations, including a proven track record in the orthopedic industry. Prior to joining the Company,
Mr. Chahine served as Group CFO of the Global Business Group for Zimmer Biomet Holdings Inc. (“Zimmer Biomet”), where
he oversaw $7 billion in revenue and had full P&L, balance sheet, and commercial finance responsibilities, for all geographic regions.
During his tenure at Zimmer Biomet, Mr. Chahine helped drive record revenue and profit in 2022 and 2023 and identified additional
efficiencies in inventory and research & development investments. Prior to Zimmer Biomet, Mr. Chahine served as Chief Operating
Officer and CFO of Global Stanley Security at Stanley Black & Decker prior to the business’s $4.1 billion sale. He was
also previously CFO at CIRCOR International, leading takeover defense efforts and implementing significant cost-saving measures. Furthermore,
he held divisional CFO roles at Smith+Nephew responsible for International Markets and the US where he led initiatives to accelerate sustainable
growth. Mr. Chahine holds a Bachelor of Commerce in Accounting from Université du Québec à Montréal and
a Bachelor of Science in Math and Economics from Université de Montréal.
Pursuant to his Employment Agreement, Mr. Chahine will
receive an annual base salary of $550,000. Mr. Chahine will receive a sign-on cash bonus of $300,000, which will be paid in $60,000
increments starting with his appointment date and thereafter every six (6) months until August 5, 2026. Mr. Chahine is
also eligible to participate in the Company’s Performance Based Bonus Plan. His target performance bonus is equal to 70% of his
base salary. The Company will also grant equity comprising restricted stock units (“RSUs”) and performance stock units (“PSUs”)
covering a number of shares of the Company’s common stock with an aggregate value of $3,800,000, based on the thirty-day closing
trading average of a share of Company common stock prior to the date of grant and rounded down the nearest whole share. The equity will
be granted in accordance with the Company’s 2021 Incentive Award Plan, as amended. The RSUs will vest with respect to 25% of the
RSUs on each anniversary of the date of grant, subject to Mr. Chahine’s continuing service with the Company through the applicable
vesting date. The PSUs are subject to service and performance-vesting conditions and will vest following the end of the defined performance
period. Each RSU and PSU represents the right to receive a share of Company common stock upon vesting.
There are no arrangements or understandings between Mr. Chahine
and any other persons pursuant to which he was appointed as an officer, and Mr. Chahine has no direct or indirect material interest
in any transaction required to be disclosed pursuant to Item 404(a) of Regulation S-K. Mr. Chahine does not have a family relationship
with any member of the Board or any executive officer of the Company.
| (2) | Effective August 6, 2024, as part of the Company’s broader operational efficiency strategy, Albert DaCosta, Chief Executive
Officer, is eliminating his salary increase and forfeiting his annual bonus for 2024. Matt Jarboe, Chief Commercial Officer, Drew Hill,
EVP, Research and Development, Robert McCormack, General Counsel, Matthew Millard, Chief Human Resources Officer, and Matt Brinckman,
SVP, Strategy and Investor Relations are each capping their target annual bonuses to 50%. These executives described above will have the
ability to earn back the remaining 50% of their target bonus upon achievement of certain revenue and adjusted cash flow measures. |
Item 7.01 Regulation FD Disclosure.
On August 8, 2024, the Company announced an operational efficiency
strategy targeted at optimizing the organizational structure, minimizing costs and preserving cash without compromising revenue growth
opportunities. This strategy was initiated in the second quarter of 2024 and is expected to result in durable savings for the rest of
2024 and in 2025. Management has determined that this operational efficiency strategy will not result in the Company incurring material
charges. This operational efficiency strategy includes:
| ■ | An approximately 7% reduction in work force expected to take place in August of 2024, and is intended to result in up to $8 million
in annualized savings offset by approximately $1 million in severance costs; |
| ■ | Detailed review and optimization of functional costs and controls; |
| ■ | An inventory burn-down plan; and |
| ■ | One-time realignment of executive compensation for 2024 (as described above). |
On August 8, 2024, the Company posted a presentation to its website
relating to the Company’s quarterly discussion of its financial profile, market strategy, products and recent developments. A copy
of the presentation is attached as Exhibit 99.2 to this Current Report on Form 8-K.
The information in Item 7.01 of this Current Report on Form 8-K,
including Exhibit 99.2, shall not be deemed to be “filed” for purposes of Section 18 of the Exchange Act, or otherwise
subject to the liabilities of that section or Section 11 and 12(a)(2) of the Securities Act. The information contained in Item
7.01 of this Current Report on Form 8-K, including Exhibit 99.2, shall not be incorporated by reference into any filing with
the U.S. Securities and Exchange Commission made by the Company, whether made before or after the date hereof, regardless of any general
incorporation language in such filing, except as expressly set forth by specific reference in such a filing.
Cautionary Statement Regarding Forward-Looking Statements
This Current Report on Form 8-K contains certain “forward-looking”
statements as that term is defined by Section 27A of the Securities Act and Section 21E of the Exchange Act. Statements that
are predictive in nature, that depend on or relate to future events or conditions, or that include words such as “believes,”
“anticipates,” “expects,” “may,” “will,” “would,” “should,” “estimates,”
“could,” “intends,” “plans” or other similar expressions are forward-looking statements, including
the Company’s preliminary financial results for the quarter ended June 30, 2024, and the Company’s operational efficiency
strategy. These forward-looking statements are based on the Company’s current assumptions, expectations and beliefs and are subject
to numerous risks, including, among other things, factors relating to uncertainties as to any difficulties with respect to the Company's
operational efficiency strategy, including expenses associated such strategy; the effect of the announcement of the Company's operational
efficiency strategy on the Company's ability to retain and hire key personnel and to maintain relationships with customers, suppliers
and other business partners; risks related to the possible diversion of management’s attention as a result of the Company's operational
efficiency strategy; uncertainties as to the Company's ability and the amount of time necessary to realize the expected benefits of the
Company's operational efficiency strategy; and those set forth under the caption “Risk Factors” in the Company’s most
recent filings with the Securities and Exchange Commission, as well as other uncertainties, assumptions and changes in circumstances that
may cause the Company’s actual results, performance or achievements to differ materially from those expressed or implied in any
forward-looking statement. The Company cautions investors not to place undue reliance on the forward-looking statements contained in this
Current Report on Form 8-K.
Further information on these and other factors that could affect the
Company’s financial results and the forward-looking statements in this Current Report on Form 8-K is included in the Company’s
filings with the Securities and Exchange Commission, including, among others, the Company’s Annual Report on Form 10-K/A for
the year ended December 31, 2023, particularly under the captions “Risk Factors” and “Management’s Discussion
and Analysis of Financial Condition and Results of Operations.”
The Company undertakes no obligation to update or revise any forward-looking
statements, whether as a result of new information, future events, or otherwise.
Item 9.01 Financial Statements and Exhibits.
SIGNATURES
Pursuant to the requirements of the Securities Exchange Act of 1934,
the registrant has duly caused this report to be signed on its behalf by the undersigned hereunto duly authorized.
| |
|
PARAGON 28, INC. |
| |
|
| Date: August 8, 2024 |
By: |
/s/ Robert S. McCormack |
| |
|
General Counsel & Corporate Secretary |
Exhibit 99.1
Paragon 28 Appoints Chadi Chahine as Chief Financial
Officer and Executive Vice-President of Supply Chain Operations, Reports Second Quarter 2024 Financial Results and Narrows 2024 Net Revenue
Guidance
ENGLEWOOD, CO.,
August 8, 2024 -- Paragon 28, Inc. (NYSE: FNA) (“Paragon 28” or "Company”), a leading medical device
company exclusively focused on the foot and ankle orthopedic market, today announced that Chadi Chahine has been appointed Chief Financial
Officer and Executive Vice-President of Supply Chain Operations, effective August 5, 2024. The Company also reported financial results
for the quarter ended June 30, 2024, and narrowed its 2024 net revenue guidance.
Recent Business Updates
| · | Strengthened executive leadership team with appointment of Chadi Chahine as CFO & EVP Supply
Chain Operations, effective August 5, 2024 |
| · | Recorded global revenue of $61.0 million in the second quarter, representing 19.6% and 19.7% reported
and constant currency growth compared to the prior year period, respectively |
| · | Drove 840 basis point improvement in operating expense as a percent of revenue in the second quarter compared
to the prior year period |
| · | Initiated an operational efficiency strategy targeted at optimizing the organizational structure, minimizing
costs and preserving cash without compromising revenue growth opportunities |
| · | Narrowed 2024 net revenue guidance of $249 million to $255 million, representing 15.1% to 17.8% reported
growth compared to 2023 |
| · | Filed an amended Form 10-K/A for the 2023 fiscal year and an amended Form 10-Q/A for the quarter
ended March 31, 2024 in connection with the financial restatement detailed in the Form 8-K filed July 30, 2024 |
Appointment of Chadi Chahine as Chief Financial
Officer
The appointment of Chadi Chahine concludes an
extensive search process conducted by the Company. Mr. Chahine will succeed Kristina Wright who has been serving as Interim CFO since
April 3, 2024.
“We are thrilled to welcome Chadi to our executive team,” said Albert DaCosta, CEO and Chairman of Paragon 28. “Chadi's
extensive experience in orthopedics and finance combined with his strategic vision and proven ability to drive growth and operational
efficiency will be invaluable as we continue to expand our presence in the foot and ankle market and further scale our business operations.
We also extend our sincere gratitude to Krissy Wright for her exceptional leadership as interim CFO and look forward to her continued
contributions on our Board.”
Chadi Chahine brings over 25 years of extensive global experience in finance and business operations, including a proven track record
in the orthopedic industry, to Paragon 28. Before joining Paragon 28, Mr. Chahine served as Group CFO of the Global Business Group
for Zimmer Biomet Holdings Inc. (“Zimmer Biomet”), where he oversaw $7 billion in revenue and had full P&L, balance sheet,
and commercial finance responsibilities, across all geographic regions. During his tenure at Zimmer Biomet, Mr. Chahine helped drive
record revenue and profit in 2022 and 2023 and identified additional efficiencies in inventory and research & development investments.
Prior to his tenure at Zimmer Biomet, Mr. Chahine served as COO and CFO of Global Stanley Security at Stanley Black & Decker
prior to the business’s $4.1 billion sale. He also previously served as CFO at CIRCOR International, leading takeover defense efforts
and implementing significant cost-saving measures. Earlier in his career, he held divisional CFO roles at Smith+Nephew responsible for
International Markets and the US where he led initiatives to accelerate sustainable growth. Mr. Chahine holds a Bachelor of Commerce
in Accounting from Université du Québec à Montréal and a Bachelor of Science in Math and Economics from Université
de Montréal.
“Paragon 28 is a truly unique business in the world of orthopedics. The Company’s commitment to innovation and excellence
in foot and ankle aligns perfectly with my professional values and goals,” said Chadi Chahine, CFO. “I am excited to join
Paragon 28 at such a critical time and look forward to contributing to its continued growth and success.”
Chadi Chahine's appointment as CFO & EVP Supply Chain Operations marks a significant step forward for Paragon 28 as it strengthens
its leadership team and positions the Company for continued growth and success in the foot and ankle market.
Second Quarter 2024 and Six Months Ended June 30,
2024 Financial Results
| · | Consolidated net revenue for the second quarter of 2024 was $61.0 million, representing 19.6% and 19.7%
reported and constant currency growth, respectively, compared to the second quarter of 2023. Consolidated net revenue for the six months
ended June 30, 2024 was $122.1 million, representing 18.5% reported and constant currency growth compared to the six months ended
June 30, 2023. |
| o | U.S. net revenue for the second quarter of 2024 and six months ended June 30, 2024 was $49.7 million
and $100.8 million, respectively, representing 17.6% and 15.5% reported growth, respectively, compared to the prior year periods. |
| o | International net revenue for the second quarter of 2024 and six months ended June 30, 2024 was $11.3
million and $21.3 million, respectively, representing 29.4% and 35.1% reported growth respectively, compared to the prior year periods. |
| · | Gross margin was 75.0% for the second quarter of 2024 compared to 77.3% in the second quarter of 2023.
Gross margin was 76.2% for the six months ended June 30, 2024 compared to 78.8% for the six months ended June 30, 2023. |
| · | Operating expenses were $56.5 million for the second quarter of 2024, an increase of 9.7%, compared to
$51.5 million for the second quarter of 2023. Operating expenses were $118.9 million for the six months ended June 30, 2024, an increase
of 16.1%, compared to $102.4 million for the six months ended June 30, 2023. |
| · | Net loss was $13.8 million for the second quarter of 2024, a $0.6 million increase, compared to a net
loss of $13.2 million for the second quarter of 2023. Net loss was $31.2 million for the six months ended June 30, 2024, a $7.1 million
increase, compared to net a loss of $24.1 million for the six months ended June 30, 2023. |
| · | Adjusted EBITDA was a $3.0 million loss for the second quarter of 2024, a $2.4 million improvement, compared
to a $5.4 million loss in the second quarter of 2023. Adjusted EBITDA was a $10.7 million loss for the six months ended June 30,
2024, a $2.6 million decrease compared to a $8.1 million loss for the six months ended June 30, 2023. |
“We are pleased with our results this quarter
and continue to see strong momentum in the U.S. driven in part by the energy around our recent new product launches,” said Albert
DaCosta, Chairman and Chief Executive Officer. “Further, we have made significant progress on our cost optimization plans resulting
in an 840 basis point year-over-year improvement to operating expenses in the quarter, with more planned in the second half of 2024 and
into 2025.”
Operational Efficiency Strategy
The Company also announced an operational efficiency
strategy targeted at optimizing the organizational structure, minimizing costs and preserving cash without compromising revenue growth
opportunities. This strategy was initiated in the second quarter of 2024 and is expected to result in durable savings for the rest of
2024 and in 2025. Management has determined that this operational efficiency strategy will not result in the Company incurring material
charges. This operational efficiency strategy includes:
| · | An approximately 7% reduction in work force expected to take place in August of 2024, and is intended
to result in up to $8 million in annualized savings offset by approximately $1 million in severance costs; |
| · | Detailed review and optimization of functional costs and controls; |
| · | An inventory burn-down plan; and |
| · | One-time realignment of executive compensation for 2024 |
“Our company has consistently demonstrated
strong growth and we remain committed to sustaining that momentum by making thoughtful strategic adjustments,” said Albert DaCosta,
Chairman and Chief Executive Officer. “Although these processes are never easy, this initiative is critical to enhance efficiency,
minimize costs and preserve cash without compromising our growth initiatives or our high-quality product portfolio.”
2024 Net Revenue Guidance
The
Company narrows its prior 2024 net revenue guidance and expects net revenue to be $249 million to $255 million, representing 15.1%
to 17.8% reported growth compared to 2023.
The Company’s 2024 net revenue guidance
assumes foreign currency translation rates remain consistent with current foreign currency translation rates.
Restatement
As
previously announced in our Current Report on Form 8-K filed with the Securities and Exchange Commission (the
“SEC”) on July 30, 2024, on July 30, 2024, the Audit Committee (the “Audit Committee”) of the
Board of Directors and in consultation with management, concluded that its audited consolidated financial statements for the fiscal
year ended December 31, 2023 and its unaudited condensed consolidated financial statements for the periods ended March 31,
2023, June 30, 2023, September 30, 2023, and March 31, 2024 could no longer be relied upon as a result of material
accounting errors identified by management. Accordingly, the consolidated financial statements as of and for the fiscal year
ended December 31, 2023 have been restated in the Company’s Annual Report on Form 10-K/A filed on August 8,
2024 to reflect the correction of identified errors in the calculation of excess and obsolete inventory, as well as its accounting
for inventory variances, which resulted in a net overstatement of inventory as of March 31, 2023, June 30, 2023,
September 30, 2023, and December 31, 2023, and a net understatement in cost of goods sold for the respective interim
periods ended on such dates and for the fiscal year ended December 31, 2023. Additionally, the unaudited interim condensed
consolidated financial statements as of and for the three months ended March 31, 2024 have been restated in the Company’s
Quarterly Report on Form 10-Q/A filed on August 8, 2024 to reflect the correction of identified errors in the calculation
of excess and obsolete inventory, as well as its accounting for inventory variances, which resulted in a net overstatement of
inventory as of March 31, 2024 and a net understatement in cost of goods sold for the three months ended March 31,
2024. In connection with the presentation of comparative prior period financial statements in the amended Form 10-K/A for
the fiscal year ended December 31, 2023, the Company revised the consolidated financial statements for the year ended
December 31, 2022 and the condensed consolidated financial statements for the interim periods for such year, each as presented
in the amended Form 10-K/A for the fiscal year ended December 31, 2023, to correct errors identified that were determined
to be immaterial both individually and in the aggregate.
Webcast and Conference Call Information
Paragon 28 will host a conference call to discuss
second quarter 2024 financial results on Thursday, August 8, 2024, at 2:30 p.m. Mountain Time / 4:30 p.m. Eastern Time.
Investors interested in listening to the conference call may do so by dialing (833-470-1428) for domestic callers or (404-975-4839) for
international callers, using conference ID: 389675. Live audio of the webcast will be available on the “Investors” section
of the company’s website at ir.paragon28.com. The webcast will be archived and available for replay for at least 90 days after the
event.
About Paragon 28, Inc.
Based in Englewood, CO., Paragon 28, is a
leading medical device company exclusively focused on the foot and ankle orthopedic market and is dedicated to improving patient lives.
From the onset, Paragon 28® has provided innovative orthopedic solutions, procedural approaches and instrumentation that cover a wide
range of foot and ankle ailments including fracture fixation, forefoot, ankle, progressive collapsing foot deformity (PCFD) or flatfoot,
Charcot foot and orthobiologics. The Company designs products with both the patient and surgeon in mind, with the goal of improving outcomes,
reducing ailment recurrence and complication rates, and making the procedures simpler, consistent, and reproducible.
Forward Looking Statements
Except for the historical information contained
herein, the matters set forth in this press release are forward-looking statements within the meaning of the "safe harbor" provisions
of the Private Securities Litigation Reform Act of 1995, including, but not limited to: Paragon 28’s potential to shape a better
future for foot and ankle patients; the Company’s preliminary financial results for the quarter ended June 30, 2024; statements
about the Company’s 2024 net revenue guidance; reaffirming the Company’s 2024 net revenue guidance ranges; the anticipated
timing of the filing of the restated filings; the financial statements to be restated and the filings in which such restated financial
statements will appear; the Company's intent to report material weaknesses in its internal control over financial reporting; and the Company’s
operational efficiency strategy. You are cautioned not to place undue reliance on these forward-looking statements. Forward-looking statements
are only predictions based on our current expectations, estimates, and assumptions, valid only as of the date they are made, and subject
to risks and uncertainties, some of which we are not currently aware. Forward-looking statements should not be read as a guarantee of
future performance or results and may not necessarily be accurate indications of the times at, or by, which such performance or results
will be achieved. These forward-looking statements are based on Paragon 28’s current expectations and inherently involve significant
risks and uncertainties and are subject to numerous risks, including, among other things, risks related to the timely and correct
completion of the restatement and restated filings; the risk that additional information may become known prior to the expected filing
with the SEC of the restated filings or that other subsequent events may occur that would require the Company to make additional adjustments
to its financial statements, which could be material, or delay the filing of the corrected or future periodic reports with the SEC; risks
related to the timing and results of the Company’s review of the effectiveness of internal control over financial reporting and
related disclosure controls and procedures, remediation of the control deficiencies identified and our ability to implement and maintain
effective internal control over financial reporting in the future, which may adversely affect the accuracy and timeliness of our financial
reporting; identification of errors in our financial reporting in the future that require us to restate previously issued financial statements,
which may subject us to unanticipated costs or regulatory penalties and could cause investors to lose confidence in the accuracy and completeness
of our financial statements; factors relating to uncertainties as to any difficulties with respect to the Company's operational efficiency
strategy, including expenses associated such strategy; the effect of the announcement of the Company's operational efficiency strategy
on the Company's ability to retain and hire key personnel and to maintain relationships with customers, suppliers and other business partners;
risks related to the possible diversion of management’s attention as a result of the Company's operational efficiency strategy;
uncertainties as to the Company's ability and the amount of time necessary to realize the expected benefits of the Company's operational
efficiency strategy; and those set forth under the caption “Risk Factors” in the Company’s most recent filings with
the Securities and Exchange Commission. Actual results and the timing of events could differ materially from those anticipated in such
forward-looking statements as a result of these risks and uncertainties. For a further description of the risks and uncertainties that
could cause actual results to differ from those expressed in these forward-looking statements, as well as risks relating to Paragon 28’s
business in general, see Paragon 28’s current and future reports filed with the Securities and Exchange Commission, including its
Annual Report on Form 10-K/A for the fiscal year ended December 31, 2023, as updated periodically with its other filings with
the SEC. These forward-looking statements are made as of the date of this press release, and Paragon 28 assumes no obligation to update
the forward-looking statements, or to update the reasons why actual results could differ from those projected in the forward-looking statements,
except as required by law. Paragon 28’s net revenue guidance for 2024 is not necessarily indicative of our operating results for
any future periods.
Use of Non-GAAP Financial Measures and Their Limitations
In addition to our results and measures of performance
determined in accordance with U.S. GAAP presented in this press release, we believe that certain non-GAAP financial measures are useful
in evaluating and comparing our financial and operational performance over multiple periods, identifying trends affecting our business,
formulating business plans, and making strategic decisions.
Adjusted EBITDA is a key performance measure that
our management uses to assess our financial performance and is also used for internal planning and forecasting purposes. We define Adjusted
EBITDA as earnings (loss) before interest expense, income tax expense (benefit), depreciation and amortization, stock-based compensation
expense, employee stock purchase plan expense, non-recurring expenses, and certain other non-cash expenses.
We believe that Adjusted EBITDA, together with
a reconciliation to net income, helps identify underlying trends in our business and helps investors make comparisons between our company
and other companies that may have different capital structures, tax rates, or different forms of employee compensation. Accordingly, we
believe that Adjusted EBITDA provides useful information to investors and others in understanding and evaluating our operating results,
enhancing the overall understanding of our past performance and future prospects, and allowing for greater transparency with respect to
a key financial metric used by our management in its financial and operational decision-making. Our use of Adjusted EBITDA has limitations
as an analytical tool, and you should not consider these measures in isolation or as a substitute for analysis of our financial results
as reported under U.S. GAAP. Some of these potential limitations include:
| · | other companies, including companies in our industry which have similar business arrangements, may report Adjusted EBITDA, or similarly
titled measures but calculate them differently, which reduces their usefulness as comparative measures; |
| · | although depreciation and amortization expenses are non-cash charges, the assets being depreciated and amortized may have to be replaced
in the future, and Adjusted EBITDA does not reflect cash capital expenditures for such replacements or for new capital expenditure requirements; |
| · | Adjusted EBITDA also does not reflect changes in, or cash requirements for, our working capital needs or the potentially dilutive
impact of stock-based compensation; and |
| · | Adjusted EBITDA does not reflect the interest expense, or the cash requirements necessary to service interest or principal payments
on our debt that we may incur. |
Additionally, we report revenue growth on a constant-currency
basis in order to facilitate period-to-period comparisons of results without regard to the impact of fluctuating foreign currency exchange
rates. The term foreign currency exchange rates refers to the exchange rates used to translate the company's operating results for all
countries where the functional currency is not the U.S. dollar into U.S. dollars. Because we are a global company, foreign currency exchange
rates used for translation may have a significant effect on our reported results. References to revenue growth on a constant-currency
basis means without the impact of foreign currency exchange rate fluctuations.
The company believes disclosure of constant-currency
revenue growth rates is helpful to investors because it facilitates period-to-period comparisons. However, constant-currency revenue growth
rates are non-GAAP financial measures and are not meant to be considered as an alternative or substitute for comparable measures prepared
in accordance with GAAP. Constant-currency growth has no standardized meaning prescribed by GAAP and should be read in conjunction with
our consolidated financial statements prepared in accordance with GAAP. We calculate constant-currency growth rates by translating local
currency amounts in the current period at actual foreign exchange rates for the prior period.
Because of these and other limitations, you should
consider our non-GAAP measures only as supplemental to other GAAP-based financial measures.
Investor Contact:
Matt Brinckman
Senior Vice President, Strategy and Investor
Relations
mbrinckman@paragon28.com
PARAGON
28, INC. AND SUBSIDIARIES
CONDENSED CONSOLIDATED BALANCE SHEETS
(in
thousands, unaudited)
| | |
June 30, 2024 | | |
December 31, 2023 | |
| | |
| | |
(As Restated) | |
| ASSETS | |
| | | |
| | |
| Current assets: | |
| | | |
| | |
| Cash and cash equivalents | |
$ | 46,741 | | |
$ | 75,639 | |
| Trade receivables, net of allowance for doubtful accounts of $931 and $1,339, respectively | |
| 36,708 | | |
| 37,323 | |
| Inventories, net | |
| 96,406 | | |
| 90,046 | |
| Income taxes receivable | |
| 1,018 | | |
| 794 | |
| Other current assets | |
| 3,575 | | |
| 3,997 | |
| Total current assets | |
| 184,448 | | |
| 207,799 | |
| | |
| | | |
| | |
| Property and equipment, net | |
| 74,904 | | |
| 74,122 | |
| Intangible assets, net | |
| 20,977 | | |
| 21,674 | |
| Goodwill | |
| 25,465 | | |
| 25,465 | |
| Deferred income taxes | |
| 714 | | |
| 705 | |
| Other assets | |
| 3,959 | | |
| 2,918 | |
| Total assets | |
$ | 310,467 | | |
$ | 332,683 | |
| | |
| | | |
| | |
| LIABILITIES & STOCKHOLDERS' EQUITY | |
| | | |
| | |
| Current liabilities: | |
| | | |
| | |
| Accounts payable | |
$ | 23,136 | | |
$ | 21,696 | |
| Accrued expenses | |
| 26,531 | | |
| 27,781 | |
| Other current liabilities | |
| 962 | | |
| 883 | |
| Current maturities of long-term debt | |
| 640 | | |
| 640 | |
| Income taxes payable | |
| 422 | | |
| 243 | |
| Total current liabilities | |
| 51,691 | | |
| 51,243 | |
| | |
| | | |
| | |
| Long-term liabilities: | |
| | | |
| | |
| Long-term debt net, less current maturities | |
| 109,913 | | |
| 109,799 | |
| Other long-term liabilities | |
| 1,159 | | |
| 1,048 | |
| Deferred income taxes | |
| 231 | | |
| 233 | |
| Income taxes payable | |
| 638 | | |
| 635 | |
| Total liabilities | |
| 163,632 | | |
| 162,958 | |
| | |
| | | |
| | |
| Stockholders' equity: | |
| | | |
| | |
| Common stock, $0.01 par value, 300,000,000 shares authorized; 84,417,725 and 83,738,974 shares issued, and 83,504,206 and 82,825,455 shares outstanding as of June 30, 2024 and December 31, 2023, respectively | |
| 833 | | |
| 827 | |
| Additional paid in capital | |
| 307,524 | | |
| 298,394 | |
| Accumulated deficit | |
| (154,827 | ) | |
| (123,646 | ) |
| Accumulated other comprehensive loss | |
| (713 | ) | |
| 132 | |
| Treasury stock, at cost; 913,519 shares as of June 30, 2024 and December 31, 2023 | |
| (5,982 | ) | |
| (5,982 | ) |
| Total stockholders' equity | |
| 146,835 | | |
| 169,725 | |
| Total liabilities & stockholders' equity | |
$ | 310,467 | | |
$ | 332,683 | |
PARAGON 28, INC. AND SUBSIDIARIES
CONDENSED CONSOLIDATED STATEMENTS OF OPERATIONS
AND COMPREHENSIVE LOSS
(in
thousands, unaudited)
| | |
Three Months Ended June 30, | | |
Six Months Ended June 30, | |
| | |
2024 | | |
2023 | | |
2024 | | |
2023 | |
| | |
| | |
(As Restated) | | |
| | |
(As Restated) | |
| Net revenue | |
$ | 61,016 | | |
$ | 51,009 | | |
$ | 122,098 | | |
$ | 103,045 | |
| Cost of goods sold | |
| 15,261 | | |
| 11,599 | | |
| 29,103 | | |
| 21,828 | |
| Gross profit | |
| 45,755 | | |
| 39,410 | | |
| 92,995 | | |
| 81,217 | |
| | |
| | | |
| | | |
| | | |
| | |
| Operating expenses: | |
| | | |
| | | |
| | | |
| | |
| Research and development costs | |
| 7,083 | | |
| 7,683 | | |
| 14,667 | | |
| 14,732 | |
| Selling, general, and administrative | |
| 49,439 | | |
| 43,827 | | |
| 104,221 | | |
| 87,647 | |
| Total operating expenses | |
| 56,522 | | |
| 51,510 | | |
| 118,888 | | |
| 102,379 | |
| Operating loss | |
| (10,767 | ) | |
| (12,100 | ) | |
| (25,893 | ) | |
| (21,162 | ) |
| | |
| | | |
| | | |
| | | |
| | |
| Other income (expense): | |
| | | |
| | | |
| | | |
| | |
| Other income (expense), net | |
| 132 | | |
| (76 | ) | |
| 647 | | |
| (692 | ) |
| Interest expense, net | |
| (2,917 | ) | |
| (803 | ) | |
| (5,539 | ) | |
| (2,008 | ) |
| Total other expense, net | |
| (2,785 | ) | |
| (879 | ) | |
| (4,892 | ) | |
| (2,700 | ) |
| Loss before income taxes | |
| (13,552 | ) | |
| (12,979 | ) | |
| (30,785 | ) | |
| (23,862 | ) |
| Income tax expense | |
| 230 | | |
| 269 | | |
| 396 | | |
| 198 | |
| Net loss | |
$ | (13,782 | ) | |
$ | (13,248 | ) | |
$ | (31,181 | ) | |
$ | (24,060 | ) |
| Foreign currency translation adjustment | |
| 252 | | |
| (283 | ) | |
| (845 | ) | |
| (382 | ) |
| Comprehensive loss | |
$ | (13,530 | ) | |
$ | (13,531 | ) | |
$ | (32,026 | ) | |
$ | (24,442 | ) |
| Weighted average number of shares of common stock outstanding: | |
| | | |
| | | |
| | | |
| | |
| Basic | |
| 83,115,861 | | |
| 82,373,441 | | |
| 82,984,878 | | |
| 81,536,607 | |
| Diluted | |
| 83,115,861 | | |
| 82,373,441 | | |
| 82,984,878 | | |
| 81,536,607 | |
| Net loss per share attributable to common stockholders: | |
| | | |
| | | |
| | | |
| | |
| Basic | |
$ | (0.17 | ) | |
$ | (0.16 | ) | |
$ | (0.38 | ) | |
$ | (0.30 | ) |
| Diluted | |
$ | (0.17 | ) | |
$ | (0.16 | ) | |
$ | (0.38 | ) | |
$ | (0.30 | ) |
PARAGON 28, INC. AND SUBSIDIARIES
CONDENSED CONSOLIDATED STATEMENTS OF CASH FLOWS
(in
thousands, unaudited)
| | |
Six Months Ended June 30, | |
| | |
2024 | | |
2023 | |
| | |
| | |
(As Restated) | |
| Cash flows from operating activities | |
| | | |
| | |
| Net loss | |
$ | (31,181 | ) | |
$ | (24,060 | ) |
| Adjustments to reconcile net loss to net cash used in operating activities: | |
| | | |
| | |
| Depreciation and amortization | |
| 8,868 | | |
| 6,414 | |
| Allowance for doubtful accounts | |
| 785 | | |
| 147 | |
| Provision for excess and obsolete inventories | |
| 5,932 | | |
| 923 | |
| Stock-based compensation | |
| 6,112 | | |
| 6,782 | |
| Change in fair value of financial instruments | |
| (601 | ) | |
| 366 | |
| Other | |
| (581 | ) | |
| 394 | |
| Changes in other assets and liabilities, net of acquisitions: | |
| | | |
| | |
| Accounts receivable | |
| (360 | ) | |
| 3,138 | |
| Inventories | |
| (12,631 | ) | |
| (20,959 | ) |
| Accounts payable | |
| 1,456 | | |
| 14,745 | |
| Accrued expenses | |
| 809 | | |
| 1,845 | |
| Accrued legal settlement | |
| — | | |
| (22,000 | ) |
| Income tax receivable/payable | |
| (23 | ) | |
| (359 | ) |
| Other assets and liabilities | |
| 211 | | |
| (779 | ) |
| Net cash used in operating activities | |
| (21,204 | ) | |
| (33,403 | ) |
| | |
| | | |
| | |
| Cash flows from investing activities | |
| | | |
| | |
| Purchases of property and equipment | |
| (9,491 | ) | |
| (15,354 | ) |
| Proceeds from sale of property and equipment | |
| 724 | | |
| 635 | |
| Purchases of intangible assets | |
| (462 | ) | |
| (544 | ) |
| Net cash used in investing activities | |
| (9,229 | ) | |
| (15,263 | ) |
| | |
| | | |
| | |
| Cash flows from financing activities | |
| | | |
| | |
| Payments on long-term debt | |
| (320 | ) | |
| (396 | ) |
| Payments of debt issuance costs | |
| (18 | ) | |
| — | |
| Proceeds from issuance of common stock, net of issuance costs | |
| — | | |
| 68,453 | |
| Options exercised | |
| 2,878 | | |
| 2,464 | |
| RSU vesting, taxes paid | |
| (424 | ) | |
| — | |
| Proceeds from employee stock purchase plan | |
| 403 | | |
| 560 | |
| Payments on earnout liability | |
| (2,000 | ) | |
| (4,250 | ) |
| Net cash provided by financing activities | |
| 519 | | |
| 66,831 | |
| | |
| | | |
| | |
| Effect of exchange rate changes on cash and cash equivalents | |
| 1,016 | | |
| 114 | |
| Net (decrease) increase in cash and cash equivalents | |
| (28,898 | ) | |
| 18,279 | |
| Cash and cash equivalents at beginning of period | |
| 75,639 | | |
| 38,468 | |
| Cash and cash equivalents at end of period | |
$ | 46,741 | | |
$ | 56,747 | |
PARAGON 28, INC. AND SUBSIDIARIES
RECONCILIATION OF NET LOSS TO NON-GAAP ADJUSTED
EBITDA
(in thousands, unaudited)
| | |
Three Months Ended June 30, | | |
Six Months Ended June 30, | |
| | |
2024 | | |
2023 | | |
2024 | | |
2023 | |
| | |
| | |
(As Restated) | | |
| | |
(As Restated) | |
| Net loss | |
$ | (13,782 | ) | |
$ | (13,248 | ) | |
$ | (31,181 | ) | |
$ | (24,060 | ) |
| Interest expense, net | |
| 2,917 | | |
| 803 | | |
| 5,539 | | |
| 2,008 | |
| Income tax expense | |
| 230 | | |
| 269 | | |
| 396 | | |
| 198 | |
| Depreciation and amortization expense | |
| 4,610 | | |
| 3,297 | | |
| 8,868 | | |
| 6,414 | |
| Stock based compensation expense | |
| 3,024 | | |
| 3,600 | | |
| 6,112 | | |
| 6,782 | |
| Employee stock purchase plan expense | |
| 88 | | |
| 60 | | |
| 168 | | |
| 182 | |
| Change in fair value of financial instruments(1) | |
| (82 | ) | |
| (151 | ) | |
| (601 | ) | |
| 366 | |
| Adjusted EBITDA | |
$ | (2,995 | ) | |
$ | (5,370 | ) | |
$ | (10,699 | ) | |
$ | (8,110 | ) |
| (1) | Represents non-cash change in the fair value of our interest rate swap contract for all periods presented and earnout liabilities
for the three and six months ended June 30, 2023. |
PARAGON 28, INC. AND SUBSIDIARIES
Constant-Currency Revenue Growth
(in thousands, unaudited)
| | |
Three Months Ended June 30, | | |
Change | | |
Six Months Ended June 30, | | |
Change | |
| | |
2024 | | |
2023 | | |
% | | |
2024 | | |
2023 | | |
% | |
| Total Consolidated Revenues | |
| | | |
| | | |
| | | |
| | | |
| | | |
| | |
| As Reported | |
$ | 61,016 | | |
$ | 51,009 | | |
| 19.6 | % | |
$ | 122,098 | | |
$ | 103,045 | | |
| 18.5 | % |
| Impact of foreign currency exchange rates | |
| 24 | | |
| — | | |
| * | | |
| 47 | | |
| — | | |
| * | |
| Constant-currency net revenues | |
$ | 61,040 | | |
$ | 51,009 | | |
| 19.7 | % | |
$ | 122,145 | | |
$ | 103,045 | | |
| 18.5 | % |
| | |
| | | |
| | | |
| | | |
| | | |
| | | |
| | |
| Total International Revenues | |
| | | |
| | | |
| | | |
| | | |
| | | |
| | |
| As Reported | |
$ | 11,313 | | |
$ | 8,745 | | |
| 29.4 | % | |
$ | 21,345 | | |
$ | 15,800 | | |
| 35.1 | % |
| Impact of foreign currency exchange rates | |
| 24 | | |
| — | | |
| * | | |
| 47 | | |
| — | | |
| * | |
| Constant-currency net revenues | |
$ | 11,337 | | |
$ | 8,745 | | |
| 29.6 | % | |
$ | 21,392 | | |
$ | 15,800 | | |
| 35.4 | % |
Exhibit 99.2

1 2Q 2024 Earnings Update August 8, 2024
2 Copyright ©2024 Paragon 28. All rights reserved. Forward Looking Statements Except for the historical information contained herein, the matters set forth in this document are forward - looking statements within the meaning of the "safe harbor" provisions of the Private Securities Litigation Reform Act of 1995 , including, but not limited to : Paragon 28 ’s potential to shape a better future for foot and ankle patients ; the Company’s preliminary financial results for the quarter ended June 30 , 2024 ; statements about the Company’s 2024 net revenue guidance ; reaffirming the Company’s 2024 net revenue guidance ranges ; the anticipated timing of the filing of the restated filings ; the financial statements to be restated and the filings in which such restated financial statements will appear ; the Company's intent to report material weaknesses in its internal control over financial reporting ; and the Company’s operational efficiency strategy . You are cautioned not to place undue reliance on these forward - looking statements . Forward - looking statements are only predictions based on our current expectations, estimates, and assumptions, valid only as of the date they are made, and subject to risks and uncertainties, some of which we are not currently aware . Forward-looking statements should not be read as a guarantee of future performance or results and may not necessarily be accurate indications of the times at, or by, which such performance or results will be achieved . These forward-looking statements are based on Paragon 28 ’s current expectations and inherently involve significant risks and uncertainties and are subject to numerous risks, including, among other things, risks related to the timely and correct completion of the restatement and restated filings ; the risk that additional information may become known prior to the expected filing with the SEC of the restated filings or that other subsequent events may occur that would require the Company to make additional adjustments to its financial statements, which could be material, or delay the filing of the corrected or future periodic reports with the SEC ; risks related to the timing and results of the Company’s review of the effectiveness of internal control over financial reporting and related disclosure controls and procedures, remediation of the control deficiencies identified and our ability to implement and maintain effective internal control over financial reporting in the future, which may adversely affect the accuracy and timeliness of our financial reporting ; identification of errors in our financial reporting in the future that require us to restate previously issued financial statements, which may subject us to unanticipated costs or regulatory penalties and could cause investors to lose confidence in the accuracy and completeness of our financial statements ; factors relating to uncertainties as to any difficulties with respect to the Company's operational efficiency strategy, including expenses associated such strategy ; the effect of the announcement of the Company's operational efficiency strategy on the Company's ability to retain and hire key personnel and to maintain relationships with customers, suppliers and other business partners ; risks related to the possible diversion of management’s attention as a result of the Company's operational efficiency strategy ; uncertainties as to the Company's ability and the amount of time necessary to realize the expected benefits of the Company's operational efficiency strategy ; and those set forth under the caption “Risk Factors” in the Company’s most recent filings with the Securities and Exchange Commission . Actual results and the timing of events could differ materially from those anticipated in such forward-looking statements as a result of these risks and uncertainties . For a further description of the risks and uncertainties that could cause actual results to differ from those expressed in these forward - looking statements, as well as risks relating to Paragon 28 ’s business in general, see Paragon 28 ’s current and future reports filed with the Securities and Exchange Commission, including its Annual Report on Form 10 - K/A for the fiscal year ended December 31 , 2023 , as updated periodically with its other filings with the SEC . These forward - looking statements are made as of the date of this document, and Paragon 28 assumes no obligation to update the forward - looking statements, or to update the reasons why actual results could differ from those projected in the forward - looking statements, except as required by law . Paragon 28 ’s net revenue guidance for 2024 is not necessarily indicative of our operating results for any future periods .
3 Copyright ©2024 Paragon 28. All rights reserved. Non - GAAP Financial Measures In addition to our results and measures of performance determined in accordance with U . S . GAAP presented in this document, we believe that certain non - GAAP financial measures are useful in evaluating and comparing our financial and operational performance over multiple periods, identifying trends affecting our business, formulating business plans and making strategic decisions . Adjusted EBITDA is a key performance measure that our management uses to assess our financial performance and is also used for internal planning and forecasting purposes . We define Adjusted EBITDA as earnings (loss) before interest expense, income tax expense (benefit), depreciation and amortization, stock - based compensation expense, employee stock purchase plan expense, non - recurring expenses and certain other non - cash expenses . We believe that Adjusted EBITDA, together with a reconciliation to net income, helps identify underlying trends in our business and helps investors make comparisons between our company and other companies that may have different capital structures, tax rates, or different forms of employee compensation . Accordingly, we believe that Adjusted EBITDA provides useful information to investors and others in understanding and evaluating our operating results, enhancing the overall understanding of our past performance and future prospects, and allowing for greater transparency with respect to a key financial metric used by our management in its financial and operational decision - making . Our use of Adjusted EBITDA has limitations as an analytical tool, and you should not consider these measures in isolation or as a substitute for analysis of our financial results as reported under U . S . GAAP . Some of these potential limitations include : • other companies, including companies in our industry which have similar business arrangements, may report Adjusted EBITDA, or si milarly titled measures but calculate them differently, which reduces their usefulness as comparative measures; • although depreciation and amortization expenses are non - cash charges, the assets being depreciated and amortized may have to be replaced in the future, and Adjusted EBITDA does not reflect cash capital expenditures for such replacements or for new capital expenditure requirements; • Adjusted EBITDA also does not reflect changes in, or cash requirements for, our working capital needs or the potentially dilu tiv e impact of stock - based compensation; and • Adjusted EBITDA does not reflect the interest expense, or the cash requirements necessary to service interest or principal pa yme nts, on our debt that we may incur. Additionally, we report revenue growth on a constant - currency basis in order to facilitate period - to - period comparisons of results without regard to the impact of fluctuating foreign currency exchange rates . The term foreign currency exchange rates refers to the exchange rates used to translate the company's operating results for all countries where the functional currency is not the U . S . dollar into U . S . dollars . Because we are a global company, foreign currency exchange rates used for translation may have a significant effect on our reported results . References to revenue growth on a constant - currency basis means without the impact of foreign currency exchange rate fluctuations . The company believes disclosure of constant - currency revenue growth rates is helpful to investors because it facilitates period - to - period comparisons . However, constant - currency revenue growth rates are non - GAAP financial measures and are not meant to be considered as an alternative or substitute for comparable measures prepared in accordance with GAAP . Constant - currency growth has no standardized meaning prescribed by GAAP and should be read in conjunction with the consolidated financial statements prepared in accordance with GAAP . We calculate constant - currency growth rates by translating local currency amounts in the current period at actual foreign exchange rates for the prior period . Because of these and other limitations, you should consider our non - GAAP measures only as supplemental to other GAAP - based financial measures .
4 Copyright ©2024 Paragon 28. All rights reserved. 2Q 2024 Earnings Update – Table of Contents 2Q 2024 and YTD Highlights 5 2Q 2024 and YTD Revenue Performance 6 Operational Efficiency Strategy 7 Review of Impact Related to Recent Restatements 8 The Global Foot & Ankle Market 9 Continued Strong Product Launch Cadence & Pipeline 10 Smart Bun - Yo - Matic Case Management and Workflow 11
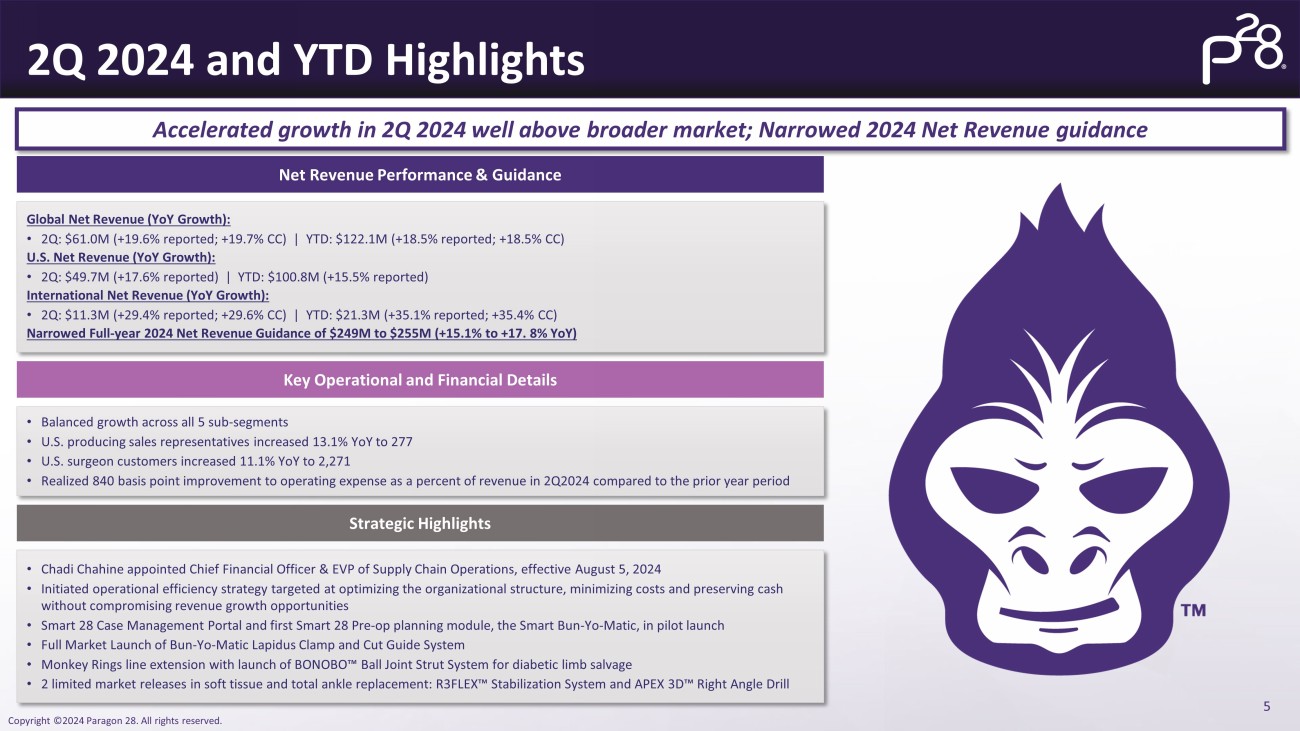
5 Copyright ©2024 Paragon 28. All rights reserved. 2Q 2024 and YTD Highlights Accelerated growth in 2Q 2024 well above broader market ; Narrowed 2024 Net Revenue guidance Net Revenue Performance & Guidance Key Operational and Financial Details Strategic Highlights Global Net Revenue (YoY Growth): • 2Q : $ 61.0M (+19.6% reported; +19.7% CC) | YTD: $ 122.1M (+18.5% reported; +18.5% CC) U.S. Net Revenue (YoY Growth): • 2Q : $ 49.7M (+17.6% reported) | YTD: $ 100.8M (+15.5% reported) International Net Revenue (YoY Growth): • 2Q : $ 11.3M (+29.4% reported; +29.6% CC) | YTD: $ 21.3M (+35.1% reported; +35.4% CC) Narrowed Full - year 2024 Net Revenue Guidance of $ 249M to $ 255M (+15.1% to +17. 8% YoY) • Balanced growth across all 5 sub - segments • U.S. p roducing sales representatives increased 13.1 % YoY to 277 • U.S. surgeon customers increased 11.1% YoY to 2,271 • Realized 840 basis point improvement to operating expense as a percent of revenue in 2Q2024 compared to the prior year period • Chadi Chahine appointed Chief Financial Officer & EVP of Supply Chain Operations, effective August 5, 2024 • Initiated operational efficiency strategy targeted at optimizing the organizational structure, minimizing costs and preservin g c ash without compromising revenue growth opportunities • Smart 28 Case Management Portal and first Smart 28 Pre - op planning module, the Smart Bun - Yo - Matic, in pilot launch • Full Market Launch of Bun - Yo - Matic Lapidus Clamp and Cut Guide System • Monkey Rings line extension with launch of BONOBO Ρ Ball Joint Strut System for diabetic limb salvage • 2 limited market releases in soft tissue and total ankle replacement: R3FLEX Ρ Stabilization System and APEX 3D Ρ Right Angle Drill
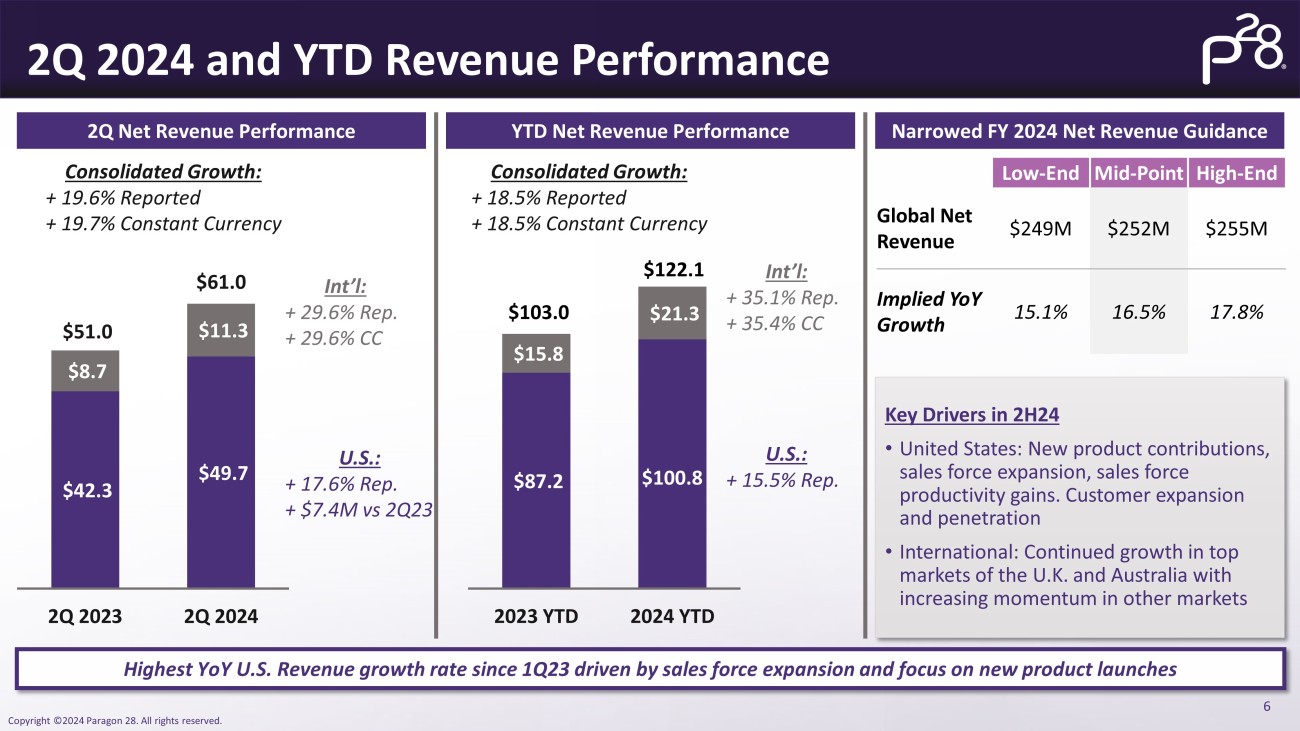
6 Copyright ©2024 Paragon 28. All rights reserved. 2 Q Net Revenue Performance Highest YoY U.S. Revenue growth rate since 1Q23 driven by sales force expansion and focus on new product launches YTD Net Revenue Performance Narrowed FY 2024 Net Revenue Guidance Consolidated Growth: + 19.6% Reported + 19.7% Constant Currency Int’l: + 29.6% Rep. + 29.6% CC U.S.: + 17.6% Rep. + $7.4M vs 2Q23 Consolidated Growth: + 18.5% Reported + 18.5% Constant Currency Int’l: + 35.1% Rep. + 35.4% CC U.S.: + 15.5% Rep. 2Q 2024 and YTD Revenue Performance $42.3 $49.7 $8.7 $11.3 $51.0 $61.0 2Q 2023 2Q 2024 $87.2 $100.8 $15.8 $21.3 $103.0 $122.1 2023 YTD 2024 YTD Low - End Mid - Point High - End Global Net Revenue $249M $252M $255M Implied YoY Growth 15.1% 16.5% 17.8% Key Drivers in 2H24 • United States: New product contributions, sales force expansion, sales force productivity gains. Customer expansion and penetration • International: Continued growth in top markets of the U.K. and Australia with increasing momentum in other markets
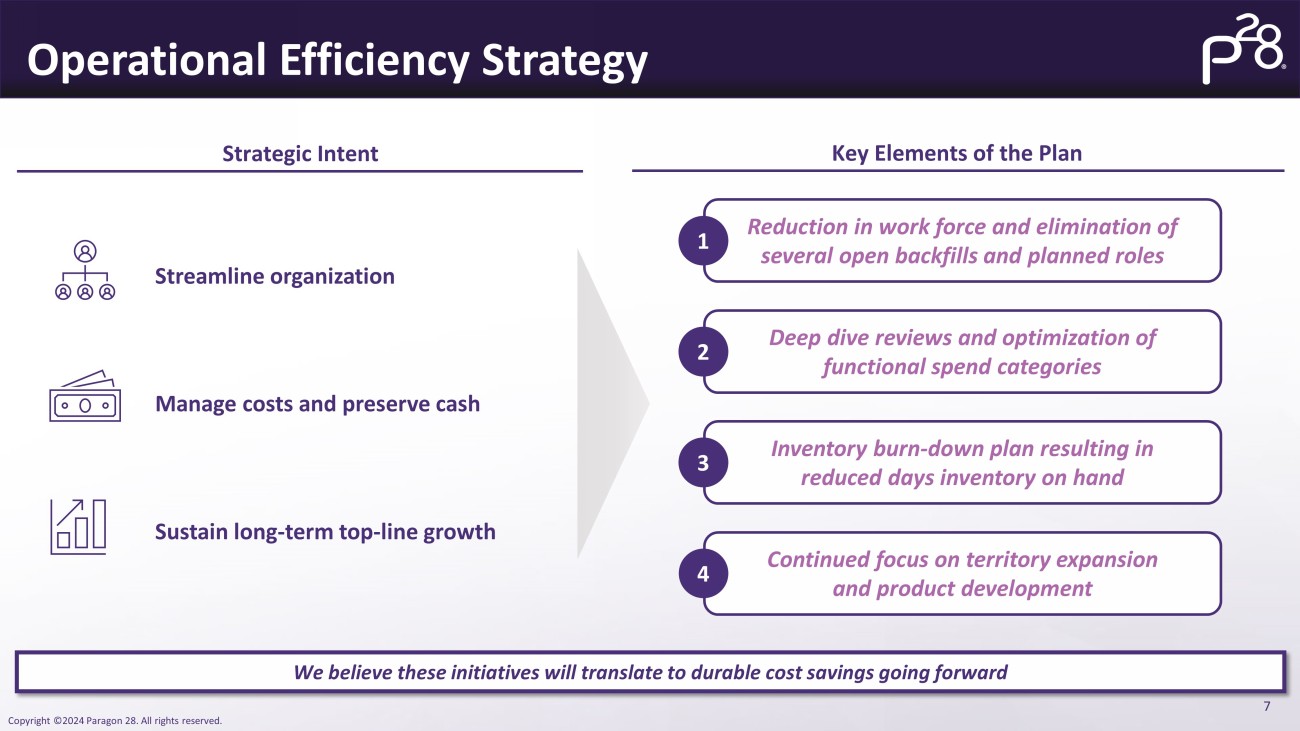
7 Copyright ©2024 Paragon 28. All rights reserved. Operational Efficiency Strategy We believe these initiatives will translate to durable cost savings going forward Streamline organization Manage costs and preserve cash Sustain long - term top - line growth Strategic Intent Key Elements of the Plan Reduction in work force and elimination of several open backfills and planned roles Continued focus on territory expansion and product development Deep dive reviews and optimization of functional spend categories Inventory burn - down plan resulting in reduced days inventory on hand 1 2 3 4
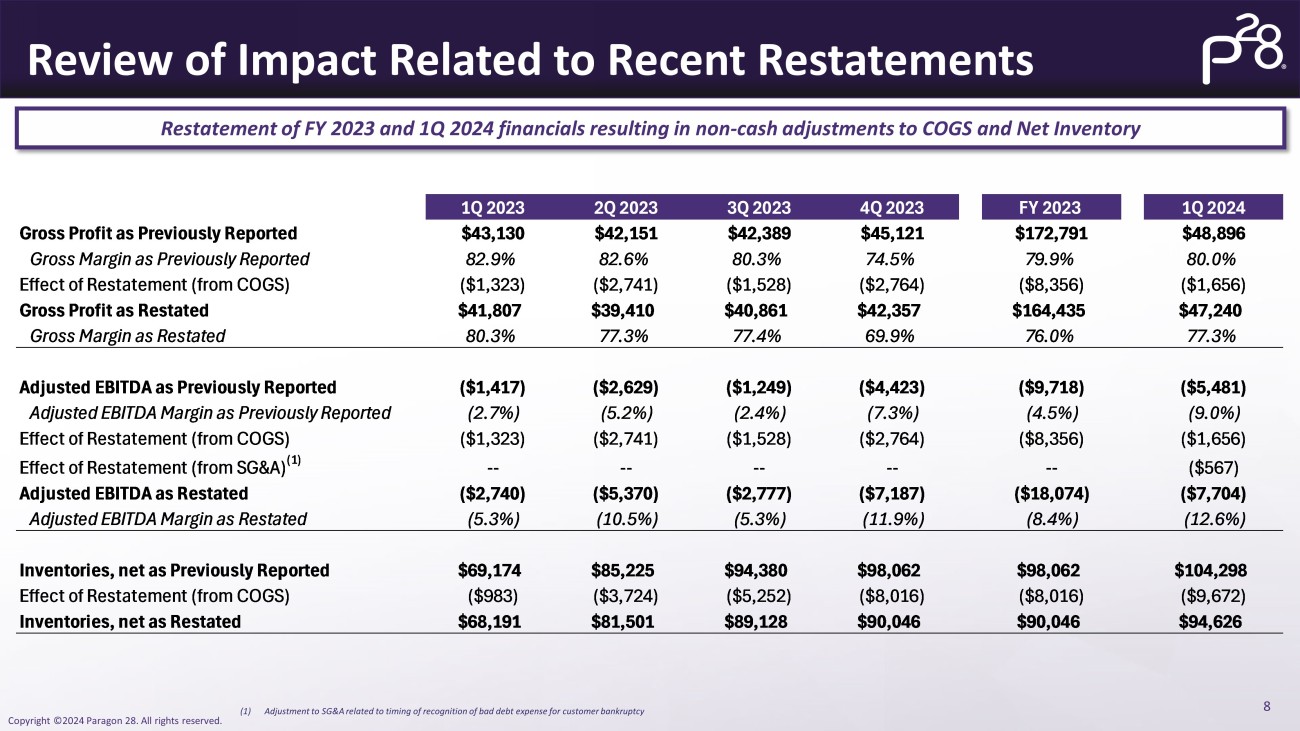
8 Copyright ©2024 Paragon 28. All rights reserved. 1Q 2023 2Q 2023 3Q 2023 4Q 2023 FY 2023 1Q 2024 Gross Profit as Previously Reported $43,130 $42,151 $42,389 $45,121 $172,791 $48,896 Gross Margin as Previously Reported 82.9% 82.6% 80.3% 74.5% 79.9% 80.0% Effect of Restatement (from COGS) ($1,323) ($2,741) ($1,528) ($2,764) ($8,356) ($1,656) Gross Profit as Restated $41,807 $39,410 $40,861 $42,357 $164,435 $47,240 Gross Margin as Restated 80.3% 77.3% 77.4% 69.9% 76.0% 77.3% Adjusted EBITDA as Previously Reported ($1,417) ($2,629) ($1,249) ($4,423) ($9,718) ($5,481) Adjusted EBITDA Margin as Previously Reported (2.7%) (5.2%) (2.4%) (7.3%) (4.5%) (9.0%) Effect of Restatement (from COGS) ($1,323) ($2,741) ($1,528) ($2,764) ($8,356) ($1,656) Effect of Restatement (from SG&A) (1) -- -- -- -- -- ($567) Adjusted EBITDA as Restated ($2,740) ($5,370) ($2,777) ($7,187) ($18,074) ($7,704) Adjusted EBITDA Margin as Restated (5.3%) (10.5%) (5.3%) (11.9%) (8.4%) (12.6%) Inventories, net as Previously Reported $69,174 $85,225 $94,380 $98,062 $98,062 $104,298 Effect of Restatement (from COGS) ($983) ($3,724) ($5,252) ($8,016) ($8,016) ($9,672) Inventories, net as Restated $68,191 $81,501 $89,128 $90,046 $90,046 $94,626 Review of Impact Related to Recent Restatements (1) Adjustment to SG&A related to timing of recognition of bad debt expense for customer bankruptcy Restatement of FY 2023 and 1Q 2024 financials resulting in non - cash adjustments to COGS and Net Inventory
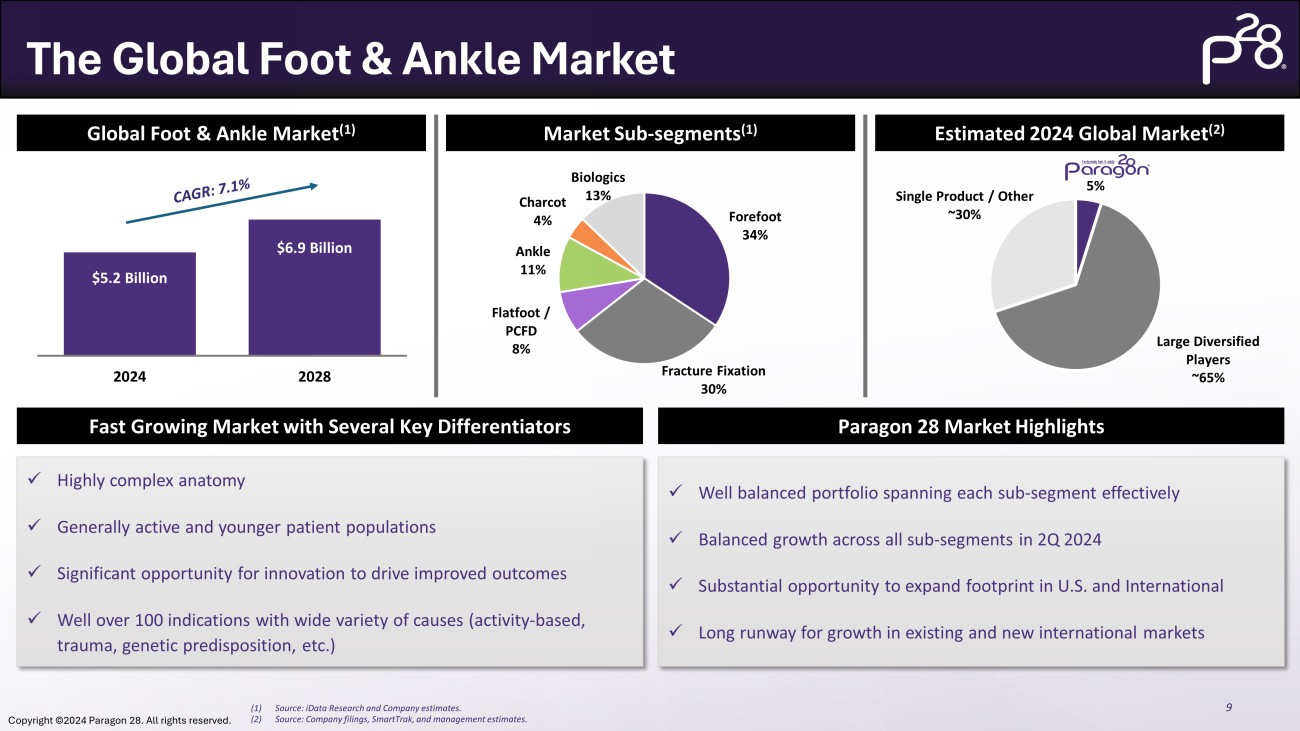
9 Copyright ©2024 Paragon 28. All rights reserved. $5.2 Billion $6.9 Billion 2024 2028 The Global Foot & Ankle Market Global Foot & Ankle Market (1) Market Sub - segments (1) Estimated 20 24 Global Market (2) Forefoot 34% Fracture Fixation 30% Flatfoot / PCFD 8% Ankle 11% Charcot 4% Biologics 13% 5% Large Diversified Players ~ 65% Single Product / Other ~ 30% (1) Source: iData Research and Company estimates. (2) Source: Company filings, SmartTrak , and management estimates. Fast Growing Market with Several Key Differentiators Paragon 28 Market Highlights x Highly complex anatomy x Generally active and younger patient populations x Significant opportunity for innovation to drive improved outcomes x Well over 100 indications with wide variety of causes (activity - based, trauma, genetic predisposition, etc.) x Well balanced portfolio spanning each sub - segment effectively x Double digit growth across all sub - segments in 2Q 2024 x Substantial opportunity to expand footprint in U.S. and International x Long runway for growth in existing and new international markets
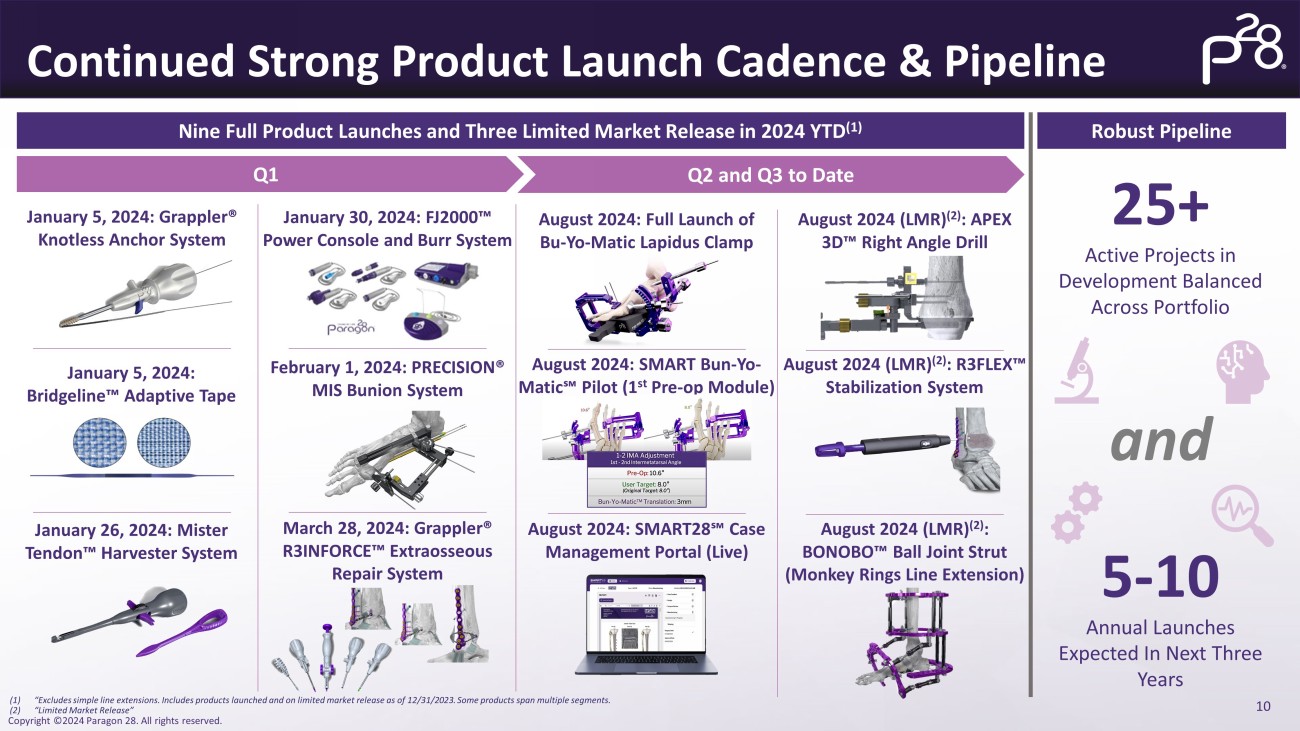
10 Copyright ©2024 Paragon 28. All rights reserved. Continued Strong Product Launch Cadence & Pipeline Nine Full Product L aunches and Three Limited Market Release in 2024 YTD (1) Robust Pipeline January 5, 2024 : Grappler® Knotless Anchor System January 30, 2024 : FJ2000 Ρ Power Console and Burr System February 1, 2024: PRECISION® MIS Bunion System January 5, 2024: Bridgeline Ρ Adaptive Tape January 26, 2024: Mister Tendon Ρ Harvester System (1) “ Excludes simple line extensions. Includes products launched and on limited market release as of 12/31/2023. Some products spa n m ultiple segments. (2) “Limited Market Release” March 28, 2024: Grappler® R3INFORCE Ρ Extraosseous Repair System 25+ Active Projects in Development Balanced Across Portfolio 5 - 10 Annual Launches Expected In Next Three Years and Q1 Q2 and Q3 to Date August 2024: SMART28℠ Case Management Portal (Live) August 2024: SMART Bun - Yo - Matic℠ Pilot (1 st Pre - op Module) August 2024: Full Launch of Bu - Yo - Matic Lapidus Clamp August 2024 (LMR) (2) : APEX 3D Ρ Right Angle Drill August 2024 (LMR) (2) : R3FLEX Ρ Stabilization System August 2024 (LMR) (2) : BONOBO Ρ Ball Joint Strut (Monkey Rings Line Extension)

11 Copyright ©2024 Paragon 28. All rights reserved. Smart Bun - Yo - Matic Case Management and Workflow Bringing unique patient solutions to life with powerful planning combined with precise instrumentation Surgeon accesses the Smart 28 Case Management Portal Select Smart Bun - Yo - Matic CT or X - Ray program Upload the medical images (CT or X - rays) Leveraging AI - enabled algorithms, the program rapidly characterizes anatomy and calculates a patient specific surgical plan Results are displayed for the surgeon to review and adjust as needed Surgeon precisely achieves the planned correction using the Bun - Yo - Matic guide The surgical plan is seamlessly compiled into a report for interoperative use 1 2 3 5 6 7 For more information please regarding the Smart 28 ecosystem and modules please visit: https://smart.paragon28.com/ “The ability to 3D plan your Hallux Valgus correction is crucial… Even more revolutionary is the capability to apply, control, and achieve the planned correction with the use of the Jig.” Dr. Cesar de Cesar Netto , surgeon designer and first user of the Smart Bun - Yo - Matic 4
v3.24.2.u1
| X |
- DefinitionBoolean flag that is true when the XBRL content amends previously-filed or accepted submission.
| Name: |
dei_AmendmentFlag |
| Namespace Prefix: |
dei_ |
| Data Type: |
xbrli:booleanItemType |
| Balance Type: |
na |
| Period Type: |
duration |
|
| X |
- DefinitionFor the EDGAR submission types of Form 8-K: the date of the report, the date of the earliest event reported; for the EDGAR submission types of Form N-1A: the filing date; for all other submission types: the end of the reporting or transition period. The format of the date is YYYY-MM-DD.
| Name: |
dei_DocumentPeriodEndDate |
| Namespace Prefix: |
dei_ |
| Data Type: |
xbrli:dateItemType |
| Balance Type: |
na |
| Period Type: |
duration |
|
| X |
- DefinitionThe type of document being provided (such as 10-K, 10-Q, 485BPOS, etc). The document type is limited to the same value as the supporting SEC submission type, or the word 'Other'.
| Name: |
dei_DocumentType |
| Namespace Prefix: |
dei_ |
| Data Type: |
dei:submissionTypeItemType |
| Balance Type: |
na |
| Period Type: |
duration |
|
| X |
- DefinitionAddress Line 1 such as Attn, Building Name, Street Name
| Name: |
dei_EntityAddressAddressLine1 |
| Namespace Prefix: |
dei_ |
| Data Type: |
xbrli:normalizedStringItemType |
| Balance Type: |
na |
| Period Type: |
duration |
|
| X |
- Definition
+ References
+ Details
| Name: |
dei_EntityAddressCityOrTown |
| Namespace Prefix: |
dei_ |
| Data Type: |
xbrli:normalizedStringItemType |
| Balance Type: |
na |
| Period Type: |
duration |
|
| X |
- DefinitionCode for the postal or zip code
| Name: |
dei_EntityAddressPostalZipCode |
| Namespace Prefix: |
dei_ |
| Data Type: |
xbrli:normalizedStringItemType |
| Balance Type: |
na |
| Period Type: |
duration |
|
| X |
- DefinitionName of the state or province.
| Name: |
dei_EntityAddressStateOrProvince |
| Namespace Prefix: |
dei_ |
| Data Type: |
dei:stateOrProvinceItemType |
| Balance Type: |
na |
| Period Type: |
duration |
|
| X |
- DefinitionA unique 10-digit SEC-issued value to identify entities that have filed disclosures with the SEC. It is commonly abbreviated as CIK. Reference 1: http://www.xbrl.org/2003/role/presentationRef
-Publisher SEC
-Name Exchange Act
-Number 240
-Section 12
-Subsection b-2
| Name: |
dei_EntityCentralIndexKey |
| Namespace Prefix: |
dei_ |
| Data Type: |
dei:centralIndexKeyItemType |
| Balance Type: |
na |
| Period Type: |
duration |
|
| X |
- DefinitionIndicate if registrant meets the emerging growth company criteria. Reference 1: http://www.xbrl.org/2003/role/presentationRef
-Publisher SEC
-Name Exchange Act
-Number 240
-Section 12
-Subsection b-2
| Name: |
dei_EntityEmergingGrowthCompany |
| Namespace Prefix: |
dei_ |
| Data Type: |
xbrli:booleanItemType |
| Balance Type: |
na |
| Period Type: |
duration |
|
| X |
- DefinitionCommission file number. The field allows up to 17 characters. The prefix may contain 1-3 digits, the sequence number may contain 1-8 digits, the optional suffix may contain 1-4 characters, and the fields are separated with a hyphen.
| Name: |
dei_EntityFileNumber |
| Namespace Prefix: |
dei_ |
| Data Type: |
dei:fileNumberItemType |
| Balance Type: |
na |
| Period Type: |
duration |
|
| X |
- DefinitionTwo-character EDGAR code representing the state or country of incorporation.
| Name: |
dei_EntityIncorporationStateCountryCode |
| Namespace Prefix: |
dei_ |
| Data Type: |
dei:edgarStateCountryItemType |
| Balance Type: |
na |
| Period Type: |
duration |
|
| X |
- DefinitionThe exact name of the entity filing the report as specified in its charter, which is required by forms filed with the SEC. Reference 1: http://www.xbrl.org/2003/role/presentationRef
-Publisher SEC
-Name Exchange Act
-Number 240
-Section 12
-Subsection b-2
| Name: |
dei_EntityRegistrantName |
| Namespace Prefix: |
dei_ |
| Data Type: |
xbrli:normalizedStringItemType |
| Balance Type: |
na |
| Period Type: |
duration |
|
| X |
- DefinitionThe Tax Identification Number (TIN), also known as an Employer Identification Number (EIN), is a unique 9-digit value assigned by the IRS. Reference 1: http://www.xbrl.org/2003/role/presentationRef
-Publisher SEC
-Name Exchange Act
-Number 240
-Section 12
-Subsection b-2
| Name: |
dei_EntityTaxIdentificationNumber |
| Namespace Prefix: |
dei_ |
| Data Type: |
dei:employerIdItemType |
| Balance Type: |
na |
| Period Type: |
duration |
|
| X |
- DefinitionLocal phone number for entity.
| Name: |
dei_LocalPhoneNumber |
| Namespace Prefix: |
dei_ |
| Data Type: |
xbrli:normalizedStringItemType |
| Balance Type: |
na |
| Period Type: |
duration |
|
| X |
- DefinitionBoolean flag that is true when the Form 8-K filing is intended to satisfy the filing obligation of the registrant as pre-commencement communications pursuant to Rule 13e-4(c) under the Exchange Act. Reference 1: http://www.xbrl.org/2003/role/presentationRef
-Publisher SEC
-Name Exchange Act
-Number 240
-Section 13e
-Subsection 4c
| Name: |
dei_PreCommencementIssuerTenderOffer |
| Namespace Prefix: |
dei_ |
| Data Type: |
xbrli:booleanItemType |
| Balance Type: |
na |
| Period Type: |
duration |
|
| X |
- DefinitionBoolean flag that is true when the Form 8-K filing is intended to satisfy the filing obligation of the registrant as pre-commencement communications pursuant to Rule 14d-2(b) under the Exchange Act. Reference 1: http://www.xbrl.org/2003/role/presentationRef
-Publisher SEC
-Name Exchange Act
-Number 240
-Section 14d
-Subsection 2b
| Name: |
dei_PreCommencementTenderOffer |
| Namespace Prefix: |
dei_ |
| Data Type: |
xbrli:booleanItemType |
| Balance Type: |
na |
| Period Type: |
duration |
|
| X |
- DefinitionTitle of a 12(b) registered security. Reference 1: http://www.xbrl.org/2003/role/presentationRef
-Publisher SEC
-Name Exchange Act
-Number 240
-Section 12
-Subsection b
| Name: |
dei_Security12bTitle |
| Namespace Prefix: |
dei_ |
| Data Type: |
dei:securityTitleItemType |
| Balance Type: |
na |
| Period Type: |
duration |
|
| X |
- DefinitionName of the Exchange on which a security is registered. Reference 1: http://www.xbrl.org/2003/role/presentationRef
-Publisher SEC
-Name Exchange Act
-Number 240
-Section 12
-Subsection d1-1
| Name: |
dei_SecurityExchangeName |
| Namespace Prefix: |
dei_ |
| Data Type: |
dei:edgarExchangeCodeItemType |
| Balance Type: |
na |
| Period Type: |
duration |
|
| X |
- DefinitionBoolean flag that is true when the Form 8-K filing is intended to satisfy the filing obligation of the registrant as soliciting material pursuant to Rule 14a-12 under the Exchange Act. Reference 1: http://www.xbrl.org/2003/role/presentationRef
-Publisher SEC
-Name Exchange Act
-Section 14a
-Number 240
-Subsection 12
| Name: |
dei_SolicitingMaterial |
| Namespace Prefix: |
dei_ |
| Data Type: |
xbrli:booleanItemType |
| Balance Type: |
na |
| Period Type: |
duration |
|
| X |
- DefinitionTrading symbol of an instrument as listed on an exchange.
| Name: |
dei_TradingSymbol |
| Namespace Prefix: |
dei_ |
| Data Type: |
dei:tradingSymbolItemType |
| Balance Type: |
na |
| Period Type: |
duration |
|
| X |
- DefinitionBoolean flag that is true when the Form 8-K filing is intended to satisfy the filing obligation of the registrant as written communications pursuant to Rule 425 under the Securities Act. Reference 1: http://www.xbrl.org/2003/role/presentationRef
-Publisher SEC
-Name Securities Act
-Number 230
-Section 425
| Name: |
dei_WrittenCommunications |
| Namespace Prefix: |
dei_ |
| Data Type: |
xbrli:booleanItemType |
| Balance Type: |
na |
| Period Type: |
duration |
|
Paragon 28 (NYSE:FNA)
Historical Stock Chart
From Feb 2025 to Mar 2025

Paragon 28 (NYSE:FNA)
Historical Stock Chart
From Mar 2024 to Mar 2025

