false2024Q20001574197--12-3110010075.037.5http://fasb.org/us-gaap/2024#SecuredOvernightFinancingRateSofrMemberhttp://fasb.org/us-gaap/2024#OtherAssetshttp://fasb.org/us-gaap/2024#OtherAssetshttp://fasb.org/us-gaap/2024#AccountsPayableAndAccruedLiabilitiesCurrentAndNoncurrent http://fasb.org/us-gaap/2024#OtherLiabilitieshttp://fasb.org/us-gaap/2024#AccountsPayableAndAccruedLiabilitiesCurrentAndNoncurrent http://fasb.org/us-gaap/2024#OtherLiabilitiesxbrli:sharesiso4217:USDiso4217:USDxbrli:sharesfph:votexbrli:purefph:memberfph:individualfph:buildingutr:acreutr:sqftfph:class00015741972024-01-012024-06-300001574197us-gaap:CommonClassAMember2024-07-120001574197us-gaap:CommonClassBMember2024-07-1200015741972024-06-3000015741972023-12-310001574197us-gaap:RelatedPartyMember2024-06-300001574197us-gaap:RelatedPartyMember2023-12-310001574197us-gaap:NonrelatedPartyMember2024-06-300001574197us-gaap:NonrelatedPartyMember2023-12-310001574197us-gaap:CommonClassAMember2024-06-300001574197us-gaap:CommonClassAMember2023-12-310001574197us-gaap:CommonClassBMember2024-06-300001574197us-gaap:CommonClassBMember2023-12-310001574197us-gaap:LandMemberus-gaap:NonrelatedPartyMember2024-04-012024-06-300001574197us-gaap:LandMemberus-gaap:NonrelatedPartyMember2023-04-012023-06-300001574197us-gaap:LandMemberus-gaap:NonrelatedPartyMember2024-01-012024-06-300001574197us-gaap:LandMemberus-gaap:NonrelatedPartyMember2023-01-012023-06-300001574197us-gaap:RelatedPartyMemberus-gaap:LandMember2024-04-012024-06-300001574197us-gaap:RelatedPartyMemberus-gaap:LandMember2023-04-012023-06-300001574197us-gaap:RelatedPartyMemberus-gaap:LandMember2024-01-012024-06-300001574197us-gaap:RelatedPartyMemberus-gaap:LandMember2023-01-012023-06-300001574197us-gaap:RelatedPartyMemberus-gaap:ManagementServiceMember2024-04-012024-06-300001574197us-gaap:RelatedPartyMemberus-gaap:ManagementServiceMember2023-04-012023-06-300001574197us-gaap:RelatedPartyMemberus-gaap:ManagementServiceMember2024-01-012024-06-300001574197us-gaap:RelatedPartyMemberus-gaap:ManagementServiceMember2023-01-012023-06-300001574197fph:OperatingPropertiesMemberus-gaap:NonrelatedPartyMember2024-04-012024-06-300001574197fph:OperatingPropertiesMemberus-gaap:NonrelatedPartyMember2023-04-012023-06-300001574197fph:OperatingPropertiesMemberus-gaap:NonrelatedPartyMember2024-01-012024-06-300001574197fph:OperatingPropertiesMemberus-gaap:NonrelatedPartyMember2023-01-012023-06-3000015741972024-04-012024-06-3000015741972023-04-012023-06-3000015741972023-01-012023-06-300001574197us-gaap:LandMember2024-04-012024-06-300001574197us-gaap:LandMember2023-04-012023-06-300001574197us-gaap:LandMember2024-01-012024-06-300001574197us-gaap:LandMember2023-01-012023-06-300001574197us-gaap:ManagementServiceMember2024-04-012024-06-300001574197us-gaap:ManagementServiceMember2023-04-012023-06-300001574197us-gaap:ManagementServiceMember2024-01-012024-06-300001574197us-gaap:ManagementServiceMember2023-01-012023-06-300001574197fph:OperatingPropertiesMember2024-04-012024-06-300001574197fph:OperatingPropertiesMember2023-04-012023-06-300001574197fph:OperatingPropertiesMember2024-01-012024-06-300001574197fph:OperatingPropertiesMember2023-01-012023-06-300001574197us-gaap:CommonClassAMember2024-04-012024-06-300001574197us-gaap:CommonClassAMember2023-04-012023-06-300001574197us-gaap:CommonClassAMember2024-01-012024-06-300001574197us-gaap:CommonClassAMember2023-01-012023-06-300001574197us-gaap:CommonClassBMember2024-04-012024-06-300001574197us-gaap:CommonClassBMember2023-04-012023-06-300001574197us-gaap:CommonClassBMember2024-01-012024-06-300001574197us-gaap:CommonClassBMember2023-01-012023-06-300001574197us-gaap:CommonClassAMemberus-gaap:CommonStockMember2024-03-310001574197us-gaap:CommonClassBMemberus-gaap:CommonStockMember2024-03-310001574197us-gaap:AdditionalPaidInCapitalMember2024-03-310001574197us-gaap:RetainedEarningsMember2024-03-310001574197us-gaap:AccumulatedOtherComprehensiveIncomeMember2024-03-310001574197us-gaap:ParentMember2024-03-310001574197us-gaap:NoncontrollingInterestMember2024-03-3100015741972024-03-310001574197us-gaap:RetainedEarningsMember2024-04-012024-06-300001574197us-gaap:ParentMember2024-04-012024-06-300001574197us-gaap:NoncontrollingInterestMember2024-04-012024-06-300001574197us-gaap:AdditionalPaidInCapitalMember2024-04-012024-06-300001574197us-gaap:AccumulatedOtherComprehensiveIncomeMember2024-04-012024-06-300001574197us-gaap:CommonClassAMemberus-gaap:CommonStockMember2024-06-300001574197us-gaap:CommonClassBMemberus-gaap:CommonStockMember2024-06-300001574197us-gaap:AdditionalPaidInCapitalMember2024-06-300001574197us-gaap:RetainedEarningsMember2024-06-300001574197us-gaap:AccumulatedOtherComprehensiveIncomeMember2024-06-300001574197us-gaap:ParentMember2024-06-300001574197us-gaap:NoncontrollingInterestMember2024-06-300001574197us-gaap:CommonClassAMemberus-gaap:CommonStockMember2023-03-310001574197us-gaap:CommonClassBMemberus-gaap:CommonStockMember2023-03-310001574197us-gaap:AdditionalPaidInCapitalMember2023-03-310001574197us-gaap:RetainedEarningsMember2023-03-310001574197us-gaap:AccumulatedOtherComprehensiveIncomeMember2023-03-310001574197us-gaap:ParentMember2023-03-310001574197us-gaap:NoncontrollingInterestMember2023-03-3100015741972023-03-310001574197us-gaap:RetainedEarningsMember2023-04-012023-06-300001574197us-gaap:ParentMember2023-04-012023-06-300001574197us-gaap:NoncontrollingInterestMember2023-04-012023-06-300001574197us-gaap:AdditionalPaidInCapitalMember2023-04-012023-06-300001574197us-gaap:AccumulatedOtherComprehensiveIncomeMember2023-04-012023-06-300001574197us-gaap:CommonClassAMemberus-gaap:CommonStockMember2023-06-300001574197us-gaap:CommonClassBMemberus-gaap:CommonStockMember2023-06-300001574197us-gaap:AdditionalPaidInCapitalMember2023-06-300001574197us-gaap:RetainedEarningsMember2023-06-300001574197us-gaap:AccumulatedOtherComprehensiveIncomeMember2023-06-300001574197us-gaap:ParentMember2023-06-300001574197us-gaap:NoncontrollingInterestMember2023-06-3000015741972023-06-300001574197us-gaap:CommonClassAMemberus-gaap:CommonStockMember2023-12-310001574197us-gaap:CommonClassBMemberus-gaap:CommonStockMember2023-12-310001574197us-gaap:AdditionalPaidInCapitalMember2023-12-310001574197us-gaap:RetainedEarningsMember2023-12-310001574197us-gaap:AccumulatedOtherComprehensiveIncomeMember2023-12-310001574197us-gaap:ParentMember2023-12-310001574197us-gaap:NoncontrollingInterestMember2023-12-310001574197us-gaap:RetainedEarningsMember2024-01-012024-06-300001574197us-gaap:ParentMember2024-01-012024-06-300001574197us-gaap:NoncontrollingInterestMember2024-01-012024-06-300001574197us-gaap:AdditionalPaidInCapitalMember2024-01-012024-06-300001574197us-gaap:CommonClassAMemberus-gaap:CommonStockMember2024-01-012024-06-300001574197us-gaap:AccumulatedOtherComprehensiveIncomeMember2024-01-012024-06-300001574197us-gaap:CommonClassAMemberus-gaap:CommonStockMember2022-12-310001574197us-gaap:CommonClassBMemberus-gaap:CommonStockMember2022-12-310001574197us-gaap:AdditionalPaidInCapitalMember2022-12-310001574197us-gaap:RetainedEarningsMember2022-12-310001574197us-gaap:AccumulatedOtherComprehensiveIncomeMember2022-12-310001574197us-gaap:ParentMember2022-12-310001574197us-gaap:NoncontrollingInterestMember2022-12-3100015741972022-12-310001574197us-gaap:RetainedEarningsMember2023-01-012023-06-300001574197us-gaap:ParentMember2023-01-012023-06-300001574197us-gaap:NoncontrollingInterestMember2023-01-012023-06-300001574197us-gaap:AdditionalPaidInCapitalMember2023-01-012023-06-300001574197us-gaap:CommonClassAMemberus-gaap:CommonStockMember2023-01-012023-06-300001574197us-gaap:AccumulatedOtherComprehensiveIncomeMember2023-01-012023-06-300001574197fph:GreatParkVentureMember2024-01-012024-06-300001574197fph:GreatParkVentureMember2023-01-012023-06-300001574197fph:ValenciaLandbankVentureMember2024-01-012024-06-300001574197fph:ValenciaLandbankVentureMember2023-01-012023-06-300001574197us-gaap:CommonClassBMember2024-01-012024-06-300001574197us-gaap:RelatedPartyMembersrt:ParentCompanyMemberfph:FivePointOperatingCompanyLLCMemberfph:FivePointOperatingCompanyLLCMember2024-01-012024-06-300001574197us-gaap:RelatedPartyMembersrt:ParentCompanyMemberfph:FivePointOperatingCompanyLLCMember2024-01-012024-06-300001574197us-gaap:SubsequentEventMember2024-07-120001574197us-gaap:RelatedPartyMembersrt:ParentCompanyMemberus-gaap:SubsequentEventMemberfph:FivePointOperatingCompanyLLCMember2024-07-120001574197us-gaap:RelatedPartyMemberfph:FivePointOperatingCompanyLLCMemberfph:TheSanFranciscoVentureMember2024-06-300001574197us-gaap:RelatedPartyMemberfph:FivePointOperatingCompanyLLCMemberfph:TheSanFranciscoVentureMember2024-01-012024-06-300001574197us-gaap:SubsidiaryOfCommonParentMemberfph:FivePointLandLLCMember2024-01-012024-06-300001574197fph:GreatParkVentureMemberfph:ContingentPaymentsDuefromRelatedPartiesMemberus-gaap:EquityMethodInvesteeMember2024-06-300001574197fph:GreatParkVentureMemberus-gaap:SubsequentEventMemberus-gaap:EquityMethodInvesteeMemberfph:ContractAssetsLegacyIncentiveCompensationReceivableMember2024-07-120001574197fph:HeritageFieldsLLCMember2024-06-300001574197fph:GreatParkVentureMember2024-06-300001574197fph:FivePointOfficeVentureHoldingsILLCAcquisitionMemberfph:FPOVHIMemberLLCMember2024-06-300001574197fph:SanFranciscoVentureMemberus-gaap:SubsidiaryOfCommonParentMember2024-01-012024-06-300001574197fph:FivePointOfficeVentureHoldingsILLCAcquisitionMemberfph:FPOVHIMemberLLCMember2024-06-300001574197us-gaap:SeniorNotesMemberfph:SeniorNotesDue20257.875Member2024-06-300001574197us-gaap:LandMemberfph:ValenciaMember2024-04-012024-06-300001574197us-gaap:LandMemberfph:SanFranciscoMember2024-04-012024-06-300001574197us-gaap:LandMemberfph:GreatParkVentureMember2024-04-012024-06-300001574197us-gaap:LandMemberfph:CommercialLeasingMember2024-04-012024-06-300001574197us-gaap:LandMemberfph:ValenciaMember2024-01-012024-06-300001574197us-gaap:LandMemberfph:SanFranciscoMember2024-01-012024-06-300001574197us-gaap:LandMemberfph:GreatParkVentureMember2024-01-012024-06-300001574197us-gaap:LandMemberfph:CommercialLeasingMember2024-01-012024-06-300001574197fph:ValenciaMemberus-gaap:ManagementServiceMember2024-04-012024-06-300001574197fph:SanFranciscoMemberus-gaap:ManagementServiceMember2024-04-012024-06-300001574197us-gaap:ManagementServiceMemberfph:GreatParkVentureMember2024-04-012024-06-300001574197us-gaap:ManagementServiceMemberfph:CommercialLeasingMember2024-04-012024-06-300001574197fph:ValenciaMemberus-gaap:ManagementServiceMember2024-01-012024-06-300001574197fph:SanFranciscoMemberus-gaap:ManagementServiceMember2024-01-012024-06-300001574197us-gaap:ManagementServiceMemberfph:GreatParkVentureMember2024-01-012024-06-300001574197us-gaap:ManagementServiceMemberfph:CommercialLeasingMember2024-01-012024-06-300001574197fph:ValenciaMemberfph:OperatingPropertiesMember2024-04-012024-06-300001574197fph:SanFranciscoMemberfph:OperatingPropertiesMember2024-04-012024-06-300001574197fph:OperatingPropertiesMemberfph:GreatParkVentureMember2024-04-012024-06-300001574197fph:OperatingPropertiesMemberfph:CommercialLeasingMember2024-04-012024-06-300001574197fph:ValenciaMemberfph:OperatingPropertiesMember2024-01-012024-06-300001574197fph:SanFranciscoMemberfph:OperatingPropertiesMember2024-01-012024-06-300001574197fph:OperatingPropertiesMemberfph:GreatParkVentureMember2024-01-012024-06-300001574197fph:OperatingPropertiesMemberfph:CommercialLeasingMember2024-01-012024-06-300001574197fph:ValenciaMember2024-04-012024-06-300001574197fph:SanFranciscoMember2024-04-012024-06-300001574197fph:GreatParkVentureMember2024-04-012024-06-300001574197fph:CommercialLeasingMember2024-04-012024-06-300001574197fph:ValenciaMember2024-01-012024-06-300001574197fph:SanFranciscoMember2024-01-012024-06-300001574197fph:GreatParkVentureMember2024-01-012024-06-300001574197fph:CommercialLeasingMember2024-01-012024-06-300001574197us-gaap:LandMemberfph:ValenciaMember2023-04-012023-06-300001574197us-gaap:LandMemberfph:SanFranciscoMember2023-04-012023-06-300001574197us-gaap:LandMemberfph:GreatParkVentureMember2023-04-012023-06-300001574197us-gaap:LandMemberfph:CommercialLeasingMember2023-04-012023-06-300001574197us-gaap:LandMemberfph:ValenciaMember2023-01-012023-06-300001574197us-gaap:LandMemberfph:SanFranciscoMember2023-01-012023-06-300001574197us-gaap:LandMemberfph:GreatParkVentureMember2023-01-012023-06-300001574197us-gaap:LandMemberfph:CommercialLeasingMember2023-01-012023-06-300001574197fph:ValenciaMemberus-gaap:ManagementServiceMember2023-04-012023-06-300001574197fph:SanFranciscoMemberus-gaap:ManagementServiceMember2023-04-012023-06-300001574197us-gaap:ManagementServiceMemberfph:GreatParkVentureMember2023-04-012023-06-300001574197us-gaap:ManagementServiceMemberfph:CommercialLeasingMember2023-04-012023-06-300001574197fph:ValenciaMemberus-gaap:ManagementServiceMember2023-01-012023-06-300001574197fph:SanFranciscoMemberus-gaap:ManagementServiceMember2023-01-012023-06-300001574197us-gaap:ManagementServiceMemberfph:GreatParkVentureMember2023-01-012023-06-300001574197us-gaap:ManagementServiceMemberfph:CommercialLeasingMember2023-01-012023-06-300001574197fph:ValenciaMemberfph:OperatingPropertiesMember2023-04-012023-06-300001574197fph:SanFranciscoMemberfph:OperatingPropertiesMember2023-04-012023-06-300001574197fph:OperatingPropertiesMemberfph:GreatParkVentureMember2023-04-012023-06-300001574197fph:OperatingPropertiesMemberfph:CommercialLeasingMember2023-04-012023-06-300001574197fph:ValenciaMemberfph:OperatingPropertiesMember2023-01-012023-06-300001574197fph:SanFranciscoMemberfph:OperatingPropertiesMember2023-01-012023-06-300001574197fph:OperatingPropertiesMemberfph:GreatParkVentureMember2023-01-012023-06-300001574197fph:OperatingPropertiesMemberfph:CommercialLeasingMember2023-01-012023-06-300001574197fph:ValenciaMember2023-04-012023-06-300001574197fph:SanFranciscoMember2023-04-012023-06-300001574197fph:GreatParkVentureMember2023-04-012023-06-300001574197fph:CommercialLeasingMember2023-04-012023-06-300001574197fph:ValenciaMember2023-01-012023-06-300001574197fph:SanFranciscoMember2023-01-012023-06-300001574197fph:GreatParkVentureMember2023-01-012023-06-300001574197fph:CommercialLeasingMember2023-01-012023-06-300001574197us-gaap:RelatedPartyMemberfph:GreatParkVentureMember2024-01-012024-06-300001574197us-gaap:RelatedPartyMember2022-12-310001574197us-gaap:RelatedPartyMember2023-06-300001574197us-gaap:RelatedPartyMemberfph:GreatParkVentureMember2023-01-012023-06-300001574197fph:GreatParkVentureMember2024-01-012024-06-300001574197us-gaap:RelatedPartyMemberus-gaap:LandMemberfph:GreatParkVentureMember2024-01-012024-06-300001574197us-gaap:LandMemberfph:GreatParkVentureMemberus-gaap:NonrelatedPartyMember2024-01-012024-06-300001574197us-gaap:RelatedPartyMemberus-gaap:LandMemberfph:GreatParkVentureMember2023-01-012023-06-300001574197us-gaap:LandMemberfph:GreatParkVentureMemberus-gaap:NonrelatedPartyMember2023-01-012023-06-300001574197fph:GreatParkVentureMemberus-gaap:NonrelatedPartyMemberfph:HomesitesSoldMember2023-01-012023-06-300001574197fph:GreatParkVentureMemberfph:LandSalesAffiliatedEntityAndThirdPartyMember2024-01-012024-06-300001574197fph:GreatParkVentureMemberfph:LandSalesAffiliatedEntityAndThirdPartyMember2023-01-012023-06-300001574197fph:LandSalesMemberfph:GreatParkVentureMember2024-01-012024-06-300001574197fph:LandSalesMemberfph:GreatParkVentureMember2023-01-012023-06-300001574197fph:GreatParkVentureMember2023-01-012023-06-300001574197fph:GreatParkVentureMember2024-06-300001574197fph:GreatParkVentureMember2023-12-310001574197fph:GreatParkVentureMember2023-12-310001574197fph:GatewayCommercialVentureLLCAMemberfph:FivePointOfficeVentureHoldingsILLCAcquisitionMember2024-06-300001574197fph:GatewayCommercialVentureLLCAMember2024-06-300001574197fph:GatewayCommercialVentureLLCAMemberfph:RentalRevenueMember2024-01-012024-06-300001574197fph:GatewayCommercialVentureLLCAMemberfph:RentalRevenueMember2023-01-012023-06-300001574197fph:GatewayCommercialVentureLLCAMember2024-01-012024-06-300001574197fph:GatewayCommercialVentureLLCAMember2023-01-012023-06-300001574197fph:GatewayCommercialVentureLLCAMember2024-01-012024-06-300001574197fph:GatewayCommercialVentureLLCAMember2023-01-012023-06-300001574197fph:GatewayCommercialVentureLLCAMember2023-12-310001574197fph:GatewayCommercialVentureLLCAMember2024-06-300001574197fph:GatewayCommercialVentureLLCAMember2023-12-310001574197fph:ValenciaLandbankVentureMember2024-06-300001574197fph:ValenciaLandbankVentureMember2023-12-310001574197us-gaap:RelatedPartyMemberus-gaap:CapitalUnitClassAMemberfph:FivePointOperatingCompanyLLCMember2024-06-300001574197us-gaap:RelatedPartyMemberus-gaap:CapitalUnitClassBMemberfph:FivePointOperatingCompanyLLCMember2024-06-300001574197fph:FivePointOperatingCompanyLLCMember2024-06-300001574197fph:ConversionofClassBCommonSharesIntoClassACommonSharesMember2024-01-012024-06-300001574197fph:ManagementPartnerMemberfph:FivePointOperatingCompanyLLCMember2024-04-012024-06-300001574197fph:ManagementPartnerMemberfph:FivePointOperatingCompanyLLCMember2023-04-012023-06-300001574197fph:ManagementPartnerMemberfph:FivePointOperatingCompanyLLCMember2024-01-012024-06-300001574197fph:ManagementPartnerMemberfph:FivePointOperatingCompanyLLCMember2023-01-012023-06-300001574197fph:OtherPartnersMemberfph:FivePointOperatingCompanyLLCMember2024-04-012024-06-300001574197fph:OtherPartnersMemberfph:FivePointOperatingCompanyLLCMember2023-04-012023-06-300001574197fph:OtherPartnersMemberfph:FivePointOperatingCompanyLLCMember2024-01-012024-06-300001574197fph:OtherPartnersMemberfph:FivePointOperatingCompanyLLCMember2023-01-012023-06-300001574197fph:FivePointOperatingCompanyLLCMember2024-04-012024-06-300001574197fph:FivePointOperatingCompanyLLCMember2023-04-012023-06-300001574197fph:FivePointOperatingCompanyLLCMember2024-01-012024-06-300001574197fph:FivePointOperatingCompanyLLCMember2023-01-012023-06-300001574197fph:TheSanFranciscoVentureMember2024-01-012024-06-300001574197fph:SanFranciscoVentureMember2019-01-012019-12-310001574197srt:MaximumMemberfph:SanFranciscoVentureMember2019-01-012019-12-310001574197fph:SanFranciscoVentureMember2024-01-012024-06-300001574197us-gaap:VariableInterestEntityPrimaryBeneficiaryMemberfph:SanFranciscoVentureMember2024-06-300001574197us-gaap:VariableInterestEntityPrimaryBeneficiaryMemberus-gaap:RelatedPartyMemberfph:SanFranciscoVentureMember2024-06-300001574197us-gaap:VariableInterestEntityPrimaryBeneficiaryMemberfph:SanFranciscoVentureMember2023-12-310001574197us-gaap:VariableInterestEntityPrimaryBeneficiaryMemberus-gaap:RelatedPartyMemberfph:SanFranciscoVentureMember2023-12-310001574197us-gaap:VariableInterestEntityPrimaryBeneficiaryMemberfph:FPLPAndFPLMember2024-06-300001574197us-gaap:VariableInterestEntityPrimaryBeneficiaryMemberus-gaap:RelatedPartyMemberfph:FPLPAndFPLMember2024-06-300001574197us-gaap:VariableInterestEntityPrimaryBeneficiaryMemberfph:FPLPAndFPLMember2023-12-310001574197us-gaap:VariableInterestEntityPrimaryBeneficiaryMemberus-gaap:RelatedPartyMemberfph:FPLPAndFPLMember2023-12-310001574197us-gaap:RelatedPartyMemberfph:ContractAssetsMember2024-06-300001574197us-gaap:RelatedPartyMemberfph:ContractAssetsMember2023-12-310001574197us-gaap:RelatedPartyMemberfph:OperatingLeaseMember2024-06-300001574197us-gaap:RelatedPartyMemberfph:OperatingLeaseMember2023-12-310001574197us-gaap:RelatedPartyMemberfph:OtherMember2024-06-300001574197us-gaap:RelatedPartyMemberfph:OtherMember2023-12-310001574197us-gaap:RelatedPartyMemberfph:ReimbursementObligationMember2024-06-300001574197us-gaap:RelatedPartyMemberfph:ReimbursementObligationMember2023-12-310001574197us-gaap:RelatedPartyMemberfph:PayableToHoldersOfManagementCompanysClassBInterestsMember2024-06-300001574197us-gaap:RelatedPartyMemberfph:PayableToHoldersOfManagementCompanysClassBInterestsMember2023-12-310001574197us-gaap:RelatedPartyMemberfph:AccruedAdvisoryFeesMember2024-06-300001574197us-gaap:RelatedPartyMemberfph:AccruedAdvisoryFeesMember2023-12-310001574197fph:GreatParkVentureMemberus-gaap:EquityMethodInvesteeMemberfph:ContractAssetsLegacyIncentiveCompensationReceivableMember2024-01-012024-06-300001574197us-gaap:EquityMethodInvesteeMemberfph:ContractAssetsLegacyIncentiveCompensationReceivableMember2024-01-012024-06-300001574197fph:ContractAssetsNonLegacyIncentiveCompensationReceivableMemberus-gaap:EquityMethodInvesteeMember2024-01-012024-06-300001574197us-gaap:EquityMethodInvesteeMember2024-06-300001574197us-gaap:RelatedPartyMemberfph:ContractAssetsLegacyIncentiveCompensationReceivableMember2024-06-300001574197us-gaap:RelatedPartyMemberfph:ContractAssetsLegacyIncentiveCompensationReceivableMember2023-12-310001574197us-gaap:RelatedPartyMemberus-gaap:ManagementServiceMemberfph:DevelopmentManagementAgreementMember2024-04-012024-06-300001574197us-gaap:RelatedPartyMemberus-gaap:ManagementServiceMemberfph:DevelopmentManagementAgreementMember2024-01-012024-06-300001574197us-gaap:RelatedPartyMemberus-gaap:ManagementServiceMemberfph:DevelopmentManagementAgreementMember2023-04-012023-06-300001574197us-gaap:RelatedPartyMemberus-gaap:ManagementServiceMemberfph:DevelopmentManagementAgreementMember2023-01-012023-06-300001574197us-gaap:SeniorNotesMemberfph:SeniorNotesDue202810.500Member2024-06-300001574197us-gaap:SeniorNotesMemberfph:SeniorNotesDue202810.500Member2023-12-310001574197us-gaap:SeniorNotesMemberfph:SeniorNotesDue20257.875Member2023-12-310001574197us-gaap:SeniorNotesMemberfph:SeniorNotesDue202810.500Member2024-01-160001574197us-gaap:SeniorNotesMemberfph:SeniorNotesDue20257.875Member2024-01-160001574197us-gaap:SeniorNotesMemberfph:SeniorNotesDue20257.875Member2024-01-162024-01-160001574197us-gaap:SeniorNotesMember2024-01-162024-01-160001574197us-gaap:SeniorNotesMemberfph:SeniorNotesDue202810.500Memberfph:January162024ToNovember142025Member2024-01-160001574197us-gaap:SeniorNotesMemberfph:SeniorNotesDue202810.500Memberfph:November152025ToNovember142026Member2024-01-160001574197us-gaap:SeniorNotesMemberfph:SeniorNotesDue202810.500Memberfph:November152026ToJanuary142028Member2024-01-160001574197us-gaap:RevolvingCreditFacilityMemberus-gaap:UnsecuredDebtMember2024-06-300001574197fph:RevolvingCreditFacilityDueInJuly2027Memberus-gaap:RevolvingCreditFacilityMemberus-gaap:UnsecuredDebtMember2024-06-300001574197fph:RevolvingCreditFacilityDueInApril2026Memberus-gaap:RevolvingCreditFacilityMemberus-gaap:UnsecuredDebtMember2024-06-300001574197us-gaap:RevolvingCreditFacilityMemberus-gaap:UnsecuredDebtMember2024-01-012024-06-300001574197fph:VariableRateComponentOneMemberus-gaap:RevolvingCreditFacilityMemberus-gaap:UnsecuredDebtMember2024-01-012024-06-300001574197fph:VariableRateComponentTwoMembersrt:MinimumMemberus-gaap:RevolvingCreditFacilityMemberus-gaap:UnsecuredDebtMember2024-01-012024-06-300001574197fph:VariableRateComponentTwoMembersrt:MaximumMemberus-gaap:RevolvingCreditFacilityMemberus-gaap:UnsecuredDebtMember2024-01-012024-06-300001574197us-gaap:SuretyBondMember2024-06-300001574197us-gaap:SuretyBondMember2023-12-310001574197fph:TheSanFranciscoVentureMember2023-12-310001574197fph:TheSanFranciscoVentureMember2024-06-300001574197us-gaap:AssetPledgedAsCollateralMember2023-12-310001574197us-gaap:AssetPledgedAsCollateralMember2024-06-300001574197fph:GatewayCommercialVentureLLCAMember2024-06-300001574197fph:ValenciaMemberus-gaap:OperatingSegmentsMember2024-04-012024-06-300001574197fph:ValenciaMemberus-gaap:OperatingSegmentsMember2023-04-012023-06-300001574197fph:ValenciaMemberus-gaap:OperatingSegmentsMember2024-01-012024-06-300001574197fph:ValenciaMemberus-gaap:OperatingSegmentsMember2023-01-012023-06-300001574197fph:SanFranciscoMemberus-gaap:OperatingSegmentsMember2024-04-012024-06-300001574197fph:SanFranciscoMemberus-gaap:OperatingSegmentsMember2023-04-012023-06-300001574197fph:SanFranciscoMemberus-gaap:OperatingSegmentsMember2024-01-012024-06-300001574197fph:SanFranciscoMemberus-gaap:OperatingSegmentsMember2023-01-012023-06-300001574197us-gaap:OperatingSegmentsMemberfph:GreatParkVentureMember2024-04-012024-06-300001574197us-gaap:OperatingSegmentsMemberfph:GreatParkVentureMember2023-04-012023-06-300001574197us-gaap:OperatingSegmentsMemberfph:GreatParkVentureMember2024-01-012024-06-300001574197us-gaap:OperatingSegmentsMemberfph:GreatParkVentureMember2023-01-012023-06-300001574197us-gaap:OperatingSegmentsMemberfph:GatewayCommercialVentureLLCAMember2024-04-012024-06-300001574197us-gaap:OperatingSegmentsMemberfph:GatewayCommercialVentureLLCAMember2023-04-012023-06-300001574197us-gaap:OperatingSegmentsMemberfph:GatewayCommercialVentureLLCAMember2024-01-012024-06-300001574197us-gaap:OperatingSegmentsMemberfph:GatewayCommercialVentureLLCAMember2023-01-012023-06-300001574197us-gaap:OperatingSegmentsMember2024-04-012024-06-300001574197us-gaap:OperatingSegmentsMember2023-04-012023-06-300001574197us-gaap:OperatingSegmentsMember2024-01-012024-06-300001574197us-gaap:OperatingSegmentsMember2023-01-012023-06-300001574197us-gaap:MaterialReconcilingItemsMemberfph:GreatParkVentureMember2024-04-012024-06-300001574197us-gaap:MaterialReconcilingItemsMemberfph:GreatParkVentureMember2023-04-012023-06-300001574197us-gaap:MaterialReconcilingItemsMemberfph:GreatParkVentureMember2024-01-012024-06-300001574197us-gaap:MaterialReconcilingItemsMemberfph:GreatParkVentureMember2023-01-012023-06-300001574197us-gaap:MaterialReconcilingItemsMemberfph:GatewayCommercialVentureLLCAMember2024-04-012024-06-300001574197us-gaap:MaterialReconcilingItemsMemberfph:GatewayCommercialVentureLLCAMember2023-04-012023-06-300001574197us-gaap:MaterialReconcilingItemsMemberfph:GatewayCommercialVentureLLCAMember2024-01-012024-06-300001574197us-gaap:MaterialReconcilingItemsMemberfph:GatewayCommercialVentureLLCAMember2023-01-012023-06-300001574197fph:GatewayCommercialVentureLLCAMember2024-04-012024-06-300001574197fph:GatewayCommercialVentureLLCAMember2023-04-012023-06-300001574197fph:GatewayCommercialVentureLLCAMember2024-01-012024-06-300001574197fph:GatewayCommercialVentureLLCAMember2023-01-012023-06-300001574197us-gaap:CorporateNonSegmentMember2024-04-012024-06-300001574197us-gaap:CorporateNonSegmentMember2023-04-012023-06-300001574197us-gaap:CorporateNonSegmentMember2024-01-012024-06-300001574197us-gaap:CorporateNonSegmentMember2023-01-012023-06-300001574197fph:ValenciaMemberus-gaap:OperatingSegmentsMember2024-06-300001574197fph:ValenciaMemberus-gaap:OperatingSegmentsMember2023-12-310001574197fph:SanFranciscoMemberus-gaap:OperatingSegmentsMember2024-06-300001574197fph:SanFranciscoMemberus-gaap:OperatingSegmentsMember2023-12-310001574197us-gaap:OperatingSegmentsMemberfph:GreatParkVentureMember2024-06-300001574197us-gaap:OperatingSegmentsMemberfph:GreatParkVentureMember2023-12-310001574197us-gaap:OperatingSegmentsMemberfph:GatewayCommercialVentureLLCAMember2024-06-300001574197us-gaap:OperatingSegmentsMemberfph:GatewayCommercialVentureLLCAMember2023-12-310001574197us-gaap:OperatingSegmentsMember2024-06-300001574197us-gaap:OperatingSegmentsMember2023-12-310001574197fph:ConsolidationEliminationsGreatParkMember2024-06-300001574197fph:ConsolidationEliminationsGreatParkMember2023-12-310001574197fph:ConsolidationEliminationsGatewayMember2024-06-300001574197fph:ConsolidationEliminationsGatewayMember2023-12-310001574197us-gaap:IntersegmentEliminationMember2024-06-300001574197us-gaap:IntersegmentEliminationMember2023-12-310001574197us-gaap:MaterialReconcilingItemsMemberfph:GreatParkVentureMember2024-06-300001574197us-gaap:MaterialReconcilingItemsMemberfph:GreatParkVentureMember2023-12-310001574197us-gaap:MaterialReconcilingItemsMemberfph:GatewayCommercialVentureLLCAMember2024-06-300001574197us-gaap:MaterialReconcilingItemsMemberfph:GatewayCommercialVentureLLCAMember2023-12-310001574197us-gaap:CorporateNonSegmentMember2024-06-300001574197us-gaap:CorporateNonSegmentMember2023-12-310001574197us-gaap:RestrictedStockMember2023-12-310001574197us-gaap:RestrictedStockMember2024-01-012024-06-300001574197us-gaap:RestrictedStockMember2024-06-300001574197us-gaap:RestrictedStockMember2023-01-012023-06-300001574197us-gaap:FairValueInputsLevel2Memberus-gaap:EstimateOfFairValueFairValueDisclosureMember2024-06-300001574197us-gaap:CarryingReportedAmountFairValueDisclosureMember2024-06-300001574197us-gaap:FairValueInputsLevel2Memberus-gaap:EstimateOfFairValueFairValueDisclosureMember2023-12-310001574197us-gaap:CarryingReportedAmountFairValueDisclosureMember2023-12-310001574197us-gaap:RestrictedStockUnitsRSUMember2024-04-012024-06-300001574197us-gaap:RestrictedStockUnitsRSUMember2023-04-012023-06-300001574197us-gaap:RestrictedStockUnitsRSUMember2024-01-012024-06-300001574197us-gaap:RestrictedStockUnitsRSUMember2023-01-012023-06-300001574197fph:PerformanceRestrictedStockUnitsRSUsMember2024-04-012024-06-300001574197fph:PerformanceRestrictedStockUnitsRSUsMember2023-04-012023-06-300001574197fph:PerformanceRestrictedStockUnitsRSUsMember2024-01-012024-06-300001574197fph:PerformanceRestrictedStockUnitsRSUsMember2023-01-012023-06-300001574197us-gaap:RestrictedStockMember2024-04-012024-06-300001574197us-gaap:RestrictedStockMember2023-04-012023-06-300001574197us-gaap:RestrictedStockMember2024-01-012024-06-300001574197us-gaap:RestrictedStockMember2023-01-012023-06-300001574197us-gaap:CommonClassAMember2024-04-012024-06-300001574197us-gaap:CommonClassAMember2023-04-012023-06-300001574197us-gaap:CommonClassAMember2024-01-012024-06-300001574197us-gaap:CommonClassAMember2023-01-012023-06-300001574197us-gaap:AociAttributableToNoncontrollingInterestMember2024-06-300001574197us-gaap:AociAttributableToNoncontrollingInterestMember2023-12-310001574197us-gaap:AccumulatedDefinedBenefitPlansAdjustmentNetUnamortizedGainLossMember2024-01-012024-06-300001574197us-gaap:AccumulatedDefinedBenefitPlansAdjustmentNetUnamortizedGainLossMember2023-01-012023-06-30
UNITED STATES
SECURITIES AND EXCHANGE COMMISSION
Washington, D.C. 20549
Form 10-Q
(Mark One)
☒ QUARTERLY REPORT PURSUANT TO SECTION 13 OR 15(d) OF THE SECURITIES EXCHANGE ACT OF 1934
For the quarterly period ended June 30, 2024
OR
☐ TRANSITION REPORT PURSUANT TO SECTION 13 OR 15(d) OF THE SECURITIES EXCHANGE ACT OF 1934
For the transition period from to
Commission File Number 001-38088
Five Point Holdings, LLC
(Exact name of registrant as specified in its charter) | | | | | | | | | | | | | | | | | |
| Delaware | | 27-0599397 |
| (State or other jurisdiction of incorporation or organization) | | (I.R.S. Employer Identification No.) |
2000 FivePoint | 4th Floor | Irvine | California | | 92618 |
(Address of Principal Executive Offices) | | (Zip code) |
(949) 349-1000
(Registrant’s telephone number, including area code)
Not Applicable
(Former name, former address, and former fiscal year, if changed since last report)
Securities registered pursuant to Section 12(b) of the Act: | | | | | | | | |
| Title of each class | Trading Symbol(s) | Name of each exchange on which registered |
| Class A common shares | FPH | New York Stock Exchange |
Indicate by check mark whether the registrant: (1) has filed all reports required to be filed by Section 13 or 15(d) of the Securities Exchange Act of 1934 during the preceding 12 months (or for such shorter period that the registrant was required to file such reports), and (2) has been subject to such filing requirements for the past 90 days. Yes ☒ No ☐
Indicate by check mark whether the registrant has submitted electronically every Interactive Data File required to be submitted pursuant to Rule 405 of Regulation S-T (§232.405 of this chapter) during the preceding 12 months (or for such shorter period that the registrant was required to submit such files). Yes ☒ No ☐
Indicate by check mark whether the registrant is a large accelerated filer, an accelerated filer, a non-accelerated filer, a smaller reporting company, or an emerging growth company. See the definitions of “large accelerated filer,” “accelerated filer,” “smaller reporting company,” and “emerging growth company” in Rule 12b-2 of the Exchange Act. | | | | | | | | | | | | | | |
Large accelerated filer | ☐ | | Accelerated filer | ☐ |
Non-accelerated filer | ☒ | | Smaller reporting company | ☒ |
| | | Emerging growth company | ☐ |
If an emerging growth company, indicate by check mark if the registrant has elected not to use the extended transition period for complying with any new or revised financial accounting standards provided pursuant to Section 13(a) of the Exchange Act. ☐
Indicate by check mark whether the registrant is a shell company (as defined in Rule 12b-2 of the Exchange Act). Yes ☐ No ☒
As of July 12, 2024, 69,358,504 Class A common shares and 79,233,544 Class B common shares were outstanding.
FIVE POINT HOLDINGS, LLC
TABLE OF CONTENTS
FORM 10-Q
| | | | | | | | |
| | Page |
| PART I. FINANCIAL INFORMATION | |
ITEM 1. | | |
| | |
| | |
| | |
| | |
| | |
| | |
ITEM 2. | | |
ITEM 3. | | |
ITEM 4. | | |
| | |
| PART II. OTHER INFORMATION | |
ITEM 1. | | |
ITEM 1A. | | |
ITEM 2. | | |
ITEM 3. | | |
ITEM 4. | | |
ITEM 5. | | |
ITEM 6. | | |
| | |
CAUTIONARY STATEMENT REGARDING FORWARD-LOOKING STATEMENTS
This report contains forward-looking statements that are subject to risks and uncertainties. These statements concern expectations, beliefs, projections, plans and strategies, anticipated events or trends and similar expressions concerning matters that are not historical facts. When used, the words “anticipate,” “believe,” “expect,” “intend,” “may,” “might,” “plan,” “estimate,” “project,” “should,” “will,” “would,” “result” and similar expressions that do not relate solely to historical matters are intended to identify forward-looking statements. This report may contain forward-looking statements regarding: our expectations of our future revenues, costs and financial performance; the impact of inflation and interest rates; future demographics and market conditions, including housing supply levels, in the areas where our communities are located; the outcome of pending litigation and its effect on our operations; the timing of our development activities; and the timing of future real estate purchases or sales, including anticipated deliveries of homesites and anticipated amenities in our communities.
We caution you that any forward-looking statements presented in this report are based on our current views and information currently available to us. Forward-looking statements are subject to risks, trends, uncertainties and factors that are beyond our control. We believe these risks and uncertainties include, but are not limited to, the following:
•risks associated with the real estate industry;
•downturns in economic conditions or demographic changes at the national, regional or local levels, particularly in the areas where our properties are located;
•uncertainty and risks related to zoning and land use laws and regulations, including environmental planning and protection laws;
•risks associated with development and construction projects;
•adverse developments in the economic, political, competitive or regulatory climate of California;
•loss of key personnel;
•uncertainties and risks related to adverse weather conditions, natural disasters and climate change;
•fluctuations in interest rates;
•the availability of cash for distribution and debt service and exposure to risk of default under debt obligations;
•exposure to liability relating to environmental and health and safety matters;
•uncertainties and risks related to public health issues such as a major epidemic or pandemic;
•exposure to litigation or other claims;
•insufficient amounts of insurance or exposure to events that are either uninsured or underinsured;
•intense competition in the real estate market and our ability to sell properties at desirable prices;
•fluctuations in real estate values;
•changes in property taxes;
•risks associated with our trademarks, trade names and service marks;
•conflicts of interest with our directors;
•general volatility of the capital and credit markets and the price of our Class A common shares; and
•risks associated with public or private financing or the unavailability thereof.
Please see Part I, Item 1A, “Risk Factors” in our Annual Report on Form 10-K for the year ended December 31, 2023, as well as other risks and uncertainties detailed from time to time in our subsequent Quarterly Reports on Form 10-Q and other filings with the Securities and Exchange Commission, for a more detailed discussion of these and other risks.
Should one or more of these risks or uncertainties materialize, or should underlying assumptions prove incorrect, actual results may vary materially from those anticipated, estimated or projected. We caution you therefore against relying on any of these forward-looking statements.
While forward-looking statements reflect our good faith beliefs, they are not guarantees of future performance. They are based on estimates and assumptions only as of the date of this report. We undertake no obligation to update or revise any forward-looking statement to reflect changes in underlying assumptions or factors, new information, data or methods, future events or other changes, except as required by applicable law.
PART I. FINANCIAL INFORMATION
ITEM 1. Financial Statements
FIVE POINT HOLDINGS, LLC
CONDENSED CONSOLIDATED BALANCE SHEETS
(In thousands, except shares)
(Unaudited)
| | | | | | | | | | | |
| June 30, 2024 | | December 31, 2023 |
ASSETS | | | |
INVENTORIES | $ | 2,292,264 | | | $ | 2,213,479 | |
INVESTMENT IN UNCONSOLIDATED ENTITIES | 237,777 | | | 252,816 | |
PROPERTIES AND EQUIPMENT, NET | 29,359 | | | 29,145 | |
| | | |
INTANGIBLE ASSET, NET—RELATED PARTY | 13,728 | | | 25,270 | |
CASH AND CASH EQUIVALENTS | 217,387 | | | 353,801 | |
RESTRICTED CASH AND CERTIFICATES OF DEPOSIT | 992 | | | 992 | |
RELATED PARTY ASSETS | 120,551 | | | 83,970 | |
OTHER ASSETS | 8,081 | | | 9,815 | |
TOTAL | $ | 2,920,139 | | | $ | 2,969,288 | |
| | | |
LIABILITIES AND CAPITAL | | | |
LIABILITIES: | | | |
Notes payable, net | $ | 524,104 | | | $ | 622,186 | |
Accounts payable and other liabilities | 83,267 | | | 81,649 | |
| | | |
Related party liabilities | 74,173 | | | 78,074 | |
Deferred income tax liability, net | 12,917 | | | 7,067 | |
Payable pursuant to tax receivable agreement | 173,351 | | | 173,208 | |
Total liabilities | 867,812 | | | 962,184 | |
| | | |
| COMMITMENTS AND CONTINGENT LIABILITIES (Note 11) | | | |
REDEEMABLE NONCONTROLLING INTEREST | 25,000 | | | 25,000 | |
CAPITAL: | | | |
Class A common shares; No par value; Issued and outstanding: June 30, 2024—69,358,504 shares; December 31, 2023—69,199,938 shares | | | |
Class B common shares; No par value; Issued and outstanding: June 30, 2024—79,233,544 shares; December 31, 2023—79,233,544 shares | | | |
Contributed capital | 593,211 | | | 591,606 | |
Retained earnings | 105,828 | | | 88,780 | |
Accumulated other comprehensive loss | (2,321) | | | (2,332) | |
Total members’ capital | 696,718 | | | 678,054 | |
Noncontrolling interests | 1,330,609 | | | 1,304,050 | |
Total capital | 2,027,327 | | | 1,982,104 | |
TOTAL | $ | 2,920,139 | | | $ | 2,969,288 | |
See accompanying notes to unaudited condensed consolidated financial statements.
FIVE POINT HOLDINGS, LLC
CONDENSED CONSOLIDATED STATEMENTS OF OPERATIONS
(In thousands, except share and per share amounts)
(Unaudited)
| | | | | | | | | | | | | | | | | | | | | | | |
| Three Months Ended June 30, | | Six Months Ended June 30, |
| 2024 | | 2023 | | 2024 | | 2023 |
REVENUES: | | | | | | | |
Land sales | $ | 307 | | | $ | 16 | | | $ | 842 | | | $ | (9) | |
Land sales—related party | 3 | | | (29) | | | — | | | 595 | |
Management services—related party | 50,279 | | | 20,774 | | | 59,005 | | | 25,010 | |
Operating properties | 603 | | | 588 | | | 1,280 | | | 1,454 | |
Total revenues | 51,192 | | | 21,349 | | | 61,127 | | | 27,050 | |
COSTS AND EXPENSES: | | | | | | | |
Land sales | — | | | — | | | — | | | — | |
Management services | 11,315 | | | 9,682 | | | 15,211 | | | 12,048 | |
Operating properties | 1,878 | | | 1,798 | | | 2,868 | | | 2,970 | |
Selling, general, and administrative | 12,186 | | | 12,710 | | | 25,102 | | | 26,462 | |
| | | | | | | |
| | | | | | | |
Total costs and expenses | 25,379 | | | 24,190 | | | 43,181 | | | 41,480 | |
| OTHER INCOME (EXPENSE): | | | | | | | |
| | | | | | | |
Interest income | 2,755 | | | 1,293 | | | 5,980 | | | 2,129 | |
| | | | | | | |
Miscellaneous | 26 | | | (20) | | | (5,881) | | | (41) | |
| Total other income | 2,781 | | | 1,273 | | | 99 | | | 2,088 | |
| EQUITY IN EARNINGS FROM UNCONSOLIDATED ENTITIES | 15,498 | | | 52,128 | | | 33,084 | | | 53,176 | |
| INCOME BEFORE INCOME TAX PROVISION | 44,092 | | | 50,560 | | | 51,129 | | | 40,834 | |
| INCOME TAX PROVISION | (5,865) | | | (5) | | | (6,819) | | | (13) | |
| NET INCOME | 38,227 | | | 50,555 | | | 44,310 | | | 40,821 | |
| LESS NET INCOME ATTRIBUTABLE TO NONCONTROLLING INTERESTS | 23,505 | | | 26,984 | | | 27,262 | | | 21,786 | |
| NET INCOME ATTRIBUTABLE TO THE COMPANY | $ | 14,722 | | | $ | 23,571 | | | $ | 17,048 | | | $ | 19,035 | |
| | | | | | | |
| NET INCOME ATTRIBUTABLE TO THE COMPANY PER CLASS A SHARE | | | | | | | |
| Basic | $ | 0.21 | | | $ | 0.34 | | | $ | 0.25 | | | $ | 0.28 | |
Diluted | $ | 0.21 | | | $ | 0.34 | | | $ | 0.24 | | | $ | 0.27 | |
WEIGHTED AVERAGE CLASS A SHARES OUTSTANDING | | | | | | | |
| Basic | 69,239,296 | | | 68,811,975 | | | 69,148,940 | | | 68,758,894 | |
Diluted | 145,936,206 | | | 145,040,689 | | | 145,906,521 | | | 144,939,450 | |
| NET INCOME ATTRIBUTABLE TO THE COMPANY PER CLASS B SHARE | | | | | | | |
Basic and diluted | $ | 0.00 | | | $ | 0.00 | | | $ | 0.00 | | | $ | 0.00 | |
WEIGHTED AVERAGE CLASS B SHARES OUTSTANDING | | | | | | | |
| Basic and diluted | 79,233,544 | | | 79,233,544 | | | 79,233,544 | | | 79,233,544 | |
| | | | | | | |
See accompanying notes to unaudited condensed consolidated financial statements.
FIVE POINT HOLDINGS, LLC
CONDENSED CONSOLIDATED STATEMENTS OF COMPREHENSIVE INCOME
(In thousands)
(Unaudited)
| | | | | | | | | | | | | | | | | | | | | | | |
| Three Months Ended June 30, | | Six Months Ended June 30, |
| 2024 | | 2023 | | 2024 | | 2023 |
| NET INCOME | $ | 38,227 | | | $ | 50,555 | | | $ | 44,310 | | | $ | 40,821 | |
OTHER COMPREHENSIVE INCOME: | | | | | | | |
| Reclassification of actuarial loss on defined benefit pension plan included in net income | 13 | | | 40 | | | 27 | | | 81 | |
Other comprehensive income before taxes | 13 | | | 40 | | | 27 | | | 81 | |
INCOME TAX PROVISION RELATED TO OTHER COMPREHENSIVE INCOME | (2) | | | — | | | (4) | | | — | |
OTHER COMPREHENSIVE INCOME—Net of tax | 11 | | | 40 | | | 23 | | | 81 | |
| COMPREHENSIVE INCOME | 38,238 | | | 50,595 | | | 44,333 | | | 40,902 | |
| LESS COMPREHENSIVE INCOME ATTRIBUTABLE TO NONCONTROLLING INTERESTS | 23,510 | | | 26,999 | | | 27,272 | | | 21,816 | |
| COMPREHENSIVE INCOME ATTRIBUTABLE TO THE COMPANY | $ | 14,728 | | | $ | 23,596 | | | $ | 17,061 | | | $ | 19,086 | |
See accompanying notes to unaudited condensed consolidated financial statements.
FIVE POINT HOLDINGS, LLC
CONDENSED CONSOLIDATED STATEMENTS OF CAPITAL
(In thousands, except share amounts)
(Unaudited) | | | | | | | | | | | | | | | | | | | | | | | | | | | | | | | | | | | | | | | | | | | | | | | |
| Class A Common Shares | | Class B Common Shares | | Contributed Capital | | Retained Earnings | | Accumulated Other Comprehensive Loss | | Total Members’ Capital | | Noncontrolling Interests | | Total Capital |
| BALANCE - March 31, 2024 | 69,358,504 | | | 79,233,544 | | | $ | 592,227 | | | $ | 91,106 | | | $ | (2,327) | | | $ | 681,006 | | | $ | 1,307,099 | | | $ | 1,988,105 | |
| Net income | — | | | — | | | — | | | 14,722 | | | — | | | 14,722 | | | 23,505 | | | 38,227 | |
Share-based compensation expense | — | | | — | | | 984 | | | — | | | — | | | 984 | | | — | | | 984 | |
| | | | | | | | | | | | | | | |
| | | | | | | | | | | | | | | |
| | | | | | | | | | | | | | | |
Other comprehensive income—net of tax of $2 | — | | | — | | | — | | | — | | | 6 | | | 6 | | | 5 | | | 11 | |
| | | | | | | | | | | | | | | |
| | | | | | | | | | | | | | | |
| | | | | | | | | | | | | | | |
| BALANCE - June 30, 2024 | 69,358,504 | | | 79,233,544 | | | $ | 593,211 | | | $ | 105,828 | | | $ | (2,321) | | | $ | 696,718 | | | $ | 1,330,609 | | | $ | 2,027,327 | |
| | | | | | | | | | | | | | | |
| BALANCE - March 31, 2023 | 69,199,938 | | | 79,233,544 | | | $ | 588,704 | | | $ | 28,850 | | | $ | (2,964) | | | $ | 614,590 | | | $ | 1,242,211 | | | $ | 1,856,801 | |
| Net income | — | | | — | | | — | | | 23,571 | | | — | | | 23,571 | | | 26,984 | | | 50,555 | |
Share-based compensation expense | — | | | — | | | 930 | | | — | | | — | | | 930 | | | — | | | 930 | |
| | | | | | | | | | | | | | | |
| | | | | | | | | | | | | | | |
Other comprehensive income—net of tax of $0 | — | | | — | | | — | | | — | | | 25 | | | 25 | | | 15 | | | 40 | |
| | | | | | | | | | | | | | | |
| | | | | | | | | | | | | | | |
| | | | | | | | | | | | | | | |
| BALANCE - June 30, 2023 | 69,199,938 | | | 79,233,544 | | | $ | 589,634 | | | $ | 52,421 | | | $ | (2,939) | | | $ | 639,116 | | | $ | 1,269,210 | | | $ | 1,908,326 | |
See accompanying notes to unaudited condensed consolidated financial statements.
FIVE POINT HOLDINGS, LLC
CONDENSED CONSOLIDATED STATEMENTS OF CAPITAL
(In thousands, except share amounts)
(Unaudited) | | | | | | | | | | | | | | | | | | | | | | | | | | | | | | | | | | | | | | | | | | | | | | | |
| Class A
Common
Shares | | Class B
Common
Shares | | Contributed
Capital | | Retained
Earnings | | Accumulated
Other
Comprehensive
Loss | | Total
Members’
Capital | | Noncontrolling
Interests | | Total
Capital |
| BALANCE - December 31, 2023 | 69,199,938 | | | 79,233,544 | | | $ | 591,606 | | | $ | 88,780 | | | $ | (2,332) | | | $ | 678,054 | | | $ | 1,304,050 | | | $ | 1,982,104 | |
| | | | | | | | | | | | | | | |
| Net income | — | | | — | | | — | | | 17,048 | | | — | | | 17,048 | | | 27,262 | | | 44,310 | |
Share-based compensation expense | — | | | — | | | 1,816 | | | — | | | — | | | 1,816 | | | — | | | 1,816 | |
Reacquisition of share-based compensation awards for tax-withholding purposes | (282,883) | | | — | | | (823) | | | — | | | — | | | (823) | | | — | | | (823) | |
| Issuance of share-based compensation awards | 158,940 | | | — | | | — | | | — | | | — | | | — | | | — | | | — | |
Settlement of restricted share units for Class A common shares | 282,509 | | | — | | | — | | | — | | | — | | | — | | | — | | | — | |
Other comprehensive income—net of tax of $4 | — | | | — | | | — | | | — | | | 13 | | | 13 | | | 10 | | | 23 | |
| | | | | | | | | | | | | | | |
| | | | | | | | | | | | | | | |
Adjustment to liability recognized under tax receivable agreement—net of tax of $40 | — | | | — | | | (103) | | | — | | | — | | | (103) | | | — | | | (103) | |
Adjustment of noncontrolling interest in the Operating Company | — | | | — | | | 715 | | | — | | | (2) | | | 713 | | | (713) | | | — | |
| BALANCE - June 30, 2024 | 69,358,504 | | | 79,233,544 | | | $ | 593,211 | | | $ | 105,828 | | | $ | (2,321) | | | $ | 696,718 | | | $ | 1,330,609 | | | $ | 2,027,327 | |
| | | | | | | | | | | | | | | |
| BALANCE - December 31, 2022 | 69,068,354 | | | 79,233,544 | | | $ | 587,733 | | | $ | 33,386 | | | $ | (2,988) | | | $ | 618,131 | | | $ | 1,249,916 | | | $ | 1,868,047 | |
| | | | | | | | | | | | | | | |
| Net income | — | | | — | | | — | | | 19,035 | | | — | | | 19,035 | | | 21,786 | | | 40,821 | |
Share-based compensation expense | — | | | — | | | 1,693 | | | — | | | — | | | 1,693 | | | — | | | 1,693 | |
Reacquisition of share-based compensation awards for tax-withholding purposes | (83,660) | | | — | | | (202) | | | — | | | — | | | (202) | | | — | | | (202) | |
| | | | | | | | | | | | | | | |
| Issuance of share-based compensation awards, net of forfeitures | 215,244 | | | — | | | — | | | — | | | — | | | — | | | — | | | — | |
Other comprehensive income—net of tax of $0 | — | | | — | | | — | | | — | | | 51 | | | 51 | | | 30 | | | 81 | |
| Tax distributions to noncontrolling interests | — | | | — | | | — | | | — | | | — | | | — | | | (1,974) | | | (1,974) | |
| | | | | | | | | | | | | | | |
Adjustment to liability recognized under tax receivable agreement—net of tax of $0 | — | | | — | | | (140) | | | — | | | — | | | (140) | | | — | | | (140) | |
Adjustment of noncontrolling interest in the Operating Company | — | | | — | | | 550 | | | — | | | (2) | | | 548 | | | (548) | | | — | |
| BALANCE - June 30, 2023 | 69,199,938 | | | 79,233,544 | | | $ | 589,634 | | | $ | 52,421 | | | $ | (2,939) | | | $ | 639,116 | | | $ | 1,269,210 | | | $ | 1,908,326 | |
See accompanying notes to unaudited condensed consolidated financial statements.
FIVE POINT HOLDINGS, LLC
CONDENSED CONSOLIDATED STATEMENTS OF CASH FLOWS
(In thousands)
(Unaudited) | | | | | | | | | | | |
| Six Months Ended June 30, |
| 2024 | | 2023 |
| CASH FLOWS FROM OPERATING ACTIVITIES: | | | |
| Net income | $ | 44,310 | | | $ | 40,821 | |
| Adjustments to reconcile net income to net cash (used in) provided by operating activities: | | | |
| Equity in earnings from unconsolidated entities | (33,084) | | | (53,176) | |
| Return on investment from Great Park Venture | 33,130 | | | 52,736 | |
| Deferred income taxes | 5,886 | | | — | |
| Depreciation and amortization | 13,102 | | | 11,204 | |
| | | |
| | | |
| | | |
| | | |
| Share-based compensation | 1,816 | | | 1,693 | |
| Changes in operating assets and liabilities: | | | |
| Inventories | (76,673) | | | (14,867) | |
| Related party assets | (37,813) | | | 6,013 | |
| Other assets | 1,809 | | | 2,430 | |
| Accounts payable and other liabilities | 1,759 | | | (3,520) | |
| Related party liabilities | (3,901) | | | (5,409) | |
| Net cash (used in) provided by operating activities | (49,659) | | | 37,925 | |
| CASH FLOWS FROM INVESTING ACTIVITIES: | | | |
| Return of investment from Great Park Venture | 14,176 | | | 29,028 | |
| Return of investment from Valencia Landbank Venture | 800 | | | 648 | |
| | | |
| | | |
| | | |
| | | |
| Purchase of properties and equipment | (454) | | | — | |
| Net cash provided by investing activities | 14,522 | | | 29,676 | |
| CASH FLOWS FROM FINANCING ACTIVITIES: | | | |
| | | |
| Payment of financing costs | (454) | | | — | |
| | | |
| | | |
| Related party reimbursement obligation | — | | | (3,993) | |
| | | |
| | | |
| Reacquisition of share-based compensation awards for tax-withholding purposes | (823) | | | (202) | |
| Repayments of notes payable | (100,000) | | | — | |
| Tax distributions to noncontrolling interests | — | | | (1,974) | |
| | | |
| Net cash used in financing activities | (101,277) | | | (6,169) | |
| NET (DECREASE) INCREASE IN CASH, CASH EQUIVALENTS, AND RESTRICTED CASH | (136,414) | | | 61,432 | |
| CASH, CASH EQUIVALENTS, AND RESTRICTED CASH—Beginning of period | 354,793 | | | 132,763 | |
| CASH, CASH EQUIVALENTS, AND RESTRICTED CASH—End of period | $ | 218,379 | | | $ | 194,195 | |
SUPPLEMENTAL CASH FLOW INFORMATION (Note 12)
See accompanying notes to unaudited condensed consolidated financial statements.
FIVE POINT HOLDINGS, LLC
NOTES TO CONDENSED CONSOLIDATED FINANCIAL STATEMENTS
(Unaudited)
1. BUSINESS AND ORGANIZATION
Five Point Holdings, LLC, a Delaware limited liability company (the “Holding Company” and, together with its consolidated subsidiaries, the “Company”), is an owner and developer of mixed-use planned communities in California. The Holding Company owns all of its assets and conducts all of its operations through Five Point Operating Company, LP, a Delaware limited partnership (the “Operating Company”), and its subsidiaries.
The Company has two classes of shares outstanding: Class A common shares and Class B common shares. Holders of Class A common shares and holders of Class B common shares are entitled to one vote for each share held of record on all matters submitted to a vote of shareholders, and are both entitled to receive distributions at the same time. However, the distributions paid to holders of Class B common shares are in an amount per share equal to 0.0003 multiplied by the amount paid per Class A common share.
The Company presents noncontrolling interests on the Company’s condensed consolidated balance sheet and classifies such interests within capital but separate from the Company’s Class A and Class B members’ capital. Noncontrolling interests represent equity interests in the Company’s consolidated subsidiaries held by partners in the Operating Company, excluding the Holding Company, and members in The Shipyard Communities, LLC (the “San Francisco Venture”), excluding the Operating Company (see Note 5).
The Company has an entity structure in which the Company’s two largest equity owners, Lennar Corporation (“Lennar”) and Castlelake, LP (“Castlelake”), and the Company’s founder and Chairman Emeritus, Emile Haddad, separately hold, in addition to interests in the Company’s common shares, equity interests in either or both the Operating Company or the San Francisco Venture that can be exchanged for, at the Company’s option, either the Company’s Class A common shares or cash. The diagram below presents a simplified depiction of the Company’s organizational structure as of June 30, 2024:
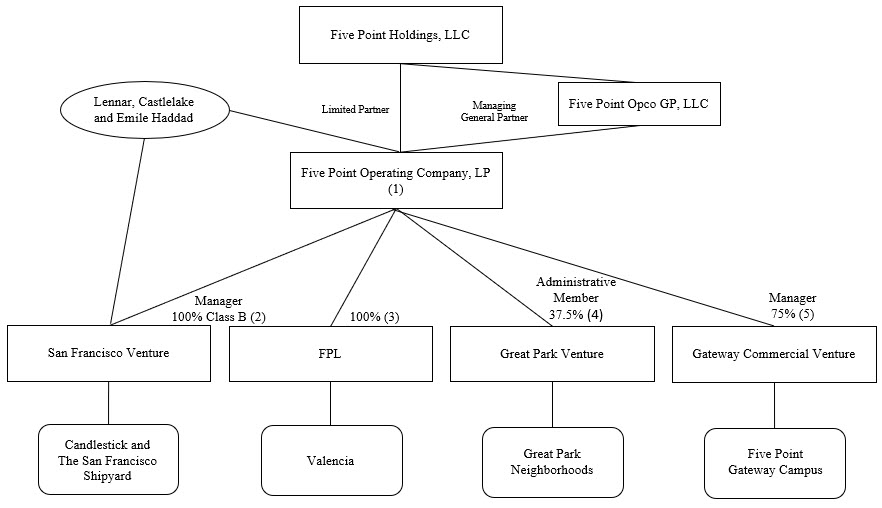
(1) A wholly owned subsidiary of the Holding Company serves as the sole managing general partner of the Operating Company. As of June 30, 2024, the Company owned approximately 62.6% of the outstanding Class A Common Units of the Operating Company. After a one year holding period, a holder of Class A Common Units of the Operating Company can exchange the units for, at the Company’s option, either Class A common shares of the Holding Company, on a one-for-one basis, or cash equal to the fair market value of such shares. Until Class A Common Units of the Operating Company are exchanged or redeemed, the capital associated with Class A Common Units of the Operating Company not held by the Holding Company is presented within “noncontrolling interests” on the Company’s condensed consolidated balance sheet. Assuming the exchange of all outstanding Class A Common Units of the Operating Company and all outstanding Class A units of the San Francisco Venture (see (2)
below), that are not held by the Company, based on the closing price of the Company’s Class A common shares on July 12, 2024 ($2.99), the equity market capitalization of the Company was approximately $444.4 million.
(2) The Operating Company owns all of the outstanding Class B units of the San Francisco Venture, the entity developing the Candlestick and The San Francisco Shipyard communities. The Class A units of the San Francisco Venture, which the Operating Company does not own, are intended to be economically equivalent to Class A Common Units of the Operating Company. As the holder of all outstanding Class B units of the San Francisco Venture, the Operating Company is entitled to receive 99% of available cash from the San Francisco Venture after the holders of Class A units in the San Francisco Venture have received distributions equivalent to the distributions, if any, paid on Class A Common Units of the Operating Company. Class A units of the San Francisco Venture can be exchanged, on a one-for-one basis, for Class A Common Units of the Operating Company (See Note 5). Until exchanged or redeemed through the Operating Company, the capital associated with Class A units of the San Francisco Venture is presented within “noncontrolling interests” on the Company’s condensed consolidated balance sheet.
(3) Together, the Operating Company, Five Point Communities, LP, a Delaware limited partnership (“FP LP”), and Five Point Communities Management, Inc., a Delaware corporation (“FP Inc.” and together with FP LP, the “Management Company”) own 100% of Five Point Land, LLC, a Delaware limited liability company (“FPL”), the entity developing Valencia, a mixed-use planned community located in northern Los Angeles County, California. The Operating Company has a controlling interest in the Management Company.
(4) Interests in Heritage Fields LLC, a Delaware limited liability company (the “Great Park Venture”), are either “Percentage Interests” or “Legacy Interests.” Holders of the Legacy Interests were entitled to receive priority distributions up to an aggregate amount of $565.0 million, of which $561.7 million had been distributed as of July 12, 2024 (See Note 4). The Company owns a 37.5% Percentage Interest in the Great Park Venture and serves as its administrative member. However, management of the Great Park Venture is vested in the four voting members, who have a total of five votes. Major decisions generally require the approval of at least 75% of the votes of the voting members. The Company has two votes, and the other three voting members each have one vote, so the Company is unable to approve any major decision without the consent or approval of at least two of the other voting members. The Company does not include the Great Park Venture as a consolidated subsidiary, but rather as an equity method investee, in its condensed consolidated financial statements.
(5) The Company owns a 75% interest in Five Point Office Venture Holdings I, LLC, a Delaware limited liability company (the “Gateway Commercial Venture”). The Company manages the Gateway Commercial Venture, however, the manager’s authority is limited. Major decisions by the Gateway Commercial Venture generally require unanimous approval by an executive committee composed of two people designated by the Company and two people designated by another investor. Some decisions require approval by all of the members of the Gateway Commercial Venture. The Company does not include the Gateway Commercial Venture as a consolidated subsidiary, but rather as an equity method investee, in its condensed consolidated financial statements.
2. BASIS OF PRESENTATION
Principles of consolidation—The accompanying condensed consolidated financial statements include the accounts of the Holding Company and the accounts of all subsidiaries in which the Holding Company has a controlling interest and the consolidated accounts of variable interest entities (“VIEs”) in which the Holding Company is deemed to be the primary beneficiary. All intercompany transactions and balances have been eliminated in consolidation.
Unaudited interim financial information—The accompanying condensed consolidated financial statements are unaudited and have been prepared in accordance with U.S. generally accepted accounting principles (“U.S. GAAP”) for interim financial information, the instructions to Form 10-Q and Article 10 of Regulation S-X. Accordingly, they do not include all of the information and notes required by U.S. GAAP for complete financial statements. These condensed consolidated financial statements should be read in conjunction with the Company’s Annual Report on Form 10-K for the year ended December 31, 2023. In the opinion of management, all adjustments (including normal recurring adjustments) considered necessary for a fair presentation have been included. Operating results and cash flows for the three and six months ended June 30, 2024 are not necessarily indicative of the operating results and cash flows that may be expected for the full year.
Use of estimates—The preparation of financial statements in conformity with U.S. GAAP requires management to make estimates and assumptions that affect the reported amounts of assets and liabilities, disclosure of contingent assets and liabilities at the date of the financial statements, and the reported amounts of revenues and expenses during the reporting periods. Management evaluates its estimates on an ongoing basis and makes revisions to these estimates and related disclosures as experience develops or new information becomes known. Actual results could differ from those estimates.
Miscellaneous other income (expense)—Miscellaneous other income (expense) consisted of the following (in thousands): | | | | | | | | | | | | | | | | | | | | | | | |
| Three Months Ended June 30, | | Six Months Ended June 30, |
| 2024 | | 2023 | | 2024 | | 2023 |
| Net periodic pension benefit (cost) | $ | 23 | | | $ | (20) | | | $ | 47 | | | $ | (41) | |
Other(1) | 3 | | | — | | | (5,928) | | | — | |
| | | | | | | |
| Total miscellaneous other income (expense) | $ | 26 | | | $ | (20) | | | $ | (5,881) | | | $ | (41) | |
(1) In January 2024, the Company settled an exchange offer on its $625.0 million 7.875% Senior Notes (see Note 9). For the six months ended June 30, 2024, the Company incurred $5.9 million in third party costs related to the debt modification, which is included in other in the table above.
Recently issued accounting pronouncements—In November 2023, the Financial Accounting Standards Board (“FASB”) issued Accounting Standards Update (“ASU”) 2023-07, Segment Reporting (Topic 280): Improvements to Reportable Segment Disclosures, which primarily requires expanded disclosure of significant segment expenses and other segment items on an annual and interim basis. The standard is effective for fiscal years beginning after December 15, 2023, and interim periods within fiscal years beginning after December 15, 2024, with early adoption permitted. The standard will be applied retrospectively to all prior periods presented in the financial statements. The Company is currently evaluating the effect of this update on the Company’s financial statement disclosures.
In December 2023, the FASB issued ASU 2023-09, Income Taxes (Topic 740): Improvements to Income Tax Disclosures, which primarily requires expanded disclosures for income taxes paid and the effective tax rate reconciliation. The standard is effective for fiscal years beginning after December 15, 2024, with early adoption permitted and can be applied on either a prospective or retrospective basis. The Company is currently evaluating the effect of this update on the Company’s financial statement disclosures.
3. REVENUES
The following tables present the Company’s consolidated revenues disaggregated by revenue source and reporting segment (in thousands): | | | | | | | | | | | | | | | | | | | | | | | | | | | | | | | | | | | | | | | | | | | | | | | | | | | | | | | | | | | |
| Three Months Ended June 30, 2024 | | Six Months Ended June 30, 2024 |
| Valencia | | San Francisco | | Great Park(1) | | Commercial(1) | | Total | | Valencia | | San Francisco | | Great Park(1) | | Commercial(1) | | Total |
Land sales and land sales—related party | $ | 310 | | | $ | — | | | $ | — | | | $ | — | | | $ | 310 | | | $ | 842 | | | $ | — | | | $ | — | | | $ | — | | | $ | 842 | |
Management services—related party | — | | | — | | | 50,151 | | | 128 | | | 50,279 | | | — | | | — | | | 58,764 | | | 241 | | | 59,005 | |
| Operating properties | 168 | | | — | | | — | | | — | | | 168 | | | 243 | | | — | | | — | | | — | | | 243 | |
| 478 | | | — | | | 50,151 | | | 128 | | | 50,757 | | | 1,085 | | | — | | | 58,764 | | | 241 | | | 60,090 | |
| Operating properties leasing revenues | 267 | | | 168 | | | — | | | — | | | 435 | | | 701 | | | 336 | | | — | | | — | | | 1,037 | |
| $ | 745 | | | $ | 168 | | | $ | 50,151 | | | $ | 128 | | | $ | 51,192 | | | $ | 1,786 | | | $ | 336 | | | $ | 58,764 | | | $ | 241 | | | $ | 61,127 | |
| | | | | | | | | | | | | | | | | | | | | | | | | | | | | | | | | | | | | | | | | | | | | | | | | | | | | | | | | | | |
| Three Months Ended June 30, 2023 | | Six Months Ended June 30, 2023 |
| Valencia | | San Francisco | | Great Park(1) | | Commercial(1) | | Total | | Valencia | | San Francisco | | Great Park(1) | | Commercial(1) | | Total |
Land sales and land sales—related party | $ | (13) | | | $ | — | | | $ | — | | | $ | — | | | $ | (13) | | | $ | 586 | | | $ | — | | | $ | — | | | $ | — | | | $ | 586 | |
Management services—related party | — | | | — | | | 20,670 | | | 104 | | | 20,774 | | | — | | | — | | | 24,799 | | | 211 | | | 25,010 | |
| Operating properties | 141 | | | — | | | — | | | — | | | 141 | | | 499 | | | — | | | — | | | — | | | 499 | |
| 128 | | | — | | | 20,670 | | | 104 | | | 20,902 | | | 1,085 | | | — | | | 24,799 | | | 211 | | | 26,095 | |
| Operating properties leasing revenues | 285 | | | 162 | | | — | | | — | | | 447 | | | 631 | | | 324 | | | — | | | — | | | 955 | |
| $ | 413 | | | $ | 162 | | | $ | 20,670 | | | $ | 104 | | | $ | 21,349 | | | $ | 1,716 | | | $ | 324 | | | $ | 24,799 | | | $ | 211 | | | $ | 27,050 | |
| | | | | | | | | | | | | | | | | | | |
(1) The tables above do not include revenues of the Great Park Venture and the Gateway Commercial Venture, which are included in the Company’s reporting segment totals (see Notes 4 and 13).
The opening and closing balances of the Company’s contract assets for the six months ended June 30, 2024 were $72.1 million ($69.1 million related party, see Note 8) and $108.8 million ($106.9 million related party, see Note 8), respectively. The net increase of $36.7 million for the six months ended June 30, 2024 between the opening and closing balances of the Company’s contract assets primarily resulted from additional incentive compensation revenue recognized during the period that resulted from changes in the estimated constrained transaction price of the Company’s amended and restated development management agreement (“A&R DMA”) with the Great Park Venture (see Note 8) partially offset by the receipt of marketing fees from homebuilders from prior period land sales and the receipt of $14.3 million in incentive compensation payments from the Great Park Venture.
The opening and closing balances of the Company’s contract assets for the six months ended June 30, 2023 were $86.5 million ($79.9 million related party, see Note 8) and $78.6 million ($73.8 million related party, see Note 8), respectively. The decrease of $7.9 million for the six months ended June 30, 2023 between the opening and closing balances of the Company’s contract assets primarily resulted from the receipt of marketing fees from homebuilders from prior period land sales and the receipt of $24.6 million in incentive compensation payments from the Great Park Venture partially offset by additional incentive compensation revenue earned during the period from the Company’s A&R DMA with the Great Park Venture (see Note 8).
The opening and closing balances of the Company’s other receivables from contracts with customers and contract liabilities for the six months ended June 30, 2024 and 2023 were insignificant.
4. INVESTMENT IN UNCONSOLIDATED ENTITIES
Great Park Venture
The Great Park Venture has two classes of membership interests—“Percentage Interests” and “Legacy Interests.” The Operating Company owned 37.5% of the Great Park Venture’s Percentage Interests as of June 30, 2024. During the six months ended June 30, 2024, the Great Park Venture made aggregate distributions of $14.8 million to holders of Legacy Interests and $126.2 million to holders of Percentage Interests. The Company received $47.3 million for its 37.5% Percentage Interest. As of June 30, 2024, Legacy Interest holders were entitled to receive a maximum of $3.3 million in distributions to be paid pro-rata with Percentage Interest holders. Approximately 10% of future distributions will be paid to the Legacy Interest holders until such time as the remaining balance has been fully paid. The holders of the Percentage Interests will receive all other distributions.
The Great Park Venture is the owner of Great Park Neighborhoods, a mixed-use planned community located in Orange County, California. The Company, through the A&R DMA, as amended, manages the planning, development and sale of land at the Great Park Neighborhoods and supervises the day-to-day affairs of the Great Park Venture. The Great Park Venture is governed by an executive committee of representatives appointed by only the holders of Percentage Interests. The Company serves as the administrative member but does not control the actions of the executive committee. The Company accounts for its investment in the Great Park Venture using the equity method of accounting.
The carrying value of the Company’s investment in the Great Park Venture is higher than the Company’s underlying share of equity in the carrying value of net assets of the Great Park Venture, resulting in a basis difference. The Company’s earnings or losses from the equity method investment are adjusted by amortization and accretion of the basis differences as the assets (mainly inventory) and liabilities that gave rise to the basis difference are sold, settled or amortized.
During the six months ended June 30, 2024, the Great Park Venture recognized $16.6 million in land sale revenues to related parties of the Company and $215.5 million in land sale revenues to third parties.
During the six months ended June 30, 2023, the Great Park Venture recognized $7.4 million in land sale revenues to related parties of the Company and $361.8 million in land sale revenues to third parties, of which $357.8 million relates to homesites sold to an unaffiliated land banking entity whereby a related party of the Company retained the option to acquire these homesites in the future from the land bank entity.
The following table summarizes the statements of operations of the Great Park Venture for the six months ended June 30, 2024 and 2023 (in thousands): | | | | | | | | | | | |
| Six Months Ended June 30, |
| 2024 | | 2023 |
| Land sale and related party land sale revenues | $ | 232,081 | | | $ | 369,196 | |
| | | |
Cost of land sales | (58,974) | | | (165,749) | |
| | | |
Other costs and expenses | (75,046) | | | (32,547) | |
| Net income of Great Park Venture | $ | 98,061 | | | $ | 170,900 | |
| The Company’s share of net income | $ | 36,773 | | | $ | 64,088 | |
| Basis difference amortization, net | (3,643) | | | (10,604) | |
| | | |
| Equity in earnings from Great Park Venture | $ | 33,130 | | | $ | 53,484 | |
The following table summarizes the balance sheet data of the Great Park Venture and the Company’s investment balance as of June 30, 2024 and December 31, 2023 (in thousands):
| | | | | | | | | | | |
| June 30, 2024 | | December 31, 2023 |
Inventories | $ | 304,477 | | | $ | 391,352 | |
Cash and cash equivalents | 145,363 | | | 61,054 | |
| Contract assets, receivables and other assets, net | 195,575 | | | 166,793 | |
Total assets | $ | 645,415 | | | $ | 619,199 | |
Accounts payable and other liabilities | $ | 253,935 | | | $ | 184,847 | |
| | | |
Redeemable Legacy Interests | 3,293 | | | 18,075 | |
Capital (Percentage Interest) | 388,187 | | | 416,277 | |
Total liabilities and capital | $ | 645,415 | | | $ | 619,199 | |
The Company’s share of capital in Great Park Venture | $ | 145,572 | | | $ | 156,105 | |
Unamortized basis difference | 54,038 | | | 57,681 | |
The Company’s investment in the Great Park Venture | $ | 199,610 | | | $ | 213,786 | |
Gateway Commercial Venture
The Company owned a 75% interest in the Gateway Commercial Venture as of June 30, 2024. The Gateway Commercial Venture is governed by an executive committee in which the Company is entitled to appoint two individuals. One of the other members of the Gateway Commercial Venture is also entitled to appoint two individuals to the executive committee. The unanimous approval of the executive committee is required for certain matters, which limits the Company’s ability to control the Gateway Commercial Venture, however, the Company is able to exercise significant influence and therefore accounts for its investment in the Gateway Commercial Venture using the equity method. The Company is the manager of the Gateway Commercial Venture, with responsibility to manage and administer its day-to-day affairs and implement a business plan approved by the executive committee.
The Gateway Commercial Venture owns one commercial office building and approximately 50 acres of commercial land with additional development rights at a 73 acre office, medical, research and development campus located within the Great Park Neighborhoods (the “Five Point Gateway Campus”). The Five Point Gateway Campus consists of four buildings totaling approximately one million square feet. The Company and a subsidiary of Lennar lease portions of the building owned by the Gateway Commercial Venture, and during the six months ended June 30, 2024 and 2023, the Gateway Commercial Venture recognized $4.8 million and $4.2 million, respectively, in rental revenues from those leasing arrangements.
The following table summarizes the statements of operations of the Gateway Commercial Venture for the six months ended June 30, 2024 and 2023 (in thousands): | | | | | | | | | | | |
| Six Months Ended June 30, |
| 2024 | | 2023 |
| Rental revenues | $ | 4,773 | | | $ | 4,175 | |
| Rental operating and other expenses | (1,787) | | | (1,967) | |
| Depreciation and amortization | (2,008) | | | (1,989) | |
| | | |
| Interest expense | (1,384) | | | (1,108) | |
| Net loss of Gateway Commercial Venture | $ | (406) | | | $ | (889) | |
| Equity in loss from Gateway Commercial Venture | $ | (305) | | | $ | (667) | |
The following table summarizes the balance sheet data of the Gateway Commercial Venture and the Company’s investment balance as of June 30, 2024 and December 31, 2023 (in thousands): | | | | | | | | | | | |
| June 30, 2024 | | December 31, 2023 |
| Real estate and related intangible assets, net | $ | 74,711 | | | $ | 76,719 | |
| Cash and restricted cash | 6,706 | | | 5,574 | |
| Other assets | 3,583 | | | 3,554 | |
| Total assets | $ | 85,000 | | | $ | 85,847 | |
| Notes payable, net | $ | 28,745 | | | $ | 28,850 | |
| Other liabilities | 6,286 | | | 6,623 | |
| Members’ capital | 49,969 | | | 50,374 | |
| Total liabilities and capital | $ | 85,000 | | | $ | 85,847 | |
| The Company’s investment in the Gateway Commercial Venture | $ | 37,476 | | | $ | 37,781 | |
In August 2023, the Gateway Commercial Venture refinanced its mortgage note, extending the maturity date to August 2025. As a condition of the refinancing, the Company is subject to certain guaranties of the Gateway Commercial Venture’s mortgage note, including an interest and carry guaranty along with a springing guaranty of 50% of the outstanding balance in the event the Gateway Commercial Venture’s leases with either the Company or the affiliate of Lennar are no longer in effect and the Gateway Commercial Venture is unable to meet certain financial covenants.
Valencia Landbank Venture
As of June 30, 2024, the Company owned a 10% interest in the Valencia Landbank Venture, an entity organized in December 2020 for the purpose of taking assignment from homebuilders of purchase and sale agreements for the purchase of residential lots within the Valencia community. The Valencia Landbank Venture concurrently enters into option and development agreements with homebuilders pursuant to which the homebuilders retain the option to purchase the land to construct and sell homes. The Company does not have a controlling financial interest in the Valencia Landbank Venture, however, the Company has the ability to significantly influence the Valencia Landbank Venture’s operating and financial policies, and most major decisions require the Company’s approval in addition to the approval of the Valencia Landbank Venture’s other unaffiliated member, and therefore the Company accounts for its investment in the Valencia Landbank Venture using the equity method. At June 30, 2024 and December 31, 2023, the Company’s investment in the Valencia Landbank Venture was $0.7 million and $1.2 million, respectively, and the Company recognized $0.3 million and $0.4 million in equity in earnings for the six months ended June 30, 2024 and 2023, respectively.
5. NONCONTROLLING INTERESTS
The Operating Company
The Holding Company’s wholly owned subsidiary is the managing general partner of the Operating Company, and at June 30, 2024, the Holding Company and its wholly owned subsidiary owned approximately 62.6% of the outstanding Class A Common Units and 100% of the outstanding Class B Common Units of the Operating Company. The Holding Company consolidates the financial results of the Operating Company and its subsidiaries and records a noncontrolling interest for the remaining 37.4% of the outstanding Class A Common Units of the Operating Company that are owned separately by affiliates of Lennar, affiliates of Castlelake and an entity controlled by Emile Haddad, the Company’s Chairman Emeritus of the Board of Directors (the “Management Partner”).
After a 12 month holding period, holders of Class A Common Units of the Operating Company may exchange their units for, at the Company’s option, either (i) Class A common shares on a one-for-one basis (subject to adjustment in the event of share splits, distributions of shares, warrants or share rights, specified extraordinary distributions and similar events), or (ii) cash in an amount equal to the market value of such shares at the time of exchange. In either situation, an equal number of that holder’s Class B common shares will automatically convert into Class A common shares, at a ratio of 0.0003 Class A common shares for each Class B common share. This exchange right is currently exercisable by all holders of outstanding Class A Common Units of the Operating Company.
With each exchange of Class A Common Units of the Operating Company for Class A common shares, the Holding Company’s percentage ownership interest in the Operating Company and its share of the Operating Company’s cash distributions and profits and losses will increase. Additionally, other issuances of common shares of the Holding Company or common units of the Operating Company result in changes to the noncontrolling interest percentage. Such equity transactions result in an adjustment between members’ capital and the noncontrolling interest in the Company’s condensed consolidated balance sheet and statement of capital to account for the changes in the noncontrolling interest ownership percentage as well as any change in total net assets of the Company.
During the six months ended June 30, 2024 and 2023, the Holding Company’s ownership interest in the Operating Company changed as a result of net equity transactions related to the Company’s share-based compensation plan.
The terms of the Operating Company’s Limited Partnership Agreement (“LPA”) provide for the payment of tax distributions to the Operating Company’s partners in an amount equal to the estimated income tax liabilities resulting from taxable income or gain allocated to those parties. The tax distribution provisions in the LPA were included in the Operating Company’s governing documents adopted prior to the Company’s initial public offering and were designed to provide funds necessary to pay tax liabilities for income that might be allocated, but not paid, to the partners.
Tax distributions to the partners of the Operating Company for the three and six months ended June 30, 2024 and 2023, were as follows (in thousands): | | | | | | | | | | | | | | | | | | | | | | | |
| Three Months Ended June 30, | | Six Months Ended June 30, |
| 2024 | | 2023 | | 2024 | | 2023 |
| Management Partner | $ | — | | | $ | — | | | $ | — | | | $ | 1,974 | |
| Other partners (excluding the Holding Company) | — | | | — | | | — | | | — | |
| Total tax distributions | $ | — | | | $ | — | | | $ | — | | | $ | 1,974 | |
Generally, tax distributions are treated as advance distributions under the LPA and are taken into account when determining the amounts otherwise distributable under the LPA.
The San Francisco Venture
The San Francisco Venture has three classes of units—Class A, Class B and Class C units. The Operating Company owns all of the outstanding Class B units of the San Francisco Venture. All of the outstanding Class A units are owned by Lennar and Castlelake. The Class A units of the San Francisco Venture are intended to be substantially economically equivalent to the Class A Common Units of the Operating Company. The Class A units of the San Francisco Venture represent noncontrolling interests to the Operating Company.
Holders of Class A units of the San Francisco Venture can redeem their units at any time and receive Class A Common Units of the Operating Company on a one-for-one basis (subject to adjustment in the event of share splits, distributions of shares, warrants or share rights, specified extraordinary distributions and similar events). If a holder requests a redemption of Class A units of the San Francisco Venture that would result in the Holding Company’s ownership of the Operating Company falling below 50.1%, the Holding Company has the option of satisfying the redemption with Class A common shares instead. The Company also has the option, at any time, to acquire outstanding Class A units of the San Francisco Venture in exchange for Class A Common Units of the Operating Company. The 12 month holding period for any Class A Common Units of the Operating Company issued in exchange for Class A units of the San Francisco Venture is calculated by including the period that such Class A units of the San Francisco Venture were owned. This exchange right is currently exercisable by all holders of outstanding Class A units of the San Francisco Venture.
Redeemable Noncontrolling Interest
In 2019, the San Francisco Venture issued 25.0 million Class C units to an affiliate of Lennar in exchange for a contribution of $25.0 million to the San Francisco Venture. Provided that Lennar completes the construction of a certain number of new homes in Candlestick as contemplated under purchase and sale agreements with the Company, the San Francisco Venture is required to redeem the Class C units if and when the Company receives reimbursements from the Mello-Roos community facilities district formed for the development, in an aggregate amount equal to 50% of any reimbursements received up to a maximum amount of $25.0 million. The San Francisco Venture also maintains the ability to redeem the then outstanding balance of Class C units for cash at any time. Upon a liquidation of the San Francisco Venture, the holders of Class C Units are entitled to a liquidation preference. The maximum amount payable by the San Francisco Venture pursuant to redemptions or liquidation of the Class C units is $25.0 million. The holders of Class C units are not entitled to receive any other forms of distributions and are not entitled to any voting rights. In connection with the issuance of the Class C units, the San Francisco Venture agreed to spend $25.0 million on the development of infrastructure and/or parking facilities at the Company’s Candlestick development. At each of June 30, 2024 and December 31, 2023, $25.0 million of Class C units were outstanding and included in redeemable noncontrolling interest on the condensed consolidated balance sheets.
6. CONSOLIDATED VARIABLE INTEREST ENTITY
The Holding Company conducts all of its operations through the Operating Company, a consolidated VIE, and as a result, substantially all of the Company’s assets and liabilities represent the assets and liabilities of the Operating Company, other than items attributed to income taxes and the payable pursuant to a tax receivable agreement (“TRA”). The Operating Company has investments in and consolidates the assets and liabilities of the San Francisco Venture, FP LP and FPL, all of which have also been determined to be VIEs.
The San Francisco Venture is a VIE as the other members of the venture, individually or as a group, are not able to exercise kick-out rights or substantive participating rights. The Company applied the variable interest model and determined that it is the primary beneficiary of the San Francisco Venture and, accordingly, the San Francisco Venture is consolidated in the Company’s results. In making that determination, the Company evaluated that the Operating Company has unilateral and unconditional power to make decisions in regards to the activities that significantly impact the economics of the VIE, which are the development of properties, marketing and sale of properties, acquisition of land and other real estate properties and obtaining land ownership or ground lease for the underlying properties to be developed. The Company is determined to have more-than-insignificant economic benefit from the San Francisco Venture because, excluding Class C units, the Operating Company can prevent or cause the San Francisco Venture from making distributions on its units, and the Operating Company would receive 99% of any such distributions made (assuming no distributions had been paid on the Class A Common Units of the Operating Company). In addition, the San Francisco Venture is only allowed to make a capital call on the Operating Company and not any other interest holders, which could be a significant financial risk to the Operating Company.
As of June 30, 2024, the San Francisco Venture had total combined assets of $1.39 billion, primarily comprised of $1.39 billion of inventories and $0.9 million in related party assets, and total combined liabilities of $65.7 million, including $60.7 million in related party liabilities.
As of December 31, 2023, the San Francisco Venture had total combined assets of $1.36 billion, primarily comprised of $1.36 billion of inventories and $0.9 million in related party assets, and total combined liabilities of $61.9 million, including $59.4 million in related party liabilities.
Those assets are owned by, and those liabilities are obligations of, the San Francisco Venture, not the Company. The San Francisco Venture’s operating subsidiaries are not guarantors of the Company’s obligations, and the assets held by the San Francisco Venture may only be used as collateral for the San Francisco Venture’s obligations. The creditors of the San Francisco Venture do not have recourse to the assets of the Operating Company, as the VIE’s primary beneficiary, or of the Holding Company.
The Company and the other members do not generally have an obligation to make capital contributions to the San Francisco Venture. In addition, there are no liquidity arrangements or agreements to fund capital or purchase assets that could require the Company to provide financial support to the San Francisco Venture. The Company does not guarantee any debt of the San Francisco Venture. However, the Operating Company has guaranteed the performance of payment by the San Francisco Venture in accordance with the redemption terms of the Class C units of the San Francisco Venture (see Note 5).
FP LP and FPL are VIEs because the other partners or members have disproportionately fewer voting rights, and substantially all of the activities of the entities are conducted on behalf of the other partners or members and their related parties. The Operating Company, or a wholly owned subsidiary of the Operating Company, is the primary beneficiary of FP LP and FPL.
As of June 30, 2024, FP LP and FPL had combined assets of $1.1 billion, primarily comprised of $904.8 million of inventories, $13.7 million of intangibles and $106.9 million in related party assets, and total combined liabilities of $63.0 million, including $61.8 million in accounts payable and other liabilities and $1.2 million in related party liabilities.
As of December 31, 2023, FP LP and FPL had combined assets of $1.0 billion, primarily comprised of $855.6 million of inventories, $25.3 million of intangibles and $69.1 million in related party assets, and total combined liabilities of $60.0 million, including $57.3 million in accounts payable and other liabilities and $2.7 million in related party liabilities.
The Company evaluates its primary beneficiary designation on an ongoing basis and assesses the appropriateness of the VIE’s status when events have occurred that would trigger such an analysis. During the six months ended June 30, 2024 and 2023, there were no VIEs that were deconsolidated.
7. INTANGIBLE ASSET, NET—RELATED PARTY
The intangible asset relates to the contract value of the incentive compensation provisions of the A&R DMA with the Great Park Venture. The intangible asset will be amortized over the expected contract period based on the pattern in which the economic benefits are expected to be received.
The carrying amount and accumulated amortization of the intangible asset as of June 30, 2024 and December 31, 2023 were as follows (in thousands): | | | | | | | | | | | |
| June 30, 2024 | | December 31, 2023 |
| Gross carrying amount | $ | 129,705 | | | $ | 129,705 | |
| Accumulated amortization | (115,977) | | | (104,435) | |
| Net book value | $ | 13,728 | | | $ | 25,270 | |
Intangible asset amortization expense, as a result of revenue recognition attributable to incentive compensation, was $9.5 million and $11.5 million for the three and six months ended June 30, 2024, respectively, and $8.0 million and $8.6 million for the three and six months ended June 30, 2023, respectively. Amortization expense is included in the cost of management services in the accompanying condensed consolidated statements of operations and is included in the Great Park segment.
8. RELATED PARTY TRANSACTIONS
Related party assets and liabilities included in the Company’s condensed consolidated balance sheets as of June 30, 2024 and December 31, 2023 consisted of the following (in thousands): | | | | | | | | | | | |
| June 30, 2024 | | December 31, 2023 |
Related Party Assets: | | | |
Contract assets (see Note 3) | $ | 106,881 | | | $ | 69,068 | |
| Operating lease right-of-use asset (corporate office lease at Five Point Gateway Campus) | 12,808 | | | 14,040 | |
Other | 862 | | | 862 | |
| $ | 120,551 | | | $ | 83,970 | |
Related Party Liabilities: | | | |
Reimbursement obligation | $ | 60,717 | | | $ | 59,378 | |
| | | |
Payable to holders of Management Company’s Class B interests | 333 | | | 1,828 | |
| Operating lease liability (corporate office lease at Five Point Gateway Campus) | 10,129 | | | 10,974 | |
| Accrued advisory fees | 1,825 | | | 4,725 | |
Other | 1,169 | | | 1,169 | |
| $ | 74,173 | | | $ | 78,074 | |
Development Management Agreement with the Great Park Venture (Incentive Compensation Contract Asset)
In 2010, the Great Park Venture, the Company’s equity method investee, engaged the Management Company under a development management agreement to provide management services to the Great Park Venture. The compensation structure in place consists of a base fee and incentive compensation. Incentive compensation is 9% of distributions available to be made by the Great Park Venture to its Legacy and Percentage Interest Holders. In December 2022, the Company and the Great Park Venture entered into an amendment to the A&R DMA to extend the term to December 31, 2024 (the “First Renewal Term”). If the A&R DMA is not extended by mutual agreement of the parties beyond December 31, 2024 and the Company is no longer providing management services subsequent to December 31, 2024, the Company will be entitled to 6.75% of distributions paid thereafter.
During the six months ended June 30, 2024, the Great Park Venture made a Legacy Incentive Compensation payment to the Company of $1.5 million and a Non-Legacy Incentive Compensation payment of $12.8 million. Upon receiving the Legacy Incentive Compensation payment, the Company distributed the $1.5 million in proceeds to the holders of the Management Company’s Class B interests.
At June 30, 2024 and December 31, 2023, included in contract assets in the table above is $104.6 million and $66.1 million, respectively, attributed to incentive compensation revenue recognized but not yet due (see Note 3). Management fee revenues under the A&R DMA are included in management services—related party in the accompanying condensed consolidated statements of operations and are included in the Great Park segment. Management fee revenues under the A&R DMA were $50.2 million and $58.8 million for the three and six months ended June 30, 2024, respectively, and $20.7 million and $24.8 million for the three and six months ended June 30, 2023, respectively.
9. NOTES PAYABLE, NET
At June 30, 2024 and December 31, 2023, notes payable, net consisted of the following (in thousands): | | | | | | | | | | | |
| June 30, 2024 | | December 31, 2023 |
10.500% initial rate New Senior Notes due 2028 | $ | 523,494 | | | $ | — | |
7.875% Senior Notes due 2025 | 1,500 | | | 625,000 | |
| Unamortized premium | 1,206 | | | — | |
| Unamortized debt issuance costs | (2,096) | | | (2,814) | |
| $ | 524,104 | | | $ | 622,186 | |
Senior Notes
The Operating Company and Five Point Capital Corp., a directly wholly owned subsidiary of the Operating Company (the “Co-Issuer” and, together with the Operating Company, the “Issuers”), previously offered, sold and issued $625.0 million aggregate principal amount of 7.875% unsecured senior notes due November 15, 2025 (the “Senior Notes”).
The Senior Notes are guaranteed, jointly and severally, by certain direct and indirect subsidiaries of the Operating Company and are redeemable at the option of the Issuers, in whole or in part, at par, plus accrued and unpaid interest.
On January 16, 2024, the Issuers settled an exchange offer to exchange any and all of the Senior Notes for new 10.500% initial rate senior notes due January 15, 2028 (the “New Senior Notes”). Pursuant to the exchange offer, the Issuers exchanged $623.5 million aggregate principal amount of Senior Notes, which represented 99.76% of the existing Senior Notes outstanding immediately prior to the exchange offer, for $523.5 million aggregate principal amount of New Senior Notes and $100.0 million of aggregate cash consideration, plus accrued interest. The New Senior Notes accrue interest at a rate of 10.500% per annum from and including January 16, 2024 to, but not including, November 15, 2025, 11.000% per annum from and including November 15, 2025 to, but not including, November 15, 2026, and 12.000% per annum from and including November 15, 2026 to, but not including, January 15, 2028. Interest on the New Senior Notes is payable semi-annually on each May 15 and November 15, commencing May 15, 2024. The exchange was accounted for as a debt modification under ASC 470-50 as the terms of the New Senior Notes were not substantially different from the terms of the Senior Notes. Under debt modification accounting, third party costs are expensed as incurred. During the six months ended June 30, 2024, the Company expensed $5.9 million in third party transaction and advisory costs incurred in connection with the exchange. Debt issuance costs and premium are amortized over the term of the New Senior Notes using the effective interest method. The New Senior Notes are guaranteed, jointly and severally, by certain direct and indirect subsidiaries of the Operating Company and are redeemable at the option of the Issuers, in whole or in part, at a declining call premium as set forth in the indenture governing the New Senior Notes, plus accrued and unpaid interest.
Revolving Credit Facility
The Operating Company has a $125.0 million unsecured revolving credit facility, with $100.0 million of the commitments under the revolving credit facility maturing in July 2027 and the remaining $25.0 million commitment maturing in April 2026. Any borrowings under the revolving credit agreement will bear interest at CME Term Secured Overnight Financing Rate 1 Month increased by 0.10% plus a margin of either 2.25% or 2.50% based on the Company’s leverage ratio. The revolving credit facility includes an accordion feature that allows the Operating Company to increase the maximum aggregate commitments up to $150.0 million, subject to certain conditions, including the receipt of commitments from the lenders. As of June 30, 2024, no borrowings or letters of credit were outstanding on the Operating Company’s revolving credit facility.
10. TAX RECEIVABLE AGREEMENT
The Company is a party to a TRA with all of the holders of Class A Common Units of the Operating Company, all the holders of Class A units of the San Francisco Venture, and prior holders of Class A Common Units of the Operating Company and prior holders of Class A units of the San Francisco Venture that have exchanged their holdings for Class A common shares (as parties to the TRA, the “TRA Parties”). At June 30, 2024 and December 31, 2023, the Company’s condensed consolidated balance sheets included liabilities of $173.4 million and $173.2 million, respectively, for payments expected to be made under certain components of the TRA which the Company deems to be probable and estimable. No TRA payments were made during the six months ended June 30, 2024 or 2023.
11. COMMITMENTS AND CONTINGENCIES
The Company is subject to the usual obligations associated with entering into contracts for the purchase, development and sale of real estate, which the Company does in the routine conduct of its business. The operations of the Company are conducted through the Operating Company and its subsidiaries, and in some cases, the Holding Company will guarantee the payment by or performance of the Operating Company or its subsidiaries. The Company has operating leases for its corporate office and other facilities and the Holding Company is a guarantor to some of these lease agreements. Operating lease right-of-use assets are included in other assets or related party assets, and operating lease liabilities are included in accounts payable and other liabilities or related party liabilities on the condensed consolidated balance sheets and were as follows as of June 30, 2024 and December 31, 2023 (in thousands): | | | | | | | | | | | |
| June 30, 2024 | | December 31, 2023 |
Operating lease right-of-use assets ($12,808 and $14,040 related party, respectively) | $ | 14,618 | | | $ | 16,002 | |
Operating lease liabilities ($10,129 and $10,974 related party, respectively) | $ | 11,982 | | | $ | 12,755 | |
In addition to operating lease payment guarantees, the Holding Company had other contractual payment guarantees as of June 30, 2024 totaling $8.3 million.
Performance and Completion Bonding Agreements
In the ordinary course of business and as a part of the entitlement and development process, the Company is required to provide performance bonds to ensure completion of certain of the Company’s development obligations. The Company had outstanding performance bonds of $299.0 million and $306.9 million as of June 30, 2024 and December 31, 2023, respectively.
Candlestick and The San Francisco Shipyard Disposition and Development Agreement
The San Francisco Venture is a party to a disposition and development agreement with the Successor to the Redevelopment Agency of the City and County of San Francisco (the “San Francisco Agency”) in which the San Francisco Agency has agreed to convey portions of Candlestick and The San Francisco Shipyard to the San Francisco Venture for development. The San Francisco Venture has agreed to reimburse the San Francisco Agency for reasonable costs and expenses actually incurred and paid by the San Francisco Agency in performing its obligations under the disposition and development agreement. The San Francisco Agency can also earn a return of certain profits generated from the development and sale of Candlestick and The San Francisco Shipyard if certain thresholds are met.
At each of June 30, 2024 and December 31, 2023, the San Francisco Venture had outstanding guarantees benefiting the San Francisco Agency for infrastructure and construction of certain park and open space obligations with aggregate maximum obligations of $198.3 million.
Letters of Credit
At each of June 30, 2024 and December 31, 2023, the Company had outstanding letters of credit totaling $1.0 million. These letters of credit were issued to secure various development and financial obligations. At each of June 30, 2024 and December 31, 2023, the Company had restricted cash and certificates of deposit of $1.0 million pledged as collateral under certain of the letters of credit agreements.
Legal Proceedings
Hunters Point Litigation
In May 2018, residents of the Bayview Hunters Point neighborhood in San Francisco filed a putative class action in San Francisco Superior Court naming Tetra Tech, Inc. and Tetra Tech EC, Inc., an independent contractor hired by the U.S. Navy to conduct testing and remediation of toxic radiological waste at The San Francisco Shipyard (“Tetra Tech”), Lennar and the Company as defendants (the “Bayview Action”). The plaintiffs allege that, among other things, Tetra Tech fraudulently misrepresented its test results and remediation efforts. The plaintiffs are seeking damages against Tetra Tech and the Company and have requested an injunction to prevent the Company and Lennar from undertaking any development activities at The San Francisco Shipyard. The Company believes that it has meritorious defenses to the allegations in the Bayview Action and may have insurance and indemnification rights against third parties with respect to the claims.
Other
Other than the actions outlined above, the Company is also a party to various other claims, legal actions, and complaints arising in the ordinary course of business, the disposition of which, in the Company’s opinion, will not have a material adverse effect on the Company’s condensed consolidated financial statements.
As a significant land owner and developer of unimproved land it is possible that environmental contamination conditions could exist that would require the Company to take corrective action. In the opinion of the Company, such corrective actions, if any, would not have a material adverse effect on the Company’s condensed consolidated financial statements.
12. SUPPLEMENTAL CASH FLOW INFORMATION
Supplemental cash flow information for the six months ended June 30, 2024 and 2023 was as follows (in thousands): | | | | | | | | | | | |
| Six Months Ended June 30, |
| 2024 | | 2023 |
| SUPPLEMENTAL CASH FLOW INFORMATION: | | | |
| Cash paid for interest, all of which was capitalized to inventories | $ | 26,549 | | | $ | 25,998 | |
| Noncash lease expense | $ | 1,383 | | | $ | 2,094 | |
| | | |
| NONCASH INVESTING AND FINANCING ACTIVITIES: | | | |
| | | |
| Adjustment to operating lease right-of-use assets from lease modification | $ | — | | | $ | (773) | |
| Adjustment to liability recognized under TRA | $ | 143 | | | $ | 140 | |
| Senior Notes due 2025 exchanged for New Senior Notes due 2028 (see Note 9) | $ | 523,500 | | | $ | — | |
| | | |
| | | |
| | | |
| | | |
Noncash lease expense is included within the depreciation and amortization adjustment to net income on the Company’s condensed consolidated statements of cash flows.
The following table provides a reconciliation of cash, cash equivalents, and restricted cash reported within the condensed consolidated balance sheets that sum to the total of the same such amounts shown in the condensed consolidated statements of cash flows for the six months ended June 30, 2024 and 2023 (in thousands): | | | | | | | | | | | |
| June 30, 2024 | | June 30, 2023 |
| Cash and cash equivalents | $ | 217,387 | | | $ | 193,203 | |
| Restricted cash and certificates of deposit | 992 | | | 992 | |
| Total cash, cash equivalents, and restricted cash shown in the condensed consolidated statements of cash flows | $ | 218,379 | | | $ | 194,195 | |
Amounts included in restricted cash and certificates of deposit represent amounts held as collateral on open letters of credit related to development obligations or because of other contractual obligations of the Company that require the restriction.
13. SEGMENT REPORTING
The Company’s reportable segments consist of:
• Valencia—includes the community of Valencia being developed in northern Los Angeles County, California. The Valencia segment derives revenues from the sale of residential and commercial land sites to homebuilders, commercial developers and commercial buyers. The Company’s investment in the Valencia Landbank Venture is also reported in the Valencia segment.
• San Francisco—includes the Candlestick and The San Francisco Shipyard communities located on bayfront property in the City of San Francisco, California. The San Francisco segment derives revenues from the sale of residential and commercial land sites to homebuilders, commercial developers and commercial buyers.
• Great Park—includes the Great Park Neighborhoods being developed adjacent to and around the Orange County Great Park, a metropolitan park under construction in Orange County, California. This segment also includes management services provided by the Management Company to the Great Park Venture, the owner of the Great Park Neighborhoods. As of June 30, 2024, the Company had a 37.5% Percentage Interest in the Great Park Venture and accounted for the investment under the equity method. The reported segment information for the Great Park segment includes the results of 100% of the Great Park Venture at the historical basis of the venture, which did not apply push down accounting at acquisition date. The Great Park segment derives revenues at the Great Park Neighborhoods from sales of residential and commercial land sites to homebuilders, commercial developers and commercial buyers and management services provided by the Company to the Great Park Venture.
• Commercial—includes the operations of the Gateway Commercial Venture, which owns an approximately 189,000 square foot office building at the Five Point Gateway Campus. The Five Point Gateway Campus is an office, medical and research and development campus located within the Great Park Neighborhoods and consists of four buildings and surrounding land. The Company and a subsidiary of Lennar lease portions of the building owned by the Gateway Commercial Venture. The Gateway Commercial Venture also owns approximately 50 acres of the surrounding commercial land with additional development rights at the campus. This segment also includes property management services provided by the Management Company to the Gateway Commercial Venture. As of June 30, 2024, the Company had a 75% interest in the Gateway Commercial Venture and accounted for the investment under the equity method. The reported segment information for the Commercial segment includes the results of 100% of the Gateway Commercial Venture at the historical basis of the venture.
Segment operating results and reconciliations to the Company’s consolidated balances are as follows (in thousands): | | | | | | | | | | | | | | | | | | | | | | | | | | | | | | | | | | | | | | | | | | | | | | | |
| Revenues | | Profit (Loss) | | Revenues | | Profit (Loss) |
| Three Months Ended June 30, | | Six Months Ended June 30, |
| 2024 | | 2023 | | 2024 | | 2023 | | 2024 | | 2023 | | 2024 | | 2023 |
Valencia | $ | 745 | | | $ | 413 | | | $ | (3,382) | | | $ | (4,538) | | | $ | 1,786 | | | $ | 1,716 | | | $ | (6,485) | | | $ | (6,977) | |
San Francisco | 168 | | | 162 | | | (1,109) | | | (885) | | | 336 | | | 324 | | | (2,061) | | | (1,915) | |
Great Park | 189,523 | | | 381,266 | | | 83,768 | | | 179,145 | | | 290,845 | | | 393,995 | | | 141,614 | | | 183,651 | |
Commercial | 2,352 | | | 2,125 | | | (162) | | | (502) | | | 5,014 | | | 4,386 | | | (165) | | | (678) | |
| Total reportable segments | 192,788 | | | 383,966 | | | 79,115 | | | 173,220 | | | 297,981 | | | 400,421 | | | 132,903 | | | 174,081 | |
Reconciling items: | | | | | | | | | | | | | | | |
| Removal of results of unconsolidated entities— | | | | | | | | | | | | | | | |
| Great Park Venture (1) | (139,372) | | | (360,596) | | | (44,932) | | | (168,157) | | | (232,081) | | | (369,196) | | | (98,061) | | | (170,900) | |
| Gateway Commercial Venture (1) | (2,224) | | | (2,021) | | | 290 | | | 606 | | | (4,773) | | | (4,175) | | | 406 | | | 889 | |
| Add equity in earnings (losses) from unconsolidated entities— | | | | | | | | | | | | | | | |
| Great Park Venture | — | | | — | | | 15,473 | | | 52,322 | | | — | | | — | | | 33,130 | | | 53,484 | |
| Gateway Commercial Venture | — | | | — | | | (218) | | | (455) | | | — | | | — | | | (305) | | | (667) | |
Corporate and unallocated (2) | — | | | — | | | (11,501) | | | (6,981) | | | — | | | — | | | (23,763) | | | (16,066) | |
Total consolidated balances | $ | 51,192 | | | $ | 21,349 | | | $ | 38,227 | | | $ | 50,555 | | | $ | 61,127 | | | $ | 27,050 | | | $ | 44,310 | | | $ | 40,821 | |
(1) Represents the removal of the Great Park Venture and Gateway Commercial Venture operating results, which are included in the Great Park segment and Commercial segment operating results at 100% of each venture’s historical basis, respectively, but are not included in the Company’s consolidated results and balances as the Company accounts for its investment in each venture using the equity method of accounting.
(2) Corporate and unallocated activity is primarily comprised of corporate general and administrative expenses, deferred tax provision and Senior Notes exchange costs.
Segment assets and reconciliations to the Company’s consolidated balances are as follows (in thousands): | | | | | | | | | | | |
| June 30, 2024 | | December 31, 2023 |
Valencia | $ | 942,548 | | | $ | 895,983 | |
San Francisco | 1,389,951 | | | 1,360,036 | |
Great Park | 763,854 | | | 710,665 | |
Commercial | 85,000 | | | 85,847 | |
| Total reportable segments | 3,181,353 | | | 3,052,531 | |
Reconciling items: | | | |
Removal of unconsolidated balances of Great Park Venture (1) | (645,415) | | | (619,199) | |
Removal of unconsolidated balances of Gateway Commercial Venture (1) | (85,000) | | | (85,847) | |
Other eliminations (2) | (547) | | | (174) | |
Add investment balance in Great Park Venture | 199,610 | | | 213,786 | |
Add investment balance in Gateway Commercial Venture | 37,476 | | | 37,781 | |
Corporate and unallocated (3) | 232,662 | | | 370,410 | |
Total consolidated balances | $ | 2,920,139 | | | $ | 2,969,288 | |
(1) Represents the removal of the Great Park Venture and Gateway Commercial Venture balances, which are included in the Great Park segment and Commercial segment balances at 100% of each venture’s historical basis, respectively, but are not included in the Company’s consolidated balances as the Company accounts for its investment in each venture using the equity method of accounting.
(2) Represents intersegment balances that eliminate in consolidation.
(3) Corporate and unallocated assets consist of cash and cash equivalents, receivables, right-of-use assets and prepaid expenses.
14. SHARE-BASED COMPENSATION
The following table summarizes share-based equity compensation activity for the six months ended June 30, 2024: | | | | | | | | | | | |
| Share-Based Awards
(in thousands) | | Weighted-Average Grant
Date Fair Value |
Nonvested at January 1, 2024 | 4,409 | | | $ | 2.13 | |
Granted | 2,873 | | | $ | 2.58 | |
| | | |
Forfeited | — | | | $ | — | |
Vested | (800) | | | $ | 4.73 | |
Nonvested at June 30, 2024 | 6,482 | | | $ | 2.01 | |
Share-based compensation expense was $1.0 million and $1.8 million for the three and six months ended June 30, 2024, respectively, and $0.9 million and $1.7 million for the three and six months ended June 30, 2023, respectively. Share-based compensation expense is included in selling, general, and administrative expenses on the accompanying condensed consolidated statements of operations.
The estimated fair value at vesting of share-based awards that vested during the six months ended June 30, 2024 was $2.4 million. During the six months ended June 30, 2024 and 2023, the Company reacquired vested restricted Class A common shares for $0.8 million and $0.2 million, respectively, for the purpose of settling tax withholding obligations of employees. The reacquisition cost is based on the fair value of the Company’s Class A common shares on the date the tax obligation is incurred.
15. EMPLOYEE BENEFIT PLANS
Retirement Plan—The Newhall Land and Farming Company Retirement Plan (the “Retirement Plan”) is a defined benefit plan that is funded by the Company and qualified under the Employee Retirement Income Security Act. The Retirement Plan was frozen in 2004.
The components of net periodic (benefit) cost for the three and six months ended June 30, 2024 and 2023, are as follows (in thousands): | | | | | | | | | | | | | | | | | | | | | | | |
| Three Months Ended June 30, | | Six Months Ended June 30, |
| 2024 | | 2023 | | 2024 | | 2023 |
| Net periodic (benefit) cost: | | | | | | | |
Interest cost | $ | 193 | | | $ | 202 | | | $ | 384 | | | $ | 404 | |
Expected return on plan assets | (229) | | | (222) | | | (458) | | | (444) | |
Amortization of net actuarial loss | 13 | | | 40 | | | 27 | | | 81 | |
| Net periodic (benefit) cost | $ | (23) | | | $ | 20 | | | $ | (47) | | | $ | 41 | |
Net periodic (benefit) cost does not include a service cost component as a result of the Retirement Plan being frozen. All other components of net periodic benefit are included in other income on the condensed consolidated statements of operations.
16. INCOME TAXES
Upon formation, the Holding Company elected to be treated as a corporation for U.S. federal, state, and local tax purposes. All operations are carried on through the Holding Company’s subsidiaries, the majority of which are pass-through entities that are generally not subject to federal or state income taxation, as all of the taxable income, gains, losses, deductions, and credits are passed through to the partners. The Holding Company is responsible for income taxes on its allocable share of the Operating Company’s income or gain.
During the three months ended June 30, 2024, the Company recorded a $5.9 million provision for income taxes on pre-tax income of $44.1 million. In the three months ended June 30, 2023, other than a small income tax provision attributed to one of the Company’s consolidated subsidiary corporations, the Company recorded no provision or benefit for income taxes (after application of a decrease in the Company’s valuation allowance) on pre-tax income of $50.6 million. During the six months ended June 30, 2024, the Company recorded a $6.8 million provision for income taxes on pre-tax income of $51.1 million. In the six months ended June 30, 2023, other than a small income tax provision attributed to one of the Company’s consolidated subsidiary corporations, the Company recorded no provision or benefit for income taxes (after application of a decrease in the Company’s valuation allowance) on pre-tax income of $40.8 million.
The effective tax rate for the six months ended June 30, 2024 was higher than in the six months ended June 30, 2023 primarily due to the Company’s valuation allowance, which was released during the year ended December 31, 2023. The effective tax rates for both the six months ended June 30, 2024 and 2023 differ from the 21% federal statutory rate and applicable state statutory rates primarily due to the disallowance of executive compensation expenses not deductible for tax and to the pre-tax portion of income and losses that are passed through to the other partners of the Operating Company and the San Francisco Venture.
17. FINANCIAL INSTRUMENTS AND FAIR VALUE MEASUREMENTS AND DISCLOSURES
ASC Topic 820, Fair Value Measurement, emphasizes that a fair value measurement should be determined based on the assumptions that market participants would use in pricing the asset or liability. As a basis for considering market participant assumptions in fair value measurements, the guidance establishes a fair value hierarchy that distinguishes between market participant assumptions based on market data obtained from sources independent of the reporting entity and the reporting entity’s own assumptions about market participant assumptions. The following hierarchy classifies the inputs used to determine fair value into three levels:
Level 1—Quoted prices for identical instruments in active markets
Level 2—Quoted prices for similar instruments in active markets or inputs, other than quoted prices, that are observable for the instrument either directly or indirectly
Level 3—Significant inputs to the valuation model are unobservable
At each reporting period, the Company evaluates the fair value of its financial instruments compared to carrying values. Other than the Company’s notes payable, net, the carrying amount of the Company’s financial instruments, which includes cash and cash equivalents, restricted cash and certificates of deposit, certain related party assets and liabilities, and accounts payable and other liabilities, approximated the Company’s estimates of fair value at both June 30, 2024 and December 31, 2023.
The fair value of the Company’s notes payable, net, are estimated based on quoted market prices or discounting the expected cash flows based on rates available to the Company (level 2). At June 30, 2024, the estimated fair value of notes payable, net was $537.6 million, compared to a carrying value of $524.1 million. At December 31, 2023, the estimated fair value of notes payable, net was $622.7 million, compared to a carrying value of $622.2 million. During the three and six months ended June 30, 2024 and 2023, the Company had no assets that were measured at fair value on a nonrecurring basis.
18. EARNINGS PER SHARE
The Company uses the two-class method in its computation of earnings per share. The Company’s Class A common shares and Class B common shares are entitled to receive distributions at different rates, with each Class B common share receiving 0.03% of the distributions paid on each Class A common share. Under the two-class method, the Company’s net income available to common shareholders is allocated between the two classes of common shares on a fully-distributed basis and reflects residual net income after amounts attributed to noncontrolling interests. In the event of a net loss, the Company determined that both classes share in the Company’s losses, and they share in the losses using the same mechanism as the distributions. The Company also has restricted share awards that have a right to non-forfeitable dividends while unvested and are contemplated as participating when the Company is in a net income position. These awards participate in distributions on a basis equivalent to other Class A common shares but do not participate in losses.
No distributions on common shares were declared for the three and six months ended June 30, 2024 or 2023.
Diluted income (loss) per share calculations for both Class A common shares and Class B common shares contemplate adjustments to the numerator and the denominator under the if-converted method for the convertible Class B common shares, the exchangeable Class A units of the San Francisco Venture and the exchangeable Class A Common Units of the Operating Company. The Company uses the treasury stock method or the two-class method when evaluating dilution for restricted stock units (“RSUs”), restricted shares, and performance restricted units and shares. The more dilutive of the two methods is included in the calculation for diluted income (loss) per share.
The following table summarizes the basic and diluted earnings per share calculations for the three and six months ended June 30, 2024 and 2023 (in thousands, except shares and per share amounts):
| | | | | | | | | | | | | | | | | | | | | | | |
| Three Months Ended June 30, | | Six Months Ended June 30, |
| 2024 | | 2023 | | 2024 | | 2023 |
Numerator: | | | | | | | |
| Net income attributable to the Company | $ | 14,722 | | | $ | 23,571 | | | $ | 17,048 | | | $ | 19,035 | |
| Adjustments to net income attributable to the Company | — | | | — | | | (9) | | | (13) | |
| Net income attributable to common shareholders | $ | 14,722 | | | $ | 23,571 | | | $ | 17,039 | | | $ | 19,022 | |
Numerator—basic common shares: | | | | | | | |
| Net income attributable to common shareholders | $ | 14,722 | | | $ | 23,571 | | | $ | 17,039 | | | $ | 19,022 | |
Less: net income allocated to participating securities | 25 | | | 132 | | | 26 | | | 100 | |
| Allocation of basic net income among common shareholders | $ | 14,697 | | | $ | 23,439 | | | $ | 17,013 | | | $ | 18,922 | |
| Numerator for basic net income available to Class A common shareholders | $ | 14,692 | | | $ | 23,431 | | | $ | 17,007 | | | $ | 18,915 | |
| Numerator for basic net income available to Class B common shareholders | $ | 5 | | | $ | 8 | | | $ | 6 | | | $ | 7 | |
Numerator—diluted common shares: | | | | | | | |
| Net income attributable to common shareholders | $ | 14,722 | | | $ | 23,571 | | | $ | 17,039 | | | $ | 19,022 | |
| Reallocation of income from dilutive potential securities | 15,992 | | | 25,878 | | | 18,512 | | | 20,917 | |
Less: net income allocated to participating securities | 25 | | | 132 | | | 26 | | | 100 | |
| Allocation of diluted net income among common shareholders | $ | 30,689 | | | $ | 49,317 | | | $ | 35,525 | | | $ | 39,839 | |
| Numerator for diluted net income available to Class A common shareholders | $ | 30,684 | | | $ | 49,309 | | | $ | 35,519 | | | $ | 39,832 | |
| Numerator for diluted net income available to Class B common shareholders | $ | 5 | | | $ | 8 | | | $ | 6 | | | $ | 7 | |
Denominator: | | | | | | | |
| Basic weighted average Class A common shares outstanding | 69,239,296 | | | 68,811,975 | | | 69,148,940 | | | 68,758,894 | |
Diluted weighted average Class A common shares outstanding | 145,936,206 | | | 145,040,689 | | | 145,906,521 | | | 144,939,450 | |
| Basic and diluted weighted average Class B common shares outstanding | 79,233,544 | | | 79,233,544 | | | 79,233,544 | | | 79,233,544 | |
| | | | | | | |
| Basic earnings per share: | | | | | | | |
Class A common shares | $ | 0.21 | | | $ | 0.34 | | | $ | 0.25 | | | $ | 0.28 | |
Class B common shares | $ | 0.00 | | | $ | 0.00 | | | $ | 0.00 | | | $ | 0.00 | |
| Diluted earnings per share: | | | | | | | |
Class A common shares | $ | 0.21 | | | $ | 0.34 | | | $ | 0.24 | | | $ | 0.27 | |
Class B common shares | $ | 0.00 | | | $ | 0.00 | | | $ | 0.00 | | | $ | 0.00 | |
| | | | | | | |
Anti-dilutive potential RSUs | — | | | — | | | — | | | — | |
Anti-dilutive potential Performance RSUs | 4,509,646 | | | 3,123,408 | | | 4,509,646 | | | 3,123,408 | |
Anti-dilutive potential Restricted Shares (weighted average) | — | | | — | | | — | | | — | |
| | | | | | | |
| Anti-dilutive potential Class A common shares from exchanges (weighted average) | 3,137,134 | | | 3,137,134 | | | 3,137,134 | | | 3,137,134 | |
| | | | | | | |
19. ACCUMULATED OTHER COMPREHENSIVE LOSS
Accumulated other comprehensive loss attributable to the Company consists of unamortized defined benefit pension plan net actuarial losses that totaled $2.3 million and $2.3 million at June 30, 2024 and December 31, 2023, respectively, net of tax benefits of $0.6 million and $0.6 million, respectively. Accumulated other comprehensive loss of $1.5 million and $1.5 million is included in noncontrolling interests at June 30, 2024 and December 31, 2023, respectively. Net actuarial gains or losses are re-determined annually or upon remeasurement events and principally arise from changes in the rate used to discount benefit obligations and differences between expected and actual returns on plan assets. Reclassifications from accumulated other comprehensive loss to net income attributable to the Company related to amortization of net actuarial losses were approximately $13,000 and $51,000, net of taxes, for the six months ended June 30, 2024 and 2023, respectively, and are included in other miscellaneous expense in the accompanying condensed consolidated statements of operations.
ITEM 2. Management’s Discussion and Analysis of Financial Condition and Results of Operations
Forward-Looking Statements
The following discussion contains management’s discussion and analysis of our financial condition and results of operations and should be read in conjunction with our unaudited condensed consolidated financial statements and related notes included under Part I, Item 1 of this report and our audited consolidated financial statements included in our Annual Report on Form 10-K for the fiscal year ended December 31, 2023. “Us,” “we,” and “our” refer to Five Point Holdings, LLC, together with its consolidated subsidiaries. This discussion contains forward-looking statements and involves numerous risks and uncertainties, including but not limited to those described in the “Risk Factors” section of our Annual Report on Form 10-K for the fiscal year ended December 31, 2023, as well as other risks and uncertainties detailed from time to time in our subsequent Quarterly Reports on Form 10-Q and other filings with the Securities and Exchange Commission. Actual results could differ materially from those set forth in any forward-looking statements. See “Cautionary Statement Regarding Forward-Looking Statements.”
Overview
We conduct all of our business in or through our operating company, Five Point Operating Company, LP (the “operating company”). We are, through a wholly owned subsidiary, the sole managing general partner and owned, as of June 30, 2024, approximately 62.6% of the operating company. The operating company directly or indirectly owns equity interests in:
•Five Point Land, LLC, which owns The Newhall Land & Farming Company, a California limited partnership, the entity that is developing Valencia, our community in northern Los Angeles County, California;
•The Shipyard Communities, LLC (the “San Francisco Venture”), which is developing Candlestick and The San Francisco Shipyard, our communities in the City of San Francisco, California;
•Heritage Fields LLC (the “Great Park Venture”), which is developing Great Park Neighborhoods, our community in Orange County, California;
•Five Point Office Venture Holdings I, LLC (the “Gateway Commercial Venture”), which owns portions of the Five Point Gateway Campus, a commercial office, research and development and medical campus located within the Great Park Neighborhoods; and
•Five Point Communities, LP and Five Point Communities Management, Inc. (together, the “management company”), which provide development and property management services for the Great Park Neighborhoods and the Five Point Gateway Campus.
The operating company consolidates and controls the management of all of these entities except for the Great Park Venture and the Gateway Commercial Venture. The operating company owns a 37.5% percentage interest in the Great Park Venture and a 75% interest in the Gateway Commercial Venture and accounts for its interest in both using the equity method.
Operational Highlights
During the second quarter of 2024, we continued to focus on execution of our three main priorities: generating revenue and positive cash flow; controlling our selling, general and administrative (“SG&A”) costs; and managing our capital spend to match near-term revenue opportunities. Our consolidated net income was $38.2 million for the three months ended June 30, 2024, compared to net income of $50.6 million for the three months ended June 30, 2023. SG&A expenses totaled $12.2 million for the second quarter of 2024, compared to $12.7 million for the three months ended June 30, 2023. At June 30, 2024, we had $217.4 million in cash and $125.0 million available under our revolving credit facility, giving us total liquidity of $342.4 million.
Although the inflation and interest rate environment remained challenging during the three months ended June 30, 2024, we continued to see meaningful price appreciation in our land sale pricing at the Great Park Neighborhoods. The Great Park Venture, in which we have a 37.5% percentage interest and manage all aspects of the development cycle, closed the sale of 105 homesites on 12.3 acres at the Great Park Neighborhoods in the second quarter of 2024 for an aggregate gross purchase price of $96.1 million. We received $29.7 million in distributions and related payments from the Great Park Venture for both our ownership interests and incentive management fee compensation.
At Valencia, guest builders sold 84 homes during the second quarter of 2024, compared to 62 homes during the first quarter of 2024, increasing total homes sold to 1,400 since sales began in May 2021. At the Great Park Neighborhoods, guest builders sold a total of 63 homes during the second quarter of 2024, compared to 69 homes during the first quarter of 2024. We believe the low quantity of home sales at the Great Park Neighborhoods was largely due to a lack of available inventory during the first half of 2024. We anticipate additional inventory will become available for sale over the second half of 2024, and we expect demand in our chronically undersupplied housing markets to remain strong and to drive a strong finish to the year. While we do not have any planned residential land sales in the third quarter, we expect to close land sales in the fourth quarter at both the Great Park Neighborhoods and Valencia.
Results of Operations
The timing of our land sale revenues is influenced by several factors, including the sequencing of the planning and development process and market conditions at our communities. As a result, we have historically experienced, and expect to continue to experience, variability in results of operations between comparable periods.
The following table summarizes our consolidated historical results of operations for the three and six months ended June 30, 2024 and 2023. | | | | | | | | | | | | | | | | | | | | | | | |
| Three Months Ended June 30, | | Six Months Ended June 30, |
| 2024 | | 2023 | | 2024 | | 2023 |
| (in thousands) |
Statement of Operations Data | | | | | | | |
Revenues | | | | | | | |
Land sales | $ | 307 | | | $ | 16 | | | $ | 842 | | | $ | (9) | |
Land sales—related party | 3 | | | (29) | | | — | | | 595 | |
Management services—related party | 50,279 | | | 20,774 | | | 59,005 | | | 25,010 | |
Operating properties | 603 | | | 588 | | | 1,280 | | | 1,454 | |
Total revenues | 51,192 | | | 21,349 | | | 61,127 | | | 27,050 | |
Costs and expenses | | | | | | | |
Land sales | — | | | — | | | — | | | — | |
Management services | 11,315 | | | 9,682 | | | 15,211 | | | 12,048 | |
Operating properties | 1,878 | | | 1,798 | | | 2,868 | | | 2,970 | |
Selling, general, and administrative | 12,186 | | | 12,710 | | | 25,102 | | | 26,462 | |
| | | | | | | |
| | | | | | | |
Total costs and expenses | 25,379 | | | 24,190 | | | 43,181 | | | 41,480 | |
| Other income (expense) | | | | | | | |
| | | | | | | |
Interest income | 2,755 | | | 1,293 | | | 5,980 | | | 2,129 | |
| | | | | | | |
Miscellaneous | 26 | | | (20) | | | (5,881) | | | (41) | |
| Total other income | 2,781 | | | 1,273 | | | 99 | | | 2,088 | |
| Equity in earnings from unconsolidated entities | 15,498 | | | 52,128 | | | 33,084 | | | 53,176 | |
| Income before income tax provision | 44,092 | | | 50,560 | | | 51,129 | | | 40,834 | |
| Income tax provision | (5,865) | | | (5) | | | (6,819) | | | (13) | |
| Net income | 38,227 | | | 50,555 | | | 44,310 | | | 40,821 | |
| Less net income attributable to noncontrolling interests | 23,505 | | | 26,984 | | | 27,262 | | | 21,786 | |
| Net income attributable to the company | $ | 14,722 | | | $ | 23,571 | | | $ | 17,048 | | | $ | 19,035 | |
Three Months Ended June 30, 2024 and 2023
Revenues. Revenues increased by $29.8 million, or 139.8%, to $51.2 million for the three months ended June 30, 2024, from $21.3 million for the three months ended June 30, 2023. The increase in revenues was primarily due to an increase in management services revenue at our Great Park segment during the three months ended June 30, 2024.
Cost of management services. Cost of management services increased by $1.6 million, or 16.9%, to $11.3 million for the three months ended June 30, 2024, from $9.7 million for the three months ended June 30, 2023. The increase was primarily due to an increase in intangible asset amortization expense at our Great Park segment.
Selling, general, and administrative. SG&A expenses decreased by $0.5 million, or 4.1%, to $12.2 million for the three months ended June 30, 2024, from $12.7 million for the three months ended June 30, 2023. The decrease was mainly attributable to a decrease in selling and marketing expenses at our Valencia segment.
Equity in earnings from unconsolidated entities. Our consolidated results reflect our share in the earnings or losses of our interests in our unconsolidated entities, including the Great Park Venture and the Gateway Commercial Venture, within equity in earnings from unconsolidated entities on our condensed consolidated statement of operations. Our segment results for the Great Park segment and the Commercial segment present the results of the Great Park Venture and the Gateway Commercial Venture at the book basis of the ventures within the respective segments.
Equity in earnings from unconsolidated entities was $15.5 million for the three months ended June 30, 2024, a decrease from earnings of $52.1 million for the three months ended June 30, 2023. Equity in earnings for the three months ended June 30, 2024 and 2023 was primarily a result of recognizing our share of the net income generated by the Great Park Venture from land sales during each quarter.
Income taxes. Pre-tax income of $44.1 million for the three months ended June 30, 2024 resulted in a $5.9 million tax provision. Pre-tax income of $50.6 million for the three months ended June 30, 2023 resulted in no tax provision (after application of a decrease in our valuation allowance of $6.9 million) other than a small tax provision incurred by one of our consolidated subsidiary corporations. We assessed the realization of our net deferred tax asset and the need for a valuation allowance and determined that at June 30, 2024, it was more likely than not that the net deferred tax asset would be realizable, and we had no valuation allowance recorded. Our effective tax rate for the three months ended June 30, 2024 was substantially similar to our effective tax rate, before changes in valuation allowance, for the three months ended June 30, 2023.
Net income attributable to noncontrolling interests. Until exchanged for our Class A common shares or, at our election, cash, noncontrolling interests represent interests held by other partners in the operating company and members of the San Francisco Venture. Net income attributable to the noncontrolling interests on the condensed consolidated statement of operations represents the portion of income or losses attributable to the interests in our subsidiaries held by the noncontrolling interests.
Six Months Ended June 30, 2024 and 2023
Revenues. Revenues increased by $34.1 million, or 126.0%, to $61.1 million for the six months ended June 30, 2024, from $27.1 million for the six months ended June 30, 2023. The increase in revenues was primarily due to an increase in management services revenue at our Great Park segment during the six months ended June 30, 2024.
Cost of management services. Cost of management services increased by $3.2 million, or 26.3%, to $15.2 million for the six months ended June 30, 2024, from $12.0 million for the six months ended June 30, 2023. The increase was primarily due to an increase in intangible asset amortization expense at our Great Park segment.
Selling, general, and administrative. SG&A expenses decreased by $1.4 million, or 5.1%, to $25.1 million for the six months ended June 30, 2024, from $26.5 million for the six months ended June 30, 2023. The decrease was mainly attributable to a decrease in corporate general and administrative expenses.
Equity in earnings from unconsolidated entities. Our consolidated results reflect our share in the earnings or losses of our interests in our unconsolidated entities, including the Great Park Venture and the Gateway Commercial Venture, within equity in earnings from unconsolidated entities on our condensed consolidated statement of operations. Our segment results for the Great Park segment and the Commercial segment present the results of the Great Park Venture and the Gateway Commercial Venture at the book basis of the ventures within the respective segments.
Equity in earnings from unconsolidated entities was $33.1 million for the six months ended June 30, 2024, a decrease from earnings of $53.2 million for the six months ended June 30, 2023. Equity in earnings for the six months ended June 30, 2024 and 2023 was primarily a result of recognizing our share of the net income generated by the Great Park Venture from land sales during each period.
Income taxes. Pre-tax income of $51.1 million for the six months ended June 30, 2024 resulted in a $6.8 million tax provision. Pre-tax income of $40.8 million for the six months ended June 30, 2023 resulted in no tax provision (after application of a decrease in our valuation allowance of $5.5 million) other than a small tax provision incurred by one of our consolidated subsidiary corporations. We assessed the realization of our net deferred tax asset and the need for a valuation allowance and determined that at June 30, 2024, it was more likely than not that the net deferred tax asset would be realizable, and we had no valuation allowance recorded. Our effective tax rate for the six months ended June 30, 2024 was substantially similar to our effective tax rate, before changes in valuation allowance, for the six months ended June 30, 2023.
Net income attributable to noncontrolling interests. Until exchanged for our Class A common shares or, at our election, cash, noncontrolling interests represent interests held by other partners in the operating company and members of the San Francisco Venture. Net income attributable to the noncontrolling interests on the condensed consolidated statement of operations represents the portion of income or losses attributable to the interests in our subsidiaries held by the noncontrolling interests.
Segment Results and Financial Information
Our four reportable operating segments include our three community segments, Valencia, San Francisco and Great Park, and our Commercial segment:
•Our Valencia segment includes operating results related to the Valencia community and agricultural operations in Los Angeles and Ventura Counties, California. Our investment in the Valencia Landbank Venture is also reported in the Valencia segment.
•Our San Francisco segment includes operating results for the Candlestick and The San Francisco Shipyard communities.
•Our Great Park segment includes operating results for the Great Park Neighborhoods community as well as development management services provided by the management company for the Great Park Venture.
•Our Commercial segment includes the operating results of the Gateway Commercial Venture’s ownership in the Five Point Gateway Campus as well as property management services provided by the management company for the Gateway Commercial Venture.
The following tables reconcile the results of operations of our segments to our consolidated results for the three and six months ended June 30, 2024 and 2023 (in thousands): | | | | | | | | | | | | | | | | | | | | | | | | | | | | | | | | | | | | | | | | | | | | | | | | | | | | | |
| Three Months Ended June 30, 2024 |
| Valencia | | San Francisco | | Great Park | | Commercial | | Total reportable segments | | Corporate and unallocated | | Total under management | | Removal of unconsolidated entities(1) | | Total consolidated |
| REVENUES: | | | | | | | | | | | | | | | | | |
| Land sales | $ | 307 | | | $ | — | | | $ | 134,638 | | | $ | — | | | $ | 134,945 | | | $ | — | | | $ | 134,945 | | | $ | (134,638) | | | $ | 307 | |
| Land sales—related party | 3 | | | — | | | 4,734 | | | — | | | 4,737 | | | — | | | 4,737 | | | (4,734) | | | 3 | |
| | | | | | | | | | | | | | | | | |
Management services—related party(2) | — | | | — | | | 50,151 | | | 128 | | | 50,279 | | | — | | | 50,279 | | | — | | | 50,279 | |
| Operating properties | 435 | | | 168 | | | — | | | 2,224 | | | 2,827 | | | — | | | 2,827 | | | (2,224) | | | 603 | |
| Total revenues | 745 | | | 168 | | | 189,523 | | | 2,352 | | | 192,788 | | | — | | | 192,788 | | | (141,596) | | | 51,192 | |
| COSTS AND EXPENSES: | | | | | | | | | | | | | | | | | |
| Land sales | — | | | — | | | 29,016 | | | — | | | 29,016 | | | — | | | 29,016 | | | (29,016) | | | — | |
| | | | | | | | | | | | | | | | | |
Management services(2) | — | | | — | | | 11,315 | | | — | | | 11,315 | | | — | | | 11,315 | | | — | | | 11,315 | |
| Operating properties | 1,878 | | | — | | | — | | | 864 | | | 2,742 | | | — | | | 2,742 | | | (864) | | | 1,878 | |
| Selling, general, and administrative | 2,515 | | | 1,294 | | | 2,625 | | | 1,019 | | | 7,453 | | | 8,377 | | | 15,830 | | | (3,644) | | | 12,186 | |
| | | | | | | | | | | | | | | | | |
| Management fees—related party | — | | | — | | | 64,470 | | | — | | | 64,470 | | | — | | | 64,470 | | | (64,470) | | | — | |
| Total costs and expenses | 4,393 | | | 1,294 | | | 107,426 | | | 1,883 | | | 114,996 | | | 8,377 | | | 123,373 | | | (97,994) | | | 25,379 | |
| OTHER INCOME (EXPENSE): | | | | | | | | | | | | | | | | | |
| | | | | | | | | | | | | | | | | |
| Interest income | — | | | 17 | | | 1,671 | | | 59 | | | 1,747 | | | 2,738 | | | 4,485 | | | (1,730) | | | 2,755 | |
| Interest expense | — | | | — | | | — | | | (690) | | | (690) | | | — | | | (690) | | | 690 | | | — | |
| | | | | | | | | | | | | | | | | |
| | | | | | | | | | | | | | | | | |
| | | | | | | | | | | | | | | | | |
| Miscellaneous | 23 | | | — | | | — | | | — | | | 23 | | | 3 | | | 26 | | | — | | | 26 | |
| Total other income (expense) | 23 | | | 17 | | | 1,671 | | | (631) | | | 1,080 | | | 2,741 | | | 3,821 | | | (1,040) | | | 2,781 | |
| EQUITY IN EARNINGS FROM UNCONSOLIDATED ENTITIES | 243 | | | — | | | — | | | — | | | 243 | | | — | | | 243 | | | 15,255 | | | 15,498 | |
| SEGMENT (LOSS) PROFIT/INCOME BEFORE INCOME TAX PROVISION | (3,382) | | | (1,109) | | | 83,768 | | | (162) | | | 79,115 | | | (5,636) | | | 73,479 | | | (29,387) | | | 44,092 | |
| INCOME TAX PROVISION | — | | | — | | | — | | | — | | | — | | | (5,865) | | | (5,865) | | | — | | | (5,865) | |
| SEGMENT (LOSS) PROFIT/NET INCOME | $ | (3,382) | | | $ | (1,109) | | | $ | 83,768 | | | $ | (162) | | | $ | 79,115 | | | $ | (11,501) | | | $ | 67,614 | | | $ | (29,387) | | | $ | 38,227 | |
(1) Represents the removal of the Great Park Venture and Gateway Commercial Venture operating results, which are included in the Great Park segment and Commercial segment operating results at 100% of each venture’s historical basis, respectively, but are not included in our consolidated results as we account for our investment in each venture using the equity method of accounting.
(2) For the Great Park and Commercial segments, represents the revenues and expenses attributable to the management company for providing services to the Great Park Venture and the Gateway Commercial Venture, as applicable.
| | | | | | | | | | | | | | | | | | | | | | | | | | | | | | | | | | | | | | | | | | | | | | | | | | | | | |
| Three Months Ended June 30, 2023 |
| Valencia | | San Francisco | | Great Park | | Commercial | | Total reportable segments | | Corporate and unallocated | | Total under management | | Removal of unconsolidated entities(1) | | Total consolidated |
| REVENUES: | | | | | | | | | | | | | | | | | |
| Land sales | $ | 16 | | | $ | — | | | $ | 358,668 | | | $ | — | | | $ | 358,684 | | | $ | — | | | $ | 358,684 | | | $ | (358,668) | | | $ | 16 | |
| Land sales—related party | (29) | | | — | | | 1,928 | | | — | | | 1,899 | | | — | | | 1,899 | | | (1,928) | | | (29) | |
| | | | | | | | | | | | | | | | | |
Management services—related party(2) | — | | | — | | | 20,670 | | | 104 | | | 20,774 | | | — | | | 20,774 | | | — | | | 20,774 | |
| Operating properties | 426 | | | 162 | | | — | | | 2,021 | | | 2,609 | | | — | | | 2,609 | | | (2,021) | | | 588 | |
| Total revenues | 413 | | | 162 | | | 381,266 | | | 2,125 | | | 383,966 | | | — | | | 383,966 | | | (362,617) | | | 21,349 | |
| COSTS AND EXPENSES: | | | | | | | | | | | | | | | | | |
| Land sales | — | | | — | | | 165,749 | | | — | | | 165,749 | | | — | | | 165,749 | | | (165,749) | | | — | |
| | | | | | | | | | | | | | | | | |
Management services(2) | — | | | — | | | 9,682 | | | — | | | 9,682 | | | — | | | 9,682 | | | — | | | 9,682 | |
| Operating properties | 1,798 | | | — | | | — | | | 1,019 | | | 2,817 | | | — | | | 2,817 | | | (1,019) | | | 1,798 | |
| Selling, general, and administrative | 3,394 | | | 1,049 | | | 1,815 | | | 1,033 | | | 7,291 | | | 8,267 | | | 15,558 | | | (2,848) | | | 12,710 | |
| | | | | | | | | | | | | | | | | |
| Management fees—related party | — | | | — | | | 27,388 | | | — | | | 27,388 | | | — | | | 27,388 | | | (27,388) | | | — | |
| Total costs and expenses | 5,192 | | | 1,049 | | | 204,634 | | | 2,052 | | | 212,927 | | | 8,267 | | | 221,194 | | | (197,004) | | | 24,190 | |
| OTHER (EXPENSE) INCOME: | | | | | | | | | | | | | | | | | |
| | | | | | | | | | | | | | | | | |
| Interest income | — | | | 2 | | | 1,907 | | | — | | | 1,909 | | | 1,291 | | | 3,200 | | | (1,907) | | | 1,293 | |
| Interest expense | — | | | — | | | — | | | (575) | | | (575) | | | — | | | (575) | | | 575 | | | — | |
| | | | | | | | | | | | | | | | | |
| | | | | | | | | | | | | | | | | |
| | | | | | | | | | | | | | | | | |
| Miscellaneous | (20) | | | — | | | — | | | — | | | (20) | | | — | | | (20) | | | — | | | (20) | |
| Total other (expense) income | (20) | | | 2 | | | 1,907 | | | (575) | | | 1,314 | | | 1,291 | | | 2,605 | | | (1,332) | | | 1,273 | |
| EQUITY IN EARNINGS FROM UNCONSOLIDATED ENTITIES | 261 | | | — | | | 606 | | | — | | | 867 | | | — | | | 867 | | | 51,261 | | | 52,128 | |
| SEGMENT (LOSS) PROFIT/INCOME BEFORE INCOME TAX PROVISION | (4,538) | | | (885) | | | 179,145 | | | (502) | | | 173,220 | | | (6,976) | | | 166,244 | | | (115,684) | | | 50,560 | |
| INCOME TAX PROVISION | — | | | — | | | — | | | — | | | — | | | (5) | | | (5) | | | — | | | (5) | |
| SEGMENT (LOSS) PROFIT/NET INCOME | $ | (4,538) | | | $ | (885) | | | $ | 179,145 | | | $ | (502) | | | $ | 173,220 | | | $ | (6,981) | | | $ | 166,239 | | | $ | (115,684) | | | $ | 50,555 | |
(1) Represents the removal of the Great Park Venture and Gateway Commercial Venture operating results, which are included in the Great Park segment and Commercial segment operating results at 100% of each venture’s historical basis, respectively, but are not included in our consolidated results as we account for our investment in each venture using the equity method of accounting.
(2) For the Great Park and Commercial segments, represents the revenues and expenses attributable to the management company for providing services to the Great Park Venture and the Gateway Commercial Venture, as applicable.
| | | | | | | | | | | | | | | | | | | | | | | | | | | | | | | | | | | | | | | | | | | | | | | | | | | | | |
| Six Months Ended June 30, 2024 |
| Valencia | | San Francisco | | Great Park | | Commercial | | Total reportable segments | | Corporate and unallocated | | Total under management | | Removal of unconsolidated entities(1) | | Total consolidated |
| REVENUES: | | | | | | | | | | | | | | | | | |
| Land sales | $ | 842 | | | $ | — | | | $ | 215,456 | | | $ | — | | | $ | 216,298 | | | $ | — | | | $ | 216,298 | | | $ | (215,456) | | | $ | 842 | |
| Land sales—related party | — | | | — | | | 16,625 | | | — | | | 16,625 | | | — | | | 16,625 | | | (16,625) | | | — | |
| | | | | | | | | | | | | | | | | |
Management services—related party(2) | — | | | — | | | 58,764 | | | 241 | | | 59,005 | | | — | | | 59,005 | | | — | | | 59,005 | |
| Operating properties | 944 | | | 336 | | | — | | | 4,773 | | | 6,053 | | | — | | | 6,053 | | | (4,773) | | | 1,280 | |
| Total revenues | 1,786 | | | 336 | | | 290,845 | | | 5,014 | | | 297,981 | | | — | | | 297,981 | | | (236,854) | | | 61,127 | |
| COSTS AND EXPENSES: | | | | | | | | | | | | | | | | | |
| Land sales | — | | | — | | | 58,974 | | | — | | | 58,974 | | | — | | | 58,974 | | | (58,974) | | | — | |
| | | | | | | | | | | | | | | | | |
Management services(2) | — | | | — | | | 15,211 | | | — | | | 15,211 | | | — | | | 15,211 | | | — | | | 15,211 | |
| Operating properties | 2,868 | | | — | | | — | | | 1,840 | | | 4,708 | | | — | | | 4,708 | | | (1,840) | | | 2,868 | |
| Selling, general, and administrative | 5,709 | | | 2,429 | | | 5,564 | | | 2,048 | | | 15,750 | | | 16,964 | | | 32,714 | | | (7,612) | | | 25,102 | |
| | | | | | | | | | | | | | | | | |
| Management fees—related party | — | | | — | | | 72,632 | | | — | | | 72,632 | | | — | | | 72,632 | | | (72,632) | | | — | |
| Total costs and expenses | 8,577 | | | 2,429 | | | 152,381 | | | 3,888 | | | 167,275 | | | 16,964 | | | 184,239 | | | (141,058) | | | 43,181 | |
| OTHER INCOME (EXPENSE): | | | | | | | | | | | | | | | | | |
| | | | | | | | | | | | | | | | | |
| Interest income | — | | | 32 | | | 3,150 | | | 93 | | | 3,275 | | | 5,948 | | | 9,223 | | | (3,243) | | | 5,980 | |
| Interest expense | — | | | — | | | — | | | (1,384) | | | (1,384) | | | — | | | (1,384) | | | 1,384 | | | — | |
| | | | | | | | | | | | | | | | | |
| | | | | | | | | | | | | | | | | |
| | | | | | | | | | | | | | | | | |
| Miscellaneous | 47 | | | — | | | — | | | — | | | 47 | | | (5,928) | | | (5,881) | | | — | | | (5,881) | |
| Total other income (expense) | 47 | | | 32 | | | 3,150 | | | (1,291) | | | 1,938 | | | 20 | | | 1,958 | | | (1,859) | | | 99 | |
| EQUITY IN EARNINGS FROM UNCONSOLIDATED ENTITIES | 259 | | | — | | | — | | | — | | | 259 | | | — | | | 259 | | | 32,825 | | | 33,084 | |
| SEGMENT (LOSS) PROFIT/INCOME BEFORE INCOME TAX PROVISION | (6,485) | | | (2,061) | | | 141,614 | | | (165) | | | 132,903 | | | (16,944) | | | 115,959 | | | (64,830) | | | 51,129 | |
| INCOME TAX PROVISION | — | | | — | | | — | | | — | | | — | | | (6,819) | | | (6,819) | | | — | | | (6,819) | |
| SEGMENT (LOSS) PROFIT/NET INCOME | $ | (6,485) | | | $ | (2,061) | | | $ | 141,614 | | | $ | (165) | | | $ | 132,903 | | | $ | (23,763) | | | $ | 109,140 | | | $ | (64,830) | | | $ | 44,310 | |
(1) Represents the removal of the Great Park Venture and Gateway Commercial Venture operating results, which are included in the Great Park segment and Commercial segment operating results at 100% of each venture’s historical basis, respectively, but are not included in our consolidated results as we account for our investment in each venture using the equity method of accounting.
(2) For the Great Park and Commercial segments, represents the revenues and expenses attributable to the management company for providing services to the Great Park Venture and the Gateway Commercial Venture, as applicable.
| | | | | | | | | | | | | | | | | | | | | | | | | | | | | | | | | | | | | | | | | | | | | | | | | | | | | |
| Six Months Ended June 30, 2023 |
| Valencia | | San Francisco | | Great Park | | Commercial | | Total reportable segments | | Corporate and unallocated | | Total under management | | Removal of unconsolidated entities(1) | | Total consolidated |
| REVENUES: | | | | | | | | | | | | | | | | | |
| Land sales | $ | (9) | | | $ | — | | | $ | 361,801 | | | $ | — | | | $ | 361,792 | | | $ | — | | | $ | 361,792 | | | $ | (361,801) | | | $ | (9) | |
| Land sales—related party | 595 | | | — | | | 7,395 | | | — | | | 7,990 | | | — | | | 7,990 | | | (7,395) | | | 595 | |
| | | | | | | | | | | | | | | | | |
Management services—related party(2) | — | | | — | | | 24,799 | | | 211 | | | 25,010 | | | — | | | 25,010 | | | — | | | 25,010 | |
| Operating properties | 1,130 | | | 324 | | | — | | | 4,175 | | | 5,629 | | | — | | | 5,629 | | | (4,175) | | | 1,454 | |
| Total revenues | 1,716 | | | 324 | | | 393,995 | | | 4,386 | | | 400,421 | | | — | | | 400,421 | | | (373,371) | | | 27,050 | |
| COSTS AND EXPENSES: | | | | | | | | | | | | | | | | | |
| Land sales | — | | | — | | | 165,749 | | | — | | | 165,749 | | | — | | | 165,749 | | | (165,749) | | | — | |
| | | | | | | | | | | | | | | | | |
Management services(2) | — | | | — | | | 12,048 | | | — | | | 12,048 | | | — | | | 12,048 | | | — | | | 12,048 | |
| Operating properties | 2,970 | | | — | | | — | | | 1,803 | | | 4,773 | | | — | | | 4,773 | | | (1,803) | | | 2,970 | |
| Selling, general, and administrative | 6,041 | | | 2,242 | | | 5,143 | | | 2,153 | | | 15,579 | | | 18,179 | | | 33,758 | | | (7,296) | | | 26,462 | |
| | | | | | | | | | | | | | | | | |
| Management fees—related party | — | | | — | | | 31,848 | | | — | | | 31,848 | | | — | | | 31,848 | | | (31,848) | | | — | |
| Total costs and expenses | 9,011 | | | 2,242 | | | 214,788 | | | 3,956 | | | 229,997 | | | 18,179 | | | 248,176 | | | (206,696) | | | 41,480 | |
| OTHER (EXPENSE) INCOME: | | | | | | | | | | | | | | | | | |
| | | | | | | | | | | | | | | | | |
| Interest income | — | | | 3 | | | 3,208 | | | — | | | 3,211 | | | 2,126 | | | 5,337 | | | (3,208) | | | 2,129 | |
| Interest expense | — | | | — | | | — | | | (1,108) | | | (1,108) | | | — | | | (1,108) | | | 1,108 | | | — | |
| | | | | | | | | | | | | | | | | |
| | | | | | | | | | | | | | | | | |
| | | | | | | | | | | | | | | | | |
| Miscellaneous | (41) | | | — | | | — | | | — | | | (41) | | | — | | | (41) | | | — | | | (41) | |
| Total other (expense) income | (41) | | | 3 | | | 3,208 | | | (1,108) | | | 2,062 | | | 2,126 | | | 4,188 | | | (2,100) | | | 2,088 | |
| EQUITY IN EARNINGS FROM UNCONSOLIDATED ENTITIES | 359 | | | — | | | 1,236 | | | — | | | 1,595 | | | — | | | 1,595 | | | 51,581 | | | 53,176 | |
| SEGMENT (LOSS) PROFIT/INCOME BEFORE INCOME TAX PROVISION | (6,977) | | | (1,915) | | | 183,651 | | | (678) | | | 174,081 | | | (16,053) | | | 158,028 | | | (117,194) | | | 40,834 | |
| INCOME TAX PROVISION | — | | | — | | | — | | | — | | | — | | | (13) | | | (13) | | | — | | | (13) | |
| SEGMENT (LOSS) PROFIT/NET INCOME | $ | (6,977) | | | $ | (1,915) | | | $ | 183,651 | | | $ | (678) | | | $ | 174,081 | | | $ | (16,066) | | | $ | 158,015 | | | $ | (117,194) | | | $ | 40,821 | |
(1) Represents the removal of the Great Park Venture and Gateway Commercial Venture operating results, which are included in the Great Park segment and Commercial segment operating results at 100% of each venture’s historical basis, respectively, but are not included in our consolidated results as we account for our investment in each venture using the equity method of accounting.
(2) For the Great Park and Commercial segments, represents the revenues and expenses attributable to the management company for providing services to the Great Park Venture and the Gateway Commercial Venture, as applicable.
Valencia Segment
Our Valencia property consists of approximately 15,000 acres in northern Los Angeles County and can include up to approximately 21,500 homesites and approximately 11.5 million square feet of commercial space. The actual commercial square footage and number of homesites are subject to change based on ultimate use and land planning. The current communities under development in Valencia complement the neighboring communities that were previously developed by us. We began selling homesites in the first development area at Valencia in 2019.
Three Months Ended June 30, 2024 and 2023
Selling, general, and administrative. SG&A expenses decreased by $0.9 million, or 25.9%, to $2.5 million for the three months ended June 30, 2024, from $3.4 million for the three months ended June 30, 2023. The decrease was mainly attributable to a decrease in community related selling and marketing expenses.
Six Months Ended June 30, 2024 and 2023
Selling, general, and administrative. SG&A expenses decreased by $0.3 million, or 5.5%, to $5.7 million for the six months ended June 30, 2024, from $6.0 million for the six months ended June 30, 2023. The decrease was mainly attributable to a decrease in community related selling and marketing expenses and a decrease in lease expense.
San Francisco Segment
Located almost equidistant between downtown San Francisco and the San Francisco International Airport, Candlestick and The San Francisco Shipyard consist of approximately 800 acres of bayfront property in the City of San Francisco. Candlestick and The San Francisco Shipyard can include up to approximately 12,000 homesites and approximately 6.3 million square feet of commercial space. The actual commercial square footage and number of homesites are subject to change based on ultimate use and land planning.
In October 2019, we received approval from the City of San Francisco on a revised development plan for the first phase of Candlestick that is currently planned to include up to approximately 750,000 square feet of office space, 1,600 homes, and 300,000 square feet of lifestyle amenities centered around retail and entertainment. As currently planned, Candlestick ultimately is expected to include up to approximately 7,000 homes.
Our development at Candlestick and The San Francisco Shipyard is not subject to San Francisco’s Proposition M growth control measure, which imposes annual limitations on office development and is applicable to all other developers with projects in the city. This means the full amount of permitted commercial square footage at Candlestick and The San Francisco Shipyard can be constructed as we determine, including all at once, even though Proposition M may delay new office developments elsewhere in San Francisco. In 2018, our disposition and development agreement with the City of San Francisco was amended to increase the total amount of commercial use at Candlestick and The San Francisco Shipyard by over two million square feet and to increase our total commercial space to approximately 6.3 million square feet.
At The San Francisco Shipyard, approximately 408 acres are still owned by the U.S. Navy and will not be conveyed to us until the U.S. Navy satisfactorily completes its finding of suitability to transfer, or “FOST,” process, which involves multiple levels of environmental and governmental investigation, analysis, review, comment and approval. Based on our discussions with the U.S. Navy, we had previously expected the U.S. Navy to deliver this property between 2019 and 2022. However, allegations that Tetra Tech, Inc. and Tetra Tech EC, Inc. (collectively, “Tetra Tech”), contractors hired by the U.S. Navy, misrepresented sampling results at The San Francisco Shipyard have resulted in data reevaluation, governmental investigations, criminal proceedings, lawsuits, and a determination by the U.S. Navy and other regulatory agencies to undertake additional sampling. As part of the 2018 Congressional spending bill, the U.S. Department of Defense allocated $36.0 million to help fund resampling efforts at The San Francisco Shipyard. An additional $60.4 million to fund resampling efforts was approved as part of a 2019 military construction spending bill. These activities have delayed the remaining land transfers from the U.S. Navy and could lead to additional legal claims or government investigations, all of which could in turn further delay or impede our future development of such parcels. Our development plans were designed with the flexibility to adjust for potential land transfer delays, and we have the ability to shift the phasing of our development activities to account for potential delays caused by U.S. Navy retesting, but there can be no assurance that these matters and other related matters that may arise in the future will not materially impact our development plans.
We have been, and may in the future be, named as a defendant in lawsuits seeking damages and other relief arising out of alleged contamination at The San Francisco Shipyard and Tetra Tech’s alleged misrepresentations of related sampling work. See Note 11 to our condensed consolidated financial statements included under Part I, Item 1 of this report.
Great Park Segment
We have a 37.5% percentage interest in the Great Park Venture, and we account for our investment using the equity method of accounting. We have a controlling interest in the management company, an entity which performs development management services at Great Park Neighborhoods. We do not include the Great Park Venture as a consolidated subsidiary in our condensed consolidated financial statements. However, because of the relationship between the management company and the Great Park Venture, we assess our investment in the Great Park Venture based on the financial information for the Great Park Venture in its entirety, and not just our equity interest in it. As a result, our Great Park segment consists of the operations of both the Great Park Venture and the development management services provided by the management company at the Great Park Venture.
Great Park Neighborhoods consists of approximately 2,100 acres in Orange County and is being built around the approximately 1,300 acre Orange County Great Park, a metropolitan public park that is under construction. Great Park Neighborhoods can include up to approximately 10,500 homesites and approximately 4.9 million square feet of commercial space. The actual commercial square footage and number of homesites are subject to change based on ultimate use and land planning.
Interests in the Great Park Venture are either “percentage interests” or “legacy interests.” Holders of the legacy interests were entitled to receive priority distributions in an aggregate amount equal to $476.0 million and up to an additional $89.0 million from participation in subsequent distributions. The holders of percentage interests are entitled to all other distributions. During the six months ended June 30, 2024, the Great Park Venture made aggregate distributions of $14.8 million to holders of legacy interests and $126.2 million to holders of percentage interests. We received $47.3 million for our 37.5% percentage interest. As of December 31, 2021, the Great Park Venture had fully satisfied the $476.0 million priority distribution rights, and the remaining maximum participating legacy interest distribution rights at June 30, 2024 were $3.3 million. The remaining $3.3 million legacy interest will be paid on a pro-rata basis, with approximately 10% of future distributions paid to the holders of legacy interests and approximately 90% of such distributions paid to the holders of the percentage interests, until such time as the remaining balance has been fully paid.
Three Months Ended June 30, 2024 and 2023
Land sales and related party land sales revenues. Land sales and related party land sales revenues decreased to $139.4 million for the three months ended June 30, 2024, from $360.6 million for the three months ended June 30, 2023. The decrease was primarily attributable to the recognition of revenue from the sale of land at the Great Park Neighborhoods entitled for an aggregate of 105 homesites on 12.3 acres during the three months ended June 30, 2024, compared to the recognition of revenue from the sale of land at the Great Park Neighborhoods entitled for an aggregate of 798 homesites on approximately 84 acres during the three months ended June 30, 2023. The base purchase price was $96.1 million for the 2024 land sales. Revenue recognized of $357.8 million for the 2023 land sale consisted of $214.7 million paid at closing, plus $143.1 million in estimated variable consideration from future price participation payments expected to be received when homes are sold to homebuyers. The 798 homesites were sold to an unaffiliated land banking entity whereby a related party retained the option to acquire the homesites in the future from the land bank entity.
During the three months ended June 30, 2024 and 2023, revenues also included changes in estimates of variable consideration, including profit participation and price participation, from those amounts previously recorded by the Great Park Venture. During the three months ended June 30, 2024 and 2023, the Great Park Venture recognized $6.4 million and $2.6 million, respectively, in profit participation revenues received from homebuilders. During the three months ended June 30, 2024, the Great Park Venture recognized additional estimated variable consideration of $36.6 million related to prior period land sales for future price participation payments expected to be received when homes are sold to homebuyers. The increase in estimated variable consideration reflects updated pricing and absorption assumptions used to calculate expected price participation payments.
Cost of land sales. Cost of land sales for the three months ended June 30, 2024 was $29.0 million, compared to $165.7 million for the three months ended June 30, 2023. The cost of land sales includes both actual and estimated future capitalized costs allocated based upon relative sales values. Since this method requires the Great Park Venture to estimate future development costs and the expected sales prices for future land sales, the profit margin on subsequent parcels sold will be affected by both changes in the estimated total revenues, as well as any changes in the estimated total cost of the project.
Management fee revenues. Management fee revenues are revenues generated by the management company from development management services provided to the Great Park Venture. The increase in management services related party revenue was mainly attributable to an increase in variable incentive compensation revenue recognized during the three months ended June 30, 2024. For the three months ended June 30, 2024 and 2023, we recognized $47.2 million and $17.7 million, respectively, attributable to variable incentive compensation, mostly as a result of changes in estimates of the amount of variable incentive compensation we expect to receive.
Management services costs and expenses. Included within management services costs and expenses are general and administrative costs and expenses incurred by the management company’s project team that is managing the development of the Great Park Neighborhoods. We also include amortization expense related to the intangible asset attributable to the incentive compensation provisions of the development management agreement with the Great Park Venture within management services costs and expenses. Corporate and non-project team salaries and overhead are not allocated to management services costs and expenses or to our reportable segments and are reported in selling, general, and administrative costs in the condensed consolidated statements of operations. Management services costs and expenses increased by $1.6 million, or 16.9%, to $11.3 million for the three months ended June 30, 2024, from $9.7 million for the three months ended June 30, 2023. The increase was mainly attributable to an increase in intangible asset amortization expense recognized during the three months ended June 30, 2024.
Selling, general, and administrative. SG&A expenses increased by $0.8 million, or 44.6%, to $2.6 million for the three months ended June 30, 2024, from $1.8 million for the three months ended June 30, 2023. The increase was mainly attributable to an increase in marketing expenses.
Management fees—related party. Management fees increased by $37.1 million to $64.5 million for the three months ended June 30, 2024, from $27.4 million for the three months ended June 30, 2023. Management fees incurred by the Great Park Venture are comprised of base development management fees and incentive compensation fees. In general, incentive compensation fees will be paid based on a percentage of distributions made to holders of the Great Park Venture’s membership interests. When payments are deemed probable of being made, the Great Park Venture recognizes the expense ratably over the period services are expected to be provided. When estimates of the amount of incentive compensation probable of being paid change, the Great Park Venture records a cumulative adjustment in the period in which the estimate changes. The increase in management fees—related party was mainly attributable to a change in the estimate of the amount of incentive compensation fees probable of being paid that resulted in a cumulative adjustment recognized during the three months ended June 30, 2024.
Six Months Ended June 30, 2024 and 2023
Land sales and related party land sales revenues. Land sales and related party land sales revenues decreased to $232.1 million for the six months ended June 30, 2024, from $369.2 million for the six months ended June 30, 2023. The decrease was primarily attributable to the recognition of revenue from the sale of land at the Great Park Neighborhoods entitled for an aggregate of 187 homesites on 23.9 acres during the six months ended June 30, 2024, compared to the recognition of revenue from the sale of land at the Great Park Neighborhoods entitled for an aggregate of 798 homesites on approximately 84 acres during the six months ended June 30, 2023. The base purchase price was $170.7 million for the 2024 land sales. Revenue recognized of $357.8 million for the 2023 land sale consisted of $214.7 million paid at closing, plus $143.1 million in estimated variable consideration from future price participation payments expected to be received when homes are sold to homebuyers. The 798 homesites were sold to an unaffiliated land banking entity whereby a related party retained the option to acquire the homesites in the future from the land bank entity.
During the six months ended June 30, 2024 and 2023, revenues also included changes in estimates of variable consideration, including profit participation and price participation, from those amounts previously recorded by the Great Park Venture. During the six months ended June 30, 2024 and 2023, the Great Park Venture recognized $24.0 million and $10.8 million, respectively, in profit participation revenues received from homebuilders. During the six months ended June 30, 2024, the Great Park Venture recognized additional estimated variable consideration of $36.6 million related to prior period land sales for future price participation payments expected to be received when homes are sold to homebuyers. The increase in estimated variable consideration reflects updated pricing and absorption assumptions used to calculate expected price participation payments.
Cost of land sales. Cost of land sales for the six months ended June 30, 2024 was $59.0 million, compared to $165.7 million for the six months ended June 30, 2023. The cost of land sales includes both actual and estimated future capitalized costs allocated based upon relative sales values. Since this method requires the Great Park Venture to estimate future development costs and the expected sales prices for future land sales, the profit margin on subsequent parcels sold will be affected by both changes in the estimated total revenues, as well as any changes in the estimated total cost of the project.
Management fee revenues. Management fee revenues are revenues generated by the management company from development management services provided to the Great Park Venture. The increase in management services related party revenue was mainly attributable to an increase in variable incentive compensation revenue recognized during the six months ended June 30, 2024. For the six months ended June 30, 2024 and 2023, we recognized $52.8 million and $18.8 million, respectively, attributable to variable incentive compensation, mostly as a result of changes in estimates of the amount of variable incentive compensation we expect to receive.
Management services costs and expenses. Included within management services costs and expenses are general and administrative costs and expenses incurred by the management company’s project team that is managing the development of the Great Park Neighborhoods. We also include amortization expense related to the intangible asset attributable to the incentive compensation provisions of the development management agreement with the Great Park Venture within management services costs and expenses. Corporate and non-project team salaries and overhead are not allocated to management services costs and expenses or to our reportable segments and are reported in selling, general, and administrative costs in the condensed consolidated statements of operations. Management services costs and expenses increased by $3.2 million, or 26.3%, to $15.2 million for the six months ended June 30, 2024, from $12.0 million for the six months ended June 30, 2023. The increase was mainly attributable to an increase in intangible asset amortization expense recognized during the six months ended June 30, 2024.
Selling, general, and administrative. SG&A expenses increased by $0.4 million, or 8.2%, to $5.6 million for the six months ended June 30, 2024, from $5.1 million for the six months ended June 30, 2023. The increase was mainly attributable to an increase in marketing expenses.
Management fees—related party. Management fees increased by $40.8 million to $72.6 million for the six months ended June 30, 2024, from $31.8 million for the six months ended June 30, 2023. Management fees incurred by the Great Park Venture are comprised of base development management fees and incentive compensation fees. In general, incentive compensation fees will be paid based on a percentage of distributions made to holders of the Great Park Venture’s membership interests. When payments are deemed probable of being made, the Great Park Venture recognizes the expense ratably over the period services are expected to be provided. When estimates of the amount of incentive compensation probable of being paid change, the Great Park Venture records a cumulative adjustment in the period in which the estimate changes. The increase in management fees—related party was mainly attributable to a change in the estimate of the amount of incentive compensation fees probable of being paid that resulted in a cumulative adjustment recognized during the six months ended June 30, 2024.
The table below reconciles the Great Park segment results to the equity in earnings from our investment in the Great Park Venture that is reflected in the condensed consolidated statements of operations for the three and six months ended June 30, 2024 and 2023. | | | | | | | | | | | | | | | | | | | | | | | |
| Three Months Ended June 30, | | Six Months Ended June 30, |
| 2024 | | 2023 | | 2024 | | 2023 |
| (in thousands) |
| Segment profit from operations | $ | 83,768 | | | $ | 179,145 | | | $ | 141,614 | | | $ | 183,651 | |
Less net income of management company attributed to the Great Park segment | 38,836 | | | 10,988 | | | 43,553 | | | 12,751 | |
| Net income of the Great Park Venture | 44,932 | | | 168,157 | | | 98,061 | | | 170,900 | |
| The Company’s share of net income of the Great Park Venture | 16,850 | | | 63,059 | | | 36,773 | | | 64,088 | |
| Basis difference amortization, net | (1,377) | | | (10,737) | | | (3,643) | | | (10,604) | |
| | | | | | | |
| Equity in earnings from the Great Park Venture | $ | 15,473 | | | $ | 52,322 | | | $ | 33,130 | | | $ | 53,484 | |
Commercial Segment
We have a 75% interest in the Gateway Commercial Venture that is held through a wholly owned subsidiary of the operating company, and we serve as the manager of the Gateway Commercial Venture. However, the manager’s authority is limited. Major decisions by the Gateway Commercial Venture generally require unanimous approval by an executive committee composed of two people designated by us and two people designated by another investor. Some decisions require approval by all of the members of the Gateway Commercial Venture. We do not include the Gateway Commercial Venture as a consolidated subsidiary in our condensed consolidated financial statements. However, as a result of our 75% economic interest and our role as manager, we assess our investment in the Gateway Commercial Venture based on the financial information of the Gateway Commercial Venture in its entirety, and we include the Gateway Commercial Venture’s financial results within the Commercial segment. Additionally, the management company has been engaged by the Gateway Commercial Venture to provide property management services to the Five Point Gateway Campus. We include the management company’s results of operations related to these property management services within the Commercial segment.
The Five Point Gateway Campus is a commercial campus consisting of approximately 73 acres of land in the Great Park Neighborhoods acquired by the Gateway Commercial Venture in 2017. The Five Point Gateway Campus currently includes approximately one million square feet planned for research and development, medical and office space in four buildings. In 2020, the Gateway Commercial Venture sold three of the buildings and approximately 11 acres of land at the campus. Our corporate headquarters are located in the fourth building, which remains owned by the Gateway Commercial Venture. In addition to the fourth building, the Gateway Commercial Venture owns approximately 50 acres of commercial land with additional development rights at the campus.
The table below reconciles the Commercial segment results to the equity in loss from our investment in the Gateway Commercial Venture that is reflected in the condensed consolidated statements of operations for the three and six months ended June 30, 2024 and 2023. | | | | | | | | | | | | | | | | | | | | | | | |
| Three Months Ended June 30, | | Six Months Ended June 30, |
| 2024 | | 2023 | | 2024 | | 2023 |
| (in thousands) |
| Segment loss from operations | $ | (162) | | | $ | (502) | | | $ | (165) | | | $ | (678) | |
Less net income of management company attributed to the Commercial segment | 128 | | | 104 | | | 241 | | | 211 | |
| Net loss of the Gateway Commercial Venture | (290) | | | (606) | | | (406) | | | (889) | |
| Equity in loss from the Gateway Commercial Venture | $ | (218) | | | $ | (455) | | | $ | (305) | | | $ | (667) | |
Liquidity and Capital Resources
As of June 30, 2024, we had $217.4 million of consolidated cash and cash equivalents, compared to $353.8 million at December 31, 2023. As of June 30, 2024, no funds had been drawn on and no letters of credit were outstanding on the operating company’s $125.0 million unsecured revolving credit facility.
Our short-term cash needs consist primarily of general and administrative expenses and development expenditures at Valencia and the Candlestick and The San Francisco Shipyard communities, interest payments under our senior notes and payments under a related party reimbursement obligation. In January 2024, we exchanged $623.5 million of our existing 7.875% senior notes due November 2025 for $100.0 million in cash and $523.5 million in new 10.500% initial rate senior notes due January 2028. The new senior notes due January 2028 will accrue interest at a rate of 10.500% until November 2025, at a rate of 11.000% from November 2025 to November 2026, and at a rate of 12.000% from November 2026 through the maturity date. Pursuant to a reimbursement deferral agreement, principal and interest payments under our related party reimbursement obligation are deferred through October 31, 2024.
The development stages of our communities continue to require significant cash outlays on both a short-term and long-term basis, and we expect to invest significant amounts on continued horizontal development at Valencia over the next 12 months. We manage our development activities and expenditures to coincide with projected demand for our residential and commercial land with the objective of maintaining an appropriate level of liquidity. We expect to meet our cash requirements for at least the next 12 months with available cash, distributions from our unconsolidated entities, collection of management fees under our development management agreement with the Great Park Venture, proceeds from land sales, reimbursements from public financing in Valencia and access to financing sources, including our revolving credit facility.
Our long-term cash needs relate primarily to future horizontal development expenditures and investments in or vertical construction costs for properties that we may acquire or develop for an income-producing portfolio, along with debt service and general and administrative expenses. We budget our cash development costs on an annual basis. Budgeted amounts are subject to change due to delays or accelerations in construction or regulatory approvals, changes in inflation rates and other increases (or decreases) in costs. We may also modify our development plans or change the sequencing of our communities in response to changing economic conditions, consumer preferences and other factors, which could have a material impact on the timing and amount of our development costs. Budgeted amounts are expected to be funded through a combination of available cash, cash flows from our communities and reimbursements from public financing, including community facilities districts, tax increment financing and local, state and federal grants. Cash flows from our communities may occur in uneven patterns as cash is primarily generated by land sales and reimbursements, which can occur at various points over the life cycle of our communities.
We currently expect to have sufficient capital to fund the horizontal development of our communities in accordance with our development plan for several years. The level of capital expenditures in any given year may vary due to, among other things, the number of communities or neighborhoods under development and the number of planned deliveries, which may vary based on market conditions. We may seek to raise additional capital by accessing the debt or equity capital markets or with one or more revolving or term loan facilities or other public or private financing alternatives, including entering into joint ventures. These financings may not be available on attractive terms, or at all.
We are committed under various performance bonds and letters of credit (“LOCs”) to perform certain development activities and provide certain guarantees in the normal course of the entitlement and development process.
We had outstanding performance bonds of $299.0 million as of June 30, 2024 predominantly related to our Valencia community.
At June 30, 2024, the San Francisco Venture had outstanding guarantees benefiting a municipal agency for infrastructure and construction of certain park and open space obligations with aggregate maximum obligations of $198.3 million.
Outstanding LOCs totaled $1.0 million at both June 30, 2024 and December 31, 2023. At both June 30, 2024 and December 31, 2023, we had $1.0 million in restricted cash and certificates of deposit securing certain of our LOCs. Additionally, under our revolving credit facility, we are able to utilize undrawn capacity to support the issuance of LOCs. As of June 30, 2024, no capacity under the revolving credit facility was used to support LOCs.
We are a party to a tax receivable agreement (“TRA”) with current and former holders of Class A units of the operating company and the holders of Class A units of the San Francisco Venture. The TRA provides for payments by us to such investors or their successors in aggregate amounts equal to 85% of the cash savings, if any, in income tax that we realize as a result of certain tax attributes. We expect the TRA payments to be substantial. However, the actual amount and timing of any payments under the TRA will vary depending upon a number of factors, including the timing of exchanges of Class A units of the operating company or Class A units of the San Francisco Venture, the price of our Class A common shares at the time of such exchanges, the extent to which such exchanges are taxable and our ability to use the potential tax benefits, which will depend on the amount and timing of our taxable income and the rate at which we pay income tax. As of June 30, 2024, there were no amounts currently payable under the TRA. However, as a result of California Senate Bill 167 signed into law on June 27, 2024, which, in part, suspends the usage of California net operating loss deductions for tax years 2024 through 2026, TRA payments associated with the accelerated California taxes may become payable starting in 2026 through 2028. The majority of TRA payments, however, are expected to begin after 2028.
Summary of Cash Flows
The following table outlines the primary components of net cash (used in) provided by operating, investing and financing activities (in thousands): | | | | | | | | | | | |
| Six Months Ended June 30, |
| 2024 | | 2023 |
Operating activities | $ | (49,659) | | | $ | 37,925 | |
Investing activities | 14,522 | | | 29,676 | |
Financing activities | (101,277) | | | (6,169) | |
Cash Flows from Operating Activities. Net cash used in operating activities was $49.7 million for the six months ended June 30, 2024, compared to $37.9 million net cash provided by operating activities for the six months ended June 30, 2023.
During the six months ended June 30, 2024, we received incentive compensation payments of $12.8 million under our development management agreement with the Great Park Venture. The payment is net of $1.5 million that we concurrently distributed to the holders of the management company’s Class B units. Additionally, we received total distributions of $47.3 million from the Great Park Venture, of which $33.1 million is reflected as a return on our investment (operating activity) in the statement of cash flows with the balance reflected as an investing activity.
During the six months ended June 30, 2023, we received incentive compensation payments of $22.0 million under our development management agreement with the Great Park Venture. The payment is net of $2.6 million that we concurrently distributed to the holders of the management company’s Class B units. Additionally, we received total distributions of $81.8 million from the Great Park Venture, of which $52.7 million is reflected as a return on our investment (operating activity) in the statement of cash flows with the balance reflected as an investing activity.
Major components of operating cash used in both periods consist of our continued investment in horizontal development at our communities and SG&A costs. During the six months ended June 30, 2024, we paid $8.3 million for interest accrued through the settlement date on our existing 7.875% senior notes due November 2025 that were exchanged. The exchange of $523.5 million of our existing senior notes for new senior notes was accounted for as a debt modification under ASC 470-50. Under debt modification accounting, third party costs are expensed as incurred and reported as operating cash flows. Included in operating cash outflows during the six months ended June 30, 2024 is $7.7 million in third party transaction and advisory costs incurred in connection with the senior notes exchange. During the six months ended June 30, 2024, an additional $18.2 million was paid for interest due on our existing 7.875% senior notes and new 10.500% initial rate senior notes. During the six months ended June 30, 2023, $24.6 million was paid for interest due on our existing 7.875% senior notes. Our horizontal development costs for the six months ended June 30, 2023 were partially offset by $17.7 million in public financing reimbursements for public infrastructure development costs we incurred in Valencia and a nonrecurring $44.5 million recovery from a third party related to certain project development costs in Valencia.
Cash Flows from Investing Activities. Net cash provided by investing activities was $14.5 million for the six months ended June 30, 2024, compared to $29.7 million net cash provided by investing activities for the six months ended June 30, 2023.
During the six months ended June 30, 2024, we received total distributions of $47.3 million from the Great Park Venture, of which $14.2 million is reflected as a return of our investment (investing activity) in the statement of cash flows, with the balance reflected as an operating activity. During the six months ended June 30, 2023, we received total distributions of $81.8 million from the Great Park Venture, of which $29.0 million is reflected as a return of our investment (investing activity) in the statement of cash flows with the balance reflected as an operating activity. Additionally, for the six months ended June 30, 2024 and 2023, we received a distribution of $0.8 million and $0.6 million, respectively, from the Valencia Landbank Venture, which is reflected as a return of our investment (investing activity) in the statement of cash flows.
Cash Flows from Financing Activities. Net cash used in financing activities was $101.3 million for the six months ended June 30, 2024, compared to $6.2 million net cash used in financing activities for the six months ended June 30, 2023.
During the six months ended June 30, 2024, we repaid $100.0 million of our existing 7.875% senior notes due November 2025 in connection with our exchange transaction. For the six months ended June 30, 2023, in accordance with the operating company’s limited partnership agreement, we made noncontrolling interest tax distributions of $2.0 million. We also made payments of $4.0 million to reduce our related party reimbursement obligation during the six months ended June 30, 2023. We used $0.8 million and $0.2 million during the six months ended June 30, 2024 and 2023, respectively, to net settle share-based compensation awards with employees for tax withholding purposes.
Changes in Capital Structure
During the six months ended June 30, 2024, our 62.6% ownership percentage in the operating company increased slightly primarily due to our issuance of shared-based compensation in the form of 0.2 million restricted Class A common shares and 0.3 million restricted share units that were settled for Class A common shares, partially offset by our reacquisition of approximately 0.3 million restricted Class A common shares from employees for income tax withholding purposes upon vesting. The issuances and settlements resulted in the operating company issuing to us an equal number of Class A units of the operating company or retiring an equal number of Class A units of the operating company that we previously held.
The table below summarizes outstanding Class A units of the operating company and Class A units of the San Francisco Venture (redeemable on a one-for-one basis for Class A units of the operating company) held by us and held by noncontrolling interest members at June 30, 2024 and December 31, 2023. | | | | | | | | | | | |
| June 30, 2024 | | December 31, 2023 |
| Class A units of the operating company: | | | |
| Held by us | 69,358,504 | | | 69,199,938 | |
| Held by noncontrolling interest members | 41,363,271 | | | 41,363,271 | |
| 110,721,775 | | | 110,563,209 | |
| Class A units of the San Francisco Venture held by noncontrolling interest members | 37,870,273 | | | 37,870,273 | |
| 148,592,048 | | | 148,433,482 | |
At June 30, 2024, we had 79,233,544 Class B common shares outstanding that were held by the noncontrolling interest members of the operating company and the Class A unitholders of the San Francisco Venture. The Class B common shares will automatically convert to Class A common shares at a ratio of 0.0003 Class A common shares for each Class B common share. The conversions will occur when the holders of Class A units of the operating company, including Class A units that have been issued upon redemption of Class A units of the San Francisco Venture, are redeemed at our election for our Class A common shares or cash.
Critical Accounting Estimates
There have been no significant changes to our critical accounting estimates during the six months ended June 30, 2024 as compared to those disclosed in Item 7, “Management’s Discussion and Analysis of Financial Condition and Results of Operations,” which is presented in our Annual Report on Form 10-K for the fiscal year ended December 31, 2023.
ITEM 3. Quantitative and Qualitative Disclosures About Market Risk
Market risk is the risk of loss from adverse changes in market prices and interest rates. Our future earnings, cash flows and fair values relative to financial instruments are dependent upon prevailing market interest rates. Our primary market risk results from our indebtedness, which bears interest at fixed rates. Although we do not currently do so, we may in the future manage our market risk on floating rate debt by entering into swap arrangements to in effect fix the rate on all or a portion of the debt for varying periods up to maturity. This would, in turn, reduce the risks of variability of cash flows created by floating rate debt and mitigate the risk of increases in interest rates. Our objective when undertaking such arrangements would be to reduce our floating rate exposure, as we do not plan to enter into hedging arrangements for speculative purposes.
As of June 30, 2024, we had outstanding consolidated net indebtedness of $524.1 million, none of which bears interest based on floating interest rates.
We have not entered into any transactions using derivative financial instruments or derivative commodity instruments.
ITEM 4. Controls and Procedures
Evaluation of Disclosure Controls and Procedures
Our management, with the supervision and participation of our Chief Executive Officer and our Chief Financial Officer (the “Certifying Officers”), has evaluated the effectiveness of the design and operation of our disclosure controls and procedures as of June 30, 2024. Our disclosure controls and procedures are designed to ensure that information required to be disclosed in the reports we file or submit under the Securities Exchange Act of 1934, as amended (the “Exchange Act”), is recorded, processed, summarized and reported within the time periods specified in the Securities and Exchange Commission rules and forms and that such information is accumulated and communicated to management, including our Certifying Officers and our Board of Directors, as appropriate to allow timely decisions regarding required disclosure. Based upon that evaluation, the Certifying Officers concluded that our disclosure controls and procedures were effective as of June 30, 2024.
Changes in Internal Control Over Financial Reporting
There were no changes in our internal control over financial reporting identified in management’s evaluation pursuant to Rules 13a-15(d) or 15d-15(d) of the Exchange Act during the period covered by this report on Form 10-Q that materially affected, or are reasonably likely to materially affect, our internal control over financial reporting.
PART II. OTHER INFORMATION
ITEM 1. Legal Proceedings
For disclosures of legal proceedings, see Note 11 to our condensed consolidated financial statements included under Part I, Item 1 of this report, which is incorporated herein by reference.
ITEM 1A. Risk Factors
In addition to the other information set forth in this report, you should carefully consider the factors discussed in “Part I, Item 1A, Risk Factors” in our Annual Report on Form 10-K for the year ended December 31, 2023, which could materially affect our business, financial condition and results of operations. There have been no material changes in our risk factors from those disclosed in our Annual Report on Form 10-K for the year ended December 31, 2023. The risks described in our Annual Report on Form 10-K are not the only risks facing our company. Additional risks and uncertainties not currently known to us or that we currently deem to be immaterial may also materially adversely affect our business, financial condition and results of operations.
ITEM 2. Unregistered Sales of Equity Securities and Use of Proceeds
None
ITEM 3. Defaults Upon Senior Securities
None
ITEM 4. Mine Safety Disclosures
Not Applicable
ITEM 5. Other Information
None
ITEM 6. Exhibits
| | | | | |
| Exhibit | Exhibit Description |
| |
| 10.1 | First Amendment to Amended and Restated Credit Agreement, dated as of May 22, 2024, by and among Five Point Operating Company, LP, Zions Bancorporation, N.A. dba California Bank & Trust, as administrative agent and as a lender, and Comerica Bank, JPMorgan Chase Bank, N.A. and Citibank, N.A., as lenders (Exhibit 10.1 to the Current Report on Form 8-K filed on May 24, 2024 is incorporated herein by this reference). |
| |
31.1* | |
| |
31.2* | |
| |
32.1* | |
| |
32.2* | |
| |
| 101.INS | Inline XBRL Instance Document - the instance document does not appear in the Interactive Data File because XBRL tags are embedded within the Inline XBRL document. |
| |
| 101.SCH | Inline XBRL Taxonomy Extension Schema Document. |
| |
| 101.CAL | Inline XBRL Taxonomy Extension Calculation Linkbase Document. |
| |
| 101.DEF | Inline XBRL Taxonomy Extension Definition Linkbase Document. |
| |
| 101.LAB | Inline XBRL Taxonomy Extension Label Linkbase Document. |
| |
| 101.PRE | Inline XBRL Taxonomy Extension Presentation Linkbase Document. |
| |
| 104 | Cover Page Interactive Data File (formatted as Inline XBRL and contained in Exhibit 101). |
* Filed herewith
SIGNATURES
Pursuant to the requirements of the Securities Exchange Act of 1934, the registrant has duly caused this report to be signed on its behalf by the undersigned thereunto duly authorized.
| | | | | | | | |
| FIVE POINT HOLDINGS, LLC |
|
By: | /s/ Daniel Hedigan |
| Daniel Hedigan |
| Chief Executive Officer |
| (Principal Executive Officer) |
| |
|
By: | /s/ Kim Tobler |
| Kim Tobler |
| Chief Financial Officer, Treasurer and Vice President |
| (Principal Financial Officer and Principal Accounting Officer) |
Date: July 19, 2024
Exhibit 31.1
CERTIFICATION PURSUANT TO
RULES 13a14(a) AND 15d14(a) UNDER THE SECURITIES EXCHANGE ACT OF 1934,
AS ADOPTED PURSUANT TO SECTION 302 OF THE SARBANES-OXLEY ACT OF 2002
I, Daniel Hedigan, certify that:
1. I have reviewed this quarterly report on Form 10-Q of Five Point Holdings, LLC;
2. Based on my knowledge, this report does not contain any untrue statement of a material fact or omit to state a material fact necessary to make the statements made, in light of the circumstances under which such statements were made, not misleading with respect to the period covered by this report;
3. Based on my knowledge, the financial statements, and other financial information included in this report, fairly present in all material respects the financial condition, results of operations and cash flows of the registrant as of, and for, the periods presented in this report;
4. The registrant’s other certifying officer and I are responsible for establishing and maintaining disclosure controls and procedures (as defined in Exchange Act Rules 13a15(e) and 15d15(e)) and internal control over financial reporting (as defined in Exchange Act Rules 13a-15(f) and 15d-15(f)) for the registrant and have:
(a)Designed such disclosure controls and procedures, or caused such disclosure controls and procedures to be designed under our supervision, to ensure that material information relating to the registrant, including its consolidated subsidiaries, is made known to us by others within those entities, particularly during the period in which this report is being prepared;
(b)Designed such internal control over financial reporting, or caused such internal control over financial reporting to be designed under our supervision, to provide reasonable assurance regarding the reliability of financial reporting and the preparation of financial statements for external purposes in accordance with generally accepted accounting principles;
(c)Evaluated the effectiveness of the registrant’s disclosure controls and procedures and presented in this report our conclusions about the effectiveness of the disclosure controls and procedures, as of the end of the period covered by this report based on such evaluation; and
(d)Disclosed in this report any change in the registrant’s internal control over financial reporting that occurred during the registrant’s most recent fiscal quarter (the registrant’s fourth fiscal quarter in the case of an annual report) that has materially affected, or is reasonably likely to materially affect, the registrant’s internal control over financial reporting; and
5. The registrant’s other certifying officer and I have disclosed, based on our most recent evaluation of internal control over financial reporting, to the registrant’s auditors and the audit committee of the registrant’s board of directors (or persons performing the equivalent functions):
(a)All significant deficiencies and material weaknesses in the design or operation of internal control over financial reporting which are reasonably likely to adversely affect the registrant’s ability to record, process, summarize and report financial information; and
(b)Any fraud, whether or not material, that involves management or other employees who have a significant role in the registrant’s internal control over financial reporting.
| | | | | | | | | | | |
| Date: July 19, 2024 | | /s/ Daniel Hedigan | |
| | Daniel Hedigan | |
| | Chief Executive Officer | |
| | (Principal Executive Officer) | |
Exhibit 31.2
CERTIFICATION PURSUANT TO
RULES 13a14(a) AND 15d14(a) UNDER THE SECURITIES EXCHANGE ACT OF 1934,
AS ADOPTED PURSUANT TO SECTION 302 OF THE SARBANES-OXLEY ACT OF 2002
I, Kim Tobler, certify that:
1. I have reviewed this quarterly report on Form 10-Q of Five Point Holdings, LLC;
2. Based on my knowledge, this report does not contain any untrue statement of a material fact or omit to state a material fact necessary to make the statements made, in light of the circumstances under which such statements were made, not misleading with respect to the period covered by this report;
3. Based on my knowledge, the financial statements, and other financial information included in this report, fairly present in all material respects the financial condition, results of operations and cash flows of the registrant as of, and for, the periods presented in this report;
4. The registrant’s other certifying officer and I are responsible for establishing and maintaining disclosure controls and procedures (as defined in Exchange Act Rules 13a15(e) and 15d15(e)) and internal control over financial reporting (as defined in Exchange Act Rules 13a-15(f) and 15d-15(f)) for the registrant and have:
(a)Designed such disclosure controls and procedures, or caused such disclosure controls and procedures to be designed under our supervision, to ensure that material information relating to the registrant, including its consolidated subsidiaries, is made known to us by others within those entities, particularly during the period in which this report is being prepared;
(b)Designed such internal control over financial reporting, or caused such internal control over financial reporting to be designed under our supervision, to provide reasonable assurance regarding the reliability of financial reporting and the preparation of financial statements for external purposes in accordance with generally accepted accounting principles;
(c)Evaluated the effectiveness of the registrant’s disclosure controls and procedures and presented in this report our conclusions about the effectiveness of the disclosure controls and procedures, as of the end of the period covered by this report based on such evaluation; and
(d)Disclosed in this report any change in the registrant’s internal control over financial reporting that occurred during the registrant’s most recent fiscal quarter (the registrant’s fourth fiscal quarter in the case of an annual report) that has materially affected, or is reasonably likely to materially affect, the registrant’s internal control over financial reporting; and
5. The registrant’s other certifying officer and I have disclosed, based on our most recent evaluation of internal control over financial reporting, to the registrant’s auditors and the audit committee of the registrant’s board of directors (or persons performing the equivalent functions):
(a)All significant deficiencies and material weaknesses in the design or operation of internal control over financial reporting which are reasonably likely to adversely affect the registrant’s ability to record, process, summarize and report financial information; and
(b)Any fraud, whether or not material, that involves management or other employees who have a significant role in the registrant’s internal control over financial reporting.
| | | | | | | | | | | |
| Date: July 19, 2024 | | /s/ Kim Tobler | |
| | Kim Tobler | |
| | Chief Financial Officer, Treasurer and Vice President | |
| | (Principal Financial and Accounting Officer) | |
Exhibit 32.1
CERTIFICATION PURSUANT TO
18 U.S.C. SECTION 1350, AS ADOPTED PURSUANT TO
SECTION 906 OF THE SARBANES-OXLEY ACT OF 2002
In connection with the Quarterly Report of Five Point Holdings, LLC (the “Company”) on Form 10-Q for the period ended June 30, 2024 as filed with the Securities and Exchange Commission on the date hereof (the “Report”), the undersigned certifies, pursuant to 18 U.S.C. § 1350, as adopted pursuant to § 906 of the Sarbanes-Oxley Act of 2002, that to the best of his knowledge:
| | | | | | | | |
| (1) | The Report fully complies with the requirements of section 13(a) or 15(d) of the Securities Exchange Act of 1934; and |
| | | | | | | | |
| (2) | The information contained in the Report fairly presents, in all material respects, the financial condition and results of operations of the Company. |
| | | | | | | | | | | | | | |
| Date: | July 19, 2024 | | | /s/ Daniel Hedigan |
| | | | Daniel Hedigan |
| | | | Chief Executive Officer (Principal Executive Officer) |
A signed original of this written statement as required by Section 906 has been provided to the Company and will be retained by the Company and furnished to the Securities and Exchange Commission or its staff upon request.
Exhibit 32.2
CERTIFICATION PURSUANT TO
18 U.S.C. SECTION 1350, AS ADOPTED PURSUANT TO
SECTION 906 OF THE SARBANES-OXLEY ACT OF 2002
In connection with the Quarterly Report of Five Point Holdings, LLC (the “Company”) on Form 10-Q for the period ended June 30, 2024 as filed with the Securities and Exchange Commission on the date hereof (the “Report”), the undersigned certifies, pursuant to 18 U.S.C. § 1350, as adopted pursuant to § 906 of the Sarbanes-Oxley Act of 2002, that to the best of his knowledge:
| | | | | | | | |
| (1) | The Report fully complies with the requirements of section 13(a) or 15(d) of the Securities Exchange Act of 1934; and |
| | | | | | | | |
| (2) | The information contained in the Report fairly presents, in all material respects, the financial condition and results of operations of the Company. |
| | | | | | | | | | | | | | |
| Date: | July 19, 2024 | | | /s/ Kim Tobler |
| | | | Kim Tobler |
| | | | Chief Financial Officer, Treasurer and Vice President (Principal Financial and Accounting Officer) |
A signed original of this written statement as required by Section 906 has been provided to the Company and will be retained by the Company and furnished to the Securities and Exchange Commission or its staff upon request.
v3.24.2
Cover Page - shares
|
6 Months Ended |
|
Jun. 30, 2024 |
Jul. 12, 2024 |
| Entity Information [Line Items] |
|
|
| Document Type |
10-Q
|
|
| Document Quarterly Report |
true
|
|
| Document Period End Date |
Jun. 30, 2024
|
|
| Document Transition Report |
false
|
|
| Entity File Number |
001-38088
|
|
| Entity Registrant Name |
Five Point Holdings, LLC
|
|
| Entity Incorporation, State or Country Code |
DE
|
|
| Entity Tax Identification Number |
27-0599397
|
|
| Entity Address, Address Line One |
2000 FivePoint
|
|
| Entity Address, Address Line Two |
4th Floor
|
|
| Entity Address, City or Town |
Irvine
|
|
| Entity Address, State or Province |
CA
|
|
| Entity Address, Postal Zip Code |
92618
|
|
| City Area Code |
949
|
|
| Local Phone Number |
349-1000
|
|
| Title of 12(b) Security |
Class A common shares
|
|
| Trading Symbol |
FPH
|
|
| Security Exchange Name |
NYSE
|
|
| Entity Current Reporting Status |
Yes
|
|
| Entity Interactive Data Current |
Yes
|
|
| Entity Filer Category |
Non-accelerated Filer
|
|
| Entity Small Business |
true
|
|
| Entity Emerging Growth Company |
false
|
|
| Entity Shell Company |
false
|
|
| Amendment Flag |
false
|
|
| Document Fiscal Year Focus |
2024
|
|
| Document Fiscal Period Focus |
Q2
|
|
| Entity Central Index Key |
0001574197
|
|
| Current Fiscal Year End Date |
--12-31
|
|
| Common Class A |
|
|
| Entity Information [Line Items] |
|
|
| Entity Common Stock, Shares Outstanding |
|
69,358,504
|
| Common Class B |
|
|
| Entity Information [Line Items] |
|
|
| Entity Common Stock, Shares Outstanding |
|
79,233,544
|
| X |
- DefinitionBoolean flag that is true when the XBRL content amends previously-filed or accepted submission.
| Name: |
dei_AmendmentFlag |
| Namespace Prefix: |
dei_ |
| Data Type: |
xbrli:booleanItemType |
| Balance Type: |
na |
| Period Type: |
duration |
|
| X |
- DefinitionEnd date of current fiscal year in the format --MM-DD.
| Name: |
dei_CurrentFiscalYearEndDate |
| Namespace Prefix: |
dei_ |
| Data Type: |
xbrli:gMonthDayItemType |
| Balance Type: |
na |
| Period Type: |
duration |
|
| X |
- DefinitionFiscal period values are FY, Q1, Q2, and Q3. 1st, 2nd and 3rd quarter 10-Q or 10-QT statements have value Q1, Q2, and Q3 respectively, with 10-K, 10-KT or other fiscal year statements having FY.
| Name: |
dei_DocumentFiscalPeriodFocus |
| Namespace Prefix: |
dei_ |
| Data Type: |
dei:fiscalPeriodItemType |
| Balance Type: |
na |
| Period Type: |
duration |
|
| X |
- DefinitionThis is focus fiscal year of the document report in YYYY format. For a 2006 annual report, which may also provide financial information from prior periods, fiscal 2006 should be given as the fiscal year focus. Example: 2006.
| Name: |
dei_DocumentFiscalYearFocus |
| Namespace Prefix: |
dei_ |
| Data Type: |
xbrli:gYearItemType |
| Balance Type: |
na |
| Period Type: |
duration |
|
| X |
- DefinitionFor the EDGAR submission types of Form 8-K: the date of the report, the date of the earliest event reported; for the EDGAR submission types of Form N-1A: the filing date; for all other submission types: the end of the reporting or transition period. The format of the date is YYYY-MM-DD.
| Name: |
dei_DocumentPeriodEndDate |
| Namespace Prefix: |
dei_ |
| Data Type: |
xbrli:dateItemType |
| Balance Type: |
na |
| Period Type: |
duration |
|
| X |
- DefinitionBoolean flag that is true only for a form used as an quarterly report. Reference 1: http://www.xbrl.org/2003/role/presentationRef
-Publisher SEC
-Name Form 10-Q
-Number 240
-Section 308
-Subsection a
| Name: |
dei_DocumentQuarterlyReport |
| Namespace Prefix: |
dei_ |
| Data Type: |
xbrli:booleanItemType |
| Balance Type: |
na |
| Period Type: |
duration |
|
| X |
- DefinitionBoolean flag that is true only for a form used as a transition report. Reference 1: http://www.xbrl.org/2003/role/presentationRef
-Publisher SEC
-Name Forms 10-K, 10-Q, 20-F
-Number 240
-Section 13
-Subsection a-1
| Name: |
dei_DocumentTransitionReport |
| Namespace Prefix: |
dei_ |
| Data Type: |
xbrli:booleanItemType |
| Balance Type: |
na |
| Period Type: |
duration |
|
| X |
- DefinitionThe type of document being provided (such as 10-K, 10-Q, 485BPOS, etc). The document type is limited to the same value as the supporting SEC submission type, or the word 'Other'.
| Name: |
dei_DocumentType |
| Namespace Prefix: |
dei_ |
| Data Type: |
dei:submissionTypeItemType |
| Balance Type: |
na |
| Period Type: |
duration |
|
| X |
- DefinitionAddress Line 1 such as Attn, Building Name, Street Name
| Name: |
dei_EntityAddressAddressLine1 |
| Namespace Prefix: |
dei_ |
| Data Type: |
xbrli:normalizedStringItemType |
| Balance Type: |
na |
| Period Type: |
duration |
|
| X |
- DefinitionAddress Line 2 such as Street or Suite number
| Name: |
dei_EntityAddressAddressLine2 |
| Namespace Prefix: |
dei_ |
| Data Type: |
xbrli:normalizedStringItemType |
| Balance Type: |
na |
| Period Type: |
duration |
|
| X |
- Definition
+ References
+ Details
| Name: |
dei_EntityAddressCityOrTown |
| Namespace Prefix: |
dei_ |
| Data Type: |
xbrli:normalizedStringItemType |
| Balance Type: |
na |
| Period Type: |
duration |
|
| X |
- DefinitionCode for the postal or zip code
| Name: |
dei_EntityAddressPostalZipCode |
| Namespace Prefix: |
dei_ |
| Data Type: |
xbrli:normalizedStringItemType |
| Balance Type: |
na |
| Period Type: |
duration |
|
| X |
- DefinitionName of the state or province.
| Name: |
dei_EntityAddressStateOrProvince |
| Namespace Prefix: |
dei_ |
| Data Type: |
dei:stateOrProvinceItemType |
| Balance Type: |
na |
| Period Type: |
duration |
|
| X |
- DefinitionA unique 10-digit SEC-issued value to identify entities that have filed disclosures with the SEC. It is commonly abbreviated as CIK. Reference 1: http://www.xbrl.org/2003/role/presentationRef
-Publisher SEC
-Name Exchange Act
-Number 240
-Section 12
-Subsection b-2
| Name: |
dei_EntityCentralIndexKey |
| Namespace Prefix: |
dei_ |
| Data Type: |
dei:centralIndexKeyItemType |
| Balance Type: |
na |
| Period Type: |
duration |
|
| X |
- DefinitionIndicate number of shares or other units outstanding of each of registrant's classes of capital or common stock or other ownership interests, if and as stated on cover of related periodic report. Where multiple classes or units exist define each class/interest by adding class of stock items such as Common Class A [Member], Common Class B [Member] or Partnership Interest [Member] onto the Instrument [Domain] of the Entity Listings, Instrument.
| Name: |
dei_EntityCommonStockSharesOutstanding |
| Namespace Prefix: |
dei_ |
| Data Type: |
xbrli:sharesItemType |
| Balance Type: |
na |
| Period Type: |
instant |
|
| X |
- DefinitionIndicate 'Yes' or 'No' whether registrants (1) have filed all reports required to be filed by Section 13 or 15(d) of the Securities Exchange Act of 1934 during the preceding 12 months (or for such shorter period that registrants were required to file such reports), and (2) have been subject to such filing requirements for the past 90 days. This information should be based on the registrant's current or most recent filing containing the related disclosure.
| Name: |
dei_EntityCurrentReportingStatus |
| Namespace Prefix: |
dei_ |
| Data Type: |
dei:yesNoItemType |
| Balance Type: |
na |
| Period Type: |
duration |
|
| X |
- DefinitionIndicate if registrant meets the emerging growth company criteria. Reference 1: http://www.xbrl.org/2003/role/presentationRef
-Publisher SEC
-Name Exchange Act
-Number 240
-Section 12
-Subsection b-2
| Name: |
dei_EntityEmergingGrowthCompany |
| Namespace Prefix: |
dei_ |
| Data Type: |
xbrli:booleanItemType |
| Balance Type: |
na |
| Period Type: |
duration |
|
| X |
- DefinitionCommission file number. The field allows up to 17 characters. The prefix may contain 1-3 digits, the sequence number may contain 1-8 digits, the optional suffix may contain 1-4 characters, and the fields are separated with a hyphen.
| Name: |
dei_EntityFileNumber |
| Namespace Prefix: |
dei_ |
| Data Type: |
dei:fileNumberItemType |
| Balance Type: |
na |
| Period Type: |
duration |
|
| X |
- DefinitionIndicate whether the registrant is one of the following: Large Accelerated Filer, Accelerated Filer, Non-accelerated Filer. Definitions of these categories are stated in Rule 12b-2 of the Exchange Act. This information should be based on the registrant's current or most recent filing containing the related disclosure. Reference 1: http://www.xbrl.org/2003/role/presentationRef
-Publisher SEC
-Name Exchange Act
-Number 240
-Section 12
-Subsection b-2
| Name: |
dei_EntityFilerCategory |
| Namespace Prefix: |
dei_ |
| Data Type: |
dei:filerCategoryItemType |
| Balance Type: |
na |
| Period Type: |
duration |
|
| X |
- DefinitionTwo-character EDGAR code representing the state or country of incorporation.
| Name: |
dei_EntityIncorporationStateCountryCode |
| Namespace Prefix: |
dei_ |
| Data Type: |
dei:edgarStateCountryItemType |
| Balance Type: |
na |
| Period Type: |
duration |
|
| X |
- DefinitionBoolean flag that is true when the registrant has submitted electronically every Interactive Data File required to be submitted pursuant to Rule 405 of Regulation S-T during the preceding 12 months (or for such shorter period that the registrant was required to submit such files). Reference 1: http://www.xbrl.org/2003/role/presentationRef
-Publisher SEC
-Name Regulation S-T
-Number 232
-Section 405
| Name: |
dei_EntityInteractiveDataCurrent |
| Namespace Prefix: |
dei_ |
| Data Type: |
dei:yesNoItemType |
| Balance Type: |
na |
| Period Type: |
duration |
|
| X |
- DefinitionThe exact name of the entity filing the report as specified in its charter, which is required by forms filed with the SEC. Reference 1: http://www.xbrl.org/2003/role/presentationRef
-Publisher SEC
-Name Exchange Act
-Number 240
-Section 12
-Subsection b-2
| Name: |
dei_EntityRegistrantName |
| Namespace Prefix: |
dei_ |
| Data Type: |
xbrli:normalizedStringItemType |
| Balance Type: |
na |
| Period Type: |
duration |
|
| X |
- DefinitionBoolean flag that is true when the registrant is a shell company as defined in Rule 12b-2 of the Exchange Act. Reference 1: http://www.xbrl.org/2003/role/presentationRef
-Publisher SEC
-Name Exchange Act
-Number 240
-Section 12
-Subsection b-2
| Name: |
dei_EntityShellCompany |
| Namespace Prefix: |
dei_ |
| Data Type: |
xbrli:booleanItemType |
| Balance Type: |
na |
| Period Type: |
duration |
|
| X |
- DefinitionIndicates that the company is a Smaller Reporting Company (SRC). Reference 1: http://www.xbrl.org/2003/role/presentationRef
-Publisher SEC
-Name Exchange Act
-Number 240
-Section 12
-Subsection b-2
| Name: |
dei_EntitySmallBusiness |
| Namespace Prefix: |
dei_ |
| Data Type: |
xbrli:booleanItemType |
| Balance Type: |
na |
| Period Type: |
duration |
|
| X |
- DefinitionThe Tax Identification Number (TIN), also known as an Employer Identification Number (EIN), is a unique 9-digit value assigned by the IRS. Reference 1: http://www.xbrl.org/2003/role/presentationRef
-Publisher SEC
-Name Exchange Act
-Number 240
-Section 12
-Subsection b-2
| Name: |
dei_EntityTaxIdentificationNumber |
| Namespace Prefix: |
dei_ |
| Data Type: |
dei:employerIdItemType |
| Balance Type: |
na |
| Period Type: |
duration |
|
| X |
- DefinitionLocal phone number for entity.
| Name: |
dei_LocalPhoneNumber |
| Namespace Prefix: |
dei_ |
| Data Type: |
xbrli:normalizedStringItemType |
| Balance Type: |
na |
| Period Type: |
duration |
|
| X |
- DefinitionTitle of a 12(b) registered security. Reference 1: http://www.xbrl.org/2003/role/presentationRef
-Publisher SEC
-Name Exchange Act
-Number 240
-Section 12
-Subsection b
| Name: |
dei_Security12bTitle |
| Namespace Prefix: |
dei_ |
| Data Type: |
dei:securityTitleItemType |
| Balance Type: |
na |
| Period Type: |
duration |
|
| X |
- DefinitionName of the Exchange on which a security is registered. Reference 1: http://www.xbrl.org/2003/role/presentationRef
-Publisher SEC
-Name Exchange Act
-Number 240
-Section 12
-Subsection d1-1
| Name: |
dei_SecurityExchangeName |
| Namespace Prefix: |
dei_ |
| Data Type: |
dei:edgarExchangeCodeItemType |
| Balance Type: |
na |
| Period Type: |
duration |
|
| X |
- DefinitionTrading symbol of an instrument as listed on an exchange.
| Name: |
dei_TradingSymbol |
| Namespace Prefix: |
dei_ |
| Data Type: |
dei:tradingSymbolItemType |
| Balance Type: |
na |
| Period Type: |
duration |
|
| X |
- Details
| Name: |
us-gaap_StatementClassOfStockAxis=us-gaap_CommonClassAMember |
| Namespace Prefix: |
|
| Data Type: |
na |
| Balance Type: |
|
| Period Type: |
|
|
| X |
- Details
| Name: |
us-gaap_StatementClassOfStockAxis=us-gaap_CommonClassBMember |
| Namespace Prefix: |
|
| Data Type: |
na |
| Balance Type: |
|
| Period Type: |
|
|
v3.24.2
Condensed Consolidated Balance Sheets - USD ($)
$ in Thousands |
Jun. 30, 2024 |
Dec. 31, 2023 |
| ASSETS |
|
|
| INVENTORIES |
$ 2,292,264
|
$ 2,213,479
|
| INVESTMENT IN UNCONSOLIDATED ENTITIES |
237,777
|
252,816
|
| PROPERTIES AND EQUIPMENT, NET |
29,359
|
29,145
|
| INTANGIBLE ASSET, NET—RELATED PARTY |
13,728
|
25,270
|
| CASH AND CASH EQUIVALENTS |
217,387
|
353,801
|
| RESTRICTED CASH AND CERTIFICATES OF DEPOSIT |
992
|
992
|
| TOTAL |
2,920,139
|
2,969,288
|
| LIABILITIES: |
|
|
| Notes payable, net |
524,104
|
622,186
|
| Accounts payable and other liabilities |
83,267
|
81,649
|
| Related party liabilities |
74,173
|
78,074
|
| Deferred income tax liability, net |
12,917
|
7,067
|
| Payable pursuant to tax receivable agreement |
173,351
|
173,208
|
| Total liabilities |
867,812
|
962,184
|
| COMMITMENTS AND CONTINGENT LIABILITIES (Note 11) |
|
|
| REDEEMABLE NONCONTROLLING INTEREST |
25,000
|
25,000
|
| CAPITAL: |
|
|
| Contributed capital |
593,211
|
591,606
|
| Retained earnings |
105,828
|
88,780
|
| Accumulated other comprehensive loss |
(2,321)
|
(2,332)
|
| Total members’ capital |
696,718
|
678,054
|
| Noncontrolling interests |
1,330,609
|
1,304,050
|
| Total capital |
2,027,327
|
1,982,104
|
| TOTAL |
2,920,139
|
2,969,288
|
| Related Party |
|
|
| ASSETS |
|
|
| OTHER ASSETS |
120,551
|
83,970
|
| LIABILITIES: |
|
|
| Related party liabilities |
74,173
|
78,074
|
| Nonrelated Party |
|
|
| ASSETS |
|
|
| OTHER ASSETS |
$ 8,081
|
$ 9,815
|
| X |
- DefinitionTax Receivable Agreement, Liability, Noncurrent
| Name: |
fph_TaxReceivableAgreementLiabilityNoncurrent |
| Namespace Prefix: |
fph_ |
| Data Type: |
xbrli:monetaryItemType |
| Balance Type: |
credit |
| Period Type: |
instant |
|
| X |
- DefinitionAmount of liabilities incurred and payable to vendors for goods and services received, and accrued liabilities classified as other. Reference 1: http://www.xbrl.org/2003/role/disclosureRef
-Topic 946
-SubTopic 210
-Name Accounting Standards Codification
-Section S99
-Paragraph 1
-Subparagraph (SX 210.6-04(10)(d))
-Publisher FASB
-URI https://asc.fasb.org/1943274/2147479170/946-210-S99-1
| Name: |
us-gaap_AccountsPayableAndOtherAccruedLiabilities |
| Namespace Prefix: |
us-gaap_ |
| Data Type: |
xbrli:monetaryItemType |
| Balance Type: |
credit |
| Period Type: |
instant |
|
| X |
- DefinitionAmount, after tax, of accumulated increase (decrease) in equity from transaction and other event and circumstance from nonowner source. Reference 1: http://fasb.org/us-gaap/role/ref/legacyRef
-Name Accounting Standards Codification
-Topic 220
-SubTopic 10
-Section 45
-Paragraph 14A
-Publisher FASB
-URI https://asc.fasb.org/1943274/2147482790/220-10-45-14A
Reference 2: http://fasb.org/us-gaap/role/ref/legacyRef
-Topic 220
-SubTopic 10
-Name Accounting Standards Codification
-Section 45
-Paragraph 11
-Publisher FASB
-URI https://asc.fasb.org/1943274/2147482790/220-10-45-11
Reference 3: http://www.xbrl.org/2003/role/disclosureRef
-Topic 944
-SubTopic 40
-Name Accounting Standards Codification
-Section 65
-Paragraph 2
-Subparagraph (g)(2)(ii)
-Publisher FASB
-URI https://asc.fasb.org/1943274/2147480016/944-40-65-2
Reference 4: http://www.xbrl.org/2003/role/disclosureRef
-Topic 944
-SubTopic 40
-Name Accounting Standards Codification
-Section 65
-Paragraph 2
-Subparagraph (h)(2)
-Publisher FASB
-URI https://asc.fasb.org/1943274/2147480016/944-40-65-2
Reference 5: http://www.xbrl.org/2003/role/disclosureRef
-Topic 210
-SubTopic 10
-Name Accounting Standards Codification
-Section S99
-Paragraph 1
-Subparagraph (SX 210.5-02(30)(a)(4))
-Publisher FASB
-URI https://asc.fasb.org/1943274/2147480566/210-10-S99-1
Reference 6: http://www.xbrl.org/2003/role/disclosureRef
-Topic 944
-SubTopic 210
-Name Accounting Standards Codification
-Section S99
-Paragraph 1
-Subparagraph (SX 210.7-03(a)(23)(a)(3))
-Publisher FASB
-URI https://asc.fasb.org/1943274/2147478777/944-210-S99-1
Reference 7: http://fasb.org/us-gaap/role/ref/legacyRef
-Name Accounting Standards Codification
-Topic 220
-SubTopic 10
-Section 45
-Paragraph 14
-Publisher FASB
-URI https://asc.fasb.org/1943274/2147482790/220-10-45-14
| Name: |
us-gaap_AccumulatedOtherComprehensiveIncomeLossNetOfTax |
| Namespace Prefix: |
us-gaap_ |
| Data Type: |
xbrli:monetaryItemType |
| Balance Type: |
credit |
| Period Type: |
instant |
|
| X |
- DefinitionAmount of asset recognized for present right to economic benefit. Reference 1: http://www.xbrl.org/2003/role/exampleRef
-Topic 280
-SubTopic 10
-Name Accounting Standards Codification
-Section 55
-Paragraph 48
-Publisher FASB
-URI https://asc.fasb.org/1943274/2147482785/280-10-55-48
Reference 2: http://www.xbrl.org/2003/role/exampleRef
-Topic 280
-SubTopic 10
-Name Accounting Standards Codification
-Section 55
-Paragraph 49
-Publisher FASB
-URI https://asc.fasb.org/1943274/2147482785/280-10-55-49
Reference 3: http://www.xbrl.org/2003/role/disclosureRef
-Topic 270
-SubTopic 10
-Name Accounting Standards Codification
-Section 50
-Paragraph 1
-Subparagraph (i)
-Publisher FASB
-URI https://asc.fasb.org/1943274/2147482964/270-10-50-1
Reference 4: http://www.xbrl.org/2003/role/disclosureRef
-Topic 280
-SubTopic 10
-Name Accounting Standards Codification
-Section 50
-Paragraph 32
-Subparagraph (ee)
-Publisher FASB
-URI https://asc.fasb.org/1943274/2147482810/280-10-50-32
Reference 5: http://fasb.org/us-gaap/role/ref/otherTransitionRef
-Topic 280
-SubTopic 10
-Name Accounting Standards Codification
-Section 50
-Paragraph 32
-Subparagraph (d)
-Publisher FASB
-URI https://asc.fasb.org/1943274/2147482810/280-10-50-32
Reference 6: http://www.xbrl.org/2003/role/disclosureRef
-Topic 280
-SubTopic 10
-Name Accounting Standards Codification
-Section 50
-Paragraph 22
-Publisher FASB
-URI https://asc.fasb.org/1943274/2147482810/280-10-50-22
Reference 7: http://www.xbrl.org/2003/role/disclosureRef
-Topic 810
-SubTopic 10
-Name Accounting Standards Codification
-Section 50
-Paragraph 3
-Subparagraph (bb)
-Publisher FASB
-URI https://asc.fasb.org/1943274/2147481203/810-10-50-3
Reference 8: http://www.xbrl.org/2003/role/disclosureRef
-Topic 810
-SubTopic 10
-Name Accounting Standards Codification
-Section 45
-Paragraph 25
-Subparagraph (a)
-Publisher FASB
-URI https://asc.fasb.org/1943274/2147481231/810-10-45-25
Reference 9: http://www.xbrl.org/2003/role/disclosureRef
-Topic 235
-SubTopic 10
-Name Accounting Standards Codification
-Section S99
-Paragraph 1
-Subparagraph (SX 210.4-08(g)(1)(ii))
-Publisher FASB
-URI https://asc.fasb.org/1943274/2147480678/235-10-S99-1
Reference 10: http://www.xbrl.org/2003/role/disclosureRef
-Topic 323
-SubTopic 10
-Name Accounting Standards Codification
-Section 50
-Paragraph 3
-Subparagraph (c)
-Publisher FASB
-URI https://asc.fasb.org/1943274/2147481687/323-10-50-3
Reference 11: http://www.xbrl.org/2003/role/disclosureRef
-Topic 825
-SubTopic 10
-Name Accounting Standards Codification
-Section 50
-Paragraph 28
-Subparagraph (f)
-Publisher FASB
-URI https://asc.fasb.org/1943274/2147482907/825-10-50-28
Reference 12: http://www.xbrl.org/2003/role/exampleRef
-Topic 852
-SubTopic 10
-Name Accounting Standards Codification
-Section 55
-Paragraph 10
-Publisher FASB
-URI https://asc.fasb.org/1943274/2147481372/852-10-55-10
Reference 13: http://www.xbrl.org/2003/role/exampleRef
-Topic 946
-SubTopic 830
-Name Accounting Standards Codification
-Section 55
-Paragraph 12
-Publisher FASB
-URI https://asc.fasb.org/1943274/2147479168/946-830-55-12
Reference 14: http://www.xbrl.org/2003/role/disclosureRef
-Topic 944
-SubTopic 210
-Name Accounting Standards Codification
-Section S99
-Paragraph 1
-Subparagraph (SX 210.7-03(a)(12))
-Publisher FASB
-URI https://asc.fasb.org/1943274/2147478777/944-210-S99-1
Reference 15: http://www.xbrl.org/2003/role/disclosureRef
-Topic 946
-SubTopic 210
-Name Accounting Standards Codification
-Section S99
-Paragraph 1
-Subparagraph (SX 210.6-04(8))
-Publisher FASB
-URI https://asc.fasb.org/1943274/2147479170/946-210-S99-1
Reference 16: http://www.xbrl.org/2003/role/disclosureRef
-Topic 210
-SubTopic 10
-Name Accounting Standards Codification
-Section S99
-Paragraph 1
-Subparagraph (SX 210.5-02(18))
-Publisher FASB
-URI https://asc.fasb.org/1943274/2147480566/210-10-S99-1
Reference 17: http://www.xbrl.org/2003/role/disclosureRef
-Topic 470
-SubTopic 10
-Name Accounting Standards Codification
-Section S99
-Paragraph 1A
-Subparagraph (SX 210.13-01(a)(4)(i))
-Publisher FASB
-URI https://asc.fasb.org/1943274/2147480097/470-10-S99-1A
Reference 18: http://www.xbrl.org/2009/role/commonPracticeRef
-Topic 470
-SubTopic 10
-Name Accounting Standards Codification
-Section S99
-Paragraph 1A
-Subparagraph (SX 210.13-01(a)(4)(ii))
-Publisher FASB
-URI https://asc.fasb.org/1943274/2147480097/470-10-S99-1A
Reference 19: http://www.xbrl.org/2009/role/commonPracticeRef
-Topic 470
-SubTopic 10
-Name Accounting Standards Codification
-Section S99
-Paragraph 1A
-Subparagraph (SX 210.13-01(a)(4)(iii))
-Publisher FASB
-URI https://asc.fasb.org/1943274/2147480097/470-10-S99-1A
Reference 20: http://www.xbrl.org/2003/role/disclosureRef
-Topic 470
-SubTopic 10
-Name Accounting Standards Codification
-Section S99
-Paragraph 1A
-Subparagraph (SX 210.13-01(a)(4)(iii)(A))
-Publisher FASB
-URI https://asc.fasb.org/1943274/2147480097/470-10-S99-1A
Reference 21: http://www.xbrl.org/2003/role/disclosureRef
-Topic 470
-SubTopic 10
-Name Accounting Standards Codification
-Section S99
-Paragraph 1A
-Subparagraph (SX 210.13-01(a)(4)(iv))
-Publisher FASB
-URI https://asc.fasb.org/1943274/2147480097/470-10-S99-1A
Reference 22: http://www.xbrl.org/2003/role/disclosureRef
-Topic 470
-SubTopic 10
-Name Accounting Standards Codification
-Section S99
-Paragraph 1A
-Subparagraph (SX 210.13-01(a)(5))
-Publisher FASB
-URI https://asc.fasb.org/1943274/2147480097/470-10-S99-1A
Reference 23: http://www.xbrl.org/2003/role/disclosureRef
-Topic 470
-SubTopic 10
-Name Accounting Standards Codification
-Section S99
-Paragraph 1B
-Subparagraph (SX 210.13-02(a)(4)(i))
-Publisher FASB
-URI https://asc.fasb.org/1943274/2147480097/470-10-S99-1B
Reference 24: http://www.xbrl.org/2003/role/disclosureRef
-Topic 470
-SubTopic 10
-Name Accounting Standards Codification
-Section S99
-Paragraph 1B
-Subparagraph (SX 210.13-02(a)(4)(iii)(A))
-Publisher FASB
-URI https://asc.fasb.org/1943274/2147480097/470-10-S99-1B
Reference 25: http://www.xbrl.org/2003/role/disclosureRef
-Topic 470
-SubTopic 10
-Name Accounting Standards Codification
-Section S99
-Paragraph 1B
-Subparagraph (SX 210.13-02(a)(4)(iii)(B))
-Publisher FASB
-URI https://asc.fasb.org/1943274/2147480097/470-10-S99-1B
Reference 26: http://www.xbrl.org/2003/role/disclosureRef
-Topic 470
-SubTopic 10
-Name Accounting Standards Codification
-Section S99
-Paragraph 1B
-Subparagraph (SX 210.13-02(a)(4)(iv))
-Publisher FASB
-URI https://asc.fasb.org/1943274/2147480097/470-10-S99-1B
Reference 27: http://www.xbrl.org/2003/role/disclosureRef
-Topic 470
-SubTopic 10
-Name Accounting Standards Codification
-Section S99
-Paragraph 1B
-Subparagraph (SX 210.13-02(a)(5))
-Publisher FASB
-URI https://asc.fasb.org/1943274/2147480097/470-10-S99-1B
Reference 28: http://www.xbrl.org/2009/role/commonPracticeRef
-Topic 852
-SubTopic 10
-Name Accounting Standards Codification
-Section 50
-Paragraph 7
-Subparagraph (a)
-Publisher FASB
-URI https://asc.fasb.org/1943274/2147481404/852-10-50-7
Reference 29: http://www.xbrl.org/2003/role/disclosureRef
-Topic 280
-SubTopic 10
-Name Accounting Standards Codification
-Section 50
-Paragraph 30
-Subparagraph (c)
-Publisher FASB
-URI https://asc.fasb.org/1943274/2147482810/280-10-50-30
Reference 30: http://fasb.org/us-gaap/role/ref/legacyRef
-Topic 942
-SubTopic 210
-Name Accounting Standards Codification
-Section S99
-Paragraph 1
-Subparagraph (SX 210.9-03(11))
-Publisher FASB
-URI https://asc.fasb.org/1943274/2147478546/942-210-S99-1
| Name: |
us-gaap_Assets |
| Namespace Prefix: |
us-gaap_ |
| Data Type: |
xbrli:monetaryItemType |
| Balance Type: |
debit |
| Period Type: |
instant |
|
| X |
- References
+ Details
| Name: |
us-gaap_AssetsAbstract |
| Namespace Prefix: |
us-gaap_ |
| Data Type: |
xbrli:stringItemType |
| Balance Type: |
na |
| Period Type: |
duration |
|
| X |
- DefinitionAmount of currency on hand as well as demand deposits with banks or financial institutions. Includes other kinds of accounts that have the general characteristics of demand deposits. Also includes short-term, highly liquid investments that are both readily convertible to known amounts of cash and so near their maturity that they present insignificant risk of changes in value because of changes in interest rates. Excludes cash and cash equivalents within disposal group and discontinued operation. Reference 1: http://www.xbrl.org/2003/role/disclosureRef
-Topic 210
-SubTopic 10
-Name Accounting Standards Codification
-Section S99
-Paragraph 1
-Subparagraph (SX 210.5-02(1))
-Publisher FASB
-URI https://asc.fasb.org/1943274/2147480566/210-10-S99-1
Reference 2: http://www.xbrl.org/2003/role/exampleRef
-Topic 210
-SubTopic 10
-Name Accounting Standards Codification
-Section 45
-Paragraph 1
-Subparagraph (a)
-Publisher FASB
-URI https://asc.fasb.org/1943274/2147483467/210-10-45-1
Reference 3: http://fasb.org/us-gaap/role/ref/legacyRef
-Name Accounting Standards Codification
-Topic 230
-SubTopic 10
-Section 45
-Paragraph 4
-Publisher FASB
-URI https://asc.fasb.org/1943274/2147482740/230-10-45-4
| Name: |
us-gaap_CashAndCashEquivalentsAtCarryingValue |
| Namespace Prefix: |
us-gaap_ |
| Data Type: |
xbrli:monetaryItemType |
| Balance Type: |
debit |
| Period Type: |
instant |
|
| X |
- DefinitionRepresents the caption on the face of the balance sheet to indicate that the entity has entered into (1) purchase or supply arrangements that will require expending a portion of its resources to meet the terms thereof, and (2) is exposed to potential losses or, less frequently, gains, arising from (a) possible claims against a company's resources due to future performance under contract terms, and (b) possible losses or likely gains from uncertainties that will ultimately be resolved when one or more future events that are deemed likely to occur do occur or fail to occur. Reference 1: http://fasb.org/us-gaap/role/ref/legacyRef
-Topic 942
-SubTopic 210
-Name Accounting Standards Codification
-Section S99
-Paragraph 1
-Subparagraph (SX 210.9-03(17))
-Publisher FASB
-URI https://asc.fasb.org/1943274/2147478546/942-210-S99-1
Reference 2: http://fasb.org/us-gaap/role/ref/legacyRef
-Topic 210
-SubTopic 10
-Name Accounting Standards Codification
-Section S99
-Paragraph 1
-Subparagraph (SX 210.5-02(25))
-Publisher FASB
-URI https://asc.fasb.org/1943274/2147480566/210-10-S99-1
Reference 3: http://www.xbrl.org/2003/role/disclosureRef
-Topic 944
-SubTopic 210
-Name Accounting Standards Codification
-Section S99
-Paragraph 1
-Subparagraph (SX 210.7-03(a)(19))
-Publisher FASB
-URI https://asc.fasb.org/1943274/2147478777/944-210-S99-1
Reference 4: http://www.xbrl.org/2003/role/disclosureRef
-Topic 946
-SubTopic 210
-Name Accounting Standards Codification
-Section S99
-Paragraph 1
-Subparagraph (SX 210.6-04(15))
-Publisher FASB
-URI https://asc.fasb.org/1943274/2147479170/946-210-S99-1
| Name: |
us-gaap_CommitmentsAndContingencies |
| Namespace Prefix: |
us-gaap_ |
| Data Type: |
xbrli:monetaryItemType |
| Balance Type: |
credit |
| Period Type: |
instant |
|
| X |
- DefinitionThis item represents the carrying amount on the entity's balance sheet of its investment in common stock of an equity method investee. This is not an indicator of the fair value of the investment, rather it is the initial cost adjusted for the entity's share of earnings and losses of the investee, adjusted for any distributions (dividends) and other than temporary impairment (OTTI) losses recognized. Reference 1: http://www.xbrl.org/2003/role/disclosureRef
-Topic 270
-SubTopic 10
-Name Accounting Standards Codification
-Section 50
-Paragraph 1
-Subparagraph (i)
-Publisher FASB
-URI https://asc.fasb.org/1943274/2147482964/270-10-50-1
Reference 2: http://www.xbrl.org/2003/role/disclosureRef
-Topic 280
-SubTopic 10
-Name Accounting Standards Codification
-Section 50
-Paragraph 32
-Subparagraph (ee)
-Publisher FASB
-URI https://asc.fasb.org/1943274/2147482810/280-10-50-32
Reference 3: http://www.xbrl.org/2003/role/disclosureRef
-Topic 323
-SubTopic 10
-Name Accounting Standards Codification
-Section 45
-Paragraph 1
-Publisher FASB
-URI https://asc.fasb.org/1943274/2147481664/323-10-45-1
Reference 4: http://www.xbrl.org/2009/role/commonPracticeRef
-Topic 323
-SubTopic 10
-Name Accounting Standards Codification
-Section 50
-Paragraph 3
-Subparagraph (a)(3)
-Publisher FASB
-URI https://asc.fasb.org/1943274/2147481687/323-10-50-3
Reference 5: http://www.xbrl.org/2009/role/commonPracticeRef
-Topic 210
-SubTopic 10
-Name Accounting Standards Codification
-Section S99
-Paragraph 1
-Subparagraph (SX 210.5-02(10))
-Publisher FASB
-URI https://asc.fasb.org/1943274/2147480566/210-10-S99-1
Reference 6: http://www.xbrl.org/2003/role/disclosureRef
-Topic 280
-SubTopic 10
-Name Accounting Standards Codification
-Section 50
-Paragraph 25
-Subparagraph (a)
-Publisher FASB
-URI https://asc.fasb.org/1943274/2147482810/280-10-50-25
| Name: |
us-gaap_EquityMethodInvestments |
| Namespace Prefix: |
us-gaap_ |
| Data Type: |
xbrli:monetaryItemType |
| Balance Type: |
debit |
| Period Type: |
instant |
|
| X |
- DefinitionAmount after amortization of assets, excluding financial assets and goodwill, lacking physical substance with a finite life. Reference 1: http://www.xbrl.org/2009/role/commonPracticeRef
-Topic 350
-SubTopic 30
-Name Accounting Standards Codification
-Section 50
-Paragraph 2
-Subparagraph (a)(1)
-Publisher FASB
-URI https://asc.fasb.org/1943274/2147482665/350-30-50-2
Reference 2: http://www.xbrl.org/2003/role/disclosureRef
-Topic 926
-SubTopic 20
-Name Accounting Standards Codification
-Section 50
-Paragraph 5
-Publisher FASB
-URI https://asc.fasb.org/1943274/2147483154/926-20-50-5
| Name: |
us-gaap_FiniteLivedIntangibleAssetsNet |
| Namespace Prefix: |
us-gaap_ |
| Data Type: |
xbrli:monetaryItemType |
| Balance Type: |
debit |
| Period Type: |
instant |
|
| X |
- DefinitionTotal of (1) improvements, (2) held-for-sale, (3) land and land under development, (4) construction-in-process, (5) mortgage loans held-in-inventory, and (6) other real estate investments which are considered inventory due to being held for sale or disposition.
| Name: |
us-gaap_InventoryRealEstate |
| Namespace Prefix: |
us-gaap_ |
| Data Type: |
xbrli:monetaryItemType |
| Balance Type: |
debit |
| Period Type: |
instant |
|
| X |
- DefinitionAmount of liability recognized for present obligation requiring transfer or otherwise providing economic benefit to others. Reference 1: http://fasb.org/us-gaap/role/ref/legacyRef
-Name Accounting Standards Codification
-Section S99
-Paragraph 1
-Subparagraph (SX 210.5-02(22))
-SubTopic 10
-Topic 210
-Publisher FASB
-URI https://asc.fasb.org/1943274/2147480566/210-10-S99-1
Reference 2: http://fasb.org/us-gaap/role/ref/legacyRef
-Topic 210
-SubTopic 10
-Name Accounting Standards Codification
-Section S99
-Paragraph 1
-Subparagraph (SX 210.5-02(20))
-Publisher FASB
-URI https://asc.fasb.org/1943274/2147480566/210-10-S99-1
Reference 3: http://fasb.org/us-gaap/role/ref/legacyRef
-Topic 210
-SubTopic 10
-Name Accounting Standards Codification
-Section S99
-Paragraph 1
-Subparagraph (SX 210.5-02(24))
-Publisher FASB
-URI https://asc.fasb.org/1943274/2147480566/210-10-S99-1
Reference 4: http://fasb.org/us-gaap/role/ref/legacyRef
-Topic 210
-SubTopic 10
-Name Accounting Standards Codification
-Section S99
-Paragraph 1
-Subparagraph (SX 210.5-02(19))
-Publisher FASB
-URI https://asc.fasb.org/1943274/2147480566/210-10-S99-1
Reference 5: http://fasb.org/us-gaap/role/ref/legacyRef
-Topic 210
-SubTopic 10
-Name Accounting Standards Codification
-Section S99
-Paragraph 1
-Subparagraph (SX 210.5-02(25))
-Publisher FASB
-URI https://asc.fasb.org/1943274/2147480566/210-10-S99-1
Reference 6: http://fasb.org/us-gaap/role/ref/legacyRef
-Topic 210
-SubTopic 10
-Name Accounting Standards Codification
-Section S99
-Paragraph 1
-Subparagraph (SX 210.5-02(26))
-Publisher FASB
-URI https://asc.fasb.org/1943274/2147480566/210-10-S99-1
Reference 7: http://fasb.org/us-gaap/role/ref/legacyRef
-Topic 210
-SubTopic 10
-Name Accounting Standards Codification
-Section S99
-Paragraph 1
-Subparagraph (SX 210.5-02(23))
-Publisher FASB
-URI https://asc.fasb.org/1943274/2147480566/210-10-S99-1
Reference 8: http://fasb.org/us-gaap/role/ref/legacyRef
-Topic 210
-SubTopic 10
-Name Accounting Standards Codification
-Section S99
-Paragraph 1
-Subparagraph (SX 210.5-02(21))
-Publisher FASB
-URI https://asc.fasb.org/1943274/2147480566/210-10-S99-1
Reference 9: http://www.xbrl.org/2003/role/disclosureRef
-Topic 810
-SubTopic 10
-Name Accounting Standards Codification
-Section 50
-Paragraph 3
-Subparagraph (c)
-Publisher FASB
-URI https://asc.fasb.org/1943274/2147481203/810-10-50-3
Reference 10: http://www.xbrl.org/2003/role/disclosureRef
-Topic 810
-SubTopic 10
-Name Accounting Standards Codification
-Section 45
-Paragraph 25
-Subparagraph (b)
-Publisher FASB
-URI https://asc.fasb.org/1943274/2147481231/810-10-45-25
Reference 11: http://www.xbrl.org/2003/role/disclosureRef
-Topic 810
-SubTopic 10
-Name Accounting Standards Codification
-Section 50
-Paragraph 3
-Subparagraph (bb)
-Publisher FASB
-URI https://asc.fasb.org/1943274/2147481203/810-10-50-3
Reference 12: http://www.xbrl.org/2003/role/disclosureRef
-Topic 235
-SubTopic 10
-Name Accounting Standards Codification
-Section S99
-Paragraph 1
-Subparagraph (SX 210.4-08(g)(1)(ii))
-Publisher FASB
-URI https://asc.fasb.org/1943274/2147480678/235-10-S99-1
Reference 13: http://www.xbrl.org/2003/role/disclosureRef
-Topic 323
-SubTopic 10
-Name Accounting Standards Codification
-Section 50
-Paragraph 3
-Subparagraph (c)
-Publisher FASB
-URI https://asc.fasb.org/1943274/2147481687/323-10-50-3
Reference 14: http://www.xbrl.org/2003/role/disclosureRef
-Topic 825
-SubTopic 10
-Name Accounting Standards Codification
-Section 50
-Paragraph 28
-Subparagraph (f)
-Publisher FASB
-URI https://asc.fasb.org/1943274/2147482907/825-10-50-28
Reference 15: http://www.xbrl.org/2003/role/exampleRef
-Topic 946
-SubTopic 830
-Name Accounting Standards Codification
-Section 55
-Paragraph 12
-Publisher FASB
-URI https://asc.fasb.org/1943274/2147479168/946-830-55-12
Reference 16: http://www.xbrl.org/2003/role/disclosureRef
-Topic 946
-SubTopic 210
-Name Accounting Standards Codification
-Section S99
-Paragraph 1
-Subparagraph (SX 210.6-04(14))
-Publisher FASB
-URI https://asc.fasb.org/1943274/2147479170/946-210-S99-1
Reference 17: http://www.xbrl.org/2003/role/disclosureRef
-Topic 470
-SubTopic 10
-Name Accounting Standards Codification
-Section S99
-Paragraph 1A
-Subparagraph (SX 210.13-01(a)(4)(i))
-Publisher FASB
-URI https://asc.fasb.org/1943274/2147480097/470-10-S99-1A
Reference 18: http://www.xbrl.org/2009/role/commonPracticeRef
-Topic 470
-SubTopic 10
-Name Accounting Standards Codification
-Section S99
-Paragraph 1A
-Subparagraph (SX 210.13-01(a)(4)(ii))
-Publisher FASB
-URI https://asc.fasb.org/1943274/2147480097/470-10-S99-1A
Reference 19: http://www.xbrl.org/2003/role/disclosureRef
-Topic 470
-SubTopic 10
-Name Accounting Standards Codification
-Section S99
-Paragraph 1A
-Subparagraph (SX 210.13-01(a)(4)(iii)(A))
-Publisher FASB
-URI https://asc.fasb.org/1943274/2147480097/470-10-S99-1A
Reference 20: http://www.xbrl.org/2003/role/disclosureRef
-Topic 470
-SubTopic 10
-Name Accounting Standards Codification
-Section S99
-Paragraph 1A
-Subparagraph (SX 210.13-01(a)(4)(iv))
-Publisher FASB
-URI https://asc.fasb.org/1943274/2147480097/470-10-S99-1A
Reference 21: http://www.xbrl.org/2003/role/disclosureRef
-Topic 470
-SubTopic 10
-Name Accounting Standards Codification
-Section S99
-Paragraph 1A
-Subparagraph (SX 210.13-01(a)(5))
-Publisher FASB
-URI https://asc.fasb.org/1943274/2147480097/470-10-S99-1A
Reference 22: http://www.xbrl.org/2003/role/disclosureRef
-Topic 470
-SubTopic 10
-Name Accounting Standards Codification
-Section S99
-Paragraph 1B
-Subparagraph (SX 210.13-02(a)(4)(i))
-Publisher FASB
-URI https://asc.fasb.org/1943274/2147480097/470-10-S99-1B
Reference 23: http://www.xbrl.org/2003/role/disclosureRef
-Topic 470
-SubTopic 10
-Name Accounting Standards Codification
-Section S99
-Paragraph 1B
-Subparagraph (SX 210.13-02(a)(4)(iii)(A))
-Publisher FASB
-URI https://asc.fasb.org/1943274/2147480097/470-10-S99-1B
Reference 24: http://www.xbrl.org/2003/role/disclosureRef
-Topic 470
-SubTopic 10
-Name Accounting Standards Codification
-Section S99
-Paragraph 1B
-Subparagraph (SX 210.13-02(a)(4)(iii)(B))
-Publisher FASB
-URI https://asc.fasb.org/1943274/2147480097/470-10-S99-1B
Reference 25: http://www.xbrl.org/2003/role/disclosureRef
-Topic 470
-SubTopic 10
-Name Accounting Standards Codification
-Section S99
-Paragraph 1B
-Subparagraph (SX 210.13-02(a)(4)(iv))
-Publisher FASB
-URI https://asc.fasb.org/1943274/2147480097/470-10-S99-1B
Reference 26: http://www.xbrl.org/2003/role/disclosureRef
-Topic 470
-SubTopic 10
-Name Accounting Standards Codification
-Section S99
-Paragraph 1B
-Subparagraph (SX 210.13-02(a)(5))
-Publisher FASB
-URI https://asc.fasb.org/1943274/2147480097/470-10-S99-1B
Reference 27: http://www.xbrl.org/2009/role/commonPracticeRef
-Topic 852
-SubTopic 10
-Name Accounting Standards Codification
-Section 50
-Paragraph 7
-Subparagraph (a)
-Publisher FASB
-URI https://asc.fasb.org/1943274/2147481404/852-10-50-7
Reference 28: http://www.xbrl.org/2009/role/commonPracticeRef
-Topic 852
-SubTopic 10
-Name Accounting Standards Codification
-Section 50
-Paragraph 7
-Subparagraph (b)
-Publisher FASB
-URI https://asc.fasb.org/1943274/2147481404/852-10-50-7
Reference 29: http://www.xbrl.org/2003/role/exampleRef
-Topic 280
-SubTopic 10
-Name Accounting Standards Codification
-Section 50
-Paragraph 30
-Subparagraph (d)
-Publisher FASB
-URI https://asc.fasb.org/1943274/2147482810/280-10-50-30
| Name: |
us-gaap_Liabilities |
| Namespace Prefix: |
us-gaap_ |
| Data Type: |
xbrli:monetaryItemType |
| Balance Type: |
credit |
| Period Type: |
instant |
|
| X |
- References
+ Details
| Name: |
us-gaap_LiabilitiesAbstract |
| Namespace Prefix: |
us-gaap_ |
| Data Type: |
xbrli:stringItemType |
| Balance Type: |
na |
| Period Type: |
duration |
|
| X |
- DefinitionAmount of liabilities and equity items, including the portion of equity attributable to noncontrolling interests, if any. Reference 1: http://www.xbrl.org/2003/role/exampleRef
-Topic 852
-SubTopic 10
-Name Accounting Standards Codification
-Section 55
-Paragraph 10
-Publisher FASB
-URI https://asc.fasb.org/1943274/2147481372/852-10-55-10
Reference 2: http://www.xbrl.org/2003/role/disclosureRef
-Topic 944
-SubTopic 210
-Name Accounting Standards Codification
-Section S99
-Paragraph 1
-Subparagraph (SX 210.7-03(a)(25))
-Publisher FASB
-URI https://asc.fasb.org/1943274/2147478777/944-210-S99-1
Reference 3: http://www.xbrl.org/2009/role/commonPracticeRef
-Topic 235
-SubTopic 10
-Name Accounting Standards Codification
-Section S99
-Paragraph 1
-Subparagraph (SX 210.4-08(g)(1)(ii))
-Publisher FASB
-URI https://asc.fasb.org/1943274/2147480678/235-10-S99-1
Reference 4: http://www.xbrl.org/2009/role/commonPracticeRef
-Topic 323
-SubTopic 10
-Name Accounting Standards Codification
-Section 50
-Paragraph 3
-Subparagraph (c)
-Publisher FASB
-URI https://asc.fasb.org/1943274/2147481687/323-10-50-3
Reference 5: http://www.xbrl.org/2009/role/commonPracticeRef
-Topic 825
-SubTopic 10
-Name Accounting Standards Codification
-Section 50
-Paragraph 28
-Subparagraph (f)
-Publisher FASB
-URI https://asc.fasb.org/1943274/2147482907/825-10-50-28
Reference 6: http://fasb.org/us-gaap/role/ref/legacyRef
-Topic 942
-SubTopic 210
-Name Accounting Standards Codification
-Section S99
-Paragraph 1
-Subparagraph (SX 210.9-03(23))
-Publisher FASB
-URI https://asc.fasb.org/1943274/2147478546/942-210-S99-1
Reference 7: http://fasb.org/us-gaap/role/ref/legacyRef
-Topic 210
-SubTopic 10
-Name Accounting Standards Codification
-Section S99
-Paragraph 1
-Subparagraph (SX 210.5-02(32))
-Publisher FASB
-URI https://asc.fasb.org/1943274/2147480566/210-10-S99-1
| Name: |
us-gaap_LiabilitiesAndStockholdersEquity |
| Namespace Prefix: |
us-gaap_ |
| Data Type: |
xbrli:monetaryItemType |
| Balance Type: |
credit |
| Period Type: |
instant |
|
| X |
- DefinitionAmount of ownership interest in a limited liability company (LLC), including portions attributable to both the parent and noncontrolling interests. Reference 1: http://www.xbrl.org/2003/role/disclosureRef
-Topic 272
-SubTopic 10
-Name Accounting Standards Codification
-Section 45
-Paragraph 1
-Publisher FASB
-URI https://asc.fasb.org/1943274/2147483014/272-10-45-1
Reference 2: http://fasb.org/us-gaap/role/ref/legacyRef
-Topic 505
-SubTopic 10
-Name Accounting Standards Codification
-Section S99
-Paragraph 1
-Subparagraph (SX 210.3-04)
-Publisher FASB
-URI https://asc.fasb.org/1943274/2147480008/505-10-S99-1
| Name: |
us-gaap_LimitedLiabilityCompanyLlcMembersEquityIncludingPortionAttributableToNoncontrollingInterest |
| Namespace Prefix: |
us-gaap_ |
| Data Type: |
xbrli:monetaryItemType |
| Balance Type: |
credit |
| Period Type: |
instant |
|
| X |
- DefinitionAmount of member capital in limited liability company (LLC). Reference 1: http://fasb.org/us-gaap/role/ref/legacyRef
-Topic 505
-SubTopic 10
-Name Accounting Standards Codification
-Section S99
-Paragraph 1
-Subparagraph (SX 210.3-04)
-Publisher FASB
-URI https://asc.fasb.org/1943274/2147480008/505-10-S99-1
| Name: |
us-gaap_MembersCapital |
| Namespace Prefix: |
us-gaap_ |
| Data Type: |
xbrli:monetaryItemType |
| Balance Type: |
credit |
| Period Type: |
instant |
|
| X |
- DefinitionAmount of ownership interest in limited liability company (LLC), attributable to the parent entity. Reference 1: http://www.xbrl.org/2003/role/disclosureRef
-Topic 272
-SubTopic 10
-Name Accounting Standards Codification
-Section 50
-Paragraph 1
-Publisher FASB
-URI https://asc.fasb.org/1943274/2147482987/272-10-50-1
Reference 2: http://www.xbrl.org/2003/role/disclosureRef
-Topic 272
-SubTopic 10
-Name Accounting Standards Codification
-Section 50
-Paragraph 3
-Subparagraph (b)
-Publisher FASB
-URI https://asc.fasb.org/1943274/2147482987/272-10-50-3
Reference 3: http://www.xbrl.org/2003/role/disclosureRef
-Topic 272
-SubTopic 10
-Name Accounting Standards Codification
-Section 45
-Paragraph 3
-Publisher FASB
-URI https://asc.fasb.org/1943274/2147483014/272-10-45-3
Reference 4: http://www.xbrl.org/2003/role/disclosureRef
-Topic 272
-SubTopic 10
-Name Accounting Standards Codification
-Section 45
-Paragraph 4
-Publisher FASB
-URI https://asc.fasb.org/1943274/2147483014/272-10-45-4
Reference 5: http://fasb.org/us-gaap/role/ref/legacyRef
-Topic 505
-SubTopic 10
-Name Accounting Standards Codification
-Section S99
-Paragraph 1
-Subparagraph (SX 210.3-04)
-Publisher FASB
-URI https://asc.fasb.org/1943274/2147480008/505-10-S99-1
| Name: |
us-gaap_MembersEquity |
| Namespace Prefix: |
us-gaap_ |
| Data Type: |
xbrli:monetaryItemType |
| Balance Type: |
credit |
| Period Type: |
instant |
|
| X |
- DefinitionAmount of ownership interest in limited liability company (LLC) directly or indirectly attributable to noncontrolling interests. Reference 1: http://fasb.org/us-gaap/role/ref/legacyRef
-Topic 505
-SubTopic 10
-Name Accounting Standards Codification
-Section S99
-Paragraph 1
-Subparagraph (SX 210.3-04)
-Publisher FASB
-URI https://asc.fasb.org/1943274/2147480008/505-10-S99-1
| Name: |
us-gaap_MembersEquityAttributableToNoncontrollingInterest |
| Namespace Prefix: |
us-gaap_ |
| Data Type: |
xbrli:monetaryItemType |
| Balance Type: |
credit |
| Period Type: |
instant |
|
| X |
- DefinitionIncluding the current and noncurrent portions, aggregate carrying amount of all types of notes payable, as of the balance sheet date, with initial maturities beyond one year or beyond the normal operating cycle, if longer. Reference 1: http://fasb.org/us-gaap/role/ref/legacyRef
-Name Accounting Standards Codification
-Section S99
-Paragraph 1
-Subparagraph (SX 210.5-02(22))
-SubTopic 10
-Topic 210
-Publisher FASB
-URI https://asc.fasb.org/1943274/2147480566/210-10-S99-1
Reference 2: http://fasb.org/us-gaap/role/ref/legacyRef
-Topic 942
-SubTopic 210
-Name Accounting Standards Codification
-Section S99
-Paragraph 1
-Subparagraph (SX 210.9-03(16))
-Publisher FASB
-URI https://asc.fasb.org/1943274/2147478546/942-210-S99-1
Reference 3: http://www.xbrl.org/2009/role/commonPracticeRef
-Topic 944
-SubTopic 210
-Name Accounting Standards Codification
-Section S99
-Paragraph 1
-Subparagraph (SX 210.7-03(a)(16)(a)(2))
-Publisher FASB
-URI https://asc.fasb.org/1943274/2147478777/944-210-S99-1
Reference 4: http://www.xbrl.org/2009/role/commonPracticeRef
-Topic 944
-SubTopic 210
-Name Accounting Standards Codification
-Section S99
-Paragraph 1
-Subparagraph (SX 210.7-03(a)(17))
-Publisher FASB
-URI https://asc.fasb.org/1943274/2147478777/944-210-S99-1
| Name: |
us-gaap_NotesPayable |
| Namespace Prefix: |
us-gaap_ |
| Data Type: |
xbrli:monetaryItemType |
| Balance Type: |
credit |
| Period Type: |
instant |
|
| X |
- DefinitionAmount of assets classified as other. Reference 1: http://www.xbrl.org/2003/role/exampleRef
-Topic 280
-SubTopic 10
-Name Accounting Standards Codification
-Section 55
-Paragraph 49
-Publisher FASB
-URI https://asc.fasb.org/1943274/2147482785/280-10-55-49
Reference 2: http://fasb.org/us-gaap/role/ref/legacyRef
-Topic 942
-SubTopic 210
-Name Accounting Standards Codification
-Section S99
-Paragraph 1
-Subparagraph (SX 210.9-03(10))
-Publisher FASB
-URI https://asc.fasb.org/1943274/2147478546/942-210-S99-1
Reference 3: http://www.xbrl.org/2003/role/exampleRef
-Topic 946
-SubTopic 830
-Name Accounting Standards Codification
-Section 55
-Paragraph 12
-Publisher FASB
-URI https://asc.fasb.org/1943274/2147479168/946-830-55-12
Reference 4: http://www.xbrl.org/2003/role/disclosureRef
-Topic 944
-SubTopic 210
-Name Accounting Standards Codification
-Section S99
-Paragraph 1
-Subparagraph (SX 210.7-03(a)(10))
-Publisher FASB
-URI https://asc.fasb.org/1943274/2147478777/944-210-S99-1
Reference 5: http://www.xbrl.org/2003/role/disclosureRef
-Topic 210
-SubTopic 10
-Name Accounting Standards Codification
-Section S99
-Paragraph 1
-Subparagraph (SX 210.5-02(17))
-Publisher FASB
-URI https://asc.fasb.org/1943274/2147480566/210-10-S99-1
| Name: |
us-gaap_OtherAssets |
| Namespace Prefix: |
us-gaap_ |
| Data Type: |
xbrli:monetaryItemType |
| Balance Type: |
debit |
| Period Type: |
instant |
|
| X |
- DefinitionAmount of liabilities classified as other. Reference 1: http://fasb.org/us-gaap/role/ref/legacyRef
-Topic 942
-SubTopic 210
-Name Accounting Standards Codification
-Section S99
-Paragraph 1
-Subparagraph (SX 210.9-03(15))
-Publisher FASB
-URI https://asc.fasb.org/1943274/2147478546/942-210-S99-1
Reference 2: http://www.xbrl.org/2003/role/disclosureRef
-Topic 944
-SubTopic 210
-Name Accounting Standards Codification
-Section S99
-Paragraph 1
-Subparagraph (SX 210.7-03(a)(15))
-Publisher FASB
-URI https://asc.fasb.org/1943274/2147478777/944-210-S99-1
Reference 3: http://www.xbrl.org/2003/role/exampleRef
-Topic 946
-SubTopic 830
-Name Accounting Standards Codification
-Section 55
-Paragraph 12
-Publisher FASB
-URI https://asc.fasb.org/1943274/2147479168/946-830-55-12
Reference 4: http://www.xbrl.org/2003/role/disclosureRef
-Topic 946
-SubTopic 210
-Name Accounting Standards Codification
-Section S99
-Paragraph 1
-Subparagraph (SX 210.6-04(12)(b)(2))
-Publisher FASB
-URI https://asc.fasb.org/1943274/2147479170/946-210-S99-1
Reference 5: http://www.xbrl.org/2003/role/disclosureRef
-Topic 946
-SubTopic 210
-Name Accounting Standards Codification
-Section S99
-Paragraph 1
-Subparagraph (SX 210.6-04(12)(b)(3))
-Publisher FASB
-URI https://asc.fasb.org/1943274/2147479170/946-210-S99-1
Reference 6: http://www.xbrl.org/2009/role/commonPracticeRef
-Topic 946
-SubTopic 210
-Name Accounting Standards Codification
-Section S99
-Paragraph 1
-Subparagraph (SX 210.6-04(12)(b)(1))
-Publisher FASB
-URI https://asc.fasb.org/1943274/2147479170/946-210-S99-1
Reference 7: http://www.xbrl.org/2009/role/commonPracticeRef
-Topic 944
-SubTopic 210
-Name Accounting Standards Codification
-Section S99
-Paragraph 1
-Subparagraph (SX 210.7-03(a)(17))
-Publisher FASB
-URI https://asc.fasb.org/1943274/2147478777/944-210-S99-1
| Name: |
us-gaap_OtherLiabilities |
| Namespace Prefix: |
us-gaap_ |
| Data Type: |
xbrli:monetaryItemType |
| Balance Type: |
credit |
| Period Type: |
instant |
|
| X |
- DefinitionAmount after accumulated depreciation, depletion and amortization of physical assets used in the normal conduct of business to produce goods and services and not intended for resale. Examples include, but are not limited to, land, buildings, machinery and equipment, office equipment, and furniture and fixtures. Reference 1: http://fasb.org/us-gaap/role/ref/legacyRef
-Name Accounting Standards Codification
-Section 50
-Paragraph 1
-SubTopic 10
-Topic 360
-Publisher FASB
-URI https://asc.fasb.org/1943274/2147482099/360-10-50-1
Reference 2: http://www.xbrl.org/2003/role/disclosureRef
-Topic 842
-SubTopic 20
-Name Accounting Standards Codification
-Section 50
-Paragraph 7A
-Subparagraph (a)
-Publisher FASB
-URI https://asc.fasb.org/1943274/2147478964/842-20-50-7A
Reference 3: http://www.xbrl.org/2003/role/exampleRef
-Topic 852
-SubTopic 10
-Name Accounting Standards Codification
-Section 55
-Paragraph 10
-Publisher FASB
-URI https://asc.fasb.org/1943274/2147481372/852-10-55-10
Reference 4: http://www.xbrl.org/2003/role/disclosureRef
-Topic 944
-SubTopic 210
-Name Accounting Standards Codification
-Section S99
-Paragraph 1
-Subparagraph (SX 210.7-03(a)(8))
-Publisher FASB
-URI https://asc.fasb.org/1943274/2147478777/944-210-S99-1
Reference 5: http://www.xbrl.org/2003/role/disclosureRef
-Topic 942
-SubTopic 360
-Name Accounting Standards Codification
-Section 50
-Paragraph 1
-Publisher FASB
-URI https://asc.fasb.org/1943274/2147478451/942-360-50-1
| Name: |
us-gaap_PropertyPlantAndEquipmentNet |
| Namespace Prefix: |
us-gaap_ |
| Data Type: |
xbrli:monetaryItemType |
| Balance Type: |
debit |
| Period Type: |
instant |
|
| X |
- DefinitionAs of the reporting date, the aggregate carrying amount of all noncontrolling interests which are redeemable by the (parent) entity (1) at a fixed or determinable price on a fixed or determinable date, (2) at the option of the holder of the noncontrolling interest, or (3) upon occurrence of an event that is not solely within the control of the (parent) entity. This item includes noncontrolling interest holder's ownership (or holders' ownership) regardless of the type of equity interest (common, preferred, other) including all potential organizational (legal) forms of the investee entity. Reference 1: http://fasb.org/us-gaap/role/ref/legacyRef
-Name Accounting Standards Codification
-Topic 480
-SubTopic 10
-Subparagraph (12)(c)
-Section S99
-Paragraph 3A
-Publisher FASB
-URI https://asc.fasb.org/1943274/2147480244/480-10-S99-3A
Reference 2: http://fasb.org/us-gaap/role/ref/legacyRef
-Name Accounting Standards Codification
-Topic 480
-SubTopic 10
-Subparagraph (16)(c)
-Paragraph 3A
-Section S99
-Publisher FASB
-URI https://asc.fasb.org/1943274/2147480244/480-10-S99-3A
Reference 3: http://fasb.org/us-gaap/role/ref/legacyRef
-Topic 480
-SubTopic 10
-Name Accounting Standards Codification
-Section S99
-Paragraph 3A
-Subparagraph (15)
-Publisher FASB
-URI https://asc.fasb.org/1943274/2147480244/480-10-S99-3A
Reference 4: http://fasb.org/us-gaap/role/ref/legacyRef
-Topic 480
-SubTopic 10
-Name Accounting Standards Codification
-Section S99
-Paragraph 3A
-Subparagraph (14)
-Publisher FASB
-URI https://asc.fasb.org/1943274/2147480244/480-10-S99-3A
| Name: |
us-gaap_RedeemableNoncontrollingInterestEquityCarryingAmount |
| Namespace Prefix: |
us-gaap_ |
| Data Type: |
xbrli:monetaryItemType |
| Balance Type: |
credit |
| Period Type: |
instant |
|
| X |
- DefinitionCash and investments whose use in whole or in part is restricted for the long-term, generally by contractual agreements or regulatory requirements. For use in an unclassified balance sheet. Reference 1: http://www.xbrl.org/2003/role/disclosureRef
-Topic 954
-SubTopic 210
-Name Accounting Standards Codification
-Section 45
-Paragraph 4
-Publisher FASB
-URI https://asc.fasb.org/1943274/2147477220/954-210-45-4
Reference 2: http://www.xbrl.org/2003/role/disclosureRef
-Topic 954
-SubTopic 210
-Name Accounting Standards Codification
-Section 50
-Paragraph 2
-Publisher FASB
-URI https://asc.fasb.org/1943274/2147478600/954-210-50-2
| Name: |
us-gaap_RestrictedCashAndInvestments |
| Namespace Prefix: |
us-gaap_ |
| Data Type: |
xbrli:monetaryItemType |
| Balance Type: |
debit |
| Period Type: |
instant |
|
| X |
- DefinitionAmount of accumulated undistributed earnings (deficit). Reference 1: http://fasb.org/us-gaap/role/ref/legacyRef
-Topic 210
-SubTopic 10
-Name Accounting Standards Codification
-Section S99
-Paragraph 1
-Subparagraph (SX 210.5-02(30)(a)(3))
-Publisher FASB
-URI https://asc.fasb.org/1943274/2147480566/210-10-S99-1
Reference 2: http://www.xbrl.org/2003/role/exampleRef
-Topic 852
-SubTopic 10
-Name Accounting Standards Codification
-Section 55
-Paragraph 10
-Publisher FASB
-URI https://asc.fasb.org/1943274/2147481372/852-10-55-10
Reference 3: http://www.xbrl.org/2003/role/disclosureRef
-Topic 944
-SubTopic 40
-Name Accounting Standards Codification
-Section 65
-Paragraph 2
-Subparagraph (g)(2)(i)
-Publisher FASB
-URI https://asc.fasb.org/1943274/2147480016/944-40-65-2
Reference 4: http://www.xbrl.org/2003/role/disclosureRef
-Topic 944
-SubTopic 40
-Name Accounting Standards Codification
-Section 65
-Paragraph 2
-Subparagraph (h)(2)
-Publisher FASB
-URI https://asc.fasb.org/1943274/2147480016/944-40-65-2
Reference 5: http://www.xbrl.org/2003/role/disclosureRef
-Topic 946
-SubTopic 20
-Name Accounting Standards Codification
-Section 50
-Paragraph 11
-Publisher FASB
-URI https://asc.fasb.org/1943274/2147480990/946-20-50-11
Reference 6: http://www.xbrl.org/2003/role/disclosureRef
-Topic 944
-SubTopic 210
-Name Accounting Standards Codification
-Section S99
-Paragraph 1
-Subparagraph (SX 210.7-03(a)(23)(a)(4))
-Publisher FASB
-URI https://asc.fasb.org/1943274/2147478777/944-210-S99-1
Reference 7: http://www.xbrl.org/2003/role/disclosureRef
-Topic 946
-SubTopic 210
-Name Accounting Standards Codification
-Section S99
-Paragraph 1
-Subparagraph (SX 210.6-04(17))
-Publisher FASB
-URI https://asc.fasb.org/1943274/2147479170/946-210-S99-1
Reference 8: http://fasb.org/us-gaap/role/ref/legacyRef
-Topic 505
-SubTopic 10
-Name Accounting Standards Codification
-Section S99
-Paragraph 1
-Subparagraph (SX 210.3-04)
-Publisher FASB
-URI https://asc.fasb.org/1943274/2147480008/505-10-S99-1
| Name: |
us-gaap_RetainedEarningsAccumulatedDeficit |
| Namespace Prefix: |
us-gaap_ |
| Data Type: |
xbrli:monetaryItemType |
| Balance Type: |
credit |
| Period Type: |
instant |
|
| X |
- References
+ Details
| Name: |
us-gaap_StockholdersEquityAbstract |
| Namespace Prefix: |
us-gaap_ |
| Data Type: |
xbrli:stringItemType |
| Balance Type: |
na |
| Period Type: |
duration |
|
v3.24.2
Condensed Consolidated Balance Sheets (Parenthetical) - shares
|
Jun. 30, 2024 |
Dec. 31, 2023 |
| Common Class A |
|
|
| Common shares issued (in shares) |
69,358,504
|
69,199,938
|
| Common shares outstanding (in shares) |
69,358,504
|
69,199,938
|
| Common Class B |
|
|
| Common shares issued (in shares) |
79,233,544
|
79,233,544
|
| Common shares outstanding (in shares) |
79,233,544
|
79,233,544
|
| X |
- DefinitionTotal number of common shares of an entity that have been sold or granted to shareholders (includes common shares that were issued, repurchased and remain in the treasury). These shares represent capital invested by the firm's shareholders and owners, and may be all or only a portion of the number of shares authorized. Shares issued include shares outstanding and shares held in the treasury. Reference 1: http://fasb.org/us-gaap/role/ref/legacyRef
-Topic 210
-SubTopic 10
-Name Accounting Standards Codification
-Section S99
-Paragraph 1
-Subparagraph (SX 210.5-02(29))
-Publisher FASB
-URI https://asc.fasb.org/1943274/2147480566/210-10-S99-1
| Name: |
us-gaap_CommonStockSharesIssued |
| Namespace Prefix: |
us-gaap_ |
| Data Type: |
xbrli:sharesItemType |
| Balance Type: |
na |
| Period Type: |
instant |
|
| X |
- DefinitionNumber of shares of common stock outstanding. Common stock represent the ownership interest in a corporation. Reference 1: http://fasb.org/us-gaap/role/ref/legacyRef
-Name Accounting Standards Codification
-Section 50
-Paragraph 2
-SubTopic 10
-Topic 505
-Publisher FASB
-URI https://asc.fasb.org/1943274/2147481112/505-10-50-2
Reference 2: http://fasb.org/us-gaap/role/ref/legacyRef
-Topic 210
-SubTopic 10
-Name Accounting Standards Codification
-Section S99
-Paragraph 1
-Subparagraph (SX 210.5-02(29))
-Publisher FASB
-URI https://asc.fasb.org/1943274/2147480566/210-10-S99-1
Reference 3: http://www.xbrl.org/2003/role/disclosureRef
-Topic 946
-SubTopic 210
-Name Accounting Standards Codification
-Section S99
-Paragraph 2
-Subparagraph (SX 210.6-05(4))
-Publisher FASB
-URI https://asc.fasb.org/1943274/2147479170/946-210-S99-2
Reference 4: http://www.xbrl.org/2009/role/commonPracticeRef
-Topic 946
-SubTopic 220
-Name Accounting Standards Codification
-Section S99
-Paragraph 3
-Subparagraph (SX 210.6-09(4)(b))
-Publisher FASB
-URI https://asc.fasb.org/1943274/2147479134/946-220-S99-3
Reference 5: http://www.xbrl.org/2003/role/disclosureRef
-Topic 946
-SubTopic 210
-Name Accounting Standards Codification
-Section S99
-Paragraph 1
-Subparagraph (SX 210.6-04(16)(a))
-Publisher FASB
-URI https://asc.fasb.org/1943274/2147479170/946-210-S99-1
Reference 6: http://www.xbrl.org/2009/role/commonPracticeRef
-Topic 946
-SubTopic 220
-Name Accounting Standards Codification
-Section S99
-Paragraph 3
-Subparagraph (SX 210.6-09(7))
-Publisher FASB
-URI https://asc.fasb.org/1943274/2147479134/946-220-S99-3
| Name: |
us-gaap_CommonStockSharesOutstanding |
| Namespace Prefix: |
us-gaap_ |
| Data Type: |
xbrli:sharesItemType |
| Balance Type: |
na |
| Period Type: |
instant |
|
| X |
- Details
| Name: |
us-gaap_StatementClassOfStockAxis=us-gaap_CommonClassAMember |
| Namespace Prefix: |
|
| Data Type: |
na |
| Balance Type: |
|
| Period Type: |
|
|
| X |
- Details
| Name: |
us-gaap_StatementClassOfStockAxis=us-gaap_CommonClassBMember |
| Namespace Prefix: |
|
| Data Type: |
na |
| Balance Type: |
|
| Period Type: |
|
|
v3.24.2
Condensed Consolidated Statements of Operations - USD ($)
$ in Thousands |
3 Months Ended |
6 Months Ended |
Jun. 30, 2024 |
Jun. 30, 2023 |
Jun. 30, 2024 |
Jun. 30, 2023 |
| REVENUES: |
|
|
|
|
| Revenues |
$ 51,192
|
$ 21,349
|
$ 61,127
|
$ 27,050
|
| COSTS AND EXPENSES: |
|
|
|
|
| Selling, general, and administrative |
12,186
|
12,710
|
25,102
|
26,462
|
| Total costs and expenses |
25,379
|
24,190
|
43,181
|
41,480
|
| OTHER INCOME (EXPENSE): |
|
|
|
|
| Interest income |
2,755
|
1,293
|
5,980
|
2,129
|
| Miscellaneous |
26
|
(20)
|
(5,881)
|
(41)
|
| Total other income |
2,781
|
1,273
|
99
|
2,088
|
| EQUITY IN EARNINGS FROM UNCONSOLIDATED ENTITIES |
15,498
|
52,128
|
33,084
|
53,176
|
| INCOME BEFORE INCOME TAX PROVISION |
44,092
|
50,560
|
51,129
|
40,834
|
| INCOME TAX PROVISION |
(5,865)
|
(5)
|
(6,819)
|
(13)
|
| NET INCOME |
38,227
|
50,555
|
44,310
|
40,821
|
| LESS NET INCOME ATTRIBUTABLE TO NONCONTROLLING INTERESTS |
23,505
|
26,984
|
27,262
|
21,786
|
| NET INCOME ATTRIBUTABLE TO THE COMPANY |
$ 14,722
|
$ 23,571
|
$ 17,048
|
$ 19,035
|
| Common Class A |
|
|
|
|
| NET INCOME ATTRIBUTABLE TO THE COMPANY PER CLASS A SHARE |
|
|
|
|
| Basic (in dollars per share) |
$ 0.21
|
$ 0.34
|
$ 0.25
|
$ 0.28
|
| Diluted (in dollar per share) |
$ 0.21
|
$ 0.34
|
$ 0.24
|
$ 0.27
|
| WEIGHTED AVERAGE CLASS A SHARES OUTSTANDING |
|
|
|
|
| Basic (in shares) |
69,239,296
|
68,811,975
|
69,148,940
|
68,758,894
|
| Diluted (in shares) |
145,936,206
|
145,040,689
|
145,906,521
|
144,939,450
|
| Common Class B |
|
|
|
|
| NET INCOME ATTRIBUTABLE TO THE COMPANY PER CLASS A SHARE |
|
|
|
|
| Basic (in dollars per share) |
$ 0.00
|
$ 0.00
|
$ 0.00
|
$ 0.00
|
| Diluted (in dollar per share) |
$ 0.00
|
$ 0.00
|
$ 0.00
|
$ 0.00
|
| WEIGHTED AVERAGE CLASS A SHARES OUTSTANDING |
|
|
|
|
| Basic (in shares) |
79,233,544
|
79,233,544
|
79,233,544
|
79,233,544
|
| Diluted (in shares) |
79,233,544
|
79,233,544
|
79,233,544
|
79,233,544
|
| Land sales |
|
|
|
|
| COSTS AND EXPENSES: |
|
|
|
|
| Cost and expenses |
$ 0
|
$ 0
|
$ 0
|
$ 0
|
| Land sales | Nonrelated Party |
|
|
|
|
| REVENUES: |
|
|
|
|
| Revenues |
307
|
16
|
842
|
(9)
|
| Land sales | Related Party |
|
|
|
|
| REVENUES: |
|
|
|
|
| Revenues |
3
|
(29)
|
0
|
595
|
| Management services |
|
|
|
|
| COSTS AND EXPENSES: |
|
|
|
|
| Cost and expenses |
11,315
|
9,682
|
15,211
|
12,048
|
| Management services | Related Party |
|
|
|
|
| REVENUES: |
|
|
|
|
| Revenues |
50,279
|
20,774
|
59,005
|
25,010
|
| Operating properties |
|
|
|
|
| COSTS AND EXPENSES: |
|
|
|
|
| Cost and expenses |
1,878
|
1,798
|
2,868
|
2,970
|
| Operating properties | Nonrelated Party |
|
|
|
|
| REVENUES: |
|
|
|
|
| Revenues |
$ 603
|
$ 588
|
$ 1,280
|
$ 1,454
|
| X |
- DefinitionThe aggregate costs related to goods produced and sold and services rendered by an entity during the reporting period. This excludes costs incurred during the reporting period related to financial services rendered and other revenue generating activities. Reference 1: http://fasb.org/us-gaap/role/ref/legacyRef
-Topic 220
-SubTopic 10
-Name Accounting Standards Codification
-Section S99
-Paragraph 2
-Subparagraph (SX 210.5-03(2)(d))
-Publisher FASB
-URI https://asc.fasb.org/1943274/2147483621/220-10-S99-2
Reference 2: http://fasb.org/us-gaap/role/ref/legacyRef
-Topic 220
-SubTopic 10
-Name Accounting Standards Codification
-Section S99
-Paragraph 2
-Subparagraph (SX 210.5-03(2)(a))
-Publisher FASB
-URI https://asc.fasb.org/1943274/2147483621/220-10-S99-2
Reference 3: http://www.xbrl.org/2003/role/disclosureRef
-Topic 924
-SubTopic 10
-Name Accounting Standards Codification
-Section S99
-Paragraph 1
-Subparagraph (SAB Topic 11.L)
-Publisher FASB
-URI https://asc.fasb.org/1943274/2147479941/924-10-S99-1
| Name: |
us-gaap_CostOfGoodsAndServicesSold |
| Namespace Prefix: |
us-gaap_ |
| Data Type: |
xbrli:monetaryItemType |
| Balance Type: |
debit |
| Period Type: |
duration |
|
| X |
- DefinitionTotal costs of sales and operating expenses for the period. Reference 1: http://fasb.org/us-gaap/role/ref/legacyRef
-Topic 220
-SubTopic 10
-Name Accounting Standards Codification
-Section S99
-Paragraph 2
-Subparagraph (SX 210.5-03)
-Publisher FASB
-URI https://asc.fasb.org/1943274/2147483621/220-10-S99-2
| Name: |
us-gaap_CostsAndExpenses |
| Namespace Prefix: |
us-gaap_ |
| Data Type: |
xbrli:monetaryItemType |
| Balance Type: |
debit |
| Period Type: |
duration |
|
| X |
- References
+ Details
| Name: |
us-gaap_CostsAndExpensesAbstract |
| Namespace Prefix: |
us-gaap_ |
| Data Type: |
xbrli:stringItemType |
| Balance Type: |
na |
| Period Type: |
duration |
|
| X |
- References
+ Details
| Name: |
us-gaap_EarningsPerShareAbstract |
| Namespace Prefix: |
us-gaap_ |
| Data Type: |
xbrli:stringItemType |
| Balance Type: |
na |
| Period Type: |
duration |
|
| X |
- DefinitionThe amount of net income (loss) for the period per each share of common stock or unit outstanding during the reporting period. Reference 1: http://www.xbrl.org/2003/role/disclosureRef
-Topic 250
-SubTopic 10
-Name Accounting Standards Codification
-Section 50
-Paragraph 6
-Publisher FASB
-URI https://asc.fasb.org/1943274/2147483443/250-10-50-6
Reference 2: http://www.xbrl.org/2003/role/exampleRef
-Topic 260
-SubTopic 10
-Name Accounting Standards Codification
-Section 55
-Paragraph 52
-Publisher FASB
-URI https://asc.fasb.org/1943274/2147482635/260-10-55-52
Reference 3: http://www.xbrl.org/2003/role/disclosureRef
-Topic 805
-SubTopic 60
-Name Accounting Standards Codification
-Section 65
-Paragraph 1
-Subparagraph (g)
-Publisher FASB
-URI https://asc.fasb.org/1943274/2147476176/805-60-65-1
Reference 4: http://www.xbrl.org/2003/role/disclosureRef
-Topic 740
-SubTopic 323
-Name Accounting Standards Codification
-Section 65
-Paragraph 2
-Subparagraph (g)(3)
-Publisher FASB
-URI https://asc.fasb.org/1943274/2147478666/740-323-65-2
Reference 5: http://www.xbrl.org/2003/role/disclosureRef
-Topic 250
-SubTopic 10
-Name Accounting Standards Codification
-Section 50
-Paragraph 3
-Publisher FASB
-URI https://asc.fasb.org/1943274/2147483443/250-10-50-3
Reference 6: http://www.xbrl.org/2003/role/disclosureRef
-Topic 260
-SubTopic 10
-Name Accounting Standards Codification
-Section 55
-Paragraph 15
-Publisher FASB
-URI https://asc.fasb.org/1943274/2147482635/260-10-55-15
Reference 7: http://www.xbrl.org/2003/role/disclosureRef
-Topic 815
-SubTopic 40
-Name Accounting Standards Codification
-Section 65
-Paragraph 1
-Subparagraph (e)(4)
-Publisher FASB
-URI https://asc.fasb.org/1943274/2147480175/815-40-65-1
Reference 8: http://www.xbrl.org/2003/role/disclosureRef
-Topic 815
-SubTopic 40
-Name Accounting Standards Codification
-Section 65
-Paragraph 1
-Subparagraph (f)
-Publisher FASB
-URI https://asc.fasb.org/1943274/2147480175/815-40-65-1
Reference 9: http://www.xbrl.org/2003/role/disclosureRef
-Topic 250
-SubTopic 10
-Name Accounting Standards Codification
-Section 50
-Paragraph 11
-Subparagraph (a)
-Publisher FASB
-URI https://asc.fasb.org/1943274/2147483443/250-10-50-11
Reference 10: http://www.xbrl.org/2003/role/disclosureRef
-Topic 250
-SubTopic 10
-Name Accounting Standards Codification
-Section 50
-Paragraph 11
-Subparagraph (b)
-Publisher FASB
-URI https://asc.fasb.org/1943274/2147483443/250-10-50-11
Reference 11: http://www.xbrl.org/2003/role/disclosureRef
-Topic 250
-SubTopic 10
-Name Accounting Standards Codification
-Section 50
-Paragraph 7
-Subparagraph (a)
-Publisher FASB
-URI https://asc.fasb.org/1943274/2147483443/250-10-50-7
Reference 12: http://www.xbrl.org/2003/role/disclosureRef
-Topic 260
-SubTopic 10
-Name Accounting Standards Codification
-Section 45
-Paragraph 2
-Publisher FASB
-URI https://asc.fasb.org/1943274/2147482689/260-10-45-2
Reference 13: http://www.xbrl.org/2003/role/disclosureRef
-Topic 260
-SubTopic 10
-Name Accounting Standards Codification
-Section 45
-Paragraph 60B
-Subparagraph (d)
-Publisher FASB
-URI https://asc.fasb.org/1943274/2147482689/260-10-45-60B
Reference 14: http://www.xbrl.org/2003/role/disclosureRef
-Topic 250
-SubTopic 10
-Name Accounting Standards Codification
-Section 50
-Paragraph 4
-Publisher FASB
-URI https://asc.fasb.org/1943274/2147483443/250-10-50-4
Reference 15: http://www.xbrl.org/2003/role/disclosureRef
-Topic 260
-SubTopic 10
-Name Accounting Standards Codification
-Section 50
-Paragraph 1
-Subparagraph (a)
-Publisher FASB
-URI https://asc.fasb.org/1943274/2147482662/260-10-50-1
Reference 16: http://www.xbrl.org/2003/role/disclosureRef
-Topic 260
-SubTopic 10
-Name Accounting Standards Codification
-Section 45
-Paragraph 10
-Publisher FASB
-URI https://asc.fasb.org/1943274/2147482689/260-10-45-10
Reference 17: http://www.xbrl.org/2003/role/disclosureRef
-Topic 220
-SubTopic 10
-Name Accounting Standards Codification
-Section S99
-Paragraph 2
-Subparagraph (SX 210.5-03(25))
-Publisher FASB
-URI https://asc.fasb.org/1943274/2147483621/220-10-S99-2
Reference 18: http://www.xbrl.org/2003/role/disclosureRef
-Topic 942
-SubTopic 220
-Name Accounting Standards Codification
-Section S99
-Paragraph 1
-Subparagraph (SX 210.9-04(27))
-Publisher FASB
-URI https://asc.fasb.org/1943274/2147478524/942-220-S99-1
Reference 19: http://www.xbrl.org/2003/role/disclosureRef
-Topic 944
-SubTopic 220
-Name Accounting Standards Codification
-Section S99
-Paragraph 1
-Subparagraph (SX 210.7-04(23))
-Publisher FASB
-URI https://asc.fasb.org/1943274/2147477250/944-220-S99-1
Reference 20: http://www.xbrl.org/2003/role/disclosureRef
-Topic 260
-SubTopic 10
-Name Accounting Standards Codification
-Section 45
-Paragraph 7
-Publisher FASB
-URI https://asc.fasb.org/1943274/2147482689/260-10-45-7
| Name: |
us-gaap_EarningsPerShareBasic |
| Namespace Prefix: |
us-gaap_ |
| Data Type: |
dtr-types:perShareItemType |
| Balance Type: |
na |
| Period Type: |
duration |
|
| X |
- References
+ Details
| Name: |
us-gaap_EarningsPerShareBasicOtherDisclosuresAbstract |
| Namespace Prefix: |
us-gaap_ |
| Data Type: |
xbrli:stringItemType |
| Balance Type: |
na |
| Period Type: |
duration |
|
| X |
- DefinitionThe amount of net income (loss) for the period available to each share of common stock or common unit outstanding during the reporting period and to each share or unit that would have been outstanding assuming the issuance of common shares or units for all dilutive potential common shares or units outstanding during the reporting period. Reference 1: http://www.xbrl.org/2003/role/disclosureRef
-Topic 250
-SubTopic 10
-Name Accounting Standards Codification
-Section 50
-Paragraph 6
-Publisher FASB
-URI https://asc.fasb.org/1943274/2147483443/250-10-50-6
Reference 2: http://www.xbrl.org/2003/role/exampleRef
-Topic 260
-SubTopic 10
-Name Accounting Standards Codification
-Section 55
-Paragraph 52
-Publisher FASB
-URI https://asc.fasb.org/1943274/2147482635/260-10-55-52
Reference 3: http://www.xbrl.org/2003/role/disclosureRef
-Topic 805
-SubTopic 60
-Name Accounting Standards Codification
-Section 65
-Paragraph 1
-Subparagraph (g)
-Publisher FASB
-URI https://asc.fasb.org/1943274/2147476176/805-60-65-1
Reference 4: http://www.xbrl.org/2003/role/disclosureRef
-Topic 740
-SubTopic 323
-Name Accounting Standards Codification
-Section 65
-Paragraph 2
-Subparagraph (g)(3)
-Publisher FASB
-URI https://asc.fasb.org/1943274/2147478666/740-323-65-2
Reference 5: http://www.xbrl.org/2003/role/disclosureRef
-Topic 250
-SubTopic 10
-Name Accounting Standards Codification
-Section 50
-Paragraph 3
-Publisher FASB
-URI https://asc.fasb.org/1943274/2147483443/250-10-50-3
Reference 6: http://www.xbrl.org/2003/role/disclosureRef
-Topic 260
-SubTopic 10
-Name Accounting Standards Codification
-Section 55
-Paragraph 15
-Publisher FASB
-URI https://asc.fasb.org/1943274/2147482635/260-10-55-15
Reference 7: http://www.xbrl.org/2003/role/disclosureRef
-Topic 815
-SubTopic 40
-Name Accounting Standards Codification
-Section 65
-Paragraph 1
-Subparagraph (e)(4)
-Publisher FASB
-URI https://asc.fasb.org/1943274/2147480175/815-40-65-1
Reference 8: http://www.xbrl.org/2003/role/disclosureRef
-Topic 815
-SubTopic 40
-Name Accounting Standards Codification
-Section 65
-Paragraph 1
-Subparagraph (f)
-Publisher FASB
-URI https://asc.fasb.org/1943274/2147480175/815-40-65-1
Reference 9: http://www.xbrl.org/2003/role/disclosureRef
-Topic 250
-SubTopic 10
-Name Accounting Standards Codification
-Section 50
-Paragraph 11
-Subparagraph (a)
-Publisher FASB
-URI https://asc.fasb.org/1943274/2147483443/250-10-50-11
Reference 10: http://www.xbrl.org/2003/role/disclosureRef
-Topic 250
-SubTopic 10
-Name Accounting Standards Codification
-Section 50
-Paragraph 11
-Subparagraph (b)
-Publisher FASB
-URI https://asc.fasb.org/1943274/2147483443/250-10-50-11
Reference 11: http://www.xbrl.org/2003/role/disclosureRef
-Topic 250
-SubTopic 10
-Name Accounting Standards Codification
-Section 50
-Paragraph 7
-Subparagraph (a)
-Publisher FASB
-URI https://asc.fasb.org/1943274/2147483443/250-10-50-7
Reference 12: http://www.xbrl.org/2003/role/disclosureRef
-Topic 260
-SubTopic 10
-Name Accounting Standards Codification
-Section 45
-Paragraph 2
-Publisher FASB
-URI https://asc.fasb.org/1943274/2147482689/260-10-45-2
Reference 13: http://www.xbrl.org/2003/role/disclosureRef
-Topic 260
-SubTopic 10
-Name Accounting Standards Codification
-Section 45
-Paragraph 60B
-Subparagraph (d)
-Publisher FASB
-URI https://asc.fasb.org/1943274/2147482689/260-10-45-60B
Reference 14: http://www.xbrl.org/2003/role/disclosureRef
-Topic 250
-SubTopic 10
-Name Accounting Standards Codification
-Section 50
-Paragraph 4
-Publisher FASB
-URI https://asc.fasb.org/1943274/2147483443/250-10-50-4
Reference 15: http://www.xbrl.org/2003/role/disclosureRef
-Topic 260
-SubTopic 10
-Name Accounting Standards Codification
-Section 50
-Paragraph 1
-Subparagraph (a)
-Publisher FASB
-URI https://asc.fasb.org/1943274/2147482662/260-10-50-1
Reference 16: http://www.xbrl.org/2003/role/disclosureRef
-Topic 220
-SubTopic 10
-Name Accounting Standards Codification
-Section S99
-Paragraph 2
-Subparagraph (SX 210.5-03(25))
-Publisher FASB
-URI https://asc.fasb.org/1943274/2147483621/220-10-S99-2
Reference 17: http://www.xbrl.org/2003/role/disclosureRef
-Topic 942
-SubTopic 220
-Name Accounting Standards Codification
-Section S99
-Paragraph 1
-Subparagraph (SX 210.9-04(27))
-Publisher FASB
-URI https://asc.fasb.org/1943274/2147478524/942-220-S99-1
Reference 18: http://www.xbrl.org/2003/role/disclosureRef
-Topic 944
-SubTopic 220
-Name Accounting Standards Codification
-Section S99
-Paragraph 1
-Subparagraph (SX 210.7-04(23))
-Publisher FASB
-URI https://asc.fasb.org/1943274/2147477250/944-220-S99-1
Reference 19: http://www.xbrl.org/2003/role/disclosureRef
-Topic 260
-SubTopic 10
-Name Accounting Standards Codification
-Section 45
-Paragraph 7
-Publisher FASB
-URI https://asc.fasb.org/1943274/2147482689/260-10-45-7
| Name: |
us-gaap_EarningsPerShareDiluted |
| Namespace Prefix: |
us-gaap_ |
| Data Type: |
dtr-types:perShareItemType |
| Balance Type: |
na |
| Period Type: |
duration |
|
| X |
- DefinitionAmount of income (loss) for proportionate share of equity method investee's income (loss). Reference 1: http://fasb.org/us-gaap/role/ref/legacyRef
-Name Accounting Standards Codification
-Section 45
-Paragraph 28
-Subparagraph (b)
-SubTopic 10
-Topic 230
-Publisher FASB
-URI https://asc.fasb.org/1943274/2147482740/230-10-45-28
Reference 2: http://www.xbrl.org/2003/role/disclosureRef
-Topic 270
-SubTopic 10
-Name Accounting Standards Codification
-Section 50
-Paragraph 1
-Subparagraph (i)
-Publisher FASB
-URI https://asc.fasb.org/1943274/2147482964/270-10-50-1
Reference 3: http://www.xbrl.org/2003/role/disclosureRef
-Topic 280
-SubTopic 10
-Name Accounting Standards Codification
-Section 50
-Paragraph 32
-Subparagraph (ee)
-Publisher FASB
-URI https://asc.fasb.org/1943274/2147482810/280-10-50-32
Reference 4: http://www.xbrl.org/2003/role/disclosureRef
-Topic 944
-SubTopic 220
-Name Accounting Standards Codification
-Section S99
-Paragraph 1
-Subparagraph (SX 210.7-04(10))
-Publisher FASB
-URI https://asc.fasb.org/1943274/2147477250/944-220-S99-1
Reference 5: http://www.xbrl.org/2003/role/disclosureRef
-Topic 323
-SubTopic 10
-Name Accounting Standards Codification
-Section 45
-Paragraph 1
-Publisher FASB
-URI https://asc.fasb.org/1943274/2147481664/323-10-45-1
Reference 6: http://www.xbrl.org/2003/role/disclosureRef
-Topic 280
-SubTopic 10
-Name Accounting Standards Codification
-Section 50
-Paragraph 22
-Subparagraph (g)
-Publisher FASB
-URI https://asc.fasb.org/1943274/2147482810/280-10-50-22
Reference 7: http://fasb.org/us-gaap/role/ref/legacyRef
-Topic 220
-SubTopic 10
-Name Accounting Standards Codification
-Section S99
-Paragraph 2
-Subparagraph (SX 210.5-03(12))
-Publisher FASB
-URI https://asc.fasb.org/1943274/2147483621/220-10-S99-2
Reference 8: http://fasb.org/us-gaap/role/ref/legacyRef
-Topic 942
-SubTopic 220
-Name Accounting Standards Codification
-Section S99
-Paragraph 1
-Subparagraph (SX 210.9-04(13)(f))
-Publisher FASB
-URI https://asc.fasb.org/1943274/2147478524/942-220-S99-1
| Name: |
us-gaap_IncomeLossFromEquityMethodInvestments |
| Namespace Prefix: |
us-gaap_ |
| Data Type: |
xbrli:monetaryItemType |
| Balance Type: |
credit |
| Period Type: |
duration |
|
| X |
- DefinitionAmount of interest income earned from interest bearing assets classified as other.
| Name: |
us-gaap_InterestIncomeOther |
| Namespace Prefix: |
us-gaap_ |
| Data Type: |
xbrli:monetaryItemType |
| Balance Type: |
credit |
| Period Type: |
duration |
|
| X |
- DefinitionThe portion of profit or loss for the period, net of income taxes, which is attributable to the parent. Reference 1: http://www.xbrl.org/2003/role/disclosureRef
-Topic 250
-SubTopic 10
-Name Accounting Standards Codification
-Section 50
-Paragraph 6
-Publisher FASB
-URI https://asc.fasb.org/1943274/2147483443/250-10-50-6
Reference 2: http://www.xbrl.org/2003/role/disclosureRef
-Topic 250
-SubTopic 10
-Name Accounting Standards Codification
-Section 50
-Paragraph 9
-Publisher FASB
-URI https://asc.fasb.org/1943274/2147483443/250-10-50-9
Reference 3: http://www.xbrl.org/2003/role/disclosureRef
-Topic 805
-SubTopic 60
-Name Accounting Standards Codification
-Section 65
-Paragraph 1
-Subparagraph (g)
-Publisher FASB
-URI https://asc.fasb.org/1943274/2147476176/805-60-65-1
Reference 4: http://www.xbrl.org/2003/role/disclosureRef
-Topic 740
-SubTopic 323
-Name Accounting Standards Codification
-Section 65
-Paragraph 2
-Subparagraph (g)(3)
-Publisher FASB
-URI https://asc.fasb.org/1943274/2147478666/740-323-65-2
Reference 5: http://fasb.org/us-gaap/role/ref/legacyRef
-Topic 220
-SubTopic 10
-Name Accounting Standards Codification
-Section S99
-Paragraph 2
-Subparagraph (SX 210.5-03(20))
-Publisher FASB
-URI https://asc.fasb.org/1943274/2147483621/220-10-S99-2
Reference 6: http://www.xbrl.org/2003/role/disclosureRef
-Topic 235
-SubTopic 10
-Name Accounting Standards Codification
-Section S99
-Paragraph 1
-Subparagraph (SX 210.4-08(g)(1)(ii))
-Publisher FASB
-URI https://asc.fasb.org/1943274/2147480678/235-10-S99-1
Reference 7: http://www.xbrl.org/2003/role/disclosureRef
-Topic 323
-SubTopic 10
-Name Accounting Standards Codification
-Section 50
-Paragraph 3
-Subparagraph (c)
-Publisher FASB
-URI https://asc.fasb.org/1943274/2147481687/323-10-50-3
Reference 8: http://www.xbrl.org/2003/role/disclosureRef
-Topic 825
-SubTopic 10
-Name Accounting Standards Codification
-Section 50
-Paragraph 28
-Subparagraph (f)
-Publisher FASB
-URI https://asc.fasb.org/1943274/2147482907/825-10-50-28
Reference 9: http://www.xbrl.org/2003/role/disclosureRef
-Topic 220
-SubTopic 10
-Name Accounting Standards Codification
-Section 50
-Paragraph 6
-Publisher FASB
-URI https://asc.fasb.org/1943274/2147482765/220-10-50-6
Reference 10: http://www.xbrl.org/2003/role/disclosureRef
-Topic 250
-SubTopic 10
-Name Accounting Standards Codification
-Section 50
-Paragraph 3
-Publisher FASB
-URI https://asc.fasb.org/1943274/2147483443/250-10-50-3
Reference 11: http://www.xbrl.org/2003/role/disclosureRef
-Topic 250
-SubTopic 10
-Name Accounting Standards Codification
-Section 50
-Paragraph 1
-Subparagraph (b)(2)
-Publisher FASB
-URI https://asc.fasb.org/1943274/2147483443/250-10-50-1
Reference 12: http://www.xbrl.org/2003/role/disclosureRef
-Topic 815
-SubTopic 40
-Name Accounting Standards Codification
-Section 65
-Paragraph 1
-Subparagraph (f)
-Publisher FASB
-URI https://asc.fasb.org/1943274/2147480175/815-40-65-1
Reference 13: http://www.xbrl.org/2003/role/disclosureRef
-Topic 250
-SubTopic 10
-Name Accounting Standards Codification
-Section 50
-Paragraph 8
-Publisher FASB
-URI https://asc.fasb.org/1943274/2147483443/250-10-50-8
Reference 14: http://www.xbrl.org/2003/role/disclosureRef
-Topic 250
-SubTopic 10
-Name Accounting Standards Codification
-Section 50
-Paragraph 11
-Subparagraph (a)
-Publisher FASB
-URI https://asc.fasb.org/1943274/2147483443/250-10-50-11
Reference 15: http://www.xbrl.org/2003/role/disclosureRef
-Topic 250
-SubTopic 10
-Name Accounting Standards Codification
-Section 50
-Paragraph 11
-Subparagraph (b)
-Publisher FASB
-URI https://asc.fasb.org/1943274/2147483443/250-10-50-11
Reference 16: http://www.xbrl.org/2003/role/disclosureRef
-Topic 250
-SubTopic 10
-Name Accounting Standards Codification
-Section 50
-Paragraph 4
-Publisher FASB
-URI https://asc.fasb.org/1943274/2147483443/250-10-50-4
Reference 17: http://www.xbrl.org/2003/role/exampleRef
-Topic 946
-SubTopic 830
-Name Accounting Standards Codification
-Section 55
-Paragraph 10
-Publisher FASB
-URI https://asc.fasb.org/1943274/2147479168/946-830-55-10
Reference 18: http://www.xbrl.org/2003/role/disclosureRef
-Topic 946
-SubTopic 220
-Name Accounting Standards Codification
-Section 45
-Paragraph 7
-Publisher FASB
-URI https://asc.fasb.org/1943274/2147479105/946-220-45-7
Reference 19: http://www.xbrl.org/2003/role/disclosureRef
-Topic 944
-SubTopic 220
-Name Accounting Standards Codification
-Section S99
-Paragraph 1
-Subparagraph (SX 210.7-04(18))
-Publisher FASB
-URI https://asc.fasb.org/1943274/2147477250/944-220-S99-1
Reference 20: http://www.xbrl.org/2003/role/disclosureRef
-Topic 946
-SubTopic 220
-Name Accounting Standards Codification
-Section S99
-Paragraph 1
-Subparagraph (SX 210.6-07(9))
-Publisher FASB
-URI https://asc.fasb.org/1943274/2147479134/946-220-S99-1
Reference 21: http://www.xbrl.org/2003/role/disclosureRef
-Topic 946
-SubTopic 220
-Name Accounting Standards Codification
-Section S99
-Paragraph 3
-Subparagraph (SX 210.6-09(1)(d))
-Publisher FASB
-URI https://asc.fasb.org/1943274/2147479134/946-220-S99-3
Reference 22: http://www.xbrl.org/2003/role/disclosureRef
-Topic 470
-SubTopic 10
-Name Accounting Standards Codification
-Section S99
-Paragraph 1A
-Subparagraph (SX 210.13-01(a)(4)(i))
-Publisher FASB
-URI https://asc.fasb.org/1943274/2147480097/470-10-S99-1A
Reference 23: http://www.xbrl.org/2009/role/commonPracticeRef
-Topic 470
-SubTopic 10
-Name Accounting Standards Codification
-Section S99
-Paragraph 1A
-Subparagraph (SX 210.13-01(a)(4)(ii))
-Publisher FASB
-URI https://asc.fasb.org/1943274/2147480097/470-10-S99-1A
Reference 24: http://www.xbrl.org/2003/role/disclosureRef
-Topic 470
-SubTopic 10
-Name Accounting Standards Codification
-Section S99
-Paragraph 1A
-Subparagraph (SX 210.13-01(a)(4)(iii)(A))
-Publisher FASB
-URI https://asc.fasb.org/1943274/2147480097/470-10-S99-1A
Reference 25: http://www.xbrl.org/2003/role/disclosureRef
-Topic 470
-SubTopic 10
-Name Accounting Standards Codification
-Section S99
-Paragraph 1A
-Subparagraph (SX 210.13-01(a)(4)(iv))
-Publisher FASB
-URI https://asc.fasb.org/1943274/2147480097/470-10-S99-1A
Reference 26: http://www.xbrl.org/2003/role/disclosureRef
-Topic 470
-SubTopic 10
-Name Accounting Standards Codification
-Section S99
-Paragraph 1A
-Subparagraph (SX 210.13-01(a)(5))
-Publisher FASB
-URI https://asc.fasb.org/1943274/2147480097/470-10-S99-1A
Reference 27: http://www.xbrl.org/2003/role/disclosureRef
-Topic 470
-SubTopic 10
-Name Accounting Standards Codification
-Section S99
-Paragraph 1B
-Subparagraph (SX 210.13-02(a)(4)(i))
-Publisher FASB
-URI https://asc.fasb.org/1943274/2147480097/470-10-S99-1B
Reference 28: http://www.xbrl.org/2003/role/disclosureRef
-Topic 470
-SubTopic 10
-Name Accounting Standards Codification
-Section S99
-Paragraph 1B
-Subparagraph (SX 210.13-02(a)(4)(iii)(A))
-Publisher FASB
-URI https://asc.fasb.org/1943274/2147480097/470-10-S99-1B
Reference 29: http://www.xbrl.org/2003/role/disclosureRef
-Topic 470
-SubTopic 10
-Name Accounting Standards Codification
-Section S99
-Paragraph 1B
-Subparagraph (SX 210.13-02(a)(4)(iii)(B))
-Publisher FASB
-URI https://asc.fasb.org/1943274/2147480097/470-10-S99-1B
Reference 30: http://www.xbrl.org/2003/role/disclosureRef
-Topic 470
-SubTopic 10
-Name Accounting Standards Codification
-Section S99
-Paragraph 1B
-Subparagraph (SX 210.13-02(a)(4)(iv))
-Publisher FASB
-URI https://asc.fasb.org/1943274/2147480097/470-10-S99-1B
Reference 31: http://www.xbrl.org/2003/role/disclosureRef
-Topic 470
-SubTopic 10
-Name Accounting Standards Codification
-Section S99
-Paragraph 1B
-Subparagraph (SX 210.13-02(a)(5))
-Publisher FASB
-URI https://asc.fasb.org/1943274/2147480097/470-10-S99-1B
Reference 32: http://www.xbrl.org/2003/role/disclosureRef
-Topic 260
-SubTopic 10
-Name Accounting Standards Codification
-Section 45
-Paragraph 60B
-Subparagraph (a)
-Publisher FASB
-URI https://asc.fasb.org/1943274/2147482689/260-10-45-60B
Reference 33: http://www.xbrl.org/2003/role/disclosureRef
-Topic 205
-SubTopic 20
-Name Accounting Standards Codification
-Section 50
-Paragraph 7
-Publisher FASB
-URI https://asc.fasb.org/1943274/2147483499/205-20-50-7
Reference 34: http://fasb.org/us-gaap/role/ref/legacyRef
-Topic 230
-SubTopic 10
-Name Accounting Standards Codification
-Section 45
-Paragraph 28
-Publisher FASB
-URI https://asc.fasb.org/1943274/2147482740/230-10-45-28
Reference 35: http://www.xbrl.org/2003/role/disclosureRef
-Topic 220
-SubTopic 10
-Name Accounting Standards Codification
-Section 45
-Paragraph 1A
-Subparagraph (a)
-Publisher FASB
-URI https://asc.fasb.org/1943274/2147482790/220-10-45-1A
Reference 36: http://www.xbrl.org/2003/role/disclosureRef
-Topic 220
-SubTopic 10
-Name Accounting Standards Codification
-Section 45
-Paragraph 1B
-Subparagraph (a)
-Publisher FASB
-URI https://asc.fasb.org/1943274/2147482790/220-10-45-1B
Reference 37: http://fasb.org/us-gaap/role/ref/legacyRef
-Topic 942
-SubTopic 220
-Name Accounting Standards Codification
-Section S99
-Paragraph 1
-Subparagraph (SX 210.9-04(22))
-Publisher FASB
-URI https://asc.fasb.org/1943274/2147478524/942-220-S99-1
| Name: |
us-gaap_NetIncomeLoss |
| Namespace Prefix: |
us-gaap_ |
| Data Type: |
xbrli:monetaryItemType |
| Balance Type: |
credit |
| Period Type: |
duration |
|
| X |
- DefinitionAmount of Net Income (Loss) attributable to noncontrolling interest. Reference 1: http://www.xbrl.org/2003/role/disclosureRef
-Topic 250
-SubTopic 10
-Name Accounting Standards Codification
-Section 50
-Paragraph 6
-Publisher FASB
-URI https://asc.fasb.org/1943274/2147483443/250-10-50-6
Reference 2: http://www.xbrl.org/2003/role/disclosureRef
-Topic 250
-SubTopic 10
-Name Accounting Standards Codification
-Section 50
-Paragraph 9
-Publisher FASB
-URI https://asc.fasb.org/1943274/2147483443/250-10-50-9
Reference 3: http://www.xbrl.org/2003/role/disclosureRef
-Topic 250
-SubTopic 10
-Name Accounting Standards Codification
-Section 50
-Paragraph 8
-Publisher FASB
-URI https://asc.fasb.org/1943274/2147483443/250-10-50-8
Reference 4: http://www.xbrl.org/2003/role/disclosureRef
-Topic 944
-SubTopic 220
-Name Accounting Standards Codification
-Section S99
-Paragraph 1
-Subparagraph (SX 210.7-04(17))
-Publisher FASB
-URI https://asc.fasb.org/1943274/2147477250/944-220-S99-1
Reference 5: http://www.xbrl.org/2009/role/commonPracticeRef
-Topic 220
-SubTopic 10
-Name Accounting Standards Codification
-Section 50
-Paragraph 6
-Publisher FASB
-URI https://asc.fasb.org/1943274/2147482765/220-10-50-6
Reference 6: http://fasb.org/us-gaap/role/ref/legacyRef
-Topic 810
-SubTopic 10
-Name Accounting Standards Codification
-Section 50
-Paragraph 1A
-Subparagraph (a)(2)
-Publisher FASB
-URI https://asc.fasb.org/1943274/2147481203/810-10-50-1A
Reference 7: http://fasb.org/us-gaap/role/ref/legacyRef
-Name Accounting Standards Codification
-Topic 810
-SubTopic 10
-Section 55
-Paragraph 4J
-Publisher FASB
-URI https://asc.fasb.org/1943274/2147481175/810-10-55-4J
Reference 8: http://www.xbrl.org/2003/role/disclosureRef
-Topic 220
-SubTopic 10
-Name Accounting Standards Codification
-Section 45
-Paragraph 1A
-Subparagraph (a)
-Publisher FASB
-URI https://asc.fasb.org/1943274/2147482790/220-10-45-1A
Reference 9: http://www.xbrl.org/2003/role/disclosureRef
-Topic 220
-SubTopic 10
-Name Accounting Standards Codification
-Section 45
-Paragraph 1B
-Subparagraph (a)
-Publisher FASB
-URI https://asc.fasb.org/1943274/2147482790/220-10-45-1B
| Name: |
us-gaap_NetIncomeLossAttributableToNoncontrollingInterest |
| Namespace Prefix: |
us-gaap_ |
| Data Type: |
xbrli:monetaryItemType |
| Balance Type: |
debit |
| Period Type: |
duration |
|
| X |
- DefinitionThe aggregate amount of income or expense from ancillary business-related activities (that is to say, excluding major activities considered part of the normal operations of the business). Reference 1: http://fasb.org/us-gaap/role/ref/legacyRef
-Topic 220
-SubTopic 10
-Name Accounting Standards Codification
-Section S99
-Paragraph 2
-Subparagraph (SX 210.5-03(7))
-Publisher FASB
-URI https://asc.fasb.org/1943274/2147483621/220-10-S99-2
| Name: |
us-gaap_NonoperatingIncomeExpense |
| Namespace Prefix: |
us-gaap_ |
| Data Type: |
xbrli:monetaryItemType |
| Balance Type: |
credit |
| Period Type: |
duration |
|
| X |
- References
+ Details
| Name: |
us-gaap_OtherIncomeDisclosureNonoperatingAbstract |
| Namespace Prefix: |
us-gaap_ |
| Data Type: |
xbrli:stringItemType |
| Balance Type: |
na |
| Period Type: |
duration |
|
| X |
- DefinitionAmount of income (expense) related to nonoperating activities, classified as other. Reference 1: http://fasb.org/us-gaap/role/ref/legacyRef
-Topic 220
-SubTopic 10
-Name Accounting Standards Codification
-Section S99
-Paragraph 2
-Subparagraph (SX 210.5-03(9))
-Publisher FASB
-URI https://asc.fasb.org/1943274/2147483621/220-10-S99-2
| Name: |
us-gaap_OtherNonoperatingIncomeExpense |
| Namespace Prefix: |
us-gaap_ |
| Data Type: |
xbrli:monetaryItemType |
| Balance Type: |
credit |
| Period Type: |
duration |
|
| X |
- DefinitionThe consolidated profit or loss for the period, net of income taxes, including the portion attributable to the noncontrolling interest. Reference 1: http://www.xbrl.org/2003/role/disclosureRef
-Topic 250
-SubTopic 10
-Name Accounting Standards Codification
-Section 50
-Paragraph 6
-Publisher FASB
-URI https://asc.fasb.org/1943274/2147483443/250-10-50-6
Reference 2: http://www.xbrl.org/2003/role/disclosureRef
-Topic 250
-SubTopic 10
-Name Accounting Standards Codification
-Section 50
-Paragraph 9
-Publisher FASB
-URI https://asc.fasb.org/1943274/2147483443/250-10-50-9
Reference 3: http://www.xbrl.org/2003/role/disclosureRef
-Topic 805
-SubTopic 60
-Name Accounting Standards Codification
-Section 65
-Paragraph 1
-Subparagraph (g)
-Publisher FASB
-URI https://asc.fasb.org/1943274/2147476176/805-60-65-1
Reference 4: http://www.xbrl.org/2003/role/disclosureRef
-Topic 740
-SubTopic 323
-Name Accounting Standards Codification
-Section 65
-Paragraph 2
-Subparagraph (g)(3)
-Publisher FASB
-URI https://asc.fasb.org/1943274/2147478666/740-323-65-2
Reference 5: http://www.xbrl.org/2003/role/disclosureRef
-Topic 235
-SubTopic 10
-Name Accounting Standards Codification
-Section S99
-Paragraph 1
-Subparagraph (SX 210.4-08(g)(1)(ii))
-Publisher FASB
-URI https://asc.fasb.org/1943274/2147480678/235-10-S99-1
Reference 6: http://www.xbrl.org/2003/role/disclosureRef
-Topic 323
-SubTopic 10
-Name Accounting Standards Codification
-Section 50
-Paragraph 3
-Subparagraph (c)
-Publisher FASB
-URI https://asc.fasb.org/1943274/2147481687/323-10-50-3
Reference 7: http://www.xbrl.org/2003/role/disclosureRef
-Topic 825
-SubTopic 10
-Name Accounting Standards Codification
-Section 50
-Paragraph 28
-Subparagraph (f)
-Publisher FASB
-URI https://asc.fasb.org/1943274/2147482907/825-10-50-28
Reference 8: http://www.xbrl.org/2003/role/disclosureRef
-Topic 250
-SubTopic 10
-Name Accounting Standards Codification
-Section 50
-Paragraph 1
-Subparagraph (b)(2)
-Publisher FASB
-URI https://asc.fasb.org/1943274/2147483443/250-10-50-1
Reference 9: http://www.xbrl.org/2003/role/disclosureRef
-Topic 815
-SubTopic 40
-Name Accounting Standards Codification
-Section 65
-Paragraph 1
-Subparagraph (f)
-Publisher FASB
-URI https://asc.fasb.org/1943274/2147480175/815-40-65-1
Reference 10: http://www.xbrl.org/2003/role/disclosureRef
-Topic 250
-SubTopic 10
-Name Accounting Standards Codification
-Section 50
-Paragraph 8
-Publisher FASB
-URI https://asc.fasb.org/1943274/2147483443/250-10-50-8
Reference 11: http://www.xbrl.org/2003/role/exampleRef
-Topic 946
-SubTopic 830
-Name Accounting Standards Codification
-Section 55
-Paragraph 11
-Publisher FASB
-URI https://asc.fasb.org/1943274/2147479168/946-830-55-11
Reference 12: http://www.xbrl.org/2003/role/disclosureRef
-Topic 946
-SubTopic 205
-Name Accounting Standards Codification
-Section 45
-Paragraph 3
-Subparagraph (a)
-Publisher FASB
-URI https://asc.fasb.org/1943274/2147478009/946-205-45-3
Reference 13: http://www.xbrl.org/2003/role/disclosureRef
-Topic 946
-SubTopic 220
-Name Accounting Standards Codification
-Section 45
-Paragraph 7
-Publisher FASB
-URI https://asc.fasb.org/1943274/2147479105/946-220-45-7
Reference 14: http://www.xbrl.org/2003/role/disclosureRef
-Topic 944
-SubTopic 220
-Name Accounting Standards Codification
-Section S99
-Paragraph 1
-Subparagraph (SX 210.7-04(16))
-Publisher FASB
-URI https://asc.fasb.org/1943274/2147477250/944-220-S99-1
Reference 15: http://www.xbrl.org/2003/role/disclosureRef
-Topic 946
-SubTopic 220
-Name Accounting Standards Codification
-Section S99
-Paragraph 1
-Subparagraph (SX 210.6-07(9))
-Publisher FASB
-URI https://asc.fasb.org/1943274/2147479134/946-220-S99-1
Reference 16: http://www.xbrl.org/2003/role/disclosureRef
-Topic 946
-SubTopic 220
-Name Accounting Standards Codification
-Section S99
-Paragraph 3
-Subparagraph (SX 210.6-09(1)(d))
-Publisher FASB
-URI https://asc.fasb.org/1943274/2147479134/946-220-S99-3
Reference 17: http://www.xbrl.org/2003/role/disclosureRef
-Topic 810
-SubTopic 10
-Name Accounting Standards Codification
-Section 45
-Paragraph 19
-Publisher FASB
-URI https://asc.fasb.org/1943274/2147481231/810-10-45-19
Reference 18: http://www.xbrl.org/2009/role/commonPracticeRef
-Topic 220
-SubTopic 10
-Name Accounting Standards Codification
-Section 50
-Paragraph 6
-Publisher FASB
-URI https://asc.fasb.org/1943274/2147482765/220-10-50-6
Reference 19: http://www.xbrl.org/2003/role/disclosureRef
-Topic 470
-SubTopic 10
-Name Accounting Standards Codification
-Section S99
-Paragraph 1A
-Subparagraph (SX 210.13-01(a)(4)(i))
-Publisher FASB
-URI https://asc.fasb.org/1943274/2147480097/470-10-S99-1A
Reference 20: http://www.xbrl.org/2009/role/commonPracticeRef
-Topic 470
-SubTopic 10
-Name Accounting Standards Codification
-Section S99
-Paragraph 1A
-Subparagraph (SX 210.13-01(a)(4)(ii))
-Publisher FASB
-URI https://asc.fasb.org/1943274/2147480097/470-10-S99-1A
Reference 21: http://www.xbrl.org/2003/role/disclosureRef
-Topic 470
-SubTopic 10
-Name Accounting Standards Codification
-Section S99
-Paragraph 1A
-Subparagraph (SX 210.13-01(a)(4)(iii)(A))
-Publisher FASB
-URI https://asc.fasb.org/1943274/2147480097/470-10-S99-1A
Reference 22: http://www.xbrl.org/2003/role/disclosureRef
-Topic 470
-SubTopic 10
-Name Accounting Standards Codification
-Section S99
-Paragraph 1A
-Subparagraph (SX 210.13-01(a)(4)(iv))
-Publisher FASB
-URI https://asc.fasb.org/1943274/2147480097/470-10-S99-1A
Reference 23: http://www.xbrl.org/2003/role/disclosureRef
-Topic 470
-SubTopic 10
-Name Accounting Standards Codification
-Section S99
-Paragraph 1A
-Subparagraph (SX 210.13-01(a)(5))
-Publisher FASB
-URI https://asc.fasb.org/1943274/2147480097/470-10-S99-1A
Reference 24: http://www.xbrl.org/2003/role/disclosureRef
-Topic 470
-SubTopic 10
-Name Accounting Standards Codification
-Section S99
-Paragraph 1B
-Subparagraph (SX 210.13-02(a)(4)(i))
-Publisher FASB
-URI https://asc.fasb.org/1943274/2147480097/470-10-S99-1B
Reference 25: http://www.xbrl.org/2003/role/disclosureRef
-Topic 470
-SubTopic 10
-Name Accounting Standards Codification
-Section S99
-Paragraph 1B
-Subparagraph (SX 210.13-02(a)(4)(iii)(A))
-Publisher FASB
-URI https://asc.fasb.org/1943274/2147480097/470-10-S99-1B
Reference 26: http://www.xbrl.org/2003/role/disclosureRef
-Topic 470
-SubTopic 10
-Name Accounting Standards Codification
-Section S99
-Paragraph 1B
-Subparagraph (SX 210.13-02(a)(4)(iii)(B))
-Publisher FASB
-URI https://asc.fasb.org/1943274/2147480097/470-10-S99-1B
Reference 27: http://www.xbrl.org/2003/role/disclosureRef
-Topic 470
-SubTopic 10
-Name Accounting Standards Codification
-Section S99
-Paragraph 1B
-Subparagraph (SX 210.13-02(a)(4)(iv))
-Publisher FASB
-URI https://asc.fasb.org/1943274/2147480097/470-10-S99-1B
Reference 28: http://www.xbrl.org/2003/role/disclosureRef
-Topic 470
-SubTopic 10
-Name Accounting Standards Codification
-Section S99
-Paragraph 1B
-Subparagraph (SX 210.13-02(a)(5))
-Publisher FASB
-URI https://asc.fasb.org/1943274/2147480097/470-10-S99-1B
Reference 29: http://www.xbrl.org/2003/role/disclosureRef
-Topic 942
-SubTopic 235
-Name Accounting Standards Codification
-Section S99
-Paragraph 1
-Subparagraph (SX 210.9-05(b)(2))
-Publisher FASB
-URI https://asc.fasb.org/1943274/2147477314/942-235-S99-1
Reference 30: http://www.xbrl.org/2003/role/disclosureRef
-Topic 205
-SubTopic 20
-Name Accounting Standards Codification
-Section 50
-Paragraph 7
-Publisher FASB
-URI https://asc.fasb.org/1943274/2147483499/205-20-50-7
Reference 31: http://www.xbrl.org/2003/role/exampleRef
-Topic 810
-SubTopic 10
-Name Accounting Standards Codification
-Section 55
-Paragraph 4J
-Publisher FASB
-URI https://asc.fasb.org/1943274/2147481175/810-10-55-4J
Reference 32: http://www.xbrl.org/2003/role/exampleRef
-Topic 810
-SubTopic 10
-Name Accounting Standards Codification
-Section 55
-Paragraph 4K
-Publisher FASB
-URI https://asc.fasb.org/1943274/2147481175/810-10-55-4K
Reference 33: http://www.xbrl.org/2003/role/disclosureRef
-Topic 220
-SubTopic 10
-Name Accounting Standards Codification
-Section 45
-Paragraph 1A
-Subparagraph (a)
-Publisher FASB
-URI https://asc.fasb.org/1943274/2147482790/220-10-45-1A
Reference 34: http://www.xbrl.org/2003/role/disclosureRef
-Topic 220
-SubTopic 10
-Name Accounting Standards Codification
-Section 45
-Paragraph 1B
-Subparagraph (a)
-Publisher FASB
-URI https://asc.fasb.org/1943274/2147482790/220-10-45-1B
Reference 35: http://www.xbrl.org/2003/role/disclosureRef
-Topic 230
-SubTopic 10
-Name Accounting Standards Codification
-Section 45
-Paragraph 2
-Publisher FASB
-URI https://asc.fasb.org/1943274/2147482740/230-10-45-2
Reference 36: http://www.xbrl.org/2003/role/disclosureRef
-Topic 810
-SubTopic 10
-Name Accounting Standards Codification
-Section 50
-Paragraph 1A
-Subparagraph (a)(1)
-Publisher FASB
-URI https://asc.fasb.org/1943274/2147481203/810-10-50-1A
Reference 37: http://www.xbrl.org/2003/role/disclosureRef
-Topic 810
-SubTopic 10
-Name Accounting Standards Codification
-Section 50
-Paragraph 1A
-Subparagraph (c)(1)
-Publisher FASB
-URI https://asc.fasb.org/1943274/2147481203/810-10-50-1A
| Name: |
us-gaap_ProfitLoss |
| Namespace Prefix: |
us-gaap_ |
| Data Type: |
xbrli:monetaryItemType |
| Balance Type: |
credit |
| Period Type: |
duration |
|
| X |
- DefinitionAmount of revenue recognized from goods sold, services rendered, insurance premiums, or other activities that constitute an earning process. Includes, but is not limited to, investment and interest income before deduction of interest expense when recognized as a component of revenue, and sales and trading gain (loss). Reference 1: http://www.xbrl.org/2003/role/exampleRef
-Topic 280
-SubTopic 10
-Name Accounting Standards Codification
-Section 55
-Paragraph 48
-Publisher FASB
-URI https://asc.fasb.org/1943274/2147482785/280-10-55-48
Reference 2: http://www.xbrl.org/2003/role/disclosureRef
-Topic 280
-SubTopic 10
-Name Accounting Standards Codification
-Section 50
-Paragraph 41
-Subparagraph (a)
-Publisher FASB
-URI https://asc.fasb.org/1943274/2147482810/280-10-50-41
Reference 3: http://www.xbrl.org/2003/role/disclosureRef
-Topic 270
-SubTopic 10
-Name Accounting Standards Codification
-Section 50
-Paragraph 1
-Subparagraph (i)
-Publisher FASB
-URI https://asc.fasb.org/1943274/2147482964/270-10-50-1
Reference 4: http://www.xbrl.org/2003/role/disclosureRef
-Topic 280
-SubTopic 10
-Name Accounting Standards Codification
-Section 50
-Paragraph 32
-Subparagraph (ee)
-Publisher FASB
-URI https://asc.fasb.org/1943274/2147482810/280-10-50-32
Reference 5: http://fasb.org/us-gaap/role/ref/otherTransitionRef
-Topic 280
-SubTopic 10
-Name Accounting Standards Codification
-Section 50
-Paragraph 32
-Subparagraph (b)
-Publisher FASB
-URI https://asc.fasb.org/1943274/2147482810/280-10-50-32
Reference 6: http://fasb.org/us-gaap/role/ref/otherTransitionRef
-Topic 280
-SubTopic 10
-Name Accounting Standards Codification
-Section 50
-Paragraph 32
-Subparagraph (a)
-Publisher FASB
-URI https://asc.fasb.org/1943274/2147482810/280-10-50-32
Reference 7: http://www.xbrl.org/2003/role/disclosureRef
-Topic 235
-SubTopic 10
-Name Accounting Standards Codification
-Section S99
-Paragraph 1
-Subparagraph (SX 210.4-08(g)(1)(ii))
-Publisher FASB
-URI https://asc.fasb.org/1943274/2147480678/235-10-S99-1
Reference 8: http://www.xbrl.org/2003/role/disclosureRef
-Topic 323
-SubTopic 10
-Name Accounting Standards Codification
-Section 50
-Paragraph 3
-Subparagraph (c)
-Publisher FASB
-URI https://asc.fasb.org/1943274/2147481687/323-10-50-3
Reference 9: http://www.xbrl.org/2003/role/disclosureRef
-Topic 825
-SubTopic 10
-Name Accounting Standards Codification
-Section 50
-Paragraph 28
-Subparagraph (f)
-Publisher FASB
-URI https://asc.fasb.org/1943274/2147482907/825-10-50-28
Reference 10: http://www.xbrl.org/2003/role/disclosureRef
-Topic 470
-SubTopic 10
-Name Accounting Standards Codification
-Section S99
-Paragraph 1A
-Subparagraph (SX 210.13-01(a)(4)(i))
-Publisher FASB
-URI https://asc.fasb.org/1943274/2147480097/470-10-S99-1A
Reference 11: http://www.xbrl.org/2009/role/commonPracticeRef
-Topic 470
-SubTopic 10
-Name Accounting Standards Codification
-Section S99
-Paragraph 1A
-Subparagraph (SX 210.13-01(a)(4)(ii))
-Publisher FASB
-URI https://asc.fasb.org/1943274/2147480097/470-10-S99-1A
Reference 12: http://www.xbrl.org/2003/role/disclosureRef
-Topic 470
-SubTopic 10
-Name Accounting Standards Codification
-Section S99
-Paragraph 1A
-Subparagraph (SX 210.13-01(a)(4)(iii)(A))
-Publisher FASB
-URI https://asc.fasb.org/1943274/2147480097/470-10-S99-1A
Reference 13: http://www.xbrl.org/2003/role/disclosureRef
-Topic 470
-SubTopic 10
-Name Accounting Standards Codification
-Section S99
-Paragraph 1A
-Subparagraph (SX 210.13-01(a)(4)(iv))
-Publisher FASB
-URI https://asc.fasb.org/1943274/2147480097/470-10-S99-1A
Reference 14: http://www.xbrl.org/2003/role/disclosureRef
-Topic 470
-SubTopic 10
-Name Accounting Standards Codification
-Section S99
-Paragraph 1A
-Subparagraph (SX 210.13-01(a)(5))
-Publisher FASB
-URI https://asc.fasb.org/1943274/2147480097/470-10-S99-1A
Reference 15: http://www.xbrl.org/2003/role/disclosureRef
-Topic 470
-SubTopic 10
-Name Accounting Standards Codification
-Section S99
-Paragraph 1B
-Subparagraph (SX 210.13-02(a)(4)(i))
-Publisher FASB
-URI https://asc.fasb.org/1943274/2147480097/470-10-S99-1B
Reference 16: http://www.xbrl.org/2003/role/disclosureRef
-Topic 470
-SubTopic 10
-Name Accounting Standards Codification
-Section S99
-Paragraph 1B
-Subparagraph (SX 210.13-02(a)(4)(iii)(A))
-Publisher FASB
-URI https://asc.fasb.org/1943274/2147480097/470-10-S99-1B
Reference 17: http://www.xbrl.org/2003/role/disclosureRef
-Topic 470
-SubTopic 10
-Name Accounting Standards Codification
-Section S99
-Paragraph 1B
-Subparagraph (SX 210.13-02(a)(4)(iii)(B))
-Publisher FASB
-URI https://asc.fasb.org/1943274/2147480097/470-10-S99-1B
Reference 18: http://www.xbrl.org/2003/role/disclosureRef
-Topic 470
-SubTopic 10
-Name Accounting Standards Codification
-Section S99
-Paragraph 1B
-Subparagraph (SX 210.13-02(a)(4)(iv))
-Publisher FASB
-URI https://asc.fasb.org/1943274/2147480097/470-10-S99-1B
Reference 19: http://www.xbrl.org/2003/role/disclosureRef
-Topic 470
-SubTopic 10
-Name Accounting Standards Codification
-Section S99
-Paragraph 1B
-Subparagraph (SX 210.13-02(a)(5))
-Publisher FASB
-URI https://asc.fasb.org/1943274/2147480097/470-10-S99-1B
Reference 20: http://www.xbrl.org/2003/role/disclosureRef
-Topic 280
-SubTopic 10
-Name Accounting Standards Codification
-Section 50
-Paragraph 30
-Subparagraph (a)
-Publisher FASB
-URI https://asc.fasb.org/1943274/2147482810/280-10-50-30
Reference 21: http://www.xbrl.org/2003/role/disclosureRef
-Topic 280
-SubTopic 10
-Name Accounting Standards Codification
-Section 50
-Paragraph 42
-Publisher FASB
-URI https://asc.fasb.org/1943274/2147482810/280-10-50-42
Reference 22: http://www.xbrl.org/2003/role/disclosureRef
-Topic 280
-SubTopic 10
-Name Accounting Standards Codification
-Section 50
-Paragraph 22
-Subparagraph (b)
-Publisher FASB
-URI https://asc.fasb.org/1943274/2147482810/280-10-50-22
Reference 23: http://www.xbrl.org/2003/role/disclosureRef
-Topic 280
-SubTopic 10
-Name Accounting Standards Codification
-Section 50
-Paragraph 40
-Publisher FASB
-URI https://asc.fasb.org/1943274/2147482810/280-10-50-40
Reference 24: http://www.xbrl.org/2003/role/disclosureRef
-Topic 280
-SubTopic 10
-Name Accounting Standards Codification
-Section 50
-Paragraph 22
-Subparagraph (a)
-Publisher FASB
-URI https://asc.fasb.org/1943274/2147482810/280-10-50-22
Reference 25: http://www.xbrl.org/2003/role/disclosureRef
-Topic 942
-SubTopic 235
-Name Accounting Standards Codification
-Section S99
-Paragraph 1
-Subparagraph (SX 210.9-05(b)(2))
-Publisher FASB
-URI https://asc.fasb.org/1943274/2147477314/942-235-S99-1
Reference 26: http://www.xbrl.org/2003/role/disclosureRef
-Topic 220
-SubTopic 10
-Name Accounting Standards Codification
-Section S99
-Paragraph 2
-Subparagraph (SX 210.5-03(1))
-Publisher FASB
-URI https://asc.fasb.org/1943274/2147483621/220-10-S99-2
| Name: |
us-gaap_Revenues |
| Namespace Prefix: |
us-gaap_ |
| Data Type: |
xbrli:monetaryItemType |
| Balance Type: |
credit |
| Period Type: |
duration |
|
| X |
- References
+ Details
| Name: |
us-gaap_RevenuesAbstract |
| Namespace Prefix: |
us-gaap_ |
| Data Type: |
xbrli:stringItemType |
| Balance Type: |
na |
| Period Type: |
duration |
|
| X |
- DefinitionThe aggregate total costs related to selling a firm's product and services, as well as all other general and administrative expenses. Direct selling expenses (for example, credit, warranty, and advertising) are expenses that can be directly linked to the sale of specific products. Indirect selling expenses are expenses that cannot be directly linked to the sale of specific products, for example telephone expenses, Internet, and postal charges. General and administrative expenses include salaries of non-sales personnel, rent, utilities, communication, etc. Reference 1: http://fasb.org/us-gaap/role/ref/legacyRef
-Topic 220
-SubTopic 10
-Name Accounting Standards Codification
-Section S99
-Paragraph 2
-Subparagraph (SX 210.5-03(4))
-Publisher FASB
-URI https://asc.fasb.org/1943274/2147483621/220-10-S99-2
| Name: |
us-gaap_SellingGeneralAndAdministrativeExpense |
| Namespace Prefix: |
us-gaap_ |
| Data Type: |
xbrli:monetaryItemType |
| Balance Type: |
debit |
| Period Type: |
duration |
|
| X |
- DefinitionThe average number of shares or units issued and outstanding that are used in calculating diluted EPS or earnings per unit (EPU), determined based on the timing of issuance of shares or units in the period. Reference 1: http://www.xbrl.org/2003/role/disclosureRef
-Topic 260
-SubTopic 10
-Name Accounting Standards Codification
-Section 50
-Paragraph 1
-Subparagraph (a)
-Publisher FASB
-URI https://asc.fasb.org/1943274/2147482662/260-10-50-1
Reference 2: http://www.xbrl.org/2003/role/disclosureRef
-Topic 260
-SubTopic 10
-Name Accounting Standards Codification
-Section 45
-Paragraph 16
-Publisher FASB
-URI https://asc.fasb.org/1943274/2147482689/260-10-45-16
| Name: |
us-gaap_WeightedAverageNumberOfDilutedSharesOutstanding |
| Namespace Prefix: |
us-gaap_ |
| Data Type: |
xbrli:sharesItemType |
| Balance Type: |
na |
| Period Type: |
duration |
|
| X |
- DefinitionNumber of [basic] shares or units, after adjustment for contingently issuable shares or units and other shares or units not deemed outstanding, determined by relating the portion of time within a reporting period that common shares or units have been outstanding to the total time in that period. Reference 1: http://www.xbrl.org/2003/role/disclosureRef
-Topic 260
-SubTopic 10
-Name Accounting Standards Codification
-Section 50
-Paragraph 1
-Subparagraph (a)
-Publisher FASB
-URI https://asc.fasb.org/1943274/2147482662/260-10-50-1
Reference 2: http://www.xbrl.org/2003/role/disclosureRef
-Topic 260
-SubTopic 10
-Name Accounting Standards Codification
-Section 45
-Paragraph 10
-Publisher FASB
-URI https://asc.fasb.org/1943274/2147482689/260-10-45-10
| Name: |
us-gaap_WeightedAverageNumberOfSharesOutstandingBasic |
| Namespace Prefix: |
us-gaap_ |
| Data Type: |
xbrli:sharesItemType |
| Balance Type: |
na |
| Period Type: |
duration |
|
| X |
- Details
| Name: |
us-gaap_StatementClassOfStockAxis=us-gaap_CommonClassAMember |
| Namespace Prefix: |
|
| Data Type: |
na |
| Balance Type: |
|
| Period Type: |
|
|
| X |
- Details
| Name: |
us-gaap_StatementClassOfStockAxis=us-gaap_CommonClassBMember |
| Namespace Prefix: |
|
| Data Type: |
na |
| Balance Type: |
|
| Period Type: |
|
|
| X |
- Details
| Name: |
srt_ProductOrServiceAxis=us-gaap_LandMember |
| Namespace Prefix: |
|
| Data Type: |
na |
| Balance Type: |
|
| Period Type: |
|
|
| X |
- Details
| Name: |
srt_ProductOrServiceAxis=us-gaap_ManagementServiceMember |
| Namespace Prefix: |
|
| Data Type: |
na |
| Balance Type: |
|
| Period Type: |
|
|
| X |
- Details
| Name: |
srt_ProductOrServiceAxis=fph_OperatingPropertiesMember |
| Namespace Prefix: |
|
| Data Type: |
na |
| Balance Type: |
|
| Period Type: |
|
|
v3.24.2
Condensed Consolidated Statements of Comprehensive Income (Loss) - USD ($)
$ in Thousands |
3 Months Ended |
6 Months Ended |
Jun. 30, 2024 |
Jun. 30, 2023 |
Jun. 30, 2024 |
Jun. 30, 2023 |
| Statement of Comprehensive Income [Abstract] |
|
|
|
|
| Net income |
$ 38,227
|
$ 50,555
|
$ 44,310
|
$ 40,821
|
| OTHER COMPREHENSIVE INCOME: |
|
|
|
|
| Reclassification of actuarial loss on defined benefit pension plan included in net income |
13
|
40
|
27
|
81
|
| Other comprehensive income before taxes |
13
|
40
|
27
|
81
|
| INCOME TAX PROVISION RELATED TO OTHER COMPREHENSIVE INCOME |
(2)
|
0
|
(4)
|
0
|
| OTHER COMPREHENSIVE INCOME—Net of tax |
11
|
40
|
23
|
81
|
| COMPREHENSIVE INCOME |
38,238
|
50,595
|
44,333
|
40,902
|
| LESS COMPREHENSIVE INCOME ATTRIBUTABLE TO NONCONTROLLING INTERESTS |
23,510
|
26,999
|
27,272
|
21,816
|
| COMPREHENSIVE INCOME ATTRIBUTABLE TO THE COMPANY |
$ 14,728
|
$ 23,596
|
$ 17,061
|
$ 19,086
|
| X |
- DefinitionAmount after tax of increase (decrease) in equity from transactions and other events and circumstances from net income and other comprehensive income, attributable to parent entity. Excludes changes in equity resulting from investments by owners and distributions to owners. Reference 1: http://www.xbrl.org/2003/role/disclosureRef
-Topic 220
-SubTopic 10
-Name Accounting Standards Codification
-Section S99
-Paragraph 2
-Subparagraph (SX 210.5-03(24))
-Publisher FASB
-URI https://asc.fasb.org/1943274/2147483621/220-10-S99-2
Reference 2: http://www.xbrl.org/2003/role/disclosureRef
-Topic 942
-SubTopic 220
-Name Accounting Standards Codification
-Section S99
-Paragraph 1
-Subparagraph (SX 210.9-04(26))
-Publisher FASB
-URI https://asc.fasb.org/1943274/2147478524/942-220-S99-1
Reference 3: http://www.xbrl.org/2003/role/disclosureRef
-Topic 944
-SubTopic 220
-Name Accounting Standards Codification
-Section S99
-Paragraph 1
-Subparagraph (SX 210.7-04(22))
-Publisher FASB
-URI https://asc.fasb.org/1943274/2147477250/944-220-S99-1
Reference 4: http://www.xbrl.org/2003/role/disclosureRef
-Topic 220
-SubTopic 10
-Name Accounting Standards Codification
-Section 45
-Paragraph 1A
-Subparagraph (c)
-Publisher FASB
-URI https://asc.fasb.org/1943274/2147482790/220-10-45-1A
Reference 5: http://www.xbrl.org/2003/role/disclosureRef
-Topic 220
-SubTopic 10
-Name Accounting Standards Codification
-Section 45
-Paragraph 1B
-Subparagraph (b)
-Publisher FASB
-URI https://asc.fasb.org/1943274/2147482790/220-10-45-1B
Reference 6: http://www.xbrl.org/2003/role/disclosureRef
-Topic 944
-SubTopic 220
-Name Accounting Standards Codification
-Section S99
-Paragraph 1
-Subparagraph (SX 210.7-04(20))
-Publisher FASB
-URI https://asc.fasb.org/1943274/2147477250/944-220-S99-1
Reference 7: http://fasb.org/us-gaap/role/ref/legacyRef
-Name Accounting Standards Codification
-Topic 220
-SubTopic 10
-Section 45
-Paragraph 5
-Publisher FASB
-URI https://asc.fasb.org/1943274/2147482790/220-10-45-5
| Name: |
us-gaap_ComprehensiveIncomeNetOfTax |
| Namespace Prefix: |
us-gaap_ |
| Data Type: |
xbrli:monetaryItemType |
| Balance Type: |
credit |
| Period Type: |
duration |
|
| X |
- DefinitionAmount after tax of increase (decrease) in equity from transactions and other events and circumstances from net income (loss) and other comprehensive income (loss), attributable to noncontrolling interests. Excludes changes in equity resulting from investments by owners and distributions to owners. Reference 1: http://fasb.org/us-gaap/role/ref/legacyRef
-Name Accounting Standards Codification
-Section 45
-Paragraph 20
-SubTopic 10
-Topic 810
-Publisher FASB
-URI https://asc.fasb.org/1943274/2147481231/810-10-45-20
Reference 2: http://www.xbrl.org/2003/role/disclosureRef
-Topic 220
-SubTopic 10
-Name Accounting Standards Codification
-Section S99
-Paragraph 2
-Subparagraph (SX 210.5-03(23))
-Publisher FASB
-URI https://asc.fasb.org/1943274/2147483621/220-10-S99-2
Reference 3: http://www.xbrl.org/2003/role/disclosureRef
-Topic 942
-SubTopic 220
-Name Accounting Standards Codification
-Section S99
-Paragraph 1
-Subparagraph (SX 210.9-04(25))
-Publisher FASB
-URI https://asc.fasb.org/1943274/2147478524/942-220-S99-1
Reference 4: http://www.xbrl.org/2003/role/disclosureRef
-Topic 944
-SubTopic 220
-Name Accounting Standards Codification
-Section S99
-Paragraph 1
-Subparagraph (SX 210.7-04(21))
-Publisher FASB
-URI https://asc.fasb.org/1943274/2147477250/944-220-S99-1
Reference 5: http://fasb.org/us-gaap/role/ref/legacyRef
-Name Accounting Standards Codification
-Topic 810
-SubTopic 10
-Section 45
-Paragraph 21
-Publisher FASB
-URI https://asc.fasb.org/1943274/2147481231/810-10-45-21
Reference 6: http://www.xbrl.org/2003/role/disclosureRef
-Topic 220
-SubTopic 10
-Name Accounting Standards Codification
-Section 45
-Paragraph 1A
-Subparagraph (c)
-Publisher FASB
-URI https://asc.fasb.org/1943274/2147482790/220-10-45-1A
Reference 7: http://www.xbrl.org/2003/role/disclosureRef
-Topic 220
-SubTopic 10
-Name Accounting Standards Codification
-Section 45
-Paragraph 1B
-Subparagraph (b)
-Publisher FASB
-URI https://asc.fasb.org/1943274/2147482790/220-10-45-1B
Reference 8: http://www.xbrl.org/2003/role/disclosureRef
-Topic 944
-SubTopic 220
-Name Accounting Standards Codification
-Section S99
-Paragraph 1
-Subparagraph (SX 210.7-04(20))
-Publisher FASB
-URI https://asc.fasb.org/1943274/2147477250/944-220-S99-1
Reference 9: http://fasb.org/us-gaap/role/ref/legacyRef
-Name Accounting Standards Codification
-Topic 810
-SubTopic 10
-Section 55
-Paragraph 4K
-Publisher FASB
-URI https://asc.fasb.org/1943274/2147481175/810-10-55-4K
| Name: |
us-gaap_ComprehensiveIncomeNetOfTaxAttributableToNoncontrollingInterest |
| Namespace Prefix: |
us-gaap_ |
| Data Type: |
xbrli:monetaryItemType |
| Balance Type: |
debit |
| Period Type: |
duration |
|
| X |
- DefinitionAmount after tax of increase (decrease) in equity from transactions and other events and circumstances from net income and other comprehensive income. Excludes changes in equity resulting from investments by owners and distributions to owners. Reference 1: http://fasb.org/us-gaap/role/ref/legacyRef
-Topic 810
-SubTopic 10
-Name Accounting Standards Codification
-Section 45
-Paragraph 19
-Publisher FASB
-URI https://asc.fasb.org/1943274/2147481231/810-10-45-19
Reference 2: http://www.xbrl.org/2003/role/disclosureRef
-Topic 220
-SubTopic 10
-Name Accounting Standards Codification
-Section S99
-Paragraph 2
-Subparagraph (SX 210.5-03(22))
-Publisher FASB
-URI https://asc.fasb.org/1943274/2147483621/220-10-S99-2
Reference 3: http://www.xbrl.org/2003/role/disclosureRef
-Topic 942
-SubTopic 220
-Name Accounting Standards Codification
-Section S99
-Paragraph 1
-Subparagraph (SX 210.9-04(24))
-Publisher FASB
-URI https://asc.fasb.org/1943274/2147478524/942-220-S99-1
Reference 4: http://www.xbrl.org/2003/role/disclosureRef
-Topic 220
-SubTopic 10
-Name Accounting Standards Codification
-Section 45
-Paragraph 1A
-Subparagraph (c)
-Publisher FASB
-URI https://asc.fasb.org/1943274/2147482790/220-10-45-1A
Reference 5: http://www.xbrl.org/2003/role/disclosureRef
-Topic 220
-SubTopic 10
-Name Accounting Standards Codification
-Section 45
-Paragraph 1B
-Subparagraph (b)
-Publisher FASB
-URI https://asc.fasb.org/1943274/2147482790/220-10-45-1B
Reference 6: http://www.xbrl.org/2003/role/disclosureRef
-Topic 944
-SubTopic 220
-Name Accounting Standards Codification
-Section S99
-Paragraph 1
-Subparagraph (SX 210.7-04(20))
-Publisher FASB
-URI https://asc.fasb.org/1943274/2147477250/944-220-S99-1
Reference 7: http://fasb.org/us-gaap/role/ref/legacyRef
-Name Accounting Standards Codification
-Topic 810
-SubTopic 10
-Section 55
-Paragraph 4K
-Publisher FASB
-URI https://asc.fasb.org/1943274/2147481175/810-10-55-4K
| Name: |
us-gaap_ComprehensiveIncomeNetOfTaxIncludingPortionAttributableToNoncontrollingInterest |
| Namespace Prefix: |
us-gaap_ |
| Data Type: |
xbrli:monetaryItemType |
| Balance Type: |
credit |
| Period Type: |
duration |
|
| X |
- DefinitionAmount before tax, after reclassification adjustments of other comprehensive income (loss). Reference 1: http://www.xbrl.org/2003/role/disclosureRef
-Topic 830
-SubTopic 30
-Name Accounting Standards Codification
-Section 50
-Paragraph 1
-Publisher FASB
-URI https://asc.fasb.org/1943274/2147481674/830-30-50-1
Reference 2: http://www.xbrl.org/2003/role/disclosureRef
-Topic 830
-SubTopic 30
-Name Accounting Standards Codification
-Section 45
-Paragraph 17
-Publisher FASB
-URI https://asc.fasb.org/1943274/2147481694/830-30-45-17
Reference 3: http://www.xbrl.org/2003/role/disclosureRef
-Topic 944
-SubTopic 220
-Name Accounting Standards Codification
-Section S99
-Paragraph 1
-Subparagraph (SX 210.7-04(19))
-Publisher FASB
-URI https://asc.fasb.org/1943274/2147477250/944-220-S99-1
Reference 4: http://www.xbrl.org/2009/role/commonPracticeRef
-Topic 220
-SubTopic 10
-Name Accounting Standards Codification
-Section 50
-Paragraph 4
-Publisher FASB
-URI https://asc.fasb.org/1943274/2147482765/220-10-50-4
Reference 5: http://www.xbrl.org/2009/role/commonPracticeRef
-Topic 220
-SubTopic 10
-Name Accounting Standards Codification
-Section 50
-Paragraph 5
-Publisher FASB
-URI https://asc.fasb.org/1943274/2147482765/220-10-50-5
Reference 6: http://www.xbrl.org/2003/role/disclosureRef
-Topic 830
-SubTopic 30
-Name Accounting Standards Codification
-Section 45
-Paragraph 20
-Publisher FASB
-URI https://asc.fasb.org/1943274/2147481694/830-30-45-20
Reference 7: http://www.xbrl.org/2003/role/disclosureRef
-Topic 220
-SubTopic 10
-Name Accounting Standards Codification
-Section S99
-Paragraph 2
-Subparagraph (SX 210.5-03(21))
-Publisher FASB
-URI https://asc.fasb.org/1943274/2147483621/220-10-S99-2
Reference 8: http://www.xbrl.org/2003/role/disclosureRef
-Topic 942
-SubTopic 220
-Name Accounting Standards Codification
-Section S99
-Paragraph 1
-Subparagraph (SX 210.9-04(23))
-Publisher FASB
-URI https://asc.fasb.org/1943274/2147478524/942-220-S99-1
| Name: |
us-gaap_OtherComprehensiveIncomeLossBeforeTax |
| Namespace Prefix: |
us-gaap_ |
| Data Type: |
xbrli:monetaryItemType |
| Balance Type: |
credit |
| Period Type: |
duration |
|
| X |
- References
+ Details
| Name: |
us-gaap_OtherComprehensiveIncomeLossBeforeTaxPeriodIncreaseDecreaseAbstract |
| Namespace Prefix: |
us-gaap_ |
| Data Type: |
xbrli:stringItemType |
| Balance Type: |
na |
| Period Type: |
duration |
|
| X |
- DefinitionAmount after tax and reclassification adjustments of other comprehensive income (loss). Reference 1: http://fasb.org/us-gaap/role/ref/legacyRef
-Name Accounting Standards Codification
-Section 50
-Paragraph 2
-SubTopic 10
-Topic 505
-Publisher FASB
-URI https://asc.fasb.org/1943274/2147481112/505-10-50-2
Reference 2: http://www.xbrl.org/2003/role/disclosureRef
-Topic 250
-SubTopic 10
-Name Accounting Standards Codification
-Section 50
-Paragraph 6
-Publisher FASB
-URI https://asc.fasb.org/1943274/2147483443/250-10-50-6
Reference 3: http://www.xbrl.org/2003/role/disclosureRef
-Topic 830
-SubTopic 30
-Name Accounting Standards Codification
-Section 50
-Paragraph 1
-Publisher FASB
-URI https://asc.fasb.org/1943274/2147481674/830-30-50-1
Reference 4: http://www.xbrl.org/2003/role/disclosureRef
-Topic 830
-SubTopic 30
-Name Accounting Standards Codification
-Section 45
-Paragraph 17
-Publisher FASB
-URI https://asc.fasb.org/1943274/2147481694/830-30-45-17
Reference 5: http://www.xbrl.org/2003/role/disclosureRef
-Topic 944
-SubTopic 220
-Name Accounting Standards Codification
-Section S99
-Paragraph 1
-Subparagraph (SX 210.7-04(19))
-Publisher FASB
-URI https://asc.fasb.org/1943274/2147477250/944-220-S99-1
Reference 6: http://www.xbrl.org/2009/role/commonPracticeRef
-Topic 220
-SubTopic 10
-Name Accounting Standards Codification
-Section 50
-Paragraph 4
-Publisher FASB
-URI https://asc.fasb.org/1943274/2147482765/220-10-50-4
Reference 7: http://www.xbrl.org/2009/role/commonPracticeRef
-Topic 220
-SubTopic 10
-Name Accounting Standards Codification
-Section 50
-Paragraph 5
-Publisher FASB
-URI https://asc.fasb.org/1943274/2147482765/220-10-50-5
Reference 8: http://www.xbrl.org/2003/role/disclosureRef
-Topic 830
-SubTopic 30
-Name Accounting Standards Codification
-Section 45
-Paragraph 20
-Publisher FASB
-URI https://asc.fasb.org/1943274/2147481694/830-30-45-20
Reference 9: http://www.xbrl.org/2003/role/disclosureRef
-Topic 220
-SubTopic 10
-Name Accounting Standards Codification
-Section S99
-Paragraph 2
-Subparagraph (SX 210.5-03(21))
-Publisher FASB
-URI https://asc.fasb.org/1943274/2147483621/220-10-S99-2
Reference 10: http://www.xbrl.org/2003/role/disclosureRef
-Topic 942
-SubTopic 220
-Name Accounting Standards Codification
-Section S99
-Paragraph 1
-Subparagraph (SX 210.9-04(23))
-Publisher FASB
-URI https://asc.fasb.org/1943274/2147478524/942-220-S99-1
Reference 11: http://www.xbrl.org/2003/role/disclosureRef
-Topic 220
-SubTopic 10
-Name Accounting Standards Codification
-Section 45
-Paragraph 1B
-Subparagraph (b)
-Publisher FASB
-URI https://asc.fasb.org/1943274/2147482790/220-10-45-1B
Reference 12: http://fasb.org/us-gaap/role/ref/legacyRef
-Name Accounting Standards Codification
-Section 55
-Paragraph 15
-SubTopic 10
-Topic 220
-Publisher FASB
-URI https://asc.fasb.org/1943274/2147482739/220-10-55-15
Reference 13: http://www.xbrl.org/2003/role/disclosureRef
-Topic 220
-SubTopic 10
-Name Accounting Standards Codification
-Section 45
-Paragraph 1A
-Subparagraph (b)
-Publisher FASB
-URI https://asc.fasb.org/1943274/2147482790/220-10-45-1A
| Name: |
us-gaap_OtherComprehensiveIncomeLossNetOfTax |
| Namespace Prefix: |
us-gaap_ |
| Data Type: |
xbrli:monetaryItemType |
| Balance Type: |
credit |
| Period Type: |
duration |
|
| X |
- DefinitionAmount, before tax, of reclassification adjustment from accumulated other comprehensive income (loss) for gain (loss) of defined benefit plan. Reference 1: http://fasb.org/us-gaap/role/ref/legacyRef
-Name Accounting Standards Codification
-Section 45
-Paragraph 15
-SubTopic 10
-Topic 220
-Publisher FASB
-URI https://asc.fasb.org/1943274/2147482790/220-10-45-15
Reference 2: http://fasb.org/us-gaap/role/ref/legacyRef
-Topic 220
-SubTopic 10
-Name Accounting Standards Codification
-Section 45
-Paragraph 11
-Publisher FASB
-URI https://asc.fasb.org/1943274/2147482790/220-10-45-11
Reference 3: http://www.xbrl.org/2003/role/disclosureRef
-Topic 715
-SubTopic 20
-Name Accounting Standards Codification
-Section 50
-Paragraph 1
-Subparagraph (i)
-Publisher FASB
-URI https://asc.fasb.org/1943274/2147480506/715-20-50-1
Reference 4: http://www.xbrl.org/2003/role/disclosureRef
-Topic 220
-SubTopic 10
-Name Accounting Standards Codification
-Section 45
-Paragraph 17A
-Publisher FASB
-URI https://asc.fasb.org/1943274/2147482790/220-10-45-17A
| Name: |
us-gaap_OtherComprehensiveIncomeLossReclassificationAdjustmentFromAOCIPensionAndOtherPostretirementBenefitPlansForNetGainLossBeforeTax |
| Namespace Prefix: |
us-gaap_ |
| Data Type: |
xbrli:monetaryItemType |
| Balance Type: |
debit |
| Period Type: |
duration |
|
| X |
- DefinitionAmount of tax expense (benefit) allocated to other comprehensive income (loss). Reference 1: http://fasb.org/us-gaap/role/ref/legacyRef
-Name Accounting Standards Codification
-Section 45
-Paragraph 12
-SubTopic 10
-Topic 220
-Publisher FASB
-URI https://asc.fasb.org/1943274/2147482790/220-10-45-12
Reference 2: http://www.xbrl.org/2003/role/disclosureRef
-Topic 220
-SubTopic 10
-Name Accounting Standards Codification
-Section 50
-Paragraph 4
-Publisher FASB
-URI https://asc.fasb.org/1943274/2147482765/220-10-50-4
Reference 3: http://www.xbrl.org/2003/role/disclosureRef
-Topic 830
-SubTopic 30
-Name Accounting Standards Codification
-Section 50
-Paragraph 1
-Publisher FASB
-URI https://asc.fasb.org/1943274/2147481674/830-30-50-1
Reference 4: http://www.xbrl.org/2003/role/disclosureRef
-Topic 830
-SubTopic 30
-Name Accounting Standards Codification
-Section 45
-Paragraph 17
-Publisher FASB
-URI https://asc.fasb.org/1943274/2147481694/830-30-45-17
Reference 5: http://www.xbrl.org/2003/role/disclosureRef
-Topic 830
-SubTopic 30
-Name Accounting Standards Codification
-Section 45
-Paragraph 20
-Subparagraph (c)
-Publisher FASB
-URI https://asc.fasb.org/1943274/2147481694/830-30-45-20
Reference 6: http://www.xbrl.org/2003/role/disclosureRef
-Topic 944
-SubTopic 220
-Name Accounting Standards Codification
-Section S99
-Paragraph 1
-Subparagraph (SX 210.7-04(19))
-Publisher FASB
-URI https://asc.fasb.org/1943274/2147477250/944-220-S99-1
Reference 7: http://www.xbrl.org/2003/role/disclosureRef
-Topic 740
-SubTopic 10
-Name Accounting Standards Codification
-Section 50
-Paragraph 10
-Publisher FASB
-URI https://asc.fasb.org/1943274/2147482685/740-10-50-10
Reference 8: http://www.xbrl.org/2003/role/disclosureRef
-Topic 740
-SubTopic 20
-Name Accounting Standards Codification
-Section 45
-Paragraph 11
-Subparagraph (b)
-Publisher FASB
-URI https://asc.fasb.org/1943274/2147482659/740-20-45-11
Reference 9: http://www.xbrl.org/2003/role/disclosureRef
-Topic 220
-SubTopic 10
-Name Accounting Standards Codification
-Section S99
-Paragraph 2
-Subparagraph (SX 210.5-03(21))
-Publisher FASB
-URI https://asc.fasb.org/1943274/2147483621/220-10-S99-2
Reference 10: http://www.xbrl.org/2003/role/disclosureRef
-Topic 942
-SubTopic 220
-Name Accounting Standards Codification
-Section S99
-Paragraph 1
-Subparagraph (SX 210.9-04(23))
-Publisher FASB
-URI https://asc.fasb.org/1943274/2147478524/942-220-S99-1
Reference 11: http://www.xbrl.org/2003/role/disclosureRef
-Topic 740
-SubTopic 20
-Name Accounting Standards Codification
-Section 45
-Paragraph 2
-Subparagraph (d)
-Publisher FASB
-URI https://asc.fasb.org/1943274/2147482659/740-20-45-2
| Name: |
us-gaap_OtherComprehensiveIncomeLossTax |
| Namespace Prefix: |
us-gaap_ |
| Data Type: |
xbrli:monetaryItemType |
| Balance Type: |
debit |
| Period Type: |
duration |
|
| X |
- DefinitionThe consolidated profit or loss for the period, net of income taxes, including the portion attributable to the noncontrolling interest. Reference 1: http://www.xbrl.org/2003/role/disclosureRef
-Topic 250
-SubTopic 10
-Name Accounting Standards Codification
-Section 50
-Paragraph 6
-Publisher FASB
-URI https://asc.fasb.org/1943274/2147483443/250-10-50-6
Reference 2: http://www.xbrl.org/2003/role/disclosureRef
-Topic 250
-SubTopic 10
-Name Accounting Standards Codification
-Section 50
-Paragraph 9
-Publisher FASB
-URI https://asc.fasb.org/1943274/2147483443/250-10-50-9
Reference 3: http://www.xbrl.org/2003/role/disclosureRef
-Topic 805
-SubTopic 60
-Name Accounting Standards Codification
-Section 65
-Paragraph 1
-Subparagraph (g)
-Publisher FASB
-URI https://asc.fasb.org/1943274/2147476176/805-60-65-1
Reference 4: http://www.xbrl.org/2003/role/disclosureRef
-Topic 740
-SubTopic 323
-Name Accounting Standards Codification
-Section 65
-Paragraph 2
-Subparagraph (g)(3)
-Publisher FASB
-URI https://asc.fasb.org/1943274/2147478666/740-323-65-2
Reference 5: http://www.xbrl.org/2003/role/disclosureRef
-Topic 235
-SubTopic 10
-Name Accounting Standards Codification
-Section S99
-Paragraph 1
-Subparagraph (SX 210.4-08(g)(1)(ii))
-Publisher FASB
-URI https://asc.fasb.org/1943274/2147480678/235-10-S99-1
Reference 6: http://www.xbrl.org/2003/role/disclosureRef
-Topic 323
-SubTopic 10
-Name Accounting Standards Codification
-Section 50
-Paragraph 3
-Subparagraph (c)
-Publisher FASB
-URI https://asc.fasb.org/1943274/2147481687/323-10-50-3
Reference 7: http://www.xbrl.org/2003/role/disclosureRef
-Topic 825
-SubTopic 10
-Name Accounting Standards Codification
-Section 50
-Paragraph 28
-Subparagraph (f)
-Publisher FASB
-URI https://asc.fasb.org/1943274/2147482907/825-10-50-28
Reference 8: http://www.xbrl.org/2003/role/disclosureRef
-Topic 250
-SubTopic 10
-Name Accounting Standards Codification
-Section 50
-Paragraph 1
-Subparagraph (b)(2)
-Publisher FASB
-URI https://asc.fasb.org/1943274/2147483443/250-10-50-1
Reference 9: http://www.xbrl.org/2003/role/disclosureRef
-Topic 815
-SubTopic 40
-Name Accounting Standards Codification
-Section 65
-Paragraph 1
-Subparagraph (f)
-Publisher FASB
-URI https://asc.fasb.org/1943274/2147480175/815-40-65-1
Reference 10: http://www.xbrl.org/2003/role/disclosureRef
-Topic 250
-SubTopic 10
-Name Accounting Standards Codification
-Section 50
-Paragraph 8
-Publisher FASB
-URI https://asc.fasb.org/1943274/2147483443/250-10-50-8
Reference 11: http://www.xbrl.org/2003/role/exampleRef
-Topic 946
-SubTopic 830
-Name Accounting Standards Codification
-Section 55
-Paragraph 11
-Publisher FASB
-URI https://asc.fasb.org/1943274/2147479168/946-830-55-11
Reference 12: http://www.xbrl.org/2003/role/disclosureRef
-Topic 946
-SubTopic 205
-Name Accounting Standards Codification
-Section 45
-Paragraph 3
-Subparagraph (a)
-Publisher FASB
-URI https://asc.fasb.org/1943274/2147478009/946-205-45-3
Reference 13: http://www.xbrl.org/2003/role/disclosureRef
-Topic 946
-SubTopic 220
-Name Accounting Standards Codification
-Section 45
-Paragraph 7
-Publisher FASB
-URI https://asc.fasb.org/1943274/2147479105/946-220-45-7
Reference 14: http://www.xbrl.org/2003/role/disclosureRef
-Topic 944
-SubTopic 220
-Name Accounting Standards Codification
-Section S99
-Paragraph 1
-Subparagraph (SX 210.7-04(16))
-Publisher FASB
-URI https://asc.fasb.org/1943274/2147477250/944-220-S99-1
Reference 15: http://www.xbrl.org/2003/role/disclosureRef
-Topic 946
-SubTopic 220
-Name Accounting Standards Codification
-Section S99
-Paragraph 1
-Subparagraph (SX 210.6-07(9))
-Publisher FASB
-URI https://asc.fasb.org/1943274/2147479134/946-220-S99-1
Reference 16: http://www.xbrl.org/2003/role/disclosureRef
-Topic 946
-SubTopic 220
-Name Accounting Standards Codification
-Section S99
-Paragraph 3
-Subparagraph (SX 210.6-09(1)(d))
-Publisher FASB
-URI https://asc.fasb.org/1943274/2147479134/946-220-S99-3
Reference 17: http://www.xbrl.org/2003/role/disclosureRef
-Topic 810
-SubTopic 10
-Name Accounting Standards Codification
-Section 45
-Paragraph 19
-Publisher FASB
-URI https://asc.fasb.org/1943274/2147481231/810-10-45-19
Reference 18: http://www.xbrl.org/2009/role/commonPracticeRef
-Topic 220
-SubTopic 10
-Name Accounting Standards Codification
-Section 50
-Paragraph 6
-Publisher FASB
-URI https://asc.fasb.org/1943274/2147482765/220-10-50-6
Reference 19: http://www.xbrl.org/2003/role/disclosureRef
-Topic 470
-SubTopic 10
-Name Accounting Standards Codification
-Section S99
-Paragraph 1A
-Subparagraph (SX 210.13-01(a)(4)(i))
-Publisher FASB
-URI https://asc.fasb.org/1943274/2147480097/470-10-S99-1A
Reference 20: http://www.xbrl.org/2009/role/commonPracticeRef
-Topic 470
-SubTopic 10
-Name Accounting Standards Codification
-Section S99
-Paragraph 1A
-Subparagraph (SX 210.13-01(a)(4)(ii))
-Publisher FASB
-URI https://asc.fasb.org/1943274/2147480097/470-10-S99-1A
Reference 21: http://www.xbrl.org/2003/role/disclosureRef
-Topic 470
-SubTopic 10
-Name Accounting Standards Codification
-Section S99
-Paragraph 1A
-Subparagraph (SX 210.13-01(a)(4)(iii)(A))
-Publisher FASB
-URI https://asc.fasb.org/1943274/2147480097/470-10-S99-1A
Reference 22: http://www.xbrl.org/2003/role/disclosureRef
-Topic 470
-SubTopic 10
-Name Accounting Standards Codification
-Section S99
-Paragraph 1A
-Subparagraph (SX 210.13-01(a)(4)(iv))
-Publisher FASB
-URI https://asc.fasb.org/1943274/2147480097/470-10-S99-1A
Reference 23: http://www.xbrl.org/2003/role/disclosureRef
-Topic 470
-SubTopic 10
-Name Accounting Standards Codification
-Section S99
-Paragraph 1A
-Subparagraph (SX 210.13-01(a)(5))
-Publisher FASB
-URI https://asc.fasb.org/1943274/2147480097/470-10-S99-1A
Reference 24: http://www.xbrl.org/2003/role/disclosureRef
-Topic 470
-SubTopic 10
-Name Accounting Standards Codification
-Section S99
-Paragraph 1B
-Subparagraph (SX 210.13-02(a)(4)(i))
-Publisher FASB
-URI https://asc.fasb.org/1943274/2147480097/470-10-S99-1B
Reference 25: http://www.xbrl.org/2003/role/disclosureRef
-Topic 470
-SubTopic 10
-Name Accounting Standards Codification
-Section S99
-Paragraph 1B
-Subparagraph (SX 210.13-02(a)(4)(iii)(A))
-Publisher FASB
-URI https://asc.fasb.org/1943274/2147480097/470-10-S99-1B
Reference 26: http://www.xbrl.org/2003/role/disclosureRef
-Topic 470
-SubTopic 10
-Name Accounting Standards Codification
-Section S99
-Paragraph 1B
-Subparagraph (SX 210.13-02(a)(4)(iii)(B))
-Publisher FASB
-URI https://asc.fasb.org/1943274/2147480097/470-10-S99-1B
Reference 27: http://www.xbrl.org/2003/role/disclosureRef
-Topic 470
-SubTopic 10
-Name Accounting Standards Codification
-Section S99
-Paragraph 1B
-Subparagraph (SX 210.13-02(a)(4)(iv))
-Publisher FASB
-URI https://asc.fasb.org/1943274/2147480097/470-10-S99-1B
Reference 28: http://www.xbrl.org/2003/role/disclosureRef
-Topic 470
-SubTopic 10
-Name Accounting Standards Codification
-Section S99
-Paragraph 1B
-Subparagraph (SX 210.13-02(a)(5))
-Publisher FASB
-URI https://asc.fasb.org/1943274/2147480097/470-10-S99-1B
Reference 29: http://www.xbrl.org/2003/role/disclosureRef
-Topic 942
-SubTopic 235
-Name Accounting Standards Codification
-Section S99
-Paragraph 1
-Subparagraph (SX 210.9-05(b)(2))
-Publisher FASB
-URI https://asc.fasb.org/1943274/2147477314/942-235-S99-1
Reference 30: http://www.xbrl.org/2003/role/disclosureRef
-Topic 205
-SubTopic 20
-Name Accounting Standards Codification
-Section 50
-Paragraph 7
-Publisher FASB
-URI https://asc.fasb.org/1943274/2147483499/205-20-50-7
Reference 31: http://www.xbrl.org/2003/role/exampleRef
-Topic 810
-SubTopic 10
-Name Accounting Standards Codification
-Section 55
-Paragraph 4J
-Publisher FASB
-URI https://asc.fasb.org/1943274/2147481175/810-10-55-4J
Reference 32: http://www.xbrl.org/2003/role/exampleRef
-Topic 810
-SubTopic 10
-Name Accounting Standards Codification
-Section 55
-Paragraph 4K
-Publisher FASB
-URI https://asc.fasb.org/1943274/2147481175/810-10-55-4K
Reference 33: http://www.xbrl.org/2003/role/disclosureRef
-Topic 220
-SubTopic 10
-Name Accounting Standards Codification
-Section 45
-Paragraph 1A
-Subparagraph (a)
-Publisher FASB
-URI https://asc.fasb.org/1943274/2147482790/220-10-45-1A
Reference 34: http://www.xbrl.org/2003/role/disclosureRef
-Topic 220
-SubTopic 10
-Name Accounting Standards Codification
-Section 45
-Paragraph 1B
-Subparagraph (a)
-Publisher FASB
-URI https://asc.fasb.org/1943274/2147482790/220-10-45-1B
Reference 35: http://www.xbrl.org/2003/role/disclosureRef
-Topic 230
-SubTopic 10
-Name Accounting Standards Codification
-Section 45
-Paragraph 2
-Publisher FASB
-URI https://asc.fasb.org/1943274/2147482740/230-10-45-2
Reference 36: http://www.xbrl.org/2003/role/disclosureRef
-Topic 810
-SubTopic 10
-Name Accounting Standards Codification
-Section 50
-Paragraph 1A
-Subparagraph (a)(1)
-Publisher FASB
-URI https://asc.fasb.org/1943274/2147481203/810-10-50-1A
Reference 37: http://www.xbrl.org/2003/role/disclosureRef
-Topic 810
-SubTopic 10
-Name Accounting Standards Codification
-Section 50
-Paragraph 1A
-Subparagraph (c)(1)
-Publisher FASB
-URI https://asc.fasb.org/1943274/2147481203/810-10-50-1A
| Name: |
us-gaap_ProfitLoss |
| Namespace Prefix: |
us-gaap_ |
| Data Type: |
xbrli:monetaryItemType |
| Balance Type: |
credit |
| Period Type: |
duration |
|
| X |
- References
+ Details
| Name: |
us-gaap_StatementOfIncomeAndComprehensiveIncomeAbstract |
| Namespace Prefix: |
us-gaap_ |
| Data Type: |
xbrli:stringItemType |
| Balance Type: |
na |
| Period Type: |
duration |
|
v3.24.2
Condensed Consolidated Statements of Capital - USD ($)
$ in Thousands |
3 Months Ended |
6 Months Ended |
Jun. 30, 2024 |
Jun. 30, 2023 |
Jun. 30, 2024 |
Jun. 30, 2023 |
| Increase (Decrease) in Stockholders' Equity [Roll Forward] |
|
|
|
|
| Beginning balance |
$ 1,988,105
|
$ 1,856,801
|
$ 1,982,104
|
$ 1,868,047
|
| Net income |
38,227
|
50,555
|
44,310
|
40,821
|
| Share-based compensation expense |
984
|
930
|
1,816
|
1,693
|
| Reacquisition of share-based compensation awards for tax-withholding purposes |
|
|
(823)
|
(202)
|
| Other comprehensive income—net of tax |
11
|
40
|
23
|
81
|
| Tax distributions to noncontrolling interests |
|
|
|
(1,974)
|
| Adjustment to liability recognized under tax receivable agreement - net of tax |
|
|
(103)
|
(140)
|
| Adjustment of noncontrolling interest in the Operating Company |
|
|
0
|
0
|
| Ending balance |
2,027,327
|
1,908,326
|
2,027,327
|
1,908,326
|
| Contributed Capital |
|
|
|
|
| Increase (Decrease) in Stockholders' Equity [Roll Forward] |
|
|
|
|
| Beginning balance |
592,227
|
588,704
|
591,606
|
587,733
|
| Share-based compensation expense |
984
|
930
|
1,816
|
1,693
|
| Reacquisition of share-based compensation awards for tax-withholding purposes |
|
|
(823)
|
(202)
|
| Adjustment to liability recognized under tax receivable agreement - net of tax |
|
|
(103)
|
(140)
|
| Adjustment of noncontrolling interest in the Operating Company |
|
|
715
|
550
|
| Ending balance |
593,211
|
589,634
|
593,211
|
589,634
|
| Retained Earnings |
|
|
|
|
| Increase (Decrease) in Stockholders' Equity [Roll Forward] |
|
|
|
|
| Beginning balance |
91,106
|
28,850
|
88,780
|
33,386
|
| Net income |
14,722
|
23,571
|
17,048
|
19,035
|
| Ending balance |
105,828
|
52,421
|
105,828
|
52,421
|
| Accumulated Other Comprehensive Loss |
|
|
|
|
| Increase (Decrease) in Stockholders' Equity [Roll Forward] |
|
|
|
|
| Beginning balance |
(2,327)
|
(2,964)
|
(2,332)
|
(2,988)
|
| Other comprehensive income—net of tax |
6
|
25
|
13
|
51
|
| Adjustment of noncontrolling interest in the Operating Company |
|
|
(2)
|
(2)
|
| Ending balance |
(2,321)
|
(2,939)
|
(2,321)
|
(2,939)
|
| Total Members’ Capital |
|
|
|
|
| Increase (Decrease) in Stockholders' Equity [Roll Forward] |
|
|
|
|
| Beginning balance |
681,006
|
614,590
|
678,054
|
618,131
|
| Net income |
14,722
|
23,571
|
17,048
|
19,035
|
| Share-based compensation expense |
984
|
930
|
1,816
|
1,693
|
| Reacquisition of share-based compensation awards for tax-withholding purposes |
|
|
(823)
|
(202)
|
| Other comprehensive income—net of tax |
6
|
25
|
13
|
51
|
| Adjustment to liability recognized under tax receivable agreement - net of tax |
|
|
(103)
|
(140)
|
| Adjustment of noncontrolling interest in the Operating Company |
|
|
713
|
548
|
| Ending balance |
696,718
|
639,116
|
696,718
|
639,116
|
| Noncontrolling Interests |
|
|
|
|
| Increase (Decrease) in Stockholders' Equity [Roll Forward] |
|
|
|
|
| Beginning balance |
1,307,099
|
1,242,211
|
1,304,050
|
1,249,916
|
| Net income |
23,505
|
26,984
|
27,262
|
21,786
|
| Other comprehensive income—net of tax |
5
|
15
|
10
|
30
|
| Tax distributions to noncontrolling interests |
|
|
|
(1,974)
|
| Adjustment of noncontrolling interest in the Operating Company |
|
|
(713)
|
(548)
|
| Ending balance |
$ 1,330,609
|
$ 1,269,210
|
$ 1,330,609
|
$ 1,269,210
|
| Class A Common Shares | Common Stock |
|
|
|
|
| Increase (Decrease) in Stockholders' Equity [Roll Forward] |
|
|
|
|
| Beginning Balance (in shares) |
69,358,504
|
69,199,938
|
69,199,938
|
69,068,354
|
| Reacquisition of share-based compensation awards for tax-withholding purposes (in shares) |
|
|
(282,883)
|
(83,660)
|
| Issuance of share-based compensation awards, (in shares) |
|
|
158,940
|
|
| Issuance of share-based compensation awards, net of forfeitures (in shares) |
|
|
|
215,244
|
| Settlement of restricted share units for Class A common shares (in shares) |
|
|
282,509
|
|
| Ending Balance (in shares) |
69,358,504
|
69,199,938
|
69,358,504
|
69,199,938
|
| Class B Common Shares | Common Stock |
|
|
|
|
| Increase (Decrease) in Stockholders' Equity [Roll Forward] |
|
|
|
|
| Beginning Balance (in shares) |
79,233,544
|
79,233,544
|
79,233,544
|
79,233,544
|
| Ending Balance (in shares) |
79,233,544
|
79,233,544
|
79,233,544
|
79,233,544
|
| X |
- DefinitionAdjustments to Additional Paid in Capital, Tax Receivable Agreement, Initial Liability
| Name: |
fph_AdjustmentstoAdditionalPaidinCapitalTaxReceivableAgreementInitialLiability |
| Namespace Prefix: |
fph_ |
| Data Type: |
xbrli:monetaryItemType |
| Balance Type: |
debit |
| Period Type: |
duration |
|
| X |
- DefinitionAmount of increase to additional paid-in capital (APIC) for recognition of cost for award under share-based payment arrangement. Reference 1: http://www.xbrl.org/2003/role/disclosureRef
-Topic 718
-SubTopic 10
-Name Accounting Standards Codification
-Section 35
-Paragraph 2
-Publisher FASB
-URI https://asc.fasb.org/1943274/2147480483/718-10-35-2
Reference 2: http://fasb.org/us-gaap/role/ref/legacyRef
-Name Accounting Standards Codification
-Topic 718
-SubTopic 20
-Section 55
-Paragraph 13
-Publisher FASB
-URI https://asc.fasb.org/1943274/2147481089/718-20-55-13
Reference 3: http://fasb.org/us-gaap/role/ref/legacyRef
-Name Accounting Standards Codification
-Topic 718
-SubTopic 20
-Section 55
-Paragraph 12
-Publisher FASB
-URI https://asc.fasb.org/1943274/2147481089/718-20-55-12
| Name: |
us-gaap_AdjustmentsToAdditionalPaidInCapitalSharebasedCompensationRequisiteServicePeriodRecognitionValue |
| Namespace Prefix: |
us-gaap_ |
| Data Type: |
xbrli:monetaryItemType |
| Balance Type: |
credit |
| Period Type: |
duration |
|
| X |
- DefinitionA roll forward is a reconciliation of a concept from the beginning of a period to the end of a period.
| Name: |
us-gaap_IncreaseDecreaseInStockholdersEquityRollForward |
| Namespace Prefix: |
us-gaap_ |
| Data Type: |
xbrli:stringItemType |
| Balance Type: |
na |
| Period Type: |
duration |
|
| X |
- DefinitionDecrease in noncontrolling interest balance from payment of dividends or other distributions by the non-wholly owned subsidiary or partially owned entity, included in the consolidation of the parent entity, to the noncontrolling interest holders. Reference 1: http://fasb.org/us-gaap/role/ref/legacyRef
-Topic 505
-SubTopic 10
-Name Accounting Standards Codification
-Section S99
-Paragraph 1
-Subparagraph (SX 210.3-04)
-Publisher FASB
-URI https://asc.fasb.org/1943274/2147480008/505-10-S99-1
| Name: |
us-gaap_MinorityInterestDecreaseFromDistributionsToNoncontrollingInterestHolders |
| Namespace Prefix: |
us-gaap_ |
| Data Type: |
xbrli:monetaryItemType |
| Balance Type: |
debit |
| Period Type: |
duration |
|
| X |
- DefinitionDecrease in noncontrolling interest (for example, but not limited to, redeeming or purchasing the interests of noncontrolling shareholders, issuance of shares (interests) by the non-wholly owned subsidiary to the parent entity for other than cash, and a buyback of shares (interest) by the non-wholly owned subsidiary from the noncontrolling interests). Reference 1: http://fasb.org/us-gaap/role/ref/legacyRef
-Topic 505
-SubTopic 10
-Name Accounting Standards Codification
-Section S99
-Paragraph 1
-Subparagraph (SX 210.3-04)
-Publisher FASB
-URI https://asc.fasb.org/1943274/2147480008/505-10-S99-1
Reference 2: http://fasb.org/us-gaap/role/ref/legacyRef
-Topic 810
-SubTopic 10
-Name Accounting Standards Codification
-Section 45
-Paragraph 23
-Publisher FASB
-URI https://asc.fasb.org/1943274/2147481231/810-10-45-23
Reference 3: http://fasb.org/us-gaap/role/ref/legacyRef
-Name Accounting Standards Codification
-Topic 810
-SubTopic 10
-Section 45
-Paragraph 24
-Publisher FASB
-URI https://asc.fasb.org/1943274/2147481231/810-10-45-24
| Name: |
us-gaap_MinorityInterestDecreaseFromRedemptions |
| Namespace Prefix: |
us-gaap_ |
| Data Type: |
xbrli:monetaryItemType |
| Balance Type: |
debit |
| Period Type: |
duration |
|
| X |
- DefinitionAmount after tax and reclassification adjustments of other comprehensive income (loss). Reference 1: http://fasb.org/us-gaap/role/ref/legacyRef
-Name Accounting Standards Codification
-Section 50
-Paragraph 2
-SubTopic 10
-Topic 505
-Publisher FASB
-URI https://asc.fasb.org/1943274/2147481112/505-10-50-2
Reference 2: http://www.xbrl.org/2003/role/disclosureRef
-Topic 250
-SubTopic 10
-Name Accounting Standards Codification
-Section 50
-Paragraph 6
-Publisher FASB
-URI https://asc.fasb.org/1943274/2147483443/250-10-50-6
Reference 3: http://www.xbrl.org/2003/role/disclosureRef
-Topic 830
-SubTopic 30
-Name Accounting Standards Codification
-Section 50
-Paragraph 1
-Publisher FASB
-URI https://asc.fasb.org/1943274/2147481674/830-30-50-1
Reference 4: http://www.xbrl.org/2003/role/disclosureRef
-Topic 830
-SubTopic 30
-Name Accounting Standards Codification
-Section 45
-Paragraph 17
-Publisher FASB
-URI https://asc.fasb.org/1943274/2147481694/830-30-45-17
Reference 5: http://www.xbrl.org/2003/role/disclosureRef
-Topic 944
-SubTopic 220
-Name Accounting Standards Codification
-Section S99
-Paragraph 1
-Subparagraph (SX 210.7-04(19))
-Publisher FASB
-URI https://asc.fasb.org/1943274/2147477250/944-220-S99-1
Reference 6: http://www.xbrl.org/2009/role/commonPracticeRef
-Topic 220
-SubTopic 10
-Name Accounting Standards Codification
-Section 50
-Paragraph 4
-Publisher FASB
-URI https://asc.fasb.org/1943274/2147482765/220-10-50-4
Reference 7: http://www.xbrl.org/2009/role/commonPracticeRef
-Topic 220
-SubTopic 10
-Name Accounting Standards Codification
-Section 50
-Paragraph 5
-Publisher FASB
-URI https://asc.fasb.org/1943274/2147482765/220-10-50-5
Reference 8: http://www.xbrl.org/2003/role/disclosureRef
-Topic 830
-SubTopic 30
-Name Accounting Standards Codification
-Section 45
-Paragraph 20
-Publisher FASB
-URI https://asc.fasb.org/1943274/2147481694/830-30-45-20
Reference 9: http://www.xbrl.org/2003/role/disclosureRef
-Topic 220
-SubTopic 10
-Name Accounting Standards Codification
-Section S99
-Paragraph 2
-Subparagraph (SX 210.5-03(21))
-Publisher FASB
-URI https://asc.fasb.org/1943274/2147483621/220-10-S99-2
Reference 10: http://www.xbrl.org/2003/role/disclosureRef
-Topic 942
-SubTopic 220
-Name Accounting Standards Codification
-Section S99
-Paragraph 1
-Subparagraph (SX 210.9-04(23))
-Publisher FASB
-URI https://asc.fasb.org/1943274/2147478524/942-220-S99-1
Reference 11: http://www.xbrl.org/2003/role/disclosureRef
-Topic 220
-SubTopic 10
-Name Accounting Standards Codification
-Section 45
-Paragraph 1B
-Subparagraph (b)
-Publisher FASB
-URI https://asc.fasb.org/1943274/2147482790/220-10-45-1B
Reference 12: http://fasb.org/us-gaap/role/ref/legacyRef
-Name Accounting Standards Codification
-Section 55
-Paragraph 15
-SubTopic 10
-Topic 220
-Publisher FASB
-URI https://asc.fasb.org/1943274/2147482739/220-10-55-15
Reference 13: http://www.xbrl.org/2003/role/disclosureRef
-Topic 220
-SubTopic 10
-Name Accounting Standards Codification
-Section 45
-Paragraph 1A
-Subparagraph (b)
-Publisher FASB
-URI https://asc.fasb.org/1943274/2147482790/220-10-45-1A
| Name: |
us-gaap_OtherComprehensiveIncomeLossNetOfTax |
| Namespace Prefix: |
us-gaap_ |
| Data Type: |
xbrli:monetaryItemType |
| Balance Type: |
credit |
| Period Type: |
duration |
|
| X |
- DefinitionThe consolidated profit or loss for the period, net of income taxes, including the portion attributable to the noncontrolling interest. Reference 1: http://www.xbrl.org/2003/role/disclosureRef
-Topic 250
-SubTopic 10
-Name Accounting Standards Codification
-Section 50
-Paragraph 6
-Publisher FASB
-URI https://asc.fasb.org/1943274/2147483443/250-10-50-6
Reference 2: http://www.xbrl.org/2003/role/disclosureRef
-Topic 250
-SubTopic 10
-Name Accounting Standards Codification
-Section 50
-Paragraph 9
-Publisher FASB
-URI https://asc.fasb.org/1943274/2147483443/250-10-50-9
Reference 3: http://www.xbrl.org/2003/role/disclosureRef
-Topic 805
-SubTopic 60
-Name Accounting Standards Codification
-Section 65
-Paragraph 1
-Subparagraph (g)
-Publisher FASB
-URI https://asc.fasb.org/1943274/2147476176/805-60-65-1
Reference 4: http://www.xbrl.org/2003/role/disclosureRef
-Topic 740
-SubTopic 323
-Name Accounting Standards Codification
-Section 65
-Paragraph 2
-Subparagraph (g)(3)
-Publisher FASB
-URI https://asc.fasb.org/1943274/2147478666/740-323-65-2
Reference 5: http://www.xbrl.org/2003/role/disclosureRef
-Topic 235
-SubTopic 10
-Name Accounting Standards Codification
-Section S99
-Paragraph 1
-Subparagraph (SX 210.4-08(g)(1)(ii))
-Publisher FASB
-URI https://asc.fasb.org/1943274/2147480678/235-10-S99-1
Reference 6: http://www.xbrl.org/2003/role/disclosureRef
-Topic 323
-SubTopic 10
-Name Accounting Standards Codification
-Section 50
-Paragraph 3
-Subparagraph (c)
-Publisher FASB
-URI https://asc.fasb.org/1943274/2147481687/323-10-50-3
Reference 7: http://www.xbrl.org/2003/role/disclosureRef
-Topic 825
-SubTopic 10
-Name Accounting Standards Codification
-Section 50
-Paragraph 28
-Subparagraph (f)
-Publisher FASB
-URI https://asc.fasb.org/1943274/2147482907/825-10-50-28
Reference 8: http://www.xbrl.org/2003/role/disclosureRef
-Topic 250
-SubTopic 10
-Name Accounting Standards Codification
-Section 50
-Paragraph 1
-Subparagraph (b)(2)
-Publisher FASB
-URI https://asc.fasb.org/1943274/2147483443/250-10-50-1
Reference 9: http://www.xbrl.org/2003/role/disclosureRef
-Topic 815
-SubTopic 40
-Name Accounting Standards Codification
-Section 65
-Paragraph 1
-Subparagraph (f)
-Publisher FASB
-URI https://asc.fasb.org/1943274/2147480175/815-40-65-1
Reference 10: http://www.xbrl.org/2003/role/disclosureRef
-Topic 250
-SubTopic 10
-Name Accounting Standards Codification
-Section 50
-Paragraph 8
-Publisher FASB
-URI https://asc.fasb.org/1943274/2147483443/250-10-50-8
Reference 11: http://www.xbrl.org/2003/role/exampleRef
-Topic 946
-SubTopic 830
-Name Accounting Standards Codification
-Section 55
-Paragraph 11
-Publisher FASB
-URI https://asc.fasb.org/1943274/2147479168/946-830-55-11
Reference 12: http://www.xbrl.org/2003/role/disclosureRef
-Topic 946
-SubTopic 205
-Name Accounting Standards Codification
-Section 45
-Paragraph 3
-Subparagraph (a)
-Publisher FASB
-URI https://asc.fasb.org/1943274/2147478009/946-205-45-3
Reference 13: http://www.xbrl.org/2003/role/disclosureRef
-Topic 946
-SubTopic 220
-Name Accounting Standards Codification
-Section 45
-Paragraph 7
-Publisher FASB
-URI https://asc.fasb.org/1943274/2147479105/946-220-45-7
Reference 14: http://www.xbrl.org/2003/role/disclosureRef
-Topic 944
-SubTopic 220
-Name Accounting Standards Codification
-Section S99
-Paragraph 1
-Subparagraph (SX 210.7-04(16))
-Publisher FASB
-URI https://asc.fasb.org/1943274/2147477250/944-220-S99-1
Reference 15: http://www.xbrl.org/2003/role/disclosureRef
-Topic 946
-SubTopic 220
-Name Accounting Standards Codification
-Section S99
-Paragraph 1
-Subparagraph (SX 210.6-07(9))
-Publisher FASB
-URI https://asc.fasb.org/1943274/2147479134/946-220-S99-1
Reference 16: http://www.xbrl.org/2003/role/disclosureRef
-Topic 946
-SubTopic 220
-Name Accounting Standards Codification
-Section S99
-Paragraph 3
-Subparagraph (SX 210.6-09(1)(d))
-Publisher FASB
-URI https://asc.fasb.org/1943274/2147479134/946-220-S99-3
Reference 17: http://www.xbrl.org/2003/role/disclosureRef
-Topic 810
-SubTopic 10
-Name Accounting Standards Codification
-Section 45
-Paragraph 19
-Publisher FASB
-URI https://asc.fasb.org/1943274/2147481231/810-10-45-19
Reference 18: http://www.xbrl.org/2009/role/commonPracticeRef
-Topic 220
-SubTopic 10
-Name Accounting Standards Codification
-Section 50
-Paragraph 6
-Publisher FASB
-URI https://asc.fasb.org/1943274/2147482765/220-10-50-6
Reference 19: http://www.xbrl.org/2003/role/disclosureRef
-Topic 470
-SubTopic 10
-Name Accounting Standards Codification
-Section S99
-Paragraph 1A
-Subparagraph (SX 210.13-01(a)(4)(i))
-Publisher FASB
-URI https://asc.fasb.org/1943274/2147480097/470-10-S99-1A
Reference 20: http://www.xbrl.org/2009/role/commonPracticeRef
-Topic 470
-SubTopic 10
-Name Accounting Standards Codification
-Section S99
-Paragraph 1A
-Subparagraph (SX 210.13-01(a)(4)(ii))
-Publisher FASB
-URI https://asc.fasb.org/1943274/2147480097/470-10-S99-1A
Reference 21: http://www.xbrl.org/2003/role/disclosureRef
-Topic 470
-SubTopic 10
-Name Accounting Standards Codification
-Section S99
-Paragraph 1A
-Subparagraph (SX 210.13-01(a)(4)(iii)(A))
-Publisher FASB
-URI https://asc.fasb.org/1943274/2147480097/470-10-S99-1A
Reference 22: http://www.xbrl.org/2003/role/disclosureRef
-Topic 470
-SubTopic 10
-Name Accounting Standards Codification
-Section S99
-Paragraph 1A
-Subparagraph (SX 210.13-01(a)(4)(iv))
-Publisher FASB
-URI https://asc.fasb.org/1943274/2147480097/470-10-S99-1A
Reference 23: http://www.xbrl.org/2003/role/disclosureRef
-Topic 470
-SubTopic 10
-Name Accounting Standards Codification
-Section S99
-Paragraph 1A
-Subparagraph (SX 210.13-01(a)(5))
-Publisher FASB
-URI https://asc.fasb.org/1943274/2147480097/470-10-S99-1A
Reference 24: http://www.xbrl.org/2003/role/disclosureRef
-Topic 470
-SubTopic 10
-Name Accounting Standards Codification
-Section S99
-Paragraph 1B
-Subparagraph (SX 210.13-02(a)(4)(i))
-Publisher FASB
-URI https://asc.fasb.org/1943274/2147480097/470-10-S99-1B
Reference 25: http://www.xbrl.org/2003/role/disclosureRef
-Topic 470
-SubTopic 10
-Name Accounting Standards Codification
-Section S99
-Paragraph 1B
-Subparagraph (SX 210.13-02(a)(4)(iii)(A))
-Publisher FASB
-URI https://asc.fasb.org/1943274/2147480097/470-10-S99-1B
Reference 26: http://www.xbrl.org/2003/role/disclosureRef
-Topic 470
-SubTopic 10
-Name Accounting Standards Codification
-Section S99
-Paragraph 1B
-Subparagraph (SX 210.13-02(a)(4)(iii)(B))
-Publisher FASB
-URI https://asc.fasb.org/1943274/2147480097/470-10-S99-1B
Reference 27: http://www.xbrl.org/2003/role/disclosureRef
-Topic 470
-SubTopic 10
-Name Accounting Standards Codification
-Section S99
-Paragraph 1B
-Subparagraph (SX 210.13-02(a)(4)(iv))
-Publisher FASB
-URI https://asc.fasb.org/1943274/2147480097/470-10-S99-1B
Reference 28: http://www.xbrl.org/2003/role/disclosureRef
-Topic 470
-SubTopic 10
-Name Accounting Standards Codification
-Section S99
-Paragraph 1B
-Subparagraph (SX 210.13-02(a)(5))
-Publisher FASB
-URI https://asc.fasb.org/1943274/2147480097/470-10-S99-1B
Reference 29: http://www.xbrl.org/2003/role/disclosureRef
-Topic 942
-SubTopic 235
-Name Accounting Standards Codification
-Section S99
-Paragraph 1
-Subparagraph (SX 210.9-05(b)(2))
-Publisher FASB
-URI https://asc.fasb.org/1943274/2147477314/942-235-S99-1
Reference 30: http://www.xbrl.org/2003/role/disclosureRef
-Topic 205
-SubTopic 20
-Name Accounting Standards Codification
-Section 50
-Paragraph 7
-Publisher FASB
-URI https://asc.fasb.org/1943274/2147483499/205-20-50-7
Reference 31: http://www.xbrl.org/2003/role/exampleRef
-Topic 810
-SubTopic 10
-Name Accounting Standards Codification
-Section 55
-Paragraph 4J
-Publisher FASB
-URI https://asc.fasb.org/1943274/2147481175/810-10-55-4J
Reference 32: http://www.xbrl.org/2003/role/exampleRef
-Topic 810
-SubTopic 10
-Name Accounting Standards Codification
-Section 55
-Paragraph 4K
-Publisher FASB
-URI https://asc.fasb.org/1943274/2147481175/810-10-55-4K
Reference 33: http://www.xbrl.org/2003/role/disclosureRef
-Topic 220
-SubTopic 10
-Name Accounting Standards Codification
-Section 45
-Paragraph 1A
-Subparagraph (a)
-Publisher FASB
-URI https://asc.fasb.org/1943274/2147482790/220-10-45-1A
Reference 34: http://www.xbrl.org/2003/role/disclosureRef
-Topic 220
-SubTopic 10
-Name Accounting Standards Codification
-Section 45
-Paragraph 1B
-Subparagraph (a)
-Publisher FASB
-URI https://asc.fasb.org/1943274/2147482790/220-10-45-1B
Reference 35: http://www.xbrl.org/2003/role/disclosureRef
-Topic 230
-SubTopic 10
-Name Accounting Standards Codification
-Section 45
-Paragraph 2
-Publisher FASB
-URI https://asc.fasb.org/1943274/2147482740/230-10-45-2
Reference 36: http://www.xbrl.org/2003/role/disclosureRef
-Topic 810
-SubTopic 10
-Name Accounting Standards Codification
-Section 50
-Paragraph 1A
-Subparagraph (a)(1)
-Publisher FASB
-URI https://asc.fasb.org/1943274/2147481203/810-10-50-1A
Reference 37: http://www.xbrl.org/2003/role/disclosureRef
-Topic 810
-SubTopic 10
-Name Accounting Standards Codification
-Section 50
-Paragraph 1A
-Subparagraph (c)(1)
-Publisher FASB
-URI https://asc.fasb.org/1943274/2147481203/810-10-50-1A
| Name: |
us-gaap_ProfitLoss |
| Namespace Prefix: |
us-gaap_ |
| Data Type: |
xbrli:monetaryItemType |
| Balance Type: |
credit |
| Period Type: |
duration |
|
| X |
- DefinitionNumber of shares of stock issued as of the balance sheet date, including shares that had been issued and were previously outstanding but which are now held in the treasury. Reference 1: http://fasb.org/us-gaap/role/ref/legacyRef
-Name Accounting Standards Codification
-Section 50
-Paragraph 2
-SubTopic 10
-Topic 505
-Publisher FASB
-URI https://asc.fasb.org/1943274/2147481112/505-10-50-2
| Name: |
us-gaap_SharesIssued |
| Namespace Prefix: |
us-gaap_ |
| Data Type: |
xbrli:sharesItemType |
| Balance Type: |
na |
| Period Type: |
instant |
|
| X |
- DefinitionNumber of shares used to settle grantee's tax withholding obligation for award under share-based payment arrangement.
| Name: |
us-gaap_SharesPaidForTaxWithholdingForShareBasedCompensation |
| Namespace Prefix: |
us-gaap_ |
| Data Type: |
xbrli:sharesItemType |
| Balance Type: |
na |
| Period Type: |
duration |
|
| X |
- DefinitionNumber of shares issued during the period related to Restricted Stock Awards, net of any shares forfeited. Reference 1: http://fasb.org/us-gaap/role/ref/legacyRef
-Name Accounting Standards Codification
-Section 50
-Paragraph 2
-SubTopic 10
-Topic 505
-Publisher FASB
-URI https://asc.fasb.org/1943274/2147481112/505-10-50-2
Reference 2: http://fasb.org/us-gaap/role/ref/legacyRef
-Topic 210
-SubTopic 10
-Name Accounting Standards Codification
-Section S99
-Paragraph 1
-Subparagraph (SX 210.5-02(28))
-Publisher FASB
-URI https://asc.fasb.org/1943274/2147480566/210-10-S99-1
Reference 3: http://fasb.org/us-gaap/role/ref/legacyRef
-Topic 210
-SubTopic 10
-Name Accounting Standards Codification
-Section S99
-Paragraph 1
-Subparagraph (SX 210.5-02(29))
-Publisher FASB
-URI https://asc.fasb.org/1943274/2147480566/210-10-S99-1
Reference 4: http://fasb.org/us-gaap/role/ref/legacyRef
-Topic 505
-SubTopic 10
-Name Accounting Standards Codification
-Section S99
-Paragraph 1
-Subparagraph (SX 210.3-04)
-Publisher FASB
-URI https://asc.fasb.org/1943274/2147480008/505-10-S99-1
| Name: |
us-gaap_StockIssuedDuringPeriodSharesRestrictedStockAwardNetOfForfeitures |
| Namespace Prefix: |
us-gaap_ |
| Data Type: |
xbrli:sharesItemType |
| Balance Type: |
na |
| Period Type: |
duration |
|
| X |
- DefinitionNumber, after forfeiture, of shares or units issued under share-based payment arrangement. Excludes shares or units issued under employee stock ownership plan (ESOP). Reference 1: http://fasb.org/us-gaap/role/ref/legacyRef
-Name Accounting Standards Codification
-Section 50
-Paragraph 2
-SubTopic 10
-Topic 505
-Publisher FASB
-URI https://asc.fasb.org/1943274/2147481112/505-10-50-2
Reference 2: http://fasb.org/us-gaap/role/ref/legacyRef
-Topic 210
-SubTopic 10
-Name Accounting Standards Codification
-Section S99
-Paragraph 1
-Subparagraph (SX 210.5-02(28))
-Publisher FASB
-URI https://asc.fasb.org/1943274/2147480566/210-10-S99-1
Reference 3: http://fasb.org/us-gaap/role/ref/legacyRef
-Topic 210
-SubTopic 10
-Name Accounting Standards Codification
-Section S99
-Paragraph 1
-Subparagraph (SX 210.5-02(29))
-Publisher FASB
-URI https://asc.fasb.org/1943274/2147480566/210-10-S99-1
Reference 4: http://fasb.org/us-gaap/role/ref/legacyRef
-Topic 505
-SubTopic 10
-Name Accounting Standards Codification
-Section S99
-Paragraph 1
-Subparagraph (SX 210.3-04)
-Publisher FASB
-URI https://asc.fasb.org/1943274/2147480008/505-10-S99-1
| Name: |
us-gaap_StockIssuedDuringPeriodSharesShareBasedCompensation |
| Namespace Prefix: |
us-gaap_ |
| Data Type: |
xbrli:sharesItemType |
| Balance Type: |
na |
| Period Type: |
duration |
|
| X |
- DefinitionNumber of shares (or other type of equity) forfeited during the period.
| Name: |
us-gaap_StockIssuedDuringPeriodSharesShareBasedCompensationForfeited |
| Namespace Prefix: |
us-gaap_ |
| Data Type: |
xbrli:sharesItemType |
| Balance Type: |
na |
| Period Type: |
duration |
|
| X |
- DefinitionAmount of equity (deficit) attributable to parent and noncontrolling interest. Excludes temporary equity. Reference 1: http://www.xbrl.org/2003/role/disclosureRef
-Topic 250
-SubTopic 10
-Name Accounting Standards Codification
-Section 50
-Paragraph 6
-Publisher FASB
-URI https://asc.fasb.org/1943274/2147483443/250-10-50-6
Reference 2: http://www.xbrl.org/2003/role/disclosureRef
-Topic 805
-SubTopic 60
-Name Accounting Standards Codification
-Section 65
-Paragraph 1
-Subparagraph (g)
-Publisher FASB
-URI https://asc.fasb.org/1943274/2147476176/805-60-65-1
Reference 3: http://www.xbrl.org/2003/role/disclosureRef
-Topic 805
-SubTopic 60
-Name Accounting Standards Codification
-Section 65
-Paragraph 1
-Subparagraph (d)(1)
-Publisher FASB
-URI https://asc.fasb.org/1943274/2147476176/805-60-65-1
Reference 4: http://www.xbrl.org/2003/role/disclosureRef
-Topic 740
-SubTopic 323
-Name Accounting Standards Codification
-Section 65
-Paragraph 2
-Subparagraph (e)
-Publisher FASB
-URI https://asc.fasb.org/1943274/2147478666/740-323-65-2
Reference 5: http://www.xbrl.org/2003/role/disclosureRef
-Topic 740
-SubTopic 323
-Name Accounting Standards Codification
-Section 65
-Paragraph 2
-Subparagraph (g)(4)
-Publisher FASB
-URI https://asc.fasb.org/1943274/2147478666/740-323-65-2
Reference 6: http://www.xbrl.org/2003/role/disclosureRef
-Topic 740
-SubTopic 323
-Name Accounting Standards Codification
-Section 65
-Paragraph 2
-Subparagraph (d)(2)
-Publisher FASB
-URI https://asc.fasb.org/1943274/2147478666/740-323-65-2
Reference 7: http://www.xbrl.org/2003/role/disclosureRef
-Topic 740
-SubTopic 323
-Name Accounting Standards Codification
-Section 65
-Paragraph 2
-Subparagraph (d)(1)
-Publisher FASB
-URI https://asc.fasb.org/1943274/2147478666/740-323-65-2
Reference 8: http://www.xbrl.org/2003/role/disclosureRef
-Topic 848
-SubTopic 10
-Name Accounting Standards Codification
-Section 65
-Paragraph 2
-Subparagraph (a)(3)(iii)(03)
-Publisher FASB
-URI https://asc.fasb.org/1943274/2147483550/848-10-65-2
Reference 9: http://www.xbrl.org/2003/role/disclosureRef
-Topic 842
-SubTopic 10
-Name Accounting Standards Codification
-Section 65
-Paragraph 8
-Subparagraph (c)(3)
-Publisher FASB
-URI https://asc.fasb.org/1943274/2147479832/842-10-65-8
Reference 10: http://www.xbrl.org/2003/role/disclosureRef
-Topic 250
-SubTopic 10
-Name Accounting Standards Codification
-Section 45
-Paragraph 24
-Publisher FASB
-URI https://asc.fasb.org/1943274/2147483421/250-10-45-24
Reference 11: http://www.xbrl.org/2003/role/disclosureRef
-Topic 250
-SubTopic 10
-Name Accounting Standards Codification
-Section 45
-Paragraph 23
-Subparagraph (b)
-Publisher FASB
-URI https://asc.fasb.org/1943274/2147483421/250-10-45-23
Reference 12: http://www.xbrl.org/2003/role/disclosureRef
-Topic 250
-SubTopic 10
-Name Accounting Standards Codification
-Section 45
-Paragraph 5
-Subparagraph (b)
-Publisher FASB
-URI https://asc.fasb.org/1943274/2147483421/250-10-45-5
Reference 13: http://www.xbrl.org/2003/role/disclosureRef
-Topic 326
-SubTopic 10
-Name Accounting Standards Codification
-Section 65
-Paragraph 5
-Subparagraph (c)(2)
-Publisher FASB
-URI https://asc.fasb.org/1943274/2147479654/326-10-65-5
Reference 14: http://www.xbrl.org/2003/role/disclosureRef
-Topic 815
-SubTopic 20
-Name Accounting Standards Codification
-Section 65
-Paragraph 6
-Subparagraph (e)
-Publisher FASB
-URI https://asc.fasb.org/1943274/2147480528/815-20-65-6
Reference 15: http://www.xbrl.org/2003/role/disclosureRef
-Topic 815
-SubTopic 20
-Name Accounting Standards Codification
-Section 65
-Paragraph 6
-Subparagraph (h)(1)
-Publisher FASB
-URI https://asc.fasb.org/1943274/2147480528/815-20-65-6
Reference 16: http://www.xbrl.org/2003/role/disclosureRef
-Topic 815
-SubTopic 20
-Name Accounting Standards Codification
-Section 65
-Paragraph 6
-Subparagraph (h)(1)(i)
-Publisher FASB
-URI https://asc.fasb.org/1943274/2147480528/815-20-65-6
Reference 17: http://www.xbrl.org/2003/role/disclosureRef
-Topic 815
-SubTopic 20
-Name Accounting Standards Codification
-Section 65
-Paragraph 6
-Subparagraph (h)(1)(iii)
-Publisher FASB
-URI https://asc.fasb.org/1943274/2147480528/815-20-65-6
Reference 18: http://www.xbrl.org/2003/role/disclosureRef
-Topic 815
-SubTopic 20
-Name Accounting Standards Codification
-Section 65
-Paragraph 6
-Subparagraph (h)(1)(iv)
-Publisher FASB
-URI https://asc.fasb.org/1943274/2147480528/815-20-65-6
Reference 19: http://www.xbrl.org/2003/role/disclosureRef
-Topic 815
-SubTopic 20
-Name Accounting Standards Codification
-Section 65
-Paragraph 6
-Subparagraph (i)(3)
-Publisher FASB
-URI https://asc.fasb.org/1943274/2147480528/815-20-65-6
Reference 20: http://www.xbrl.org/2003/role/disclosureRef
-Topic 105
-SubTopic 10
-Name Accounting Standards Codification
-Section 65
-Paragraph 6
-Subparagraph (c)
-Publisher FASB
-URI https://asc.fasb.org/1943274/2147479343/105-10-65-6
Reference 21: http://www.xbrl.org/2003/role/disclosureRef
-Topic 105
-SubTopic 10
-Name Accounting Standards Codification
-Section 65
-Paragraph 6
-Subparagraph (d)
-Publisher FASB
-URI https://asc.fasb.org/1943274/2147479343/105-10-65-6
Reference 22: http://www.xbrl.org/2003/role/disclosureRef
-Topic 944
-SubTopic 40
-Name Accounting Standards Codification
-Section 65
-Paragraph 2
-Subparagraph (f)(1)
-Publisher FASB
-URI https://asc.fasb.org/1943274/2147480016/944-40-65-2
Reference 23: http://www.xbrl.org/2003/role/disclosureRef
-Topic 944
-SubTopic 40
-Name Accounting Standards Codification
-Section 65
-Paragraph 2
-Subparagraph (f)(2)
-Publisher FASB
-URI https://asc.fasb.org/1943274/2147480016/944-40-65-2
Reference 24: http://www.xbrl.org/2003/role/disclosureRef
-Topic 740
-SubTopic 10
-Name Accounting Standards Codification
-Section 65
-Paragraph 8
-Subparagraph (d)(2)
-Publisher FASB
-URI https://asc.fasb.org/1943274/2147482615/740-10-65-8
Reference 25: http://www.xbrl.org/2003/role/disclosureRef
-Topic 740
-SubTopic 10
-Name Accounting Standards Codification
-Section 65
-Paragraph 8
-Subparagraph (d)(3)
-Publisher FASB
-URI https://asc.fasb.org/1943274/2147482615/740-10-65-8
Reference 26: http://www.xbrl.org/2003/role/disclosureRef
-Topic 326
-SubTopic 10
-Name Accounting Standards Codification
-Section 65
-Paragraph 4
-Subparagraph (d)
-Publisher FASB
-URI https://asc.fasb.org/1943274/2147479654/326-10-65-4
Reference 27: http://www.xbrl.org/2003/role/disclosureRef
-Topic 250
-SubTopic 10
-Name Accounting Standards Codification
-Section 50
-Paragraph 1
-Subparagraph (b)(3)
-Publisher FASB
-URI https://asc.fasb.org/1943274/2147483443/250-10-50-1
Reference 28: http://www.xbrl.org/2003/role/disclosureRef
-Topic 815
-SubTopic 40
-Name Accounting Standards Codification
-Section 65
-Paragraph 1
-Subparagraph (e)(3)
-Publisher FASB
-URI https://asc.fasb.org/1943274/2147480175/815-40-65-1
Reference 29: http://www.xbrl.org/2003/role/disclosureRef
-Topic 250
-SubTopic 10
-Name Accounting Standards Codification
-Section 50
-Paragraph 7
-Subparagraph (b)
-Publisher FASB
-URI https://asc.fasb.org/1943274/2147483443/250-10-50-7
Reference 30: http://www.xbrl.org/2003/role/disclosureRef
-Topic 220
-SubTopic 10
-Name Accounting Standards Codification
-Section 50
-Paragraph 5
-Publisher FASB
-URI https://asc.fasb.org/1943274/2147482765/220-10-50-5
Reference 31: http://www.xbrl.org/2003/role/disclosureRef
-Topic 830
-SubTopic 30
-Name Accounting Standards Codification
-Section 50
-Paragraph 1
-Publisher FASB
-URI https://asc.fasb.org/1943274/2147481674/830-30-50-1
Reference 32: http://www.xbrl.org/2003/role/disclosureRef
-Topic 830
-SubTopic 30
-Name Accounting Standards Codification
-Section 45
-Paragraph 17
-Publisher FASB
-URI https://asc.fasb.org/1943274/2147481694/830-30-45-17
Reference 33: http://www.xbrl.org/2003/role/disclosureRef
-Topic 830
-SubTopic 30
-Name Accounting Standards Codification
-Section 45
-Paragraph 20
-Subparagraph (a)
-Publisher FASB
-URI https://asc.fasb.org/1943274/2147481694/830-30-45-20
Reference 34: http://www.xbrl.org/2003/role/exampleRef
-Topic 946
-SubTopic 830
-Name Accounting Standards Codification
-Section 55
-Paragraph 11
-Publisher FASB
-URI https://asc.fasb.org/1943274/2147479168/946-830-55-11
Reference 35: http://www.xbrl.org/2003/role/disclosureRef
-Topic 946
-SubTopic 205
-Name Accounting Standards Codification
-Section 45
-Paragraph 3
-Publisher FASB
-URI https://asc.fasb.org/1943274/2147478009/946-205-45-3
Reference 36: http://www.xbrl.org/2003/role/disclosureRef
-Topic 946
-SubTopic 505
-Name Accounting Standards Codification
-Section 50
-Paragraph 3
-Publisher FASB
-URI https://asc.fasb.org/1943274/2147478448/946-505-50-3
Reference 37: http://www.xbrl.org/2003/role/disclosureRef
-Topic 946
-SubTopic 210
-Name Accounting Standards Codification
-Section S99
-Paragraph 1
-Subparagraph (SX 210.6-04(19))
-Publisher FASB
-URI https://asc.fasb.org/1943274/2147479170/946-210-S99-1
Reference 38: http://www.xbrl.org/2003/role/disclosureRef
-Topic 946
-SubTopic 210
-Name Accounting Standards Codification
-Section S99
-Paragraph 2
-Subparagraph (SX 210.6-05(4))
-Publisher FASB
-URI https://asc.fasb.org/1943274/2147479170/946-210-S99-2
Reference 39: http://www.xbrl.org/2009/role/commonPracticeRef
-Topic 946
-SubTopic 220
-Name Accounting Standards Codification
-Section S99
-Paragraph 3
-Subparagraph (SX 210.6-09(4)(b))
-Publisher FASB
-URI https://asc.fasb.org/1943274/2147479134/946-220-S99-3
Reference 40: http://www.xbrl.org/2003/role/disclosureRef
-Topic 946
-SubTopic 220
-Name Accounting Standards Codification
-Section S99
-Paragraph 3
-Subparagraph (SX 210.6-09(6))
-Publisher FASB
-URI https://asc.fasb.org/1943274/2147479134/946-220-S99-3
Reference 41: http://www.xbrl.org/2003/role/disclosureRef
-Topic 946
-SubTopic 220
-Name Accounting Standards Codification
-Section S99
-Paragraph 3
-Subparagraph (SX 210.6-09(7))
-Publisher FASB
-URI https://asc.fasb.org/1943274/2147479134/946-220-S99-3
Reference 42: http://www.xbrl.org/2003/role/disclosureRef
-Topic 505
-SubTopic 10
-Name Accounting Standards Codification
-Section S99
-Paragraph 1
-Subparagraph (SX 210.3-04)
-Publisher FASB
-URI https://asc.fasb.org/1943274/2147480008/505-10-S99-1
Reference 43: http://www.xbrl.org/2009/role/commonPracticeRef
-Topic 235
-SubTopic 10
-Name Accounting Standards Codification
-Section S99
-Paragraph 1
-Subparagraph (SX 210.4-08(g)(1)(ii))
-Publisher FASB
-URI https://asc.fasb.org/1943274/2147480678/235-10-S99-1
Reference 44: http://www.xbrl.org/2009/role/commonPracticeRef
-Topic 323
-SubTopic 10
-Name Accounting Standards Codification
-Section 50
-Paragraph 3
-Subparagraph (c)
-Publisher FASB
-URI https://asc.fasb.org/1943274/2147481687/323-10-50-3
Reference 45: http://www.xbrl.org/2009/role/commonPracticeRef
-Topic 825
-SubTopic 10
-Name Accounting Standards Codification
-Section 50
-Paragraph 28
-Subparagraph (f)
-Publisher FASB
-URI https://asc.fasb.org/1943274/2147482907/825-10-50-28
Reference 46: http://fasb.org/us-gaap/role/ref/legacyRef
-Name Accounting Standards Codification
-Topic 810
-SubTopic 10
-Section 45
-Paragraph 15
-Publisher FASB
-URI https://asc.fasb.org/1943274/2147481231/810-10-45-15
Reference 47: http://fasb.org/us-gaap/role/ref/legacyRef
-Name Accounting Standards Codification
-Topic 810
-SubTopic 10
-Section 45
-Paragraph 16
-Publisher FASB
-URI https://asc.fasb.org/1943274/2147481231/810-10-45-16
Reference 48: http://fasb.org/us-gaap/role/ref/legacyRef
-Name Accounting Standards Codification
-Topic 810
-SubTopic 10
-Section 55
-Paragraph 4I
-Publisher FASB
-URI https://asc.fasb.org/1943274/2147481175/810-10-55-4I
Reference 49: http://www.xbrl.org/2003/role/disclosureRef
-Topic 350
-SubTopic 60
-Name Accounting Standards Codification
-Section 65
-Paragraph 1
-Subparagraph (b)
-Publisher FASB
-URI https://asc.fasb.org/1943274/2147476166/350-60-65-1
| Name: |
us-gaap_StockholdersEquityIncludingPortionAttributableToNoncontrollingInterest |
| Namespace Prefix: |
us-gaap_ |
| Data Type: |
xbrli:monetaryItemType |
| Balance Type: |
credit |
| Period Type: |
instant |
|
| X |
- Details
| Name: |
us-gaap_StatementEquityComponentsAxis=us-gaap_AdditionalPaidInCapitalMember |
| Namespace Prefix: |
|
| Data Type: |
na |
| Balance Type: |
|
| Period Type: |
|
|
| X |
- Details
| Name: |
us-gaap_StatementEquityComponentsAxis=us-gaap_RetainedEarningsMember |
| Namespace Prefix: |
|
| Data Type: |
na |
| Balance Type: |
|
| Period Type: |
|
|
| X |
- Details
| Name: |
us-gaap_StatementEquityComponentsAxis=us-gaap_AccumulatedOtherComprehensiveIncomeMember |
| Namespace Prefix: |
|
| Data Type: |
na |
| Balance Type: |
|
| Period Type: |
|
|
| X |
- Details
| Name: |
us-gaap_StatementEquityComponentsAxis=us-gaap_ParentMember |
| Namespace Prefix: |
|
| Data Type: |
na |
| Balance Type: |
|
| Period Type: |
|
|
| X |
- Details
| Name: |
us-gaap_StatementEquityComponentsAxis=us-gaap_NoncontrollingInterestMember |
| Namespace Prefix: |
|
| Data Type: |
na |
| Balance Type: |
|
| Period Type: |
|
|
| X |
- Details
| Name: |
us-gaap_StatementClassOfStockAxis=us-gaap_CommonClassAMember |
| Namespace Prefix: |
|
| Data Type: |
na |
| Balance Type: |
|
| Period Type: |
|
|
| X |
- Details
| Name: |
us-gaap_StatementEquityComponentsAxis=us-gaap_CommonStockMember |
| Namespace Prefix: |
|
| Data Type: |
na |
| Balance Type: |
|
| Period Type: |
|
|
| X |
- Details
| Name: |
us-gaap_StatementClassOfStockAxis=us-gaap_CommonClassBMember |
| Namespace Prefix: |
|
| Data Type: |
na |
| Balance Type: |
|
| Period Type: |
|
|
v3.24.2
| X |
- DefinitionAmount of tax expense (benefit) allocated to other comprehensive income (loss). Reference 1: http://fasb.org/us-gaap/role/ref/legacyRef
-Name Accounting Standards Codification
-Section 45
-Paragraph 12
-SubTopic 10
-Topic 220
-Publisher FASB
-URI https://asc.fasb.org/1943274/2147482790/220-10-45-12
Reference 2: http://www.xbrl.org/2003/role/disclosureRef
-Topic 220
-SubTopic 10
-Name Accounting Standards Codification
-Section 50
-Paragraph 4
-Publisher FASB
-URI https://asc.fasb.org/1943274/2147482765/220-10-50-4
Reference 3: http://www.xbrl.org/2003/role/disclosureRef
-Topic 830
-SubTopic 30
-Name Accounting Standards Codification
-Section 50
-Paragraph 1
-Publisher FASB
-URI https://asc.fasb.org/1943274/2147481674/830-30-50-1
Reference 4: http://www.xbrl.org/2003/role/disclosureRef
-Topic 830
-SubTopic 30
-Name Accounting Standards Codification
-Section 45
-Paragraph 17
-Publisher FASB
-URI https://asc.fasb.org/1943274/2147481694/830-30-45-17
Reference 5: http://www.xbrl.org/2003/role/disclosureRef
-Topic 830
-SubTopic 30
-Name Accounting Standards Codification
-Section 45
-Paragraph 20
-Subparagraph (c)
-Publisher FASB
-URI https://asc.fasb.org/1943274/2147481694/830-30-45-20
Reference 6: http://www.xbrl.org/2003/role/disclosureRef
-Topic 944
-SubTopic 220
-Name Accounting Standards Codification
-Section S99
-Paragraph 1
-Subparagraph (SX 210.7-04(19))
-Publisher FASB
-URI https://asc.fasb.org/1943274/2147477250/944-220-S99-1
Reference 7: http://www.xbrl.org/2003/role/disclosureRef
-Topic 740
-SubTopic 10
-Name Accounting Standards Codification
-Section 50
-Paragraph 10
-Publisher FASB
-URI https://asc.fasb.org/1943274/2147482685/740-10-50-10
Reference 8: http://www.xbrl.org/2003/role/disclosureRef
-Topic 740
-SubTopic 20
-Name Accounting Standards Codification
-Section 45
-Paragraph 11
-Subparagraph (b)
-Publisher FASB
-URI https://asc.fasb.org/1943274/2147482659/740-20-45-11
Reference 9: http://www.xbrl.org/2003/role/disclosureRef
-Topic 220
-SubTopic 10
-Name Accounting Standards Codification
-Section S99
-Paragraph 2
-Subparagraph (SX 210.5-03(21))
-Publisher FASB
-URI https://asc.fasb.org/1943274/2147483621/220-10-S99-2
Reference 10: http://www.xbrl.org/2003/role/disclosureRef
-Topic 942
-SubTopic 220
-Name Accounting Standards Codification
-Section S99
-Paragraph 1
-Subparagraph (SX 210.9-04(23))
-Publisher FASB
-URI https://asc.fasb.org/1943274/2147478524/942-220-S99-1
Reference 11: http://www.xbrl.org/2003/role/disclosureRef
-Topic 740
-SubTopic 20
-Name Accounting Standards Codification
-Section 45
-Paragraph 2
-Subparagraph (d)
-Publisher FASB
-URI https://asc.fasb.org/1943274/2147482659/740-20-45-2
| Name: |
us-gaap_OtherComprehensiveIncomeLossTax |
| Namespace Prefix: |
us-gaap_ |
| Data Type: |
xbrli:monetaryItemType |
| Balance Type: |
debit |
| Period Type: |
duration |
|
| X |
- References
+ Details
| Name: |
us-gaap_StatementOfStockholdersEquityAbstract |
| Namespace Prefix: |
us-gaap_ |
| Data Type: |
xbrli:stringItemType |
| Balance Type: |
na |
| Period Type: |
duration |
|
v3.24.2
Condensed Consolidated Statements of Cash Flows - USD ($)
$ in Thousands |
6 Months Ended |
Jun. 30, 2024 |
Jun. 30, 2023 |
| CASH FLOWS FROM OPERATING ACTIVITIES: |
|
|
| Net income |
$ 44,310
|
$ 40,821
|
| Adjustments to reconcile net income to net cash (used in) provided by operating activities: |
|
|
| Equity in earnings from unconsolidated entities |
(33,084)
|
(53,176)
|
| Return on investment from Great Park Venture |
33,130
|
52,736
|
| Deferred income taxes |
5,886
|
0
|
| Depreciation and amortization |
13,102
|
11,204
|
| Share-based compensation |
1,816
|
1,693
|
| Changes in operating assets and liabilities: |
|
|
| Inventories |
(76,673)
|
(14,867)
|
| Related party assets |
(37,813)
|
6,013
|
| Other assets |
1,809
|
2,430
|
| Accounts payable and other liabilities |
1,759
|
(3,520)
|
| Related party liabilities |
(3,901)
|
(5,409)
|
| Net cash (used in) provided by operating activities |
(49,659)
|
37,925
|
| CASH FLOWS FROM INVESTING ACTIVITIES: |
|
|
| Purchase of properties and equipment |
(454)
|
0
|
| Net cash provided by investing activities |
14,522
|
29,676
|
| CASH FLOWS FROM FINANCING ACTIVITIES: |
|
|
| Payment of financing costs |
(454)
|
0
|
| Related party reimbursement obligation |
0
|
(3,993)
|
| Reacquisition of share-based compensation awards for tax-withholding purposes |
(823)
|
(202)
|
| Repayments of notes payable |
(100,000)
|
0
|
| Tax distributions to noncontrolling interests |
0
|
(1,974)
|
| Net cash used in financing activities |
(101,277)
|
(6,169)
|
| NET (DECREASE) INCREASE IN CASH, CASH EQUIVALENTS, AND RESTRICTED CASH |
(136,414)
|
61,432
|
| CASH, CASH EQUIVALENTS, AND RESTRICTED CASH—Beginning of period |
354,793
|
132,763
|
| CASH, CASH EQUIVALENTS, AND RESTRICTED CASH—End of period |
218,379
|
194,195
|
| Great Park Venture |
|
|
| Adjustments to reconcile net income to net cash (used in) provided by operating activities: |
|
|
| Equity in earnings from unconsolidated entities |
(33,130)
|
(53,484)
|
| CASH FLOWS FROM INVESTING ACTIVITIES: |
|
|
| Return of investment |
14,176
|
29,028
|
| Valencia Landbank Venture |
|
|
| Adjustments to reconcile net income to net cash (used in) provided by operating activities: |
|
|
| Equity in earnings from unconsolidated entities |
(300)
|
(400)
|
| CASH FLOWS FROM INVESTING ACTIVITIES: |
|
|
| Return of investment |
$ 800
|
$ 648
|
| X |
- References
+ Details
| Name: |
us-gaap_AdjustmentsToReconcileNetIncomeLossToCashProvidedByUsedInOperatingActivitiesAbstract |
| Namespace Prefix: |
us-gaap_ |
| Data Type: |
xbrli:stringItemType |
| Balance Type: |
na |
| Period Type: |
duration |
|
| X |
- DefinitionAmount of cash and cash equivalents, and cash and cash equivalents restricted to withdrawal or usage. Excludes amount for disposal group and discontinued operations. Cash includes, but is not limited to, currency on hand, demand deposits with banks or financial institutions, and other accounts with general characteristics of demand deposits. Cash equivalents include, but are not limited to, short-term, highly liquid investments that are both readily convertible to known amounts of cash and so near their maturity that they present insignificant risk of changes in value because of changes in interest rates. Reference 1: http://www.xbrl.org/2003/role/disclosureRef
-Topic 230
-SubTopic 10
-Name Accounting Standards Codification
-Section 50
-Paragraph 8
-Publisher FASB
-URI https://asc.fasb.org/1943274/2147482913/230-10-50-8
Reference 2: http://fasb.org/us-gaap/role/ref/legacyRef
-Topic 230
-SubTopic 10
-Name Accounting Standards Codification
-Section 45
-Paragraph 24
-Publisher FASB
-URI https://asc.fasb.org/1943274/2147482740/230-10-45-24
Reference 3: http://fasb.org/us-gaap/role/ref/legacyRef
-Name Accounting Standards Codification
-Topic 230
-SubTopic 10
-Section 45
-Paragraph 4
-Publisher FASB
-URI https://asc.fasb.org/1943274/2147482740/230-10-45-4
| Name: |
us-gaap_CashCashEquivalentsRestrictedCashAndRestrictedCashEquivalents |
| Namespace Prefix: |
us-gaap_ |
| Data Type: |
xbrli:monetaryItemType |
| Balance Type: |
debit |
| Period Type: |
instant |
|
| X |
- DefinitionAmount of increase (decrease) in cash, cash equivalents, and cash and cash equivalents restricted to withdrawal or usage; including effect from exchange rate change. Cash includes, but is not limited to, currency on hand, demand deposits with banks or financial institutions, and other accounts with general characteristics of demand deposits. Cash equivalents include, but are not limited to, short-term, highly liquid investments that are both readily convertible to known amounts of cash and so near their maturity that they present insignificant risk of changes in value because of changes in interest rates. Reference 1: http://fasb.org/us-gaap/role/ref/legacyRef
-Topic 230
-SubTopic 10
-Name Accounting Standards Codification
-Section 45
-Paragraph 24
-Publisher FASB
-URI https://asc.fasb.org/1943274/2147482740/230-10-45-24
Reference 2: http://fasb.org/us-gaap/role/ref/legacyRef
-Name Accounting Standards Codification
-Section 45
-Paragraph 1
-SubTopic 230
-Topic 830
-Publisher FASB
-URI https://asc.fasb.org/1943274/2147477401/830-230-45-1
| Name: |
us-gaap_CashCashEquivalentsRestrictedCashAndRestrictedCashEquivalentsPeriodIncreaseDecreaseIncludingExchangeRateEffect |
| Namespace Prefix: |
us-gaap_ |
| Data Type: |
xbrli:monetaryItemType |
| Balance Type: |
debit |
| Period Type: |
duration |
|
| X |
- DefinitionThe aggregate expense recognized in the current period that allocates the cost of tangible assets, intangible assets, or depleting assets to periods that benefit from use of the assets. Reference 1: http://fasb.org/us-gaap/role/ref/legacyRef
-Name Accounting Standards Codification
-Section 45
-Paragraph 28
-Subparagraph (b)
-SubTopic 10
-Topic 230
-Publisher FASB
-URI https://asc.fasb.org/1943274/2147482740/230-10-45-28
Reference 2: http://www.xbrl.org/2003/role/exampleRef
-Topic 280
-SubTopic 10
-Name Accounting Standards Codification
-Section 55
-Paragraph 48
-Publisher FASB
-URI https://asc.fasb.org/1943274/2147482785/280-10-55-48
Reference 3: http://www.xbrl.org/2003/role/exampleRef
-Topic 280
-SubTopic 10
-Name Accounting Standards Codification
-Section 55
-Paragraph 49
-Publisher FASB
-URI https://asc.fasb.org/1943274/2147482785/280-10-55-49
Reference 4: http://www.xbrl.org/2003/role/disclosureRef
-Topic 270
-SubTopic 10
-Name Accounting Standards Codification
-Section 50
-Paragraph 1
-Subparagraph (i)
-Publisher FASB
-URI https://asc.fasb.org/1943274/2147482964/270-10-50-1
Reference 5: http://www.xbrl.org/2003/role/disclosureRef
-Topic 280
-SubTopic 10
-Name Accounting Standards Codification
-Section 50
-Paragraph 32
-Subparagraph (ee)
-Publisher FASB
-URI https://asc.fasb.org/1943274/2147482810/280-10-50-32
Reference 6: http://www.xbrl.org/2003/role/disclosureRef
-Topic 280
-SubTopic 10
-Name Accounting Standards Codification
-Section 50
-Paragraph 22
-Subparagraph (e)
-Publisher FASB
-URI https://asc.fasb.org/1943274/2147482810/280-10-50-22
| Name: |
us-gaap_DepreciationDepletionAndAmortization |
| Namespace Prefix: |
us-gaap_ |
| Data Type: |
xbrli:monetaryItemType |
| Balance Type: |
debit |
| Period Type: |
duration |
|
| X |
- DefinitionAmount of distribution received from equity method investee for return on investment, classified as operating activities. Excludes distribution for return of investment, classified as investing activities. Reference 1: http://fasb.org/us-gaap/role/ref/legacyRef
-Name Accounting Standards Codification
-Section 45
-Paragraph 28
-Subparagraph (b)
-SubTopic 10
-Topic 230
-Publisher FASB
-URI https://asc.fasb.org/1943274/2147482740/230-10-45-28
Reference 2: http://www.xbrl.org/2003/role/disclosureRef
-Topic 944
-SubTopic 220
-Name Accounting Standards Codification
-Section S99
-Paragraph 1
-Subparagraph (SX 210.7-04(10))
-Publisher FASB
-URI https://asc.fasb.org/1943274/2147477250/944-220-S99-1
Reference 3: http://fasb.org/us-gaap/role/ref/legacyRef
-Name Accounting Standards Codification
-Section 45
-Paragraph 21D
-SubTopic 10
-Topic 230
-Publisher FASB
-URI https://asc.fasb.org/1943274/2147482740/230-10-45-21D
Reference 4: http://fasb.org/us-gaap/role/ref/legacyRef
-Topic 220
-SubTopic 10
-Name Accounting Standards Codification
-Section S99
-Paragraph 2
-Subparagraph (SX 210.5-03(12))
-Publisher FASB
-URI https://asc.fasb.org/1943274/2147483621/220-10-S99-2
| Name: |
us-gaap_EquityMethodInvestmentDividendsOrDistributions |
| Namespace Prefix: |
us-gaap_ |
| Data Type: |
xbrli:monetaryItemType |
| Balance Type: |
debit |
| Period Type: |
duration |
|
| X |
- DefinitionAmount of income (loss) for proportionate share of equity method investee's income (loss). Reference 1: http://fasb.org/us-gaap/role/ref/legacyRef
-Name Accounting Standards Codification
-Section 45
-Paragraph 28
-Subparagraph (b)
-SubTopic 10
-Topic 230
-Publisher FASB
-URI https://asc.fasb.org/1943274/2147482740/230-10-45-28
Reference 2: http://www.xbrl.org/2003/role/disclosureRef
-Topic 270
-SubTopic 10
-Name Accounting Standards Codification
-Section 50
-Paragraph 1
-Subparagraph (i)
-Publisher FASB
-URI https://asc.fasb.org/1943274/2147482964/270-10-50-1
Reference 3: http://www.xbrl.org/2003/role/disclosureRef
-Topic 280
-SubTopic 10
-Name Accounting Standards Codification
-Section 50
-Paragraph 32
-Subparagraph (ee)
-Publisher FASB
-URI https://asc.fasb.org/1943274/2147482810/280-10-50-32
Reference 4: http://www.xbrl.org/2003/role/disclosureRef
-Topic 944
-SubTopic 220
-Name Accounting Standards Codification
-Section S99
-Paragraph 1
-Subparagraph (SX 210.7-04(10))
-Publisher FASB
-URI https://asc.fasb.org/1943274/2147477250/944-220-S99-1
Reference 5: http://www.xbrl.org/2003/role/disclosureRef
-Topic 323
-SubTopic 10
-Name Accounting Standards Codification
-Section 45
-Paragraph 1
-Publisher FASB
-URI https://asc.fasb.org/1943274/2147481664/323-10-45-1
Reference 6: http://www.xbrl.org/2003/role/disclosureRef
-Topic 280
-SubTopic 10
-Name Accounting Standards Codification
-Section 50
-Paragraph 22
-Subparagraph (g)
-Publisher FASB
-URI https://asc.fasb.org/1943274/2147482810/280-10-50-22
Reference 7: http://fasb.org/us-gaap/role/ref/legacyRef
-Topic 220
-SubTopic 10
-Name Accounting Standards Codification
-Section S99
-Paragraph 2
-Subparagraph (SX 210.5-03(12))
-Publisher FASB
-URI https://asc.fasb.org/1943274/2147483621/220-10-S99-2
Reference 8: http://fasb.org/us-gaap/role/ref/legacyRef
-Topic 942
-SubTopic 220
-Name Accounting Standards Codification
-Section S99
-Paragraph 1
-Subparagraph (SX 210.9-04(13)(f))
-Publisher FASB
-URI https://asc.fasb.org/1943274/2147478524/942-220-S99-1
| Name: |
us-gaap_IncomeLossFromEquityMethodInvestments |
| Namespace Prefix: |
us-gaap_ |
| Data Type: |
xbrli:monetaryItemType |
| Balance Type: |
credit |
| Period Type: |
duration |
|
| X |
- DefinitionThe increase (decrease) during the reporting period in the amounts payable to vendors for goods and services received and the amount of obligations and expenses incurred but not paid. Reference 1: http://fasb.org/us-gaap/role/ref/legacyRef
-Name Accounting Standards Codification
-Section 45
-Paragraph 28
-Subparagraph (a)
-SubTopic 10
-Topic 230
-Publisher FASB
-URI https://asc.fasb.org/1943274/2147482740/230-10-45-28
| Name: |
us-gaap_IncreaseDecreaseInAccountsPayableAndAccruedLiabilities |
| Namespace Prefix: |
us-gaap_ |
| Data Type: |
xbrli:monetaryItemType |
| Balance Type: |
debit |
| Period Type: |
duration |
|
| X |
- DefinitionThe increase (decrease) during the reporting period in the aggregate value of all inventory held by the reporting entity, associated with underlying transactions that are classified as operating activities. Reference 1: http://fasb.org/us-gaap/role/ref/legacyRef
-Name Accounting Standards Codification
-Section 45
-Paragraph 28
-Subparagraph (a)
-SubTopic 10
-Topic 230
-Publisher FASB
-URI https://asc.fasb.org/1943274/2147482740/230-10-45-28
| Name: |
us-gaap_IncreaseDecreaseInInventories |
| Namespace Prefix: |
us-gaap_ |
| Data Type: |
xbrli:monetaryItemType |
| Balance Type: |
credit |
| Period Type: |
duration |
|
| X |
- References
+ Details
| Name: |
us-gaap_IncreaseDecreaseInOperatingAssetsAbstract |
| Namespace Prefix: |
us-gaap_ |
| Data Type: |
xbrli:stringItemType |
| Balance Type: |
na |
| Period Type: |
duration |
|
| X |
- DefinitionAmount of increase (decrease) in operating assets classified as other. Reference 1: http://fasb.org/us-gaap/role/ref/legacyRef
-Name Accounting Standards Codification
-Section 45
-Paragraph 28
-Subparagraph (a)
-SubTopic 10
-Topic 230
-Publisher FASB
-URI https://asc.fasb.org/1943274/2147482740/230-10-45-28
| Name: |
us-gaap_IncreaseDecreaseInOtherOperatingAssets |
| Namespace Prefix: |
us-gaap_ |
| Data Type: |
xbrli:monetaryItemType |
| Balance Type: |
credit |
| Period Type: |
duration |
|
| X |
- DefinitionAmount of cash inflow (outflow) from financing activities, including discontinued operations. Financing activity cash flows include obtaining resources from owners and providing them with a return on, and a return of, their investment; borrowing money and repaying amounts borrowed, or settling the obligation; and obtaining and paying for other resources obtained from creditors on long-term credit. Reference 1: http://www.xbrl.org/2003/role/disclosureRef
-Topic 230
-SubTopic 10
-Name Accounting Standards Codification
-Section 45
-Paragraph 24
-Publisher FASB
-URI https://asc.fasb.org/1943274/2147482740/230-10-45-24
| Name: |
us-gaap_NetCashProvidedByUsedInFinancingActivities |
| Namespace Prefix: |
us-gaap_ |
| Data Type: |
xbrli:monetaryItemType |
| Balance Type: |
debit |
| Period Type: |
duration |
|
| X |
- References
+ Details
| Name: |
us-gaap_NetCashProvidedByUsedInFinancingActivitiesContinuingOperationsAbstract |
| Namespace Prefix: |
us-gaap_ |
| Data Type: |
xbrli:stringItemType |
| Balance Type: |
na |
| Period Type: |
duration |
|
| X |
- DefinitionAmount of cash inflow (outflow) from investing activities, including discontinued operations. Investing activity cash flows include making and collecting loans and acquiring and disposing of debt or equity instruments and property, plant, and equipment and other productive assets. Reference 1: http://www.xbrl.org/2003/role/disclosureRef
-Topic 230
-SubTopic 10
-Name Accounting Standards Codification
-Section 45
-Paragraph 24
-Publisher FASB
-URI https://asc.fasb.org/1943274/2147482740/230-10-45-24
| Name: |
us-gaap_NetCashProvidedByUsedInInvestingActivities |
| Namespace Prefix: |
us-gaap_ |
| Data Type: |
xbrli:monetaryItemType |
| Balance Type: |
debit |
| Period Type: |
duration |
|
| X |
- References
+ Details
| Name: |
us-gaap_NetCashProvidedByUsedInInvestingActivitiesContinuingOperationsAbstract |
| Namespace Prefix: |
us-gaap_ |
| Data Type: |
xbrli:stringItemType |
| Balance Type: |
na |
| Period Type: |
duration |
|
| X |
- DefinitionAmount of cash inflow (outflow) from operating activities, including discontinued operations. Operating activity cash flows include transactions, adjustments, and changes in value not defined as investing or financing activities. Reference 1: http://fasb.org/us-gaap/role/ref/legacyRef
-Topic 230
-SubTopic 10
-Name Accounting Standards Codification
-Section 45
-Paragraph 28
-Publisher FASB
-URI https://asc.fasb.org/1943274/2147482740/230-10-45-28
Reference 2: http://fasb.org/us-gaap/role/ref/legacyRef
-Topic 230
-SubTopic 10
-Name Accounting Standards Codification
-Section 45
-Paragraph 24
-Publisher FASB
-URI https://asc.fasb.org/1943274/2147482740/230-10-45-24
Reference 3: http://fasb.org/us-gaap/role/ref/legacyRef
-Topic 230
-SubTopic 10
-Name Accounting Standards Codification
-Section 45
-Paragraph 25
-Publisher FASB
-URI https://asc.fasb.org/1943274/2147482740/230-10-45-25
| Name: |
us-gaap_NetCashProvidedByUsedInOperatingActivities |
| Namespace Prefix: |
us-gaap_ |
| Data Type: |
xbrli:monetaryItemType |
| Balance Type: |
na |
| Period Type: |
duration |
|
| X |
- References
+ Details
| Name: |
us-gaap_NetCashProvidedByUsedInOperatingActivitiesContinuingOperationsAbstract |
| Namespace Prefix: |
us-gaap_ |
| Data Type: |
xbrli:stringItemType |
| Balance Type: |
na |
| Period Type: |
duration |
|
| X |
- DefinitionCash outflow to owners or shareholders, excluding ordinary dividends. Includes special dividends. Reference 1: http://fasb.org/us-gaap/role/ref/legacyRef
-Topic 230
-SubTopic 10
-Name Accounting Standards Codification
-Section 45
-Paragraph 15
-Subparagraph (a)
-Publisher FASB
-URI https://asc.fasb.org/1943274/2147482740/230-10-45-15
| Name: |
us-gaap_PaymentsOfCapitalDistribution |
| Namespace Prefix: |
us-gaap_ |
| Data Type: |
xbrli:monetaryItemType |
| Balance Type: |
credit |
| Period Type: |
duration |
|
| X |
- DefinitionThe cash outflow for loan and debt issuance costs. Reference 1: http://fasb.org/us-gaap/role/ref/legacyRef
-Name Accounting Standards Codification
-Topic 230
-SubTopic 10
-Section 45
-Paragraph 15
-Publisher FASB
-URI https://asc.fasb.org/1943274/2147482740/230-10-45-15
| Name: |
us-gaap_PaymentsOfFinancingCosts |
| Namespace Prefix: |
us-gaap_ |
| Data Type: |
xbrli:monetaryItemType |
| Balance Type: |
credit |
| Period Type: |
duration |
|
| X |
- DefinitionThe cash outflow associated with the acquisition of long-lived, physical assets that are used in the normal conduct of business to produce goods and services and not intended for resale; includes cash outflows to pay for construction of self-constructed assets. Reference 1: http://fasb.org/us-gaap/role/ref/legacyRef
-Topic 230
-SubTopic 10
-Name Accounting Standards Codification
-Section 45
-Paragraph 13
-Subparagraph (c)
-Publisher FASB
-URI https://asc.fasb.org/1943274/2147482740/230-10-45-13
| Name: |
us-gaap_PaymentsToAcquirePropertyPlantAndEquipment |
| Namespace Prefix: |
us-gaap_ |
| Data Type: |
xbrli:monetaryItemType |
| Balance Type: |
credit |
| Period Type: |
duration |
|
| X |
- DefinitionAmount of distribution received from equity method investee for return of investment, classified as investing activities. Excludes distribution for return on investment, classified as operating activities. Reference 1: http://www.xbrl.org/2009/role/commonPracticeRef
-Topic 230
-SubTopic 10
-Name Accounting Standards Codification
-Section 45
-Paragraph 12
-Subparagraph (b)
-Publisher FASB
-URI https://asc.fasb.org/1943274/2147482740/230-10-45-12
Reference 2: http://www.xbrl.org/2003/role/disclosureRef
-Topic 230
-SubTopic 10
-Name Accounting Standards Codification
-Section 45
-Paragraph 21D
-Publisher FASB
-URI https://asc.fasb.org/1943274/2147482740/230-10-45-21D
| Name: |
us-gaap_ProceedsFromEquityMethodInvestmentDividendsOrDistributionsReturnOfCapital |
| Namespace Prefix: |
us-gaap_ |
| Data Type: |
xbrli:monetaryItemType |
| Balance Type: |
debit |
| Period Type: |
duration |
|
| X |
- DefinitionThe consolidated profit or loss for the period, net of income taxes, including the portion attributable to the noncontrolling interest. Reference 1: http://www.xbrl.org/2003/role/disclosureRef
-Topic 250
-SubTopic 10
-Name Accounting Standards Codification
-Section 50
-Paragraph 6
-Publisher FASB
-URI https://asc.fasb.org/1943274/2147483443/250-10-50-6
Reference 2: http://www.xbrl.org/2003/role/disclosureRef
-Topic 250
-SubTopic 10
-Name Accounting Standards Codification
-Section 50
-Paragraph 9
-Publisher FASB
-URI https://asc.fasb.org/1943274/2147483443/250-10-50-9
Reference 3: http://www.xbrl.org/2003/role/disclosureRef
-Topic 805
-SubTopic 60
-Name Accounting Standards Codification
-Section 65
-Paragraph 1
-Subparagraph (g)
-Publisher FASB
-URI https://asc.fasb.org/1943274/2147476176/805-60-65-1
Reference 4: http://www.xbrl.org/2003/role/disclosureRef
-Topic 740
-SubTopic 323
-Name Accounting Standards Codification
-Section 65
-Paragraph 2
-Subparagraph (g)(3)
-Publisher FASB
-URI https://asc.fasb.org/1943274/2147478666/740-323-65-2
Reference 5: http://www.xbrl.org/2003/role/disclosureRef
-Topic 235
-SubTopic 10
-Name Accounting Standards Codification
-Section S99
-Paragraph 1
-Subparagraph (SX 210.4-08(g)(1)(ii))
-Publisher FASB
-URI https://asc.fasb.org/1943274/2147480678/235-10-S99-1
Reference 6: http://www.xbrl.org/2003/role/disclosureRef
-Topic 323
-SubTopic 10
-Name Accounting Standards Codification
-Section 50
-Paragraph 3
-Subparagraph (c)
-Publisher FASB
-URI https://asc.fasb.org/1943274/2147481687/323-10-50-3
Reference 7: http://www.xbrl.org/2003/role/disclosureRef
-Topic 825
-SubTopic 10
-Name Accounting Standards Codification
-Section 50
-Paragraph 28
-Subparagraph (f)
-Publisher FASB
-URI https://asc.fasb.org/1943274/2147482907/825-10-50-28
Reference 8: http://www.xbrl.org/2003/role/disclosureRef
-Topic 250
-SubTopic 10
-Name Accounting Standards Codification
-Section 50
-Paragraph 1
-Subparagraph (b)(2)
-Publisher FASB
-URI https://asc.fasb.org/1943274/2147483443/250-10-50-1
Reference 9: http://www.xbrl.org/2003/role/disclosureRef
-Topic 815
-SubTopic 40
-Name Accounting Standards Codification
-Section 65
-Paragraph 1
-Subparagraph (f)
-Publisher FASB
-URI https://asc.fasb.org/1943274/2147480175/815-40-65-1
Reference 10: http://www.xbrl.org/2003/role/disclosureRef
-Topic 250
-SubTopic 10
-Name Accounting Standards Codification
-Section 50
-Paragraph 8
-Publisher FASB
-URI https://asc.fasb.org/1943274/2147483443/250-10-50-8
Reference 11: http://www.xbrl.org/2003/role/exampleRef
-Topic 946
-SubTopic 830
-Name Accounting Standards Codification
-Section 55
-Paragraph 11
-Publisher FASB
-URI https://asc.fasb.org/1943274/2147479168/946-830-55-11
Reference 12: http://www.xbrl.org/2003/role/disclosureRef
-Topic 946
-SubTopic 205
-Name Accounting Standards Codification
-Section 45
-Paragraph 3
-Subparagraph (a)
-Publisher FASB
-URI https://asc.fasb.org/1943274/2147478009/946-205-45-3
Reference 13: http://www.xbrl.org/2003/role/disclosureRef
-Topic 946
-SubTopic 220
-Name Accounting Standards Codification
-Section 45
-Paragraph 7
-Publisher FASB
-URI https://asc.fasb.org/1943274/2147479105/946-220-45-7
Reference 14: http://www.xbrl.org/2003/role/disclosureRef
-Topic 944
-SubTopic 220
-Name Accounting Standards Codification
-Section S99
-Paragraph 1
-Subparagraph (SX 210.7-04(16))
-Publisher FASB
-URI https://asc.fasb.org/1943274/2147477250/944-220-S99-1
Reference 15: http://www.xbrl.org/2003/role/disclosureRef
-Topic 946
-SubTopic 220
-Name Accounting Standards Codification
-Section S99
-Paragraph 1
-Subparagraph (SX 210.6-07(9))
-Publisher FASB
-URI https://asc.fasb.org/1943274/2147479134/946-220-S99-1
Reference 16: http://www.xbrl.org/2003/role/disclosureRef
-Topic 946
-SubTopic 220
-Name Accounting Standards Codification
-Section S99
-Paragraph 3
-Subparagraph (SX 210.6-09(1)(d))
-Publisher FASB
-URI https://asc.fasb.org/1943274/2147479134/946-220-S99-3
Reference 17: http://www.xbrl.org/2003/role/disclosureRef
-Topic 810
-SubTopic 10
-Name Accounting Standards Codification
-Section 45
-Paragraph 19
-Publisher FASB
-URI https://asc.fasb.org/1943274/2147481231/810-10-45-19
Reference 18: http://www.xbrl.org/2009/role/commonPracticeRef
-Topic 220
-SubTopic 10
-Name Accounting Standards Codification
-Section 50
-Paragraph 6
-Publisher FASB
-URI https://asc.fasb.org/1943274/2147482765/220-10-50-6
Reference 19: http://www.xbrl.org/2003/role/disclosureRef
-Topic 470
-SubTopic 10
-Name Accounting Standards Codification
-Section S99
-Paragraph 1A
-Subparagraph (SX 210.13-01(a)(4)(i))
-Publisher FASB
-URI https://asc.fasb.org/1943274/2147480097/470-10-S99-1A
Reference 20: http://www.xbrl.org/2009/role/commonPracticeRef
-Topic 470
-SubTopic 10
-Name Accounting Standards Codification
-Section S99
-Paragraph 1A
-Subparagraph (SX 210.13-01(a)(4)(ii))
-Publisher FASB
-URI https://asc.fasb.org/1943274/2147480097/470-10-S99-1A
Reference 21: http://www.xbrl.org/2003/role/disclosureRef
-Topic 470
-SubTopic 10
-Name Accounting Standards Codification
-Section S99
-Paragraph 1A
-Subparagraph (SX 210.13-01(a)(4)(iii)(A))
-Publisher FASB
-URI https://asc.fasb.org/1943274/2147480097/470-10-S99-1A
Reference 22: http://www.xbrl.org/2003/role/disclosureRef
-Topic 470
-SubTopic 10
-Name Accounting Standards Codification
-Section S99
-Paragraph 1A
-Subparagraph (SX 210.13-01(a)(4)(iv))
-Publisher FASB
-URI https://asc.fasb.org/1943274/2147480097/470-10-S99-1A
Reference 23: http://www.xbrl.org/2003/role/disclosureRef
-Topic 470
-SubTopic 10
-Name Accounting Standards Codification
-Section S99
-Paragraph 1A
-Subparagraph (SX 210.13-01(a)(5))
-Publisher FASB
-URI https://asc.fasb.org/1943274/2147480097/470-10-S99-1A
Reference 24: http://www.xbrl.org/2003/role/disclosureRef
-Topic 470
-SubTopic 10
-Name Accounting Standards Codification
-Section S99
-Paragraph 1B
-Subparagraph (SX 210.13-02(a)(4)(i))
-Publisher FASB
-URI https://asc.fasb.org/1943274/2147480097/470-10-S99-1B
Reference 25: http://www.xbrl.org/2003/role/disclosureRef
-Topic 470
-SubTopic 10
-Name Accounting Standards Codification
-Section S99
-Paragraph 1B
-Subparagraph (SX 210.13-02(a)(4)(iii)(A))
-Publisher FASB
-URI https://asc.fasb.org/1943274/2147480097/470-10-S99-1B
Reference 26: http://www.xbrl.org/2003/role/disclosureRef
-Topic 470
-SubTopic 10
-Name Accounting Standards Codification
-Section S99
-Paragraph 1B
-Subparagraph (SX 210.13-02(a)(4)(iii)(B))
-Publisher FASB
-URI https://asc.fasb.org/1943274/2147480097/470-10-S99-1B
Reference 27: http://www.xbrl.org/2003/role/disclosureRef
-Topic 470
-SubTopic 10
-Name Accounting Standards Codification
-Section S99
-Paragraph 1B
-Subparagraph (SX 210.13-02(a)(4)(iv))
-Publisher FASB
-URI https://asc.fasb.org/1943274/2147480097/470-10-S99-1B
Reference 28: http://www.xbrl.org/2003/role/disclosureRef
-Topic 470
-SubTopic 10
-Name Accounting Standards Codification
-Section S99
-Paragraph 1B
-Subparagraph (SX 210.13-02(a)(5))
-Publisher FASB
-URI https://asc.fasb.org/1943274/2147480097/470-10-S99-1B
Reference 29: http://www.xbrl.org/2003/role/disclosureRef
-Topic 942
-SubTopic 235
-Name Accounting Standards Codification
-Section S99
-Paragraph 1
-Subparagraph (SX 210.9-05(b)(2))
-Publisher FASB
-URI https://asc.fasb.org/1943274/2147477314/942-235-S99-1
Reference 30: http://www.xbrl.org/2003/role/disclosureRef
-Topic 205
-SubTopic 20
-Name Accounting Standards Codification
-Section 50
-Paragraph 7
-Publisher FASB
-URI https://asc.fasb.org/1943274/2147483499/205-20-50-7
Reference 31: http://www.xbrl.org/2003/role/exampleRef
-Topic 810
-SubTopic 10
-Name Accounting Standards Codification
-Section 55
-Paragraph 4J
-Publisher FASB
-URI https://asc.fasb.org/1943274/2147481175/810-10-55-4J
Reference 32: http://www.xbrl.org/2003/role/exampleRef
-Topic 810
-SubTopic 10
-Name Accounting Standards Codification
-Section 55
-Paragraph 4K
-Publisher FASB
-URI https://asc.fasb.org/1943274/2147481175/810-10-55-4K
Reference 33: http://www.xbrl.org/2003/role/disclosureRef
-Topic 220
-SubTopic 10
-Name Accounting Standards Codification
-Section 45
-Paragraph 1A
-Subparagraph (a)
-Publisher FASB
-URI https://asc.fasb.org/1943274/2147482790/220-10-45-1A
Reference 34: http://www.xbrl.org/2003/role/disclosureRef
-Topic 220
-SubTopic 10
-Name Accounting Standards Codification
-Section 45
-Paragraph 1B
-Subparagraph (a)
-Publisher FASB
-URI https://asc.fasb.org/1943274/2147482790/220-10-45-1B
Reference 35: http://www.xbrl.org/2003/role/disclosureRef
-Topic 230
-SubTopic 10
-Name Accounting Standards Codification
-Section 45
-Paragraph 2
-Publisher FASB
-URI https://asc.fasb.org/1943274/2147482740/230-10-45-2
Reference 36: http://www.xbrl.org/2003/role/disclosureRef
-Topic 810
-SubTopic 10
-Name Accounting Standards Codification
-Section 50
-Paragraph 1A
-Subparagraph (a)(1)
-Publisher FASB
-URI https://asc.fasb.org/1943274/2147481203/810-10-50-1A
Reference 37: http://www.xbrl.org/2003/role/disclosureRef
-Topic 810
-SubTopic 10
-Name Accounting Standards Codification
-Section 50
-Paragraph 1A
-Subparagraph (c)(1)
-Publisher FASB
-URI https://asc.fasb.org/1943274/2147481203/810-10-50-1A
| Name: |
us-gaap_ProfitLoss |
| Namespace Prefix: |
us-gaap_ |
| Data Type: |
xbrli:monetaryItemType |
| Balance Type: |
credit |
| Period Type: |
duration |
|
| X |
- DefinitionThe cash outflow for a borrowing supported by a written promise to pay an obligation. Reference 1: http://fasb.org/us-gaap/role/ref/legacyRef
-Topic 230
-SubTopic 10
-Name Accounting Standards Codification
-Section 45
-Paragraph 15
-Subparagraph (b)
-Publisher FASB
-URI https://asc.fasb.org/1943274/2147482740/230-10-45-15
| Name: |
us-gaap_RepaymentsOfNotesPayable |
| Namespace Prefix: |
us-gaap_ |
| Data Type: |
xbrli:monetaryItemType |
| Balance Type: |
credit |
| Period Type: |
duration |
|
| X |
- DefinitionAmount of noncash expense for share-based payment arrangement. Reference 1: http://fasb.org/us-gaap/role/ref/legacyRef
-Name Accounting Standards Codification
-Section 45
-Paragraph 28
-Subparagraph (a)
-SubTopic 10
-Topic 230
-Publisher FASB
-URI https://asc.fasb.org/1943274/2147482740/230-10-45-28
| Name: |
us-gaap_ShareBasedCompensation |
| Namespace Prefix: |
us-gaap_ |
| Data Type: |
xbrli:monetaryItemType |
| Balance Type: |
debit |
| Period Type: |
duration |
|
| X |
- Details
| Name: |
srt_ScheduleOfEquityMethodInvestmentEquityMethodInvesteeNameAxis=fph_GreatParkVentureMember |
| Namespace Prefix: |
|
| Data Type: |
na |
| Balance Type: |
|
| Period Type: |
|
|
| X |
- Details
| Name: |
srt_ScheduleOfEquityMethodInvestmentEquityMethodInvesteeNameAxis=fph_ValenciaLandbankVentureMember |
| Namespace Prefix: |
|
| Data Type: |
na |
| Balance Type: |
|
| Period Type: |
|
|
v3.24.2
Business and Organization
|
6 Months Ended |
Jun. 30, 2024 |
|---|
| Organization, Consolidation and Presentation of Financial Statements [Abstract] |
|
| Business and Organization |
BUSINESS AND ORGANIZATION Five Point Holdings, LLC, a Delaware limited liability company (the “Holding Company” and, together with its consolidated subsidiaries, the “Company”), is an owner and developer of mixed-use planned communities in California. The Holding Company owns all of its assets and conducts all of its operations through Five Point Operating Company, LP, a Delaware limited partnership (the “Operating Company”), and its subsidiaries. The Company has two classes of shares outstanding: Class A common shares and Class B common shares. Holders of Class A common shares and holders of Class B common shares are entitled to one vote for each share held of record on all matters submitted to a vote of shareholders, and are both entitled to receive distributions at the same time. However, the distributions paid to holders of Class B common shares are in an amount per share equal to 0.0003 multiplied by the amount paid per Class A common share. The Company presents noncontrolling interests on the Company’s condensed consolidated balance sheet and classifies such interests within capital but separate from the Company’s Class A and Class B members’ capital. Noncontrolling interests represent equity interests in the Company’s consolidated subsidiaries held by partners in the Operating Company, excluding the Holding Company, and members in The Shipyard Communities, LLC (the “San Francisco Venture”), excluding the Operating Company (see Note 5). The Company has an entity structure in which the Company’s two largest equity owners, Lennar Corporation (“Lennar”) and Castlelake, LP (“Castlelake”), and the Company’s founder and Chairman Emeritus, Emile Haddad, separately hold, in addition to interests in the Company’s common shares, equity interests in either or both the Operating Company or the San Francisco Venture that can be exchanged for, at the Company’s option, either the Company’s Class A common shares or cash. The diagram below presents a simplified depiction of the Company’s organizational structure as of June 30, 2024: (1) A wholly owned subsidiary of the Holding Company serves as the sole managing general partner of the Operating Company. As of June 30, 2024, the Company owned approximately 62.6% of the outstanding Class A Common Units of the Operating Company. After a one year holding period, a holder of Class A Common Units of the Operating Company can exchange the units for, at the Company’s option, either Class A common shares of the Holding Company, on a one-for-one basis, or cash equal to the fair market value of such shares. Until Class A Common Units of the Operating Company are exchanged or redeemed, the capital associated with Class A Common Units of the Operating Company not held by the Holding Company is presented within “noncontrolling interests” on the Company’s condensed consolidated balance sheet. Assuming the exchange of all outstanding Class A Common Units of the Operating Company and all outstanding Class A units of the San Francisco Venture (see (2) below), that are not held by the Company, based on the closing price of the Company’s Class A common shares on July 12, 2024 ($2.99), the equity market capitalization of the Company was approximately $444.4 million. (2) The Operating Company owns all of the outstanding Class B units of the San Francisco Venture, the entity developing the Candlestick and The San Francisco Shipyard communities. The Class A units of the San Francisco Venture, which the Operating Company does not own, are intended to be economically equivalent to Class A Common Units of the Operating Company. As the holder of all outstanding Class B units of the San Francisco Venture, the Operating Company is entitled to receive 99% of available cash from the San Francisco Venture after the holders of Class A units in the San Francisco Venture have received distributions equivalent to the distributions, if any, paid on Class A Common Units of the Operating Company. Class A units of the San Francisco Venture can be exchanged, on a one-for-one basis, for Class A Common Units of the Operating Company (See Note 5). Until exchanged or redeemed through the Operating Company, the capital associated with Class A units of the San Francisco Venture is presented within “noncontrolling interests” on the Company’s condensed consolidated balance sheet. (3) Together, the Operating Company, Five Point Communities, LP, a Delaware limited partnership (“FP LP”), and Five Point Communities Management, Inc., a Delaware corporation (“FP Inc.” and together with FP LP, the “Management Company”) own 100% of Five Point Land, LLC, a Delaware limited liability company (“FPL”), the entity developing Valencia, a mixed-use planned community located in northern Los Angeles County, California. The Operating Company has a controlling interest in the Management Company. (4) Interests in Heritage Fields LLC, a Delaware limited liability company (the “Great Park Venture”), are either “Percentage Interests” or “Legacy Interests.” Holders of the Legacy Interests were entitled to receive priority distributions up to an aggregate amount of $565.0 million, of which $561.7 million had been distributed as of July 12, 2024 (See Note 4). The Company owns a 37.5% Percentage Interest in the Great Park Venture and serves as its administrative member. However, management of the Great Park Venture is vested in the four voting members, who have a total of five votes. Major decisions generally require the approval of at least 75% of the votes of the voting members. The Company has two votes, and the other three voting members each have one vote, so the Company is unable to approve any major decision without the consent or approval of at least two of the other voting members. The Company does not include the Great Park Venture as a consolidated subsidiary, but rather as an equity method investee, in its condensed consolidated financial statements. (5) The Company owns a 75% interest in Five Point Office Venture Holdings I, LLC, a Delaware limited liability company (the “Gateway Commercial Venture”). The Company manages the Gateway Commercial Venture, however, the manager’s authority is limited. Major decisions by the Gateway Commercial Venture generally require unanimous approval by an executive committee composed of two people designated by the Company and two people designated by another investor. Some decisions require approval by all of the members of the Gateway Commercial Venture. The Company does not include the Gateway Commercial Venture as a consolidated subsidiary, but rather as an equity method investee, in its condensed consolidated financial statements.
|
| X |
- References
+ Details
| Name: |
us-gaap_OrganizationConsolidationAndPresentationOfFinancialStatementsAbstract |
| Namespace Prefix: |
us-gaap_ |
| Data Type: |
xbrli:stringItemType |
| Balance Type: |
na |
| Period Type: |
duration |
|
| X |
- DefinitionThe entire disclosure for organization, consolidation and basis of presentation of financial statements disclosure. Reference 1: http://www.xbrl.org/2003/role/disclosureRef
-Topic 946
-SubTopic 10
-Name Accounting Standards Codification
-Section 50
-Paragraph 1
-Publisher FASB
-URI https://asc.fasb.org/1943274/2147480424/946-10-50-1
Reference 2: http://www.xbrl.org/2003/role/disclosureRef
-Topic 946
-SubTopic 10
-Name Accounting Standards Codification
-Section 50
-Paragraph 2
-Publisher FASB
-URI https://asc.fasb.org/1943274/2147480424/946-10-50-2
Reference 3: http://fasb.org/us-gaap/role/ref/legacyRef
-Topic 810
-Name Accounting Standards Codification
-Publisher FASB
-URI https://asc.fasb.org/810/tableOfContent
Reference 4: http://fasb.org/us-gaap/role/ref/legacyRef
-Topic 205
-Name Accounting Standards Codification
-Publisher FASB
-URI https://asc.fasb.org/205/tableOfContent
| Name: |
us-gaap_OrganizationConsolidationAndPresentationOfFinancialStatementsDisclosureTextBlock |
| Namespace Prefix: |
us-gaap_ |
| Data Type: |
dtr-types:textBlockItemType |
| Balance Type: |
na |
| Period Type: |
duration |
|
v3.24.2
Basis of Presentation
|
6 Months Ended |
Jun. 30, 2024 |
|---|
| Accounting Policies [Abstract] |
|
| Basis of Presentation |
BASIS OF PRESENTATION Principles of consolidation—The accompanying condensed consolidated financial statements include the accounts of the Holding Company and the accounts of all subsidiaries in which the Holding Company has a controlling interest and the consolidated accounts of variable interest entities (“VIEs”) in which the Holding Company is deemed to be the primary beneficiary. All intercompany transactions and balances have been eliminated in consolidation. Unaudited interim financial information—The accompanying condensed consolidated financial statements are unaudited and have been prepared in accordance with U.S. generally accepted accounting principles (“U.S. GAAP”) for interim financial information, the instructions to Form 10-Q and Article 10 of Regulation S-X. Accordingly, they do not include all of the information and notes required by U.S. GAAP for complete financial statements. These condensed consolidated financial statements should be read in conjunction with the Company’s Annual Report on Form 10-K for the year ended December 31, 2023. In the opinion of management, all adjustments (including normal recurring adjustments) considered necessary for a fair presentation have been included. Operating results and cash flows for the three and six months ended June 30, 2024 are not necessarily indicative of the operating results and cash flows that may be expected for the full year. Use of estimates—The preparation of financial statements in conformity with U.S. GAAP requires management to make estimates and assumptions that affect the reported amounts of assets and liabilities, disclosure of contingent assets and liabilities at the date of the financial statements, and the reported amounts of revenues and expenses during the reporting periods. Management evaluates its estimates on an ongoing basis and makes revisions to these estimates and related disclosures as experience develops or new information becomes known. Actual results could differ from those estimates. Miscellaneous other income (expense)—Miscellaneous other income (expense) consisted of the following (in thousands): | | | | | | | | | | | | | | | | | | | | | | | | | Three Months Ended June 30, | | Six Months Ended June 30, | | 2024 | | 2023 | | 2024 | | 2023 | | Net periodic pension benefit (cost) | $ | 23 | | | $ | (20) | | | $ | 47 | | | $ | (41) | | Other(1) | 3 | | | — | | | (5,928) | | | — | | | | | | | | | | | Total miscellaneous other income (expense) | $ | 26 | | | $ | (20) | | | $ | (5,881) | | | $ | (41) | |
(1) In January 2024, the Company settled an exchange offer on its $625.0 million 7.875% Senior Notes (see Note 9). For the six months ended June 30, 2024, the Company incurred $5.9 million in third party costs related to the debt modification, which is included in other in the table above. Recently issued accounting pronouncements—In November 2023, the Financial Accounting Standards Board (“FASB”) issued Accounting Standards Update (“ASU”) 2023-07, Segment Reporting (Topic 280): Improvements to Reportable Segment Disclosures, which primarily requires expanded disclosure of significant segment expenses and other segment items on an annual and interim basis. The standard is effective for fiscal years beginning after December 15, 2023, and interim periods within fiscal years beginning after December 15, 2024, with early adoption permitted. The standard will be applied retrospectively to all prior periods presented in the financial statements. The Company is currently evaluating the effect of this update on the Company’s financial statement disclosures. In December 2023, the FASB issued ASU 2023-09, Income Taxes (Topic 740): Improvements to Income Tax Disclosures, which primarily requires expanded disclosures for income taxes paid and the effective tax rate reconciliation. The standard is effective for fiscal years beginning after December 15, 2024, with early adoption permitted and can be applied on either a prospective or retrospective basis. The Company is currently evaluating the effect of this update on the Company’s financial statement disclosures.
|
| X |
- References
+ Details
| Name: |
us-gaap_AccountingPoliciesAbstract |
| Namespace Prefix: |
us-gaap_ |
| Data Type: |
xbrli:stringItemType |
| Balance Type: |
na |
| Period Type: |
duration |
|
| X |
- DefinitionThe entire disclosure for all significant accounting policies of the reporting entity. Reference 1: http://www.xbrl.org/2003/role/disclosureRef
-Topic 235
-SubTopic 10
-Name Accounting Standards Codification
-Section 50
-Paragraph 1
-Publisher FASB
-URI https://asc.fasb.org/1943274/2147483426/235-10-50-1
Reference 2: http://fasb.org/us-gaap/role/ref/legacyRef
-Topic 235
-Name Accounting Standards Codification
-Publisher FASB
-URI https://asc.fasb.org/235/tableOfContent
| Name: |
us-gaap_SignificantAccountingPoliciesTextBlock |
| Namespace Prefix: |
us-gaap_ |
| Data Type: |
dtr-types:textBlockItemType |
| Balance Type: |
na |
| Period Type: |
duration |
|
v3.24.2
Revenues
|
6 Months Ended |
Jun. 30, 2024 |
|---|
| Revenue from Contract with Customer [Abstract] |
|
| Revenues |
REVENUESThe following tables present the Company’s consolidated revenues disaggregated by revenue source and reporting segment (in thousands): | | | | | | | | | | | | | | | | | | | | | | | | | | | | | | | | | | | | | | | | | | | | | | | | | | | | | | | | | | | | | Three Months Ended June 30, 2024 | | Six Months Ended June 30, 2024 | | Valencia | | San Francisco | | Great Park(1) | | Commercial(1) | | Total | | Valencia | | San Francisco | | Great Park(1) | | Commercial(1) | | Total | Land sales and land sales—related party | $ | 310 | | | $ | — | | | $ | — | | | $ | — | | | $ | 310 | | | $ | 842 | | | $ | — | | | $ | — | | | $ | — | | | $ | 842 | | Management services—related party | — | | | — | | | 50,151 | | | 128 | | | 50,279 | | | — | | | — | | | 58,764 | | | 241 | | | 59,005 | | | Operating properties | 168 | | | — | | | — | | | — | | | 168 | | | 243 | | | — | | | — | | | — | | | 243 | | | 478 | | | — | | | 50,151 | | | 128 | | | 50,757 | | | 1,085 | | | — | | | 58,764 | | | 241 | | | 60,090 | | | Operating properties leasing revenues | 267 | | | 168 | | | — | | | — | | | 435 | | | 701 | | | 336 | | | — | | | — | | | 1,037 | | | $ | 745 | | | $ | 168 | | | $ | 50,151 | | | $ | 128 | | | $ | 51,192 | | | $ | 1,786 | | | $ | 336 | | | $ | 58,764 | | | $ | 241 | | | $ | 61,127 | |
| | | | | | | | | | | | | | | | | | | | | | | | | | | | | | | | | | | | | | | | | | | | | | | | | | | | | | | | | | | | | Three Months Ended June 30, 2023 | | Six Months Ended June 30, 2023 | | Valencia | | San Francisco | | Great Park(1) | | Commercial(1) | | Total | | Valencia | | San Francisco | | Great Park(1) | | Commercial(1) | | Total | Land sales and land sales—related party | $ | (13) | | | $ | — | | | $ | — | | | $ | — | | | $ | (13) | | | $ | 586 | | | $ | — | | | $ | — | | | $ | — | | | $ | 586 | | Management services—related party | — | | | — | | | 20,670 | | | 104 | | | 20,774 | | | — | | | — | | | 24,799 | | | 211 | | | 25,010 | | | Operating properties | 141 | | | — | | | — | | | — | | | 141 | | | 499 | | | — | | | — | | | — | | | 499 | | | 128 | | | — | | | 20,670 | | | 104 | | | 20,902 | | | 1,085 | | | — | | | 24,799 | | | 211 | | | 26,095 | | | Operating properties leasing revenues | 285 | | | 162 | | | — | | | — | | | 447 | | | 631 | | | 324 | | | — | | | — | | | 955 | | | $ | 413 | | | $ | 162 | | | $ | 20,670 | | | $ | 104 | | | $ | 21,349 | | | $ | 1,716 | | | $ | 324 | | | $ | 24,799 | | | $ | 211 | | | $ | 27,050 | | | | | | | | | | | | | | | | | | | | | |
(1) The tables above do not include revenues of the Great Park Venture and the Gateway Commercial Venture, which are included in the Company’s reporting segment totals (see Notes 4 and 13). The opening and closing balances of the Company’s contract assets for the six months ended June 30, 2024 were $72.1 million ($69.1 million related party, see Note 8) and $108.8 million ($106.9 million related party, see Note 8), respectively. The net increase of $36.7 million for the six months ended June 30, 2024 between the opening and closing balances of the Company’s contract assets primarily resulted from additional incentive compensation revenue recognized during the period that resulted from changes in the estimated constrained transaction price of the Company’s amended and restated development management agreement (“A&R DMA”) with the Great Park Venture (see Note 8) partially offset by the receipt of marketing fees from homebuilders from prior period land sales and the receipt of $14.3 million in incentive compensation payments from the Great Park Venture. The opening and closing balances of the Company’s contract assets for the six months ended June 30, 2023 were $86.5 million ($79.9 million related party, see Note 8) and $78.6 million ($73.8 million related party, see Note 8), respectively. The decrease of $7.9 million for the six months ended June 30, 2023 between the opening and closing balances of the Company’s contract assets primarily resulted from the receipt of marketing fees from homebuilders from prior period land sales and the receipt of $24.6 million in incentive compensation payments from the Great Park Venture partially offset by additional incentive compensation revenue earned during the period from the Company’s A&R DMA with the Great Park Venture (see Note 8). The opening and closing balances of the Company’s other receivables from contracts with customers and contract liabilities for the six months ended June 30, 2024 and 2023 were insignificant.
|
| X |
- References
+ Details
| Name: |
us-gaap_RevenueFromContractWithCustomerAbstract |
| Namespace Prefix: |
us-gaap_ |
| Data Type: |
xbrli:stringItemType |
| Balance Type: |
na |
| Period Type: |
duration |
|
| X |
- DefinitionThe entire disclosure of revenue from contract with customer to transfer good or service and to transfer nonfinancial asset. Includes, but is not limited to, disaggregation of revenue, credit loss recognized from contract with customer, judgment and change in judgment related to contract with customer, and asset recognized from cost incurred to obtain or fulfill contract with customer. Excludes insurance and lease contracts. Reference 1: http://www.xbrl.org/2003/role/disclosureRef
-Topic 606
-SubTopic 10
-Name Accounting Standards Codification
-Section 50
-Paragraph 9
-Publisher FASB
-URI https://asc.fasb.org/1943274/2147479806/606-10-50-9
Reference 2: http://www.xbrl.org/2003/role/disclosureRef
-Topic 606
-SubTopic 10
-Name Accounting Standards Codification
-Section 50
-Paragraph 10
-Publisher FASB
-URI https://asc.fasb.org/1943274/2147479806/606-10-50-10
Reference 3: http://www.xbrl.org/2003/role/disclosureRef
-Topic 606
-SubTopic 10
-Name Accounting Standards Codification
-Section 50
-Paragraph 15
-Publisher FASB
-URI https://asc.fasb.org/1943274/2147479806/606-10-50-15
Reference 4: http://www.xbrl.org/2003/role/disclosureRef
-Topic 606
-SubTopic 10
-Name Accounting Standards Codification
-Section 50
-Paragraph 12
-Subparagraph (a)
-Publisher FASB
-URI https://asc.fasb.org/1943274/2147479806/606-10-50-12
Reference 5: http://www.xbrl.org/2003/role/disclosureRef
-Topic 606
-SubTopic 10
-Name Accounting Standards Codification
-Section 50
-Paragraph 12
-Subparagraph (b)
-Publisher FASB
-URI https://asc.fasb.org/1943274/2147479806/606-10-50-12
Reference 6: http://www.xbrl.org/2003/role/disclosureRef
-Topic 606
-SubTopic 10
-Name Accounting Standards Codification
-Section 50
-Paragraph 12
-Subparagraph (c)
-Publisher FASB
-URI https://asc.fasb.org/1943274/2147479806/606-10-50-12
Reference 7: http://www.xbrl.org/2003/role/disclosureRef
-Topic 606
-SubTopic 10
-Name Accounting Standards Codification
-Section 50
-Paragraph 12
-Subparagraph (d)
-Publisher FASB
-URI https://asc.fasb.org/1943274/2147479806/606-10-50-12
Reference 8: http://www.xbrl.org/2003/role/disclosureRef
-Topic 606
-SubTopic 10
-Name Accounting Standards Codification
-Section 50
-Paragraph 12
-Subparagraph (e)
-Publisher FASB
-URI https://asc.fasb.org/1943274/2147479806/606-10-50-12
Reference 9: http://www.xbrl.org/2003/role/disclosureRef
-Topic 606
-SubTopic 10
-Name Accounting Standards Codification
-Section 50
-Paragraph 13
-Subparagraph (b)(2)
-Publisher FASB
-URI https://asc.fasb.org/1943274/2147479806/606-10-50-13
Reference 10: http://www.xbrl.org/2003/role/disclosureRef
-Name Accounting Standards Codification
-Topic 606
-Publisher FASB
-URI https://asc.fasb.org/606/tableOfContent
| Name: |
us-gaap_RevenueFromContractWithCustomerTextBlock |
| Namespace Prefix: |
us-gaap_ |
| Data Type: |
dtr-types:textBlockItemType |
| Balance Type: |
na |
| Period Type: |
duration |
|
v3.24.2
Investment In Unconsolidated Entities
|
6 Months Ended |
Jun. 30, 2024 |
|---|
| Equity Method Investments and Joint Ventures [Abstract] |
|
| Investment in Unconsolidated Entities |
INVESTMENT IN UNCONSOLIDATED ENTITIES Great Park Venture The Great Park Venture has two classes of membership interests—“Percentage Interests” and “Legacy Interests.” The Operating Company owned 37.5% of the Great Park Venture’s Percentage Interests as of June 30, 2024. During the six months ended June 30, 2024, the Great Park Venture made aggregate distributions of $14.8 million to holders of Legacy Interests and $126.2 million to holders of Percentage Interests. The Company received $47.3 million for its 37.5% Percentage Interest. As of June 30, 2024, Legacy Interest holders were entitled to receive a maximum of $3.3 million in distributions to be paid pro-rata with Percentage Interest holders. Approximately 10% of future distributions will be paid to the Legacy Interest holders until such time as the remaining balance has been fully paid. The holders of the Percentage Interests will receive all other distributions. The Great Park Venture is the owner of Great Park Neighborhoods, a mixed-use planned community located in Orange County, California. The Company, through the A&R DMA, as amended, manages the planning, development and sale of land at the Great Park Neighborhoods and supervises the day-to-day affairs of the Great Park Venture. The Great Park Venture is governed by an executive committee of representatives appointed by only the holders of Percentage Interests. The Company serves as the administrative member but does not control the actions of the executive committee. The Company accounts for its investment in the Great Park Venture using the equity method of accounting. The carrying value of the Company’s investment in the Great Park Venture is higher than the Company’s underlying share of equity in the carrying value of net assets of the Great Park Venture, resulting in a basis difference. The Company’s earnings or losses from the equity method investment are adjusted by amortization and accretion of the basis differences as the assets (mainly inventory) and liabilities that gave rise to the basis difference are sold, settled or amortized. During the six months ended June 30, 2024, the Great Park Venture recognized $16.6 million in land sale revenues to related parties of the Company and $215.5 million in land sale revenues to third parties. During the six months ended June 30, 2023, the Great Park Venture recognized $7.4 million in land sale revenues to related parties of the Company and $361.8 million in land sale revenues to third parties, of which $357.8 million relates to homesites sold to an unaffiliated land banking entity whereby a related party of the Company retained the option to acquire these homesites in the future from the land bank entity. The following table summarizes the statements of operations of the Great Park Venture for the six months ended June 30, 2024 and 2023 (in thousands): | | | | | | | | | | | | | Six Months Ended June 30, | | 2024 | | 2023 | | Land sale and related party land sale revenues | $ | 232,081 | | | $ | 369,196 | | | | | | Cost of land sales | (58,974) | | | (165,749) | | | | | | Other costs and expenses | (75,046) | | | (32,547) | | | Net income of Great Park Venture | $ | 98,061 | | | $ | 170,900 | | | The Company’s share of net income | $ | 36,773 | | | $ | 64,088 | | | Basis difference amortization, net | (3,643) | | | (10,604) | | | | | | | Equity in earnings from Great Park Venture | $ | 33,130 | | | $ | 53,484 | |
The following table summarizes the balance sheet data of the Great Park Venture and the Company’s investment balance as of June 30, 2024 and December 31, 2023 (in thousands): | | | | | | | | | | | | | June 30, 2024 | | December 31, 2023 | Inventories | $ | 304,477 | | | $ | 391,352 | | Cash and cash equivalents | 145,363 | | | 61,054 | | | Contract assets, receivables and other assets, net | 195,575 | | | 166,793 | | Total assets | $ | 645,415 | | | $ | 619,199 | | Accounts payable and other liabilities | $ | 253,935 | | | $ | 184,847 | | | | | | Redeemable Legacy Interests | 3,293 | | | 18,075 | | Capital (Percentage Interest) | 388,187 | | | 416,277 | | Total liabilities and capital | $ | 645,415 | | | $ | 619,199 | | The Company’s share of capital in Great Park Venture | $ | 145,572 | | | $ | 156,105 | | Unamortized basis difference | 54,038 | | | 57,681 | | The Company’s investment in the Great Park Venture | $ | 199,610 | | | $ | 213,786 | |
Gateway Commercial Venture The Company owned a 75% interest in the Gateway Commercial Venture as of June 30, 2024. The Gateway Commercial Venture is governed by an executive committee in which the Company is entitled to appoint two individuals. One of the other members of the Gateway Commercial Venture is also entitled to appoint two individuals to the executive committee. The unanimous approval of the executive committee is required for certain matters, which limits the Company’s ability to control the Gateway Commercial Venture, however, the Company is able to exercise significant influence and therefore accounts for its investment in the Gateway Commercial Venture using the equity method. The Company is the manager of the Gateway Commercial Venture, with responsibility to manage and administer its day-to-day affairs and implement a business plan approved by the executive committee. The Gateway Commercial Venture owns one commercial office building and approximately 50 acres of commercial land with additional development rights at a 73 acre office, medical, research and development campus located within the Great Park Neighborhoods (the “Five Point Gateway Campus”). The Five Point Gateway Campus consists of four buildings totaling approximately one million square feet. The Company and a subsidiary of Lennar lease portions of the building owned by the Gateway Commercial Venture, and during the six months ended June 30, 2024 and 2023, the Gateway Commercial Venture recognized $4.8 million and $4.2 million, respectively, in rental revenues from those leasing arrangements. The following table summarizes the statements of operations of the Gateway Commercial Venture for the six months ended June 30, 2024 and 2023 (in thousands): | | | | | | | | | | | | | Six Months Ended June 30, | | 2024 | | 2023 | | Rental revenues | $ | 4,773 | | | $ | 4,175 | | | Rental operating and other expenses | (1,787) | | | (1,967) | | | Depreciation and amortization | (2,008) | | | (1,989) | | | | | | | Interest expense | (1,384) | | | (1,108) | | | Net loss of Gateway Commercial Venture | $ | (406) | | | $ | (889) | | | Equity in loss from Gateway Commercial Venture | $ | (305) | | | $ | (667) | |
The following table summarizes the balance sheet data of the Gateway Commercial Venture and the Company’s investment balance as of June 30, 2024 and December 31, 2023 (in thousands): | | | | | | | | | | | | | June 30, 2024 | | December 31, 2023 | | Real estate and related intangible assets, net | $ | 74,711 | | | $ | 76,719 | | | Cash and restricted cash | 6,706 | | | 5,574 | | | Other assets | 3,583 | | | 3,554 | | | Total assets | $ | 85,000 | | | $ | 85,847 | | | Notes payable, net | $ | 28,745 | | | $ | 28,850 | | | Other liabilities | 6,286 | | | 6,623 | | | Members’ capital | 49,969 | | | 50,374 | | | Total liabilities and capital | $ | 85,000 | | | $ | 85,847 | | | The Company’s investment in the Gateway Commercial Venture | $ | 37,476 | | | $ | 37,781 | |
In August 2023, the Gateway Commercial Venture refinanced its mortgage note, extending the maturity date to August 2025. As a condition of the refinancing, the Company is subject to certain guaranties of the Gateway Commercial Venture’s mortgage note, including an interest and carry guaranty along with a springing guaranty of 50% of the outstanding balance in the event the Gateway Commercial Venture’s leases with either the Company or the affiliate of Lennar are no longer in effect and the Gateway Commercial Venture is unable to meet certain financial covenants. Valencia Landbank Venture As of June 30, 2024, the Company owned a 10% interest in the Valencia Landbank Venture, an entity organized in December 2020 for the purpose of taking assignment from homebuilders of purchase and sale agreements for the purchase of residential lots within the Valencia community. The Valencia Landbank Venture concurrently enters into option and development agreements with homebuilders pursuant to which the homebuilders retain the option to purchase the land to construct and sell homes. The Company does not have a controlling financial interest in the Valencia Landbank Venture, however, the Company has the ability to significantly influence the Valencia Landbank Venture’s operating and financial policies, and most major decisions require the Company’s approval in addition to the approval of the Valencia Landbank Venture’s other unaffiliated member, and therefore the Company accounts for its investment in the Valencia Landbank Venture using the equity method. At June 30, 2024 and December 31, 2023, the Company’s investment in the Valencia Landbank Venture was $0.7 million and $1.2 million, respectively, and the Company recognized $0.3 million and $0.4 million in equity in earnings for the six months ended June 30, 2024 and 2023, respectively.
|
| X |
- References
+ Details
| Name: |
us-gaap_EquityMethodInvestmentsAndJointVenturesAbstract |
| Namespace Prefix: |
us-gaap_ |
| Data Type: |
xbrli:stringItemType |
| Balance Type: |
na |
| Period Type: |
duration |
|
| X |
- DefinitionThe entire disclosure for equity method investments and joint ventures. Equity method investments are investments that give the investor the ability to exercise significant influence over the operating and financial policies of an investee. Joint ventures are entities owned and operated by a small group of businesses as a separate and specific business or project for the mutual benefit of the members of the group. Reference 1: http://www.xbrl.org/2003/role/recommendedDisclosureRef
-Topic 740
-SubTopic 323
-Name Accounting Standards Codification
-Section 50
-Paragraph 2
-Subparagraph (f)
-Publisher FASB
-URI https://asc.fasb.org/1943274/2147478156/740-323-50-2
Reference 2: http://www.xbrl.org/2003/role/disclosureRef
-Topic 323
-SubTopic 10
-Name Accounting Standards Codification
-Section 50
-Paragraph 3
-Subparagraph (a)(3)
-Publisher FASB
-URI https://asc.fasb.org/1943274/2147481687/323-10-50-3
Reference 3: http://www.xbrl.org/2003/role/disclosureRef
-Topic 323
-SubTopic 10
-Name Accounting Standards Codification
-Section 50
-Paragraph 3
-Subparagraph (d)
-Publisher FASB
-URI https://asc.fasb.org/1943274/2147481687/323-10-50-3
Reference 4: http://www.xbrl.org/2003/role/disclosureRef
-Name Accounting Standards Codification
-Topic 323
-Publisher FASB
-URI https://asc.fasb.org/323/tableOfContent
| Name: |
us-gaap_EquityMethodInvestmentsDisclosureTextBlock |
| Namespace Prefix: |
us-gaap_ |
| Data Type: |
dtr-types:textBlockItemType |
| Balance Type: |
na |
| Period Type: |
duration |
|
v3.24.2
Noncontrolling Interests
|
6 Months Ended |
Jun. 30, 2024 |
|---|
| Noncontrolling Interest [Abstract] |
|
| Noncontrolling Interests |
NONCONTROLLING INTERESTS The Operating Company The Holding Company’s wholly owned subsidiary is the managing general partner of the Operating Company, and at June 30, 2024, the Holding Company and its wholly owned subsidiary owned approximately 62.6% of the outstanding Class A Common Units and 100% of the outstanding Class B Common Units of the Operating Company. The Holding Company consolidates the financial results of the Operating Company and its subsidiaries and records a noncontrolling interest for the remaining 37.4% of the outstanding Class A Common Units of the Operating Company that are owned separately by affiliates of Lennar, affiliates of Castlelake and an entity controlled by Emile Haddad, the Company’s Chairman Emeritus of the Board of Directors (the “Management Partner”). After a 12 month holding period, holders of Class A Common Units of the Operating Company may exchange their units for, at the Company’s option, either (i) Class A common shares on a one-for-one basis (subject to adjustment in the event of share splits, distributions of shares, warrants or share rights, specified extraordinary distributions and similar events), or (ii) cash in an amount equal to the market value of such shares at the time of exchange. In either situation, an equal number of that holder’s Class B common shares will automatically convert into Class A common shares, at a ratio of 0.0003 Class A common shares for each Class B common share. This exchange right is currently exercisable by all holders of outstanding Class A Common Units of the Operating Company. With each exchange of Class A Common Units of the Operating Company for Class A common shares, the Holding Company’s percentage ownership interest in the Operating Company and its share of the Operating Company’s cash distributions and profits and losses will increase. Additionally, other issuances of common shares of the Holding Company or common units of the Operating Company result in changes to the noncontrolling interest percentage. Such equity transactions result in an adjustment between members’ capital and the noncontrolling interest in the Company’s condensed consolidated balance sheet and statement of capital to account for the changes in the noncontrolling interest ownership percentage as well as any change in total net assets of the Company. During the six months ended June 30, 2024 and 2023, the Holding Company’s ownership interest in the Operating Company changed as a result of net equity transactions related to the Company’s share-based compensation plan. The terms of the Operating Company’s Limited Partnership Agreement (“LPA”) provide for the payment of tax distributions to the Operating Company’s partners in an amount equal to the estimated income tax liabilities resulting from taxable income or gain allocated to those parties. The tax distribution provisions in the LPA were included in the Operating Company’s governing documents adopted prior to the Company’s initial public offering and were designed to provide funds necessary to pay tax liabilities for income that might be allocated, but not paid, to the partners. Tax distributions to the partners of the Operating Company for the three and six months ended June 30, 2024 and 2023, were as follows (in thousands): | | | | | | | | | | | | | | | | | | | | | | | | | Three Months Ended June 30, | | Six Months Ended June 30, | | 2024 | | 2023 | | 2024 | | 2023 | | Management Partner | $ | — | | | $ | — | | | $ | — | | | $ | 1,974 | | | Other partners (excluding the Holding Company) | — | | | — | | | — | | | — | | | Total tax distributions | $ | — | | | $ | — | | | $ | — | | | $ | 1,974 | |
Generally, tax distributions are treated as advance distributions under the LPA and are taken into account when determining the amounts otherwise distributable under the LPA. The San Francisco Venture The San Francisco Venture has three classes of units—Class A, Class B and Class C units. The Operating Company owns all of the outstanding Class B units of the San Francisco Venture. All of the outstanding Class A units are owned by Lennar and Castlelake. The Class A units of the San Francisco Venture are intended to be substantially economically equivalent to the Class A Common Units of the Operating Company. The Class A units of the San Francisco Venture represent noncontrolling interests to the Operating Company. Holders of Class A units of the San Francisco Venture can redeem their units at any time and receive Class A Common Units of the Operating Company on a one-for-one basis (subject to adjustment in the event of share splits, distributions of shares, warrants or share rights, specified extraordinary distributions and similar events). If a holder requests a redemption of Class A units of the San Francisco Venture that would result in the Holding Company’s ownership of the Operating Company falling below 50.1%, the Holding Company has the option of satisfying the redemption with Class A common shares instead. The Company also has the option, at any time, to acquire outstanding Class A units of the San Francisco Venture in exchange for Class A Common Units of the Operating Company. The 12 month holding period for any Class A Common Units of the Operating Company issued in exchange for Class A units of the San Francisco Venture is calculated by including the period that such Class A units of the San Francisco Venture were owned. This exchange right is currently exercisable by all holders of outstanding Class A units of the San Francisco Venture. Redeemable Noncontrolling Interest In 2019, the San Francisco Venture issued 25.0 million Class C units to an affiliate of Lennar in exchange for a contribution of $25.0 million to the San Francisco Venture. Provided that Lennar completes the construction of a certain number of new homes in Candlestick as contemplated under purchase and sale agreements with the Company, the San Francisco Venture is required to redeem the Class C units if and when the Company receives reimbursements from the Mello-Roos community facilities district formed for the development, in an aggregate amount equal to 50% of any reimbursements received up to a maximum amount of $25.0 million. The San Francisco Venture also maintains the ability to redeem the then outstanding balance of Class C units for cash at any time. Upon a liquidation of the San Francisco Venture, the holders of Class C Units are entitled to a liquidation preference. The maximum amount payable by the San Francisco Venture pursuant to redemptions or liquidation of the Class C units is $25.0 million. The holders of Class C units are not entitled to receive any other forms of distributions and are not entitled to any voting rights. In connection with the issuance of the Class C units, the San Francisco Venture agreed to spend $25.0 million on the development of infrastructure and/or parking facilities at the Company’s Candlestick development. At each of June 30, 2024 and December 31, 2023, $25.0 million of Class C units were outstanding and included in redeemable noncontrolling interest on the condensed consolidated balance sheets.
|
| X |
- DefinitionThe entire disclosure for noncontrolling interest in consolidated subsidiaries, which could include the name of the subsidiary, the ownership percentage held by the parent, the ownership percentage held by the noncontrolling owners, the amount of the noncontrolling interest, the location of this amount on the balance sheet (when not reported separately), an explanation of the increase or decrease in the amount of the noncontrolling interest, the noncontrolling interest share of the net Income or Loss of the subsidiary, the location of this amount on the income statement (when not reported separately), the nature of the noncontrolling interest such as background information and terms, the amount of the noncontrolling interest represented by preferred stock, a description of the preferred stock, and the dividend requirements of the preferred stock. Reference 1: http://fasb.org/us-gaap/role/ref/legacyRef
-Topic 810
-Name Accounting Standards Codification
-Publisher FASB
-URI https://asc.fasb.org/810/tableOfContent
| Name: |
us-gaap_MinorityInterestDisclosureTextBlock |
| Namespace Prefix: |
us-gaap_ |
| Data Type: |
dtr-types:textBlockItemType |
| Balance Type: |
na |
| Period Type: |
duration |
|
| X |
- References
+ Details
| Name: |
us-gaap_NoncontrollingInterestAbstract |
| Namespace Prefix: |
us-gaap_ |
| Data Type: |
xbrli:stringItemType |
| Balance Type: |
na |
| Period Type: |
duration |
|
v3.24.2
Consolidated Variable Interest Entity
|
6 Months Ended |
Jun. 30, 2024 |
|---|
| Organization, Consolidation and Presentation of Financial Statements [Abstract] |
|
| Consolidated Variable Interest Entity |
CONSOLIDATED VARIABLE INTEREST ENTITY The Holding Company conducts all of its operations through the Operating Company, a consolidated VIE, and as a result, substantially all of the Company’s assets and liabilities represent the assets and liabilities of the Operating Company, other than items attributed to income taxes and the payable pursuant to a tax receivable agreement (“TRA”). The Operating Company has investments in and consolidates the assets and liabilities of the San Francisco Venture, FP LP and FPL, all of which have also been determined to be VIEs. The San Francisco Venture is a VIE as the other members of the venture, individually or as a group, are not able to exercise kick-out rights or substantive participating rights. The Company applied the variable interest model and determined that it is the primary beneficiary of the San Francisco Venture and, accordingly, the San Francisco Venture is consolidated in the Company’s results. In making that determination, the Company evaluated that the Operating Company has unilateral and unconditional power to make decisions in regards to the activities that significantly impact the economics of the VIE, which are the development of properties, marketing and sale of properties, acquisition of land and other real estate properties and obtaining land ownership or ground lease for the underlying properties to be developed. The Company is determined to have more-than-insignificant economic benefit from the San Francisco Venture because, excluding Class C units, the Operating Company can prevent or cause the San Francisco Venture from making distributions on its units, and the Operating Company would receive 99% of any such distributions made (assuming no distributions had been paid on the Class A Common Units of the Operating Company). In addition, the San Francisco Venture is only allowed to make a capital call on the Operating Company and not any other interest holders, which could be a significant financial risk to the Operating Company. As of June 30, 2024, the San Francisco Venture had total combined assets of $1.39 billion, primarily comprised of $1.39 billion of inventories and $0.9 million in related party assets, and total combined liabilities of $65.7 million, including $60.7 million in related party liabilities. As of December 31, 2023, the San Francisco Venture had total combined assets of $1.36 billion, primarily comprised of $1.36 billion of inventories and $0.9 million in related party assets, and total combined liabilities of $61.9 million, including $59.4 million in related party liabilities. Those assets are owned by, and those liabilities are obligations of, the San Francisco Venture, not the Company. The San Francisco Venture’s operating subsidiaries are not guarantors of the Company’s obligations, and the assets held by the San Francisco Venture may only be used as collateral for the San Francisco Venture’s obligations. The creditors of the San Francisco Venture do not have recourse to the assets of the Operating Company, as the VIE’s primary beneficiary, or of the Holding Company. The Company and the other members do not generally have an obligation to make capital contributions to the San Francisco Venture. In addition, there are no liquidity arrangements or agreements to fund capital or purchase assets that could require the Company to provide financial support to the San Francisco Venture. The Company does not guarantee any debt of the San Francisco Venture. However, the Operating Company has guaranteed the performance of payment by the San Francisco Venture in accordance with the redemption terms of the Class C units of the San Francisco Venture (see Note 5). FP LP and FPL are VIEs because the other partners or members have disproportionately fewer voting rights, and substantially all of the activities of the entities are conducted on behalf of the other partners or members and their related parties. The Operating Company, or a wholly owned subsidiary of the Operating Company, is the primary beneficiary of FP LP and FPL. As of June 30, 2024, FP LP and FPL had combined assets of $1.1 billion, primarily comprised of $904.8 million of inventories, $13.7 million of intangibles and $106.9 million in related party assets, and total combined liabilities of $63.0 million, including $61.8 million in accounts payable and other liabilities and $1.2 million in related party liabilities. As of December 31, 2023, FP LP and FPL had combined assets of $1.0 billion, primarily comprised of $855.6 million of inventories, $25.3 million of intangibles and $69.1 million in related party assets, and total combined liabilities of $60.0 million, including $57.3 million in accounts payable and other liabilities and $2.7 million in related party liabilities. The Company evaluates its primary beneficiary designation on an ongoing basis and assesses the appropriateness of the VIE’s status when events have occurred that would trigger such an analysis. During the six months ended June 30, 2024 and 2023, there were no VIEs that were deconsolidated.
|
| X |
- References
+ Details
| Name: |
us-gaap_OrganizationConsolidationAndPresentationOfFinancialStatementsAbstract |
| Namespace Prefix: |
us-gaap_ |
| Data Type: |
xbrli:stringItemType |
| Balance Type: |
na |
| Period Type: |
duration |
|
| X |
- DefinitionThe entire disclosure for a variable interest entity (VIE), including but not limited to, judgments and assumptions in determining whether to consolidate and in identifying the primary beneficiary, gain (loss) recognized on the initial consolidation of the VIE, terms of arrangements, amounts and classification of the VIE's assets and liabilities, and the entity's maximum exposure to loss. Reference 1: http://fasb.org/us-gaap/role/ref/legacyRef
-Topic 810
-Name Accounting Standards Codification
-Publisher FASB
-URI https://asc.fasb.org/810/tableOfContent
| Name: |
us-gaap_VariableInterestEntityDisclosureTextBlock |
| Namespace Prefix: |
us-gaap_ |
| Data Type: |
dtr-types:textBlockItemType |
| Balance Type: |
na |
| Period Type: |
duration |
|
v3.24.2
Intangible Asset, Net - Related Party
|
6 Months Ended |
Jun. 30, 2024 |
|---|
| Goodwill and Intangible Assets Disclosure [Abstract] |
|
| Intangible Asset, Net - Related Party |
INTANGIBLE ASSET, NET—RELATED PARTY The intangible asset relates to the contract value of the incentive compensation provisions of the A&R DMA with the Great Park Venture. The intangible asset will be amortized over the expected contract period based on the pattern in which the economic benefits are expected to be received. The carrying amount and accumulated amortization of the intangible asset as of June 30, 2024 and December 31, 2023 were as follows (in thousands): | | | | | | | | | | | | | June 30, 2024 | | December 31, 2023 | | Gross carrying amount | $ | 129,705 | | | $ | 129,705 | | | Accumulated amortization | (115,977) | | | (104,435) | | | Net book value | $ | 13,728 | | | $ | 25,270 | |
Intangible asset amortization expense, as a result of revenue recognition attributable to incentive compensation, was $9.5 million and $11.5 million for the three and six months ended June 30, 2024, respectively, and $8.0 million and $8.6 million for the three and six months ended June 30, 2023, respectively. Amortization expense is included in the cost of management services in the accompanying condensed consolidated statements of operations and is included in the Great Park segment.
|
| X |
- References
+ Details
| Name: |
us-gaap_GoodwillAndIntangibleAssetsDisclosureAbstract |
| Namespace Prefix: |
us-gaap_ |
| Data Type: |
xbrli:stringItemType |
| Balance Type: |
na |
| Period Type: |
duration |
|
| X |
- DefinitionThe entire disclosure for all or part of the information related to intangible assets. Reference 1: http://www.xbrl.org/2003/role/disclosureRef
-Topic 350
-SubTopic 30
-Name Accounting Standards Codification
-Publisher FASB
-URI https://asc.fasb.org/350-30/tableOfContent
Reference 2: http://www.xbrl.org/2003/role/disclosureRef
-Topic 350
-SubTopic 30
-Name Accounting Standards Codification
-Section 50
-Paragraph 4
-Publisher FASB
-URI https://asc.fasb.org/1943274/2147482665/350-30-50-4
Reference 3: http://www.xbrl.org/2003/role/disclosureRef
-Topic 350
-SubTopic 30
-Name Accounting Standards Codification
-Section 50
-Paragraph 3
-Subparagraph (a)
-Publisher FASB
-URI https://asc.fasb.org/1943274/2147482665/350-30-50-3
Reference 4: http://www.xbrl.org/2003/role/disclosureRef
-Topic 985
-SubTopic 20
-Name Accounting Standards Codification
-Section 50
-Paragraph 2
-Publisher FASB
-URI https://asc.fasb.org/1943274/2147481283/985-20-50-2
Reference 5: http://www.xbrl.org/2003/role/disclosureRef
-Topic 985
-SubTopic 20
-Name Accounting Standards Codification
-Publisher FASB
-URI https://asc.fasb.org/985-20/tableOfContent
| Name: |
us-gaap_IntangibleAssetsDisclosureTextBlock |
| Namespace Prefix: |
us-gaap_ |
| Data Type: |
dtr-types:textBlockItemType |
| Balance Type: |
na |
| Period Type: |
duration |
|
v3.24.2
Related Party Transactions
|
6 Months Ended |
Jun. 30, 2024 |
|---|
| Related Party Transactions [Abstract] |
|
| Related Party Transactions |
RELATED PARTY TRANSACTIONS Related party assets and liabilities included in the Company’s condensed consolidated balance sheets as of June 30, 2024 and December 31, 2023 consisted of the following (in thousands): | | | | | | | | | | | | | June 30, 2024 | | December 31, 2023 | Related Party Assets: | | | | Contract assets (see Note 3) | $ | 106,881 | | | $ | 69,068 | | | Operating lease right-of-use asset (corporate office lease at Five Point Gateway Campus) | 12,808 | | | 14,040 | | Other | 862 | | | 862 | | | $ | 120,551 | | | $ | 83,970 | | Related Party Liabilities: | | | | Reimbursement obligation | $ | 60,717 | | | $ | 59,378 | | | | | | Payable to holders of Management Company’s Class B interests | 333 | | | 1,828 | | | Operating lease liability (corporate office lease at Five Point Gateway Campus) | 10,129 | | | 10,974 | | | Accrued advisory fees | 1,825 | | | 4,725 | | Other | 1,169 | | | 1,169 | | | $ | 74,173 | | | $ | 78,074 | |
Development Management Agreement with the Great Park Venture (Incentive Compensation Contract Asset) In 2010, the Great Park Venture, the Company’s equity method investee, engaged the Management Company under a development management agreement to provide management services to the Great Park Venture. The compensation structure in place consists of a base fee and incentive compensation. Incentive compensation is 9% of distributions available to be made by the Great Park Venture to its Legacy and Percentage Interest Holders. In December 2022, the Company and the Great Park Venture entered into an amendment to the A&R DMA to extend the term to December 31, 2024 (the “First Renewal Term”). If the A&R DMA is not extended by mutual agreement of the parties beyond December 31, 2024 and the Company is no longer providing management services subsequent to December 31, 2024, the Company will be entitled to 6.75% of distributions paid thereafter. During the six months ended June 30, 2024, the Great Park Venture made a Legacy Incentive Compensation payment to the Company of $1.5 million and a Non-Legacy Incentive Compensation payment of $12.8 million. Upon receiving the Legacy Incentive Compensation payment, the Company distributed the $1.5 million in proceeds to the holders of the Management Company’s Class B interests. At June 30, 2024 and December 31, 2023, included in contract assets in the table above is $104.6 million and $66.1 million, respectively, attributed to incentive compensation revenue recognized but not yet due (see Note 3). Management fee revenues under the A&R DMA are included in management services—related party in the accompanying condensed consolidated statements of operations and are included in the Great Park segment. Management fee revenues under the A&R DMA were $50.2 million and $58.8 million for the three and six months ended June 30, 2024, respectively, and $20.7 million and $24.8 million for the three and six months ended June 30, 2023, respectively.
|
| X |
- DefinitionThe entire disclosure for related party transactions. Examples of related party transactions include transactions between (a) a parent company and its subsidiary; (b) subsidiaries of a common parent; (c) and entity and its principal owners; and (d) affiliates. Reference 1: http://www.xbrl.org/2003/role/disclosureRef
-Topic 946
-SubTopic 20
-Name Accounting Standards Codification
-Section 50
-Paragraph 2
-Publisher FASB
-URI https://asc.fasb.org/1943274/2147480990/946-20-50-2
Reference 2: http://www.xbrl.org/2003/role/disclosureRef
-Topic 946
-SubTopic 20
-Name Accounting Standards Codification
-Section 50
-Paragraph 5
-Publisher FASB
-URI https://asc.fasb.org/1943274/2147480990/946-20-50-5
Reference 3: http://www.xbrl.org/2003/role/disclosureRef
-Topic 946
-SubTopic 20
-Name Accounting Standards Codification
-Section 50
-Paragraph 6
-Publisher FASB
-URI https://asc.fasb.org/1943274/2147480990/946-20-50-6
Reference 4: http://www.xbrl.org/2003/role/disclosureRef
-Topic 946
-SubTopic 235
-Name Accounting Standards Codification
-Section 50
-Paragraph 2
-Subparagraph (c)
-Publisher FASB
-URI https://asc.fasb.org/1943274/2147477968/946-235-50-2
Reference 5: http://www.xbrl.org/2003/role/disclosureRef
-Topic 946
-SubTopic 235
-Name Accounting Standards Codification
-Section 50
-Paragraph 2
-Subparagraph (e)
-Publisher FASB
-URI https://asc.fasb.org/1943274/2147477968/946-235-50-2
Reference 6: http://www.xbrl.org/2003/role/disclosureRef
-Topic 850
-SubTopic 10
-Name Accounting Standards Codification
-Section 50
-Paragraph 1
-Subparagraph (d)
-Publisher FASB
-URI https://asc.fasb.org/1943274/2147483326/850-10-50-1
Reference 7: http://www.xbrl.org/2003/role/disclosureRef
-Topic 946
-SubTopic 220
-Name Accounting Standards Codification
-Section S99
-Paragraph 1
-Subparagraph (SX 210.6-07(2)(g)(3))
-Publisher FASB
-URI https://asc.fasb.org/1943274/2147479134/946-220-S99-1
Reference 8: http://www.xbrl.org/2003/role/disclosureRef
-Topic 946
-SubTopic 220
-Name Accounting Standards Codification
-Section S99
-Paragraph 1
-Subparagraph (SX 210.6-07(2)(c))
-Publisher FASB
-URI https://asc.fasb.org/1943274/2147479134/946-220-S99-1
Reference 9: http://www.xbrl.org/2003/role/disclosureRef
-Topic 946
-SubTopic 220
-Name Accounting Standards Codification
-Section S99
-Paragraph 1
-Subparagraph (SX 210.6-07(2)(e))
-Publisher FASB
-URI https://asc.fasb.org/1943274/2147479134/946-220-S99-1
Reference 10: http://www.xbrl.org/2003/role/disclosureRef
-Topic 850
-Name Accounting Standards Codification
-Publisher FASB
-URI https://asc.fasb.org/850/tableOfContent
Reference 11: http://www.xbrl.org/2003/role/disclosureRef
-Topic 850
-SubTopic 10
-Name Accounting Standards Codification
-Section 50
-Paragraph 6
-Publisher FASB
-URI https://asc.fasb.org/1943274/2147483326/850-10-50-6
Reference 12: http://www.xbrl.org/2003/role/disclosureRef
-Topic 850
-SubTopic 10
-Name Accounting Standards Codification
-Section 50
-Paragraph 1
-Subparagraph (a)
-Publisher FASB
-URI https://asc.fasb.org/1943274/2147483326/850-10-50-1
Reference 13: http://www.xbrl.org/2003/role/disclosureRef
-Topic 850
-SubTopic 10
-Name Accounting Standards Codification
-Section 50
-Paragraph 1
-Subparagraph (b)
-Publisher FASB
-URI https://asc.fasb.org/1943274/2147483326/850-10-50-1
| Name: |
us-gaap_RelatedPartyTransactionsDisclosureTextBlock |
| Namespace Prefix: |
us-gaap_ |
| Data Type: |
dtr-types:textBlockItemType |
| Balance Type: |
na |
| Period Type: |
duration |
|
v3.24.2
Notes Payable, Net
|
6 Months Ended |
Jun. 30, 2024 |
|---|
| Debt Disclosure [Abstract] |
|
| Notes Payable, Net |
NOTES PAYABLE, NET At June 30, 2024 and December 31, 2023, notes payable, net consisted of the following (in thousands): | | | | | | | | | | | | | June 30, 2024 | | December 31, 2023 | 10.500% initial rate New Senior Notes due 2028 | $ | 523,494 | | | $ | — | | 7.875% Senior Notes due 2025 | 1,500 | | | 625,000 | | | Unamortized premium | 1,206 | | | — | | | Unamortized debt issuance costs | (2,096) | | | (2,814) | | | $ | 524,104 | | | $ | 622,186 | |
Senior Notes The Operating Company and Five Point Capital Corp., a directly wholly owned subsidiary of the Operating Company (the “Co-Issuer” and, together with the Operating Company, the “Issuers”), previously offered, sold and issued $625.0 million aggregate principal amount of 7.875% unsecured senior notes due November 15, 2025 (the “Senior Notes”). The Senior Notes are guaranteed, jointly and severally, by certain direct and indirect subsidiaries of the Operating Company and are redeemable at the option of the Issuers, in whole or in part, at par, plus accrued and unpaid interest. On January 16, 2024, the Issuers settled an exchange offer to exchange any and all of the Senior Notes for new 10.500% initial rate senior notes due January 15, 2028 (the “New Senior Notes”). Pursuant to the exchange offer, the Issuers exchanged $623.5 million aggregate principal amount of Senior Notes, which represented 99.76% of the existing Senior Notes outstanding immediately prior to the exchange offer, for $523.5 million aggregate principal amount of New Senior Notes and $100.0 million of aggregate cash consideration, plus accrued interest. The New Senior Notes accrue interest at a rate of 10.500% per annum from and including January 16, 2024 to, but not including, November 15, 2025, 11.000% per annum from and including November 15, 2025 to, but not including, November 15, 2026, and 12.000% per annum from and including November 15, 2026 to, but not including, January 15, 2028. Interest on the New Senior Notes is payable semi-annually on each May 15 and November 15, commencing May 15, 2024. The exchange was accounted for as a debt modification under ASC 470-50 as the terms of the New Senior Notes were not substantially different from the terms of the Senior Notes. Under debt modification accounting, third party costs are expensed as incurred. During the six months ended June 30, 2024, the Company expensed $5.9 million in third party transaction and advisory costs incurred in connection with the exchange. Debt issuance costs and premium are amortized over the term of the New Senior Notes using the effective interest method. The New Senior Notes are guaranteed, jointly and severally, by certain direct and indirect subsidiaries of the Operating Company and are redeemable at the option of the Issuers, in whole or in part, at a declining call premium as set forth in the indenture governing the New Senior Notes, plus accrued and unpaid interest. Revolving Credit Facility The Operating Company has a $125.0 million unsecured revolving credit facility, with $100.0 million of the commitments under the revolving credit facility maturing in July 2027 and the remaining $25.0 million commitment maturing in April 2026. Any borrowings under the revolving credit agreement will bear interest at CME Term Secured Overnight Financing Rate 1 Month increased by 0.10% plus a margin of either 2.25% or 2.50% based on the Company’s leverage ratio. The revolving credit facility includes an accordion feature that allows the Operating Company to increase the maximum aggregate commitments up to $150.0 million, subject to certain conditions, including the receipt of commitments from the lenders. As of June 30, 2024, no borrowings or letters of credit were outstanding on the Operating Company’s revolving credit facility.
|
| X |
- References
+ Details
| Name: |
us-gaap_DebtDisclosureAbstract |
| Namespace Prefix: |
us-gaap_ |
| Data Type: |
xbrli:stringItemType |
| Balance Type: |
na |
| Period Type: |
duration |
|
| X |
- DefinitionThe entire disclosure for information about short-term and long-term debt arrangements, which includes amounts of borrowings under each line of credit, note payable, commercial paper issue, bonds indenture, debenture issue, own-share lending arrangements and any other contractual agreement to repay funds, and about the underlying arrangements, rationale for a classification as long-term, including repayment terms, interest rates, collateral provided, restrictions on use of assets and activities, whether or not in compliance with debt covenants, and other matters important to users of the financial statements, such as the effects of refinancing and noncompliance with debt covenants. Reference 1: http://www.xbrl.org/2003/role/disclosureRef
-Topic 470
-SubTopic 10
-Name Accounting Standards Codification
-Section 50
-Paragraph 6
-Subparagraph (b)
-Publisher FASB
-URI https://asc.fasb.org/1943274/2147481544/470-10-50-6
Reference 2: http://www.xbrl.org/2003/role/disclosureRef
-Topic 470
-SubTopic 10
-Name Accounting Standards Codification
-Section 50
-Paragraph 6
-Subparagraph (a)
-Publisher FASB
-URI https://asc.fasb.org/1943274/2147481544/470-10-50-6
Reference 3: http://www.xbrl.org/2003/role/disclosureRef
-Topic 405
-SubTopic 40
-Name Accounting Standards Codification
-Section 50
-Paragraph 1
-Subparagraph (d)
-Publisher FASB
-URI https://asc.fasb.org/1943274/2147477092/405-40-50-1
Reference 4: http://www.xbrl.org/2003/role/disclosureRef
-Topic 405
-SubTopic 40
-Name Accounting Standards Codification
-Section 50
-Paragraph 1
-Subparagraph (a)(3)
-Publisher FASB
-URI https://asc.fasb.org/1943274/2147477092/405-40-50-1
Reference 5: http://www.xbrl.org/2003/role/disclosureRef
-Topic 405
-SubTopic 40
-Name Accounting Standards Codification
-Section 50
-Paragraph 1
-Subparagraph (a)(2)
-Publisher FASB
-URI https://asc.fasb.org/1943274/2147477092/405-40-50-1
Reference 6: http://www.xbrl.org/2003/role/disclosureRef
-Topic 405
-SubTopic 40
-Name Accounting Standards Codification
-Section 50
-Paragraph 1
-Subparagraph (a)(1)
-Publisher FASB
-URI https://asc.fasb.org/1943274/2147477092/405-40-50-1
Reference 7: http://www.xbrl.org/2003/role/disclosureRef
-Topic 405
-SubTopic 40
-Name Accounting Standards Codification
-Section 50
-Paragraph 1
-Subparagraph (a)
-Publisher FASB
-URI https://asc.fasb.org/1943274/2147477092/405-40-50-1
Reference 8: http://www.xbrl.org/2003/role/disclosureRef
-Topic 470
-SubTopic 20
-Name Accounting Standards Codification
-Section 50
-Paragraph 1B
-Subparagraph (h)
-Publisher FASB
-URI https://asc.fasb.org/1943274/2147481139/470-20-50-1B
Reference 9: http://www.xbrl.org/2003/role/disclosureRef
-Topic 235
-SubTopic 10
-Name Accounting Standards Codification
-Section S99
-Paragraph 1
-Subparagraph (SX 210.4-08(c))
-Publisher FASB
-URI https://asc.fasb.org/1943274/2147480678/235-10-S99-1
Reference 10: http://fasb.org/us-gaap/role/ref/legacyRef
-Topic 470
-Name Accounting Standards Codification
-Publisher FASB
-URI https://asc.fasb.org/470/tableOfContent
Reference 11: http://www.xbrl.org/2003/role/disclosureRef
-Topic 835
-SubTopic 30
-Name Accounting Standards Codification
-Section 45
-Paragraph 2
-Publisher FASB
-URI https://asc.fasb.org/1943274/2147482925/835-30-45-2
Reference 12: http://www.xbrl.org/2003/role/disclosureRef
-Topic 470
-SubTopic 20
-Name Accounting Standards Codification
-Section 50
-Paragraph 1B
-Publisher FASB
-URI https://asc.fasb.org/1943274/2147481139/470-20-50-1B
Reference 13: http://www.xbrl.org/2003/role/disclosureRef
-Topic 470
-SubTopic 20
-Name Accounting Standards Codification
-Section 50
-Paragraph 1B
-Subparagraph (g)
-Publisher FASB
-URI https://asc.fasb.org/1943274/2147481139/470-20-50-1B
Reference 14: http://www.xbrl.org/2003/role/disclosureRef
-Topic 470
-SubTopic 20
-Name Accounting Standards Codification
-Section 50
-Paragraph 1B
-Subparagraph (i)
-Publisher FASB
-URI https://asc.fasb.org/1943274/2147481139/470-20-50-1B
Reference 15: http://www.xbrl.org/2003/role/disclosureRef
-Topic 470
-SubTopic 20
-Name Accounting Standards Codification
-Section 50
-Paragraph 1C
-Subparagraph (a)
-Publisher FASB
-URI https://asc.fasb.org/1943274/2147481139/470-20-50-1C
Reference 16: http://www.xbrl.org/2003/role/disclosureRef
-Topic 470
-SubTopic 20
-Name Accounting Standards Codification
-Section 50
-Paragraph 1C
-Subparagraph (b)
-Publisher FASB
-URI https://asc.fasb.org/1943274/2147481139/470-20-50-1C
Reference 17: http://www.xbrl.org/2003/role/disclosureRef
-Topic 470
-SubTopic 20
-Name Accounting Standards Codification
-Section 50
-Paragraph 1C
-Subparagraph (c)
-Publisher FASB
-URI https://asc.fasb.org/1943274/2147481139/470-20-50-1C
Reference 18: http://www.xbrl.org/2003/role/disclosureRef
-Topic 470
-SubTopic 20
-Name Accounting Standards Codification
-Section 50
-Paragraph 1E
-Subparagraph (b)
-Publisher FASB
-URI https://asc.fasb.org/1943274/2147481139/470-20-50-1E
Reference 19: http://www.xbrl.org/2003/role/disclosureRef
-Topic 470
-SubTopic 20
-Name Accounting Standards Codification
-Section 50
-Paragraph 1I
-Subparagraph (a)
-Publisher FASB
-URI https://asc.fasb.org/1943274/2147481139/470-20-50-1I
Reference 20: http://www.xbrl.org/2003/role/disclosureRef
-Topic 470
-SubTopic 20
-Name Accounting Standards Codification
-Section 50
-Paragraph 1I
-Subparagraph (b)
-Publisher FASB
-URI https://asc.fasb.org/1943274/2147481139/470-20-50-1I
Reference 21: http://www.xbrl.org/2003/role/disclosureRef
-Topic 470
-SubTopic 20
-Name Accounting Standards Codification
-Section 50
-Paragraph 1I
-Subparagraph (d)
-Publisher FASB
-URI https://asc.fasb.org/1943274/2147481139/470-20-50-1I
| Name: |
us-gaap_DebtDisclosureTextBlock |
| Namespace Prefix: |
us-gaap_ |
| Data Type: |
dtr-types:textBlockItemType |
| Balance Type: |
na |
| Period Type: |
duration |
|
v3.24.2
Tax Receivable Agreement
|
6 Months Ended |
Jun. 30, 2024 |
|---|
| Other Liabilities Disclosure [Abstract] |
|
| Tax Receivable Agreement |
TAX RECEIVABLE AGREEMENT The Company is a party to a TRA with all of the holders of Class A Common Units of the Operating Company, all the holders of Class A units of the San Francisco Venture, and prior holders of Class A Common Units of the Operating Company and prior holders of Class A units of the San Francisco Venture that have exchanged their holdings for Class A common shares (as parties to the TRA, the “TRA Parties”). At June 30, 2024 and December 31, 2023, the Company’s condensed consolidated balance sheets included liabilities of $173.4 million and $173.2 million, respectively, for payments expected to be made under certain components of the TRA which the Company deems to be probable and estimable. No TRA payments were made during the six months ended June 30, 2024 or 2023.
|
| X |
- DefinitionTax Receivable Agreement [Text Block]
| Name: |
fph_TaxReceivableAgreementTextBlock |
| Namespace Prefix: |
fph_ |
| Data Type: |
dtr-types1:textBlockItemType |
| Balance Type: |
na |
| Period Type: |
duration |
|
| X |
- References
+ Details
| Name: |
us-gaap_OtherLiabilitiesDisclosureAbstract |
| Namespace Prefix: |
us-gaap_ |
| Data Type: |
xbrli:stringItemType |
| Balance Type: |
na |
| Period Type: |
duration |
|
v3.24.2
Commitments and Contingencies
|
6 Months Ended |
Jun. 30, 2024 |
|---|
| Commitments and Contingencies Disclosure [Abstract] |
|
| Commitments and Contingencies |
COMMITMENTS AND CONTINGENCIES The Company is subject to the usual obligations associated with entering into contracts for the purchase, development and sale of real estate, which the Company does in the routine conduct of its business. The operations of the Company are conducted through the Operating Company and its subsidiaries, and in some cases, the Holding Company will guarantee the payment by or performance of the Operating Company or its subsidiaries. The Company has operating leases for its corporate office and other facilities and the Holding Company is a guarantor to some of these lease agreements. Operating lease right-of-use assets are included in other assets or related party assets, and operating lease liabilities are included in accounts payable and other liabilities or related party liabilities on the condensed consolidated balance sheets and were as follows as of June 30, 2024 and December 31, 2023 (in thousands): | | | | | | | | | | | | | June 30, 2024 | | December 31, 2023 | Operating lease right-of-use assets ($12,808 and $14,040 related party, respectively) | $ | 14,618 | | | $ | 16,002 | | Operating lease liabilities ($10,129 and $10,974 related party, respectively) | $ | 11,982 | | | $ | 12,755 | |
In addition to operating lease payment guarantees, the Holding Company had other contractual payment guarantees as of June 30, 2024 totaling $8.3 million. Performance and Completion Bonding Agreements In the ordinary course of business and as a part of the entitlement and development process, the Company is required to provide performance bonds to ensure completion of certain of the Company’s development obligations. The Company had outstanding performance bonds of $299.0 million and $306.9 million as of June 30, 2024 and December 31, 2023, respectively. Candlestick and The San Francisco Shipyard Disposition and Development Agreement The San Francisco Venture is a party to a disposition and development agreement with the Successor to the Redevelopment Agency of the City and County of San Francisco (the “San Francisco Agency”) in which the San Francisco Agency has agreed to convey portions of Candlestick and The San Francisco Shipyard to the San Francisco Venture for development. The San Francisco Venture has agreed to reimburse the San Francisco Agency for reasonable costs and expenses actually incurred and paid by the San Francisco Agency in performing its obligations under the disposition and development agreement. The San Francisco Agency can also earn a return of certain profits generated from the development and sale of Candlestick and The San Francisco Shipyard if certain thresholds are met. At each of June 30, 2024 and December 31, 2023, the San Francisco Venture had outstanding guarantees benefiting the San Francisco Agency for infrastructure and construction of certain park and open space obligations with aggregate maximum obligations of $198.3 million. Letters of Credit At each of June 30, 2024 and December 31, 2023, the Company had outstanding letters of credit totaling $1.0 million. These letters of credit were issued to secure various development and financial obligations. At each of June 30, 2024 and December 31, 2023, the Company had restricted cash and certificates of deposit of $1.0 million pledged as collateral under certain of the letters of credit agreements. Legal Proceedings Hunters Point Litigation In May 2018, residents of the Bayview Hunters Point neighborhood in San Francisco filed a putative class action in San Francisco Superior Court naming Tetra Tech, Inc. and Tetra Tech EC, Inc., an independent contractor hired by the U.S. Navy to conduct testing and remediation of toxic radiological waste at The San Francisco Shipyard (“Tetra Tech”), Lennar and the Company as defendants (the “Bayview Action”). The plaintiffs allege that, among other things, Tetra Tech fraudulently misrepresented its test results and remediation efforts. The plaintiffs are seeking damages against Tetra Tech and the Company and have requested an injunction to prevent the Company and Lennar from undertaking any development activities at The San Francisco Shipyard. The Company believes that it has meritorious defenses to the allegations in the Bayview Action and may have insurance and indemnification rights against third parties with respect to the claims. Other Other than the actions outlined above, the Company is also a party to various other claims, legal actions, and complaints arising in the ordinary course of business, the disposition of which, in the Company’s opinion, will not have a material adverse effect on the Company’s condensed consolidated financial statements. As a significant land owner and developer of unimproved land it is possible that environmental contamination conditions could exist that would require the Company to take corrective action. In the opinion of the Company, such corrective actions, if any, would not have a material adverse effect on the Company’s condensed consolidated financial statements.
|
| X |
- References
+ Details
| Name: |
us-gaap_CommitmentsAndContingenciesDisclosureAbstract |
| Namespace Prefix: |
us-gaap_ |
| Data Type: |
xbrli:stringItemType |
| Balance Type: |
na |
| Period Type: |
duration |
|
| X |
- DefinitionThe entire disclosure for commitments and contingencies. Reference 1: http://www.xbrl.org/2009/role/commonPracticeRef
-Topic 405
-SubTopic 30
-Name Accounting Standards Codification
-Publisher FASB
-URI https://asc.fasb.org/405-30/tableOfContent
Reference 2: http://www.xbrl.org/2003/role/disclosureRef
-Topic 440
-SubTopic 10
-Name Accounting Standards Codification
-Section 50
-Paragraph 4
-Subparagraph (a)
-Publisher FASB
-URI https://asc.fasb.org/1943274/2147482648/440-10-50-4
Reference 3: http://www.xbrl.org/2009/role/commonPracticeRef
-Topic 450
-Name Accounting Standards Codification
-Publisher FASB
-URI https://asc.fasb.org/450/tableOfContent
Reference 4: http://www.xbrl.org/2003/role/disclosureRef
-Topic 954
-SubTopic 440
-Name Accounting Standards Codification
-Section 50
-Paragraph 1
-Subparagraph (a)
-Publisher FASB
-URI https://asc.fasb.org/1943274/2147478522/954-440-50-1
Reference 5: http://www.xbrl.org/2003/role/disclosureRef
-Topic 440
-SubTopic 10
-Name Accounting Standards Codification
-Section 50
-Paragraph 4
-Subparagraph (c)
-Publisher FASB
-URI https://asc.fasb.org/1943274/2147482648/440-10-50-4
Reference 6: http://fasb.org/us-gaap/role/ref/legacyRef
-Topic 440
-Name Accounting Standards Codification
-Publisher FASB
-URI https://asc.fasb.org/440/tableOfContent
| Name: |
us-gaap_CommitmentsAndContingenciesDisclosureTextBlock |
| Namespace Prefix: |
us-gaap_ |
| Data Type: |
dtr-types:textBlockItemType |
| Balance Type: |
na |
| Period Type: |
duration |
|
v3.24.2
Supplemental Cash Flow Information
|
6 Months Ended |
Jun. 30, 2024 |
|---|
| Supplemental Cash Flow Elements [Abstract] |
|
| Supplemental Cash Flow Information |
SUPPLEMENTAL CASH FLOW INFORMATIONSupplemental cash flow information for the six months ended June 30, 2024 and 2023 was as follows (in thousands): | | | | | | | | | | | | | Six Months Ended June 30, | | 2024 | | 2023 | | SUPPLEMENTAL CASH FLOW INFORMATION: | | | | | Cash paid for interest, all of which was capitalized to inventories | $ | 26,549 | | | $ | 25,998 | | | Noncash lease expense | $ | 1,383 | | | $ | 2,094 | | | | | | | NONCASH INVESTING AND FINANCING ACTIVITIES: | | | | | | | | | Adjustment to operating lease right-of-use assets from lease modification | $ | — | | | $ | (773) | | | Adjustment to liability recognized under TRA | $ | 143 | | | $ | 140 | | | Senior Notes due 2025 exchanged for New Senior Notes due 2028 (see Note 9) | $ | 523,500 | | | $ | — | | | | | | | | | | | | | | | | | |
Noncash lease expense is included within the depreciation and amortization adjustment to net income on the Company’s condensed consolidated statements of cash flows. The following table provides a reconciliation of cash, cash equivalents, and restricted cash reported within the condensed consolidated balance sheets that sum to the total of the same such amounts shown in the condensed consolidated statements of cash flows for the six months ended June 30, 2024 and 2023 (in thousands): | | | | | | | | | | | | | June 30, 2024 | | June 30, 2023 | | Cash and cash equivalents | $ | 217,387 | | | $ | 193,203 | | | Restricted cash and certificates of deposit | 992 | | | 992 | | | Total cash, cash equivalents, and restricted cash shown in the condensed consolidated statements of cash flows | $ | 218,379 | | | $ | 194,195 | |
Amounts included in restricted cash and certificates of deposit represent amounts held as collateral on open letters of credit related to development obligations or because of other contractual obligations of the Company that require the restriction.
|
| X |
- DefinitionThe entire disclosure for supplemental cash flow activities, including cash, noncash, and part noncash transactions, for the period. Noncash is defined as information about all investing and financing activities of an enterprise during a period that affect recognized assets or liabilities but that do not result in cash receipts or cash payments in the period. "Part noncash" refers to that portion of the transaction not resulting in cash receipts or cash payments in the period. Reference 1: http://fasb.org/us-gaap/role/ref/legacyRef
-Topic 230
-Name Accounting Standards Codification
-Publisher FASB
-URI https://asc.fasb.org/230/tableOfContent
| Name: |
us-gaap_CashFlowSupplementalDisclosuresTextBlock |
| Namespace Prefix: |
us-gaap_ |
| Data Type: |
dtr-types:textBlockItemType |
| Balance Type: |
na |
| Period Type: |
duration |
|
| X |
- References
+ Details
| Name: |
us-gaap_SupplementalCashFlowElementsAbstract |
| Namespace Prefix: |
us-gaap_ |
| Data Type: |
xbrli:stringItemType |
| Balance Type: |
na |
| Period Type: |
duration |
|
v3.24.2
Segment Reporting
|
6 Months Ended |
Jun. 30, 2024 |
|---|
| Segment Reporting [Abstract] |
|
| Segment Reporting |
SEGMENT REPORTING The Company’s reportable segments consist of: • Valencia—includes the community of Valencia being developed in northern Los Angeles County, California. The Valencia segment derives revenues from the sale of residential and commercial land sites to homebuilders, commercial developers and commercial buyers. The Company’s investment in the Valencia Landbank Venture is also reported in the Valencia segment. • San Francisco—includes the Candlestick and The San Francisco Shipyard communities located on bayfront property in the City of San Francisco, California. The San Francisco segment derives revenues from the sale of residential and commercial land sites to homebuilders, commercial developers and commercial buyers. • Great Park—includes the Great Park Neighborhoods being developed adjacent to and around the Orange County Great Park, a metropolitan park under construction in Orange County, California. This segment also includes management services provided by the Management Company to the Great Park Venture, the owner of the Great Park Neighborhoods. As of June 30, 2024, the Company had a 37.5% Percentage Interest in the Great Park Venture and accounted for the investment under the equity method. The reported segment information for the Great Park segment includes the results of 100% of the Great Park Venture at the historical basis of the venture, which did not apply push down accounting at acquisition date. The Great Park segment derives revenues at the Great Park Neighborhoods from sales of residential and commercial land sites to homebuilders, commercial developers and commercial buyers and management services provided by the Company to the Great Park Venture. • Commercial—includes the operations of the Gateway Commercial Venture, which owns an approximately 189,000 square foot office building at the Five Point Gateway Campus. The Five Point Gateway Campus is an office, medical and research and development campus located within the Great Park Neighborhoods and consists of four buildings and surrounding land. The Company and a subsidiary of Lennar lease portions of the building owned by the Gateway Commercial Venture. The Gateway Commercial Venture also owns approximately 50 acres of the surrounding commercial land with additional development rights at the campus. This segment also includes property management services provided by the Management Company to the Gateway Commercial Venture. As of June 30, 2024, the Company had a 75% interest in the Gateway Commercial Venture and accounted for the investment under the equity method. The reported segment information for the Commercial segment includes the results of 100% of the Gateway Commercial Venture at the historical basis of the venture. Segment operating results and reconciliations to the Company’s consolidated balances are as follows (in thousands): | | | | | | | | | | | | | | | | | | | | | | | | | | | | | | | | | | | | | | | | | | | | | | | | | Revenues | | Profit (Loss) | | Revenues | | Profit (Loss) | | Three Months Ended June 30, | | Six Months Ended June 30, | | 2024 | | 2023 | | 2024 | | 2023 | | 2024 | | 2023 | | 2024 | | 2023 | Valencia | $ | 745 | | | $ | 413 | | | $ | (3,382) | | | $ | (4,538) | | | $ | 1,786 | | | $ | 1,716 | | | $ | (6,485) | | | $ | (6,977) | | San Francisco | 168 | | | 162 | | | (1,109) | | | (885) | | | 336 | | | 324 | | | (2,061) | | | (1,915) | | Great Park | 189,523 | | | 381,266 | | | 83,768 | | | 179,145 | | | 290,845 | | | 393,995 | | | 141,614 | | | 183,651 | | Commercial | 2,352 | | | 2,125 | | | (162) | | | (502) | | | 5,014 | | | 4,386 | | | (165) | | | (678) | | | Total reportable segments | 192,788 | | | 383,966 | | | 79,115 | | | 173,220 | | | 297,981 | | | 400,421 | | | 132,903 | | | 174,081 | | Reconciling items: | | | | | | | | | | | | | | | | | Removal of results of unconsolidated entities— | | | | | | | | | | | | | | | | | Great Park Venture (1) | (139,372) | | | (360,596) | | | (44,932) | | | (168,157) | | | (232,081) | | | (369,196) | | | (98,061) | | | (170,900) | | | Gateway Commercial Venture (1) | (2,224) | | | (2,021) | | | 290 | | | 606 | | | (4,773) | | | (4,175) | | | 406 | | | 889 | | | Add equity in earnings (losses) from unconsolidated entities— | | | | | | | | | | | | | | | | | Great Park Venture | — | | | — | | | 15,473 | | | 52,322 | | | — | | | — | | | 33,130 | | | 53,484 | | | Gateway Commercial Venture | — | | | — | | | (218) | | | (455) | | | — | | | — | | | (305) | | | (667) | | Corporate and unallocated (2) | — | | | — | | | (11,501) | | | (6,981) | | | — | | | — | | | (23,763) | | | (16,066) | | Total consolidated balances | $ | 51,192 | | | $ | 21,349 | | | $ | 38,227 | | | $ | 50,555 | | | $ | 61,127 | | | $ | 27,050 | | | $ | 44,310 | | | $ | 40,821 | |
(1) Represents the removal of the Great Park Venture and Gateway Commercial Venture operating results, which are included in the Great Park segment and Commercial segment operating results at 100% of each venture’s historical basis, respectively, but are not included in the Company’s consolidated results and balances as the Company accounts for its investment in each venture using the equity method of accounting. (2) Corporate and unallocated activity is primarily comprised of corporate general and administrative expenses, deferred tax provision and Senior Notes exchange costs. Segment assets and reconciliations to the Company’s consolidated balances are as follows (in thousands): | | | | | | | | | | | | | June 30, 2024 | | December 31, 2023 | Valencia | $ | 942,548 | | | $ | 895,983 | | San Francisco | 1,389,951 | | | 1,360,036 | | Great Park | 763,854 | | | 710,665 | | Commercial | 85,000 | | | 85,847 | | | Total reportable segments | 3,181,353 | | | 3,052,531 | | Reconciling items: | | | | Removal of unconsolidated balances of Great Park Venture (1) | (645,415) | | | (619,199) | | Removal of unconsolidated balances of Gateway Commercial Venture (1) | (85,000) | | | (85,847) | | Other eliminations (2) | (547) | | | (174) | | Add investment balance in Great Park Venture | 199,610 | | | 213,786 | | Add investment balance in Gateway Commercial Venture | 37,476 | | | 37,781 | | Corporate and unallocated (3) | 232,662 | | | 370,410 | | Total consolidated balances | $ | 2,920,139 | | | $ | 2,969,288 | |
(1) Represents the removal of the Great Park Venture and Gateway Commercial Venture balances, which are included in the Great Park segment and Commercial segment balances at 100% of each venture’s historical basis, respectively, but are not included in the Company’s consolidated balances as the Company accounts for its investment in each venture using the equity method of accounting. (2) Represents intersegment balances that eliminate in consolidation. (3) Corporate and unallocated assets consist of cash and cash equivalents, receivables, right-of-use assets and prepaid expenses.
|
| X |
- References
+ Details
| Name: |
us-gaap_SegmentReportingAbstract |
| Namespace Prefix: |
us-gaap_ |
| Data Type: |
xbrli:stringItemType |
| Balance Type: |
na |
| Period Type: |
duration |
|
| X |
- DefinitionThe entire disclosure for reporting segments including data and tables. Reportable segments include those that meet any of the following quantitative thresholds a) it's reported revenue, including sales to external customers and intersegment sales or transfers is 10 percent or more of the combined revenue, internal and external, of all operating segments b) the absolute amount of its reported profit or loss is 10 percent or more of the greater, in absolute amount of 1) the combined reported profit of all operating segments that did not report a loss or 2) the combined reported loss of all operating segments that did report a loss c) its assets are 10 percent or more of the combined assets of all operating segments. Reference 1: http://www.xbrl.org/2003/role/exampleRef
-Topic 280
-SubTopic 10
-Name Accounting Standards Codification
-Section 55
-Paragraph 48
-Publisher FASB
-URI https://asc.fasb.org/1943274/2147482785/280-10-55-48
Reference 2: http://www.xbrl.org/2003/role/disclosureRef
-Topic 280
-SubTopic 10
-Name Accounting Standards Codification
-Section 50
-Paragraph 32
-Subparagraph (f)
-Publisher FASB
-URI https://asc.fasb.org/1943274/2147482810/280-10-50-32
Reference 3: http://www.xbrl.org/2003/role/disclosureRef
-Topic 270
-SubTopic 10
-Name Accounting Standards Codification
-Section 50
-Paragraph 1
-Subparagraph (i)
-Publisher FASB
-URI https://asc.fasb.org/1943274/2147482964/270-10-50-1
Reference 4: http://www.xbrl.org/2003/role/disclosureRef
-Topic 280
-SubTopic 10
-Name Accounting Standards Codification
-Section 50
-Paragraph 32
-Subparagraph (ee)
-Publisher FASB
-URI https://asc.fasb.org/1943274/2147482810/280-10-50-32
Reference 5: http://fasb.org/us-gaap/role/ref/otherTransitionRef
-Topic 280
-SubTopic 10
-Name Accounting Standards Codification
-Section 50
-Paragraph 32
-Subparagraph (d)
-Publisher FASB
-URI https://asc.fasb.org/1943274/2147482810/280-10-50-32
Reference 6: http://www.xbrl.org/2003/role/exampleRef
-Topic 280
-SubTopic 10
-Name Accounting Standards Codification
-Section 55
-Paragraph 54
-Subparagraph (d)
-Publisher FASB
-URI https://asc.fasb.org/1943274/2147482785/280-10-55-54
Reference 7: http://www.xbrl.org/2003/role/exampleRef
-Topic 280
-SubTopic 10
-Name Accounting Standards Codification
-Section 55
-Paragraph 47
-Subparagraph (c)
-Publisher FASB
-URI https://asc.fasb.org/1943274/2147482785/280-10-55-47
Reference 8: http://www.xbrl.org/2003/role/exampleRef
-Topic 280
-SubTopic 10
-Name Accounting Standards Codification
-Section 55
-Paragraph 54
-Subparagraph (a)
-Publisher FASB
-URI https://asc.fasb.org/1943274/2147482785/280-10-55-54
Reference 9: http://www.xbrl.org/2003/role/exampleRef
-Topic 280
-SubTopic 10
-Name Accounting Standards Codification
-Section 55
-Paragraph 47
-Subparagraph (a)
-Publisher FASB
-URI https://asc.fasb.org/1943274/2147482785/280-10-55-47
Reference 10: http://www.xbrl.org/2003/role/exampleRef
-Topic 280
-SubTopic 10
-Name Accounting Standards Codification
-Section 55
-Paragraph 54
-Subparagraph (e)
-Publisher FASB
-URI https://asc.fasb.org/1943274/2147482785/280-10-55-54
Reference 11: http://www.xbrl.org/2003/role/exampleRef
-Topic 280
-SubTopic 10
-Name Accounting Standards Codification
-Section 55
-Paragraph 47
-Subparagraph (d)
-Publisher FASB
-URI https://asc.fasb.org/1943274/2147482785/280-10-55-47
Reference 12: http://www.xbrl.org/2003/role/disclosureRef
-Topic 280
-SubTopic 10
-Name Accounting Standards Codification
-Section 50
-Paragraph 22
-Publisher FASB
-URI https://asc.fasb.org/1943274/2147482810/280-10-50-22
Reference 13: http://www.xbrl.org/2003/role/disclosureRef
-Topic 280
-SubTopic 10
-Name Accounting Standards Codification
-Section 50
-Paragraph 31
-Publisher FASB
-URI https://asc.fasb.org/1943274/2147482810/280-10-50-31
Reference 14: http://www.xbrl.org/2003/role/disclosureRef
-Topic 280
-SubTopic 10
-Name Accounting Standards Codification
-Section 50
-Paragraph 34
-Publisher FASB
-URI https://asc.fasb.org/1943274/2147482810/280-10-50-34
Reference 15: http://www.xbrl.org/2003/role/disclosureRef
-Topic 280
-SubTopic 10
-Name Accounting Standards Codification
-Section 50
-Paragraph 26C
-Publisher FASB
-URI https://asc.fasb.org/1943274/2147482810/280-10-50-26C
Reference 16: http://www.xbrl.org/2003/role/disclosureRef
-Topic 280
-SubTopic 10
-Name Accounting Standards Codification
-Section 50
-Paragraph 26B
-Publisher FASB
-URI https://asc.fasb.org/1943274/2147482810/280-10-50-26B
Reference 17: http://www.xbrl.org/2003/role/disclosureRef
-Topic 280
-SubTopic 10
-Name Accounting Standards Codification
-Section 50
-Paragraph 15
-Publisher FASB
-URI https://asc.fasb.org/1943274/2147482810/280-10-50-15
Reference 18: http://www.xbrl.org/2003/role/disclosureRef
-Topic 280
-SubTopic 10
-Name Accounting Standards Codification
-Section 50
-Paragraph 42
-Publisher FASB
-URI https://asc.fasb.org/1943274/2147482810/280-10-50-42
Reference 19: http://www.xbrl.org/2003/role/disclosureRef
-Topic 280
-SubTopic 10
-Name Accounting Standards Codification
-Section 50
-Paragraph 40
-Publisher FASB
-URI https://asc.fasb.org/1943274/2147482810/280-10-50-40
Reference 20: http://www.xbrl.org/2003/role/disclosureRef
-Topic 280
-Name Accounting Standards Codification
-Publisher FASB
-URI https://asc.fasb.org/280/tableOfContent
Reference 21: http://www.xbrl.org/2003/role/disclosureRef
-Topic 280
-SubTopic 10
-Name Accounting Standards Codification
-Section 50
-Paragraph 26
-Publisher FASB
-URI https://asc.fasb.org/1943274/2147482810/280-10-50-26
Reference 22: http://www.xbrl.org/2003/role/disclosureRef
-Topic 280
-SubTopic 10
-Name Accounting Standards Codification
-Section 50
-Paragraph 41
-Publisher FASB
-URI https://asc.fasb.org/1943274/2147482810/280-10-50-41
Reference 23: http://www.xbrl.org/2003/role/disclosureRef
-Topic 280
-SubTopic 10
-Name Accounting Standards Codification
-Section 50
-Paragraph 21
-Subparagraph (a)
-Publisher FASB
-URI https://asc.fasb.org/1943274/2147482810/280-10-50-21
Reference 24: http://www.xbrl.org/2003/role/disclosureRef
-Topic 280
-SubTopic 10
-Name Accounting Standards Codification
-Section 50
-Paragraph 21
-Subparagraph (b)
-Publisher FASB
-URI https://asc.fasb.org/1943274/2147482810/280-10-50-21
Reference 25: http://www.xbrl.org/2003/role/disclosureRef
-Topic 280
-SubTopic 10
-Name Accounting Standards Codification
-Section 50
-Paragraph 32
-Subparagraph (e)
-Publisher FASB
-URI https://asc.fasb.org/1943274/2147482810/280-10-50-32
| Name: |
us-gaap_SegmentReportingDisclosureTextBlock |
| Namespace Prefix: |
us-gaap_ |
| Data Type: |
dtr-types:textBlockItemType |
| Balance Type: |
na |
| Period Type: |
duration |
|
v3.24.2
Share-Based Compensation
|
6 Months Ended |
Jun. 30, 2024 |
|---|
| Share-Based Payment Arrangement [Abstract] |
|
| Share-Based Compensation |
SHARE-BASED COMPENSATION The following table summarizes share-based equity compensation activity for the six months ended June 30, 2024: | | | | | | | | | | | | | Share-Based Awards
(in thousands) | | Weighted-Average Grant
Date Fair Value | Nonvested at January 1, 2024 | 4,409 | | | $ | 2.13 | | Granted | 2,873 | | | $ | 2.58 | | | | | | Forfeited | — | | | $ | — | | Vested | (800) | | | $ | 4.73 | | Nonvested at June 30, 2024 | 6,482 | | | $ | 2.01 | |
Share-based compensation expense was $1.0 million and $1.8 million for the three and six months ended June 30, 2024, respectively, and $0.9 million and $1.7 million for the three and six months ended June 30, 2023, respectively. Share-based compensation expense is included in selling, general, and administrative expenses on the accompanying condensed consolidated statements of operations. The estimated fair value at vesting of share-based awards that vested during the six months ended June 30, 2024 was $2.4 million. During the six months ended June 30, 2024 and 2023, the Company reacquired vested restricted Class A common shares for $0.8 million and $0.2 million, respectively, for the purpose of settling tax withholding obligations of employees. The reacquisition cost is based on the fair value of the Company’s Class A common shares on the date the tax obligation is incurred.
|
| X |
- DefinitionThe entire disclosure for share-based payment arrangement. Reference 1: http://www.xbrl.org/2003/role/exampleRef
-Topic 718
-SubTopic 10
-Name Accounting Standards Codification
-Section 50
-Paragraph 2
-Subparagraph (a)(1)
-Publisher FASB
-URI https://asc.fasb.org/1943274/2147480429/718-10-50-2
Reference 2: http://www.xbrl.org/2003/role/disclosureRef
-Topic 718
-Name Accounting Standards Codification
-Publisher FASB
-URI https://asc.fasb.org/718/tableOfContent
Reference 3: http://www.xbrl.org/2003/role/disclosureRef
-Topic 718
-SubTopic 10
-Name Accounting Standards Codification
-Section 50
-Paragraph 2
-Subparagraph (a)
-Publisher FASB
-URI https://asc.fasb.org/1943274/2147480429/718-10-50-2
Reference 4: http://www.xbrl.org/2003/role/disclosureRef
-Topic 718
-SubTopic 10
-Name Accounting Standards Codification
-Section 50
-Paragraph 2
-Subparagraph (h)(2)
-Publisher FASB
-URI https://asc.fasb.org/1943274/2147480429/718-10-50-2
Reference 5: http://www.xbrl.org/2003/role/disclosureRef
-Topic 718
-SubTopic 10
-Name Accounting Standards Codification
-Section 50
-Paragraph 2
-Subparagraph (h)(2)(i)
-Publisher FASB
-URI https://asc.fasb.org/1943274/2147480429/718-10-50-2
Reference 6: http://www.xbrl.org/2003/role/disclosureRef
-Topic 718
-SubTopic 10
-Name Accounting Standards Codification
-Section 50
-Paragraph 2
-Subparagraph (l)
-Publisher FASB
-URI https://asc.fasb.org/1943274/2147480429/718-10-50-2
| Name: |
us-gaap_DisclosureOfCompensationRelatedCostsShareBasedPaymentsTextBlock |
| Namespace Prefix: |
us-gaap_ |
| Data Type: |
dtr-types:textBlockItemType |
| Balance Type: |
na |
| Period Type: |
duration |
|
v3.24.2
Employee Benefit Plans
|
6 Months Ended |
Jun. 30, 2024 |
|---|
| Retirement Benefits [Abstract] |
|
| Employee Benefit Plans |
EMPLOYEE BENEFIT PLANS Retirement Plan—The Newhall Land and Farming Company Retirement Plan (the “Retirement Plan”) is a defined benefit plan that is funded by the Company and qualified under the Employee Retirement Income Security Act. The Retirement Plan was frozen in 2004. The components of net periodic (benefit) cost for the three and six months ended June 30, 2024 and 2023, are as follows (in thousands): | | | | | | | | | | | | | | | | | | | | | | | | | Three Months Ended June 30, | | Six Months Ended June 30, | | 2024 | | 2023 | | 2024 | | 2023 | | Net periodic (benefit) cost: | | | | | | | | Interest cost | $ | 193 | | | $ | 202 | | | $ | 384 | | | $ | 404 | | Expected return on plan assets | (229) | | | (222) | | | (458) | | | (444) | | Amortization of net actuarial loss | 13 | | | 40 | | | 27 | | | 81 | | | Net periodic (benefit) cost | $ | (23) | | | $ | 20 | | | $ | (47) | | | $ | 41 | |
Net periodic (benefit) cost does not include a service cost component as a result of the Retirement Plan being frozen. All other components of net periodic benefit are included in other income on the condensed consolidated statements of operations.
|
| X |
- References
+ Details
| Name: |
us-gaap_CompensationAndRetirementDisclosureAbstract |
| Namespace Prefix: |
us-gaap_ |
| Data Type: |
xbrli:stringItemType |
| Balance Type: |
na |
| Period Type: |
duration |
|
| X |
- DefinitionThe entire disclosure for retirement benefits. Reference 1: http://www.xbrl.org/2003/role/disclosureRef
-Topic 715
-SubTopic 70
-Name Accounting Standards Codification
-Section 50
-Paragraph 1
-Publisher FASB
-URI https://asc.fasb.org/1943274/2147480794/715-70-50-1
Reference 2: http://www.xbrl.org/2003/role/exampleRef
-Topic 715
-SubTopic 20
-Name Accounting Standards Codification
-Section 55
-Paragraph 17
-Publisher FASB
-URI https://asc.fasb.org/1943274/2147480482/715-20-55-17
Reference 3: http://www.xbrl.org/2003/role/disclosureRef
-Topic 715
-SubTopic 20
-Name Accounting Standards Codification
-Section 50
-Paragraph 1
-Subparagraph (d)(iv)(03)
-Publisher FASB
-URI https://asc.fasb.org/1943274/2147480506/715-20-50-1
Reference 4: http://www.xbrl.org/2003/role/disclosureRef
-Topic 715
-SubTopic 20
-Name Accounting Standards Codification
-Section 50
-Paragraph 1
-Subparagraph (d)(i)
-Publisher FASB
-URI https://asc.fasb.org/1943274/2147480506/715-20-50-1
Reference 5: http://www.xbrl.org/2003/role/disclosureRef
-Topic 715
-SubTopic 20
-Name Accounting Standards Codification
-Section 50
-Paragraph 1
-Subparagraph (q)
-Publisher FASB
-URI https://asc.fasb.org/1943274/2147480506/715-20-50-1
Reference 6: http://www.xbrl.org/2003/role/disclosureRef
-Topic 715
-SubTopic 20
-Name Accounting Standards Codification
-Section 50
-Paragraph 1
-Subparagraph (l)
-Publisher FASB
-URI https://asc.fasb.org/1943274/2147480506/715-20-50-1
Reference 7: http://www.xbrl.org/2003/role/disclosureRef
-Topic 715
-Name Accounting Standards Codification
-Publisher FASB
-URI https://asc.fasb.org/715/tableOfContent
Reference 8: http://www.xbrl.org/2003/role/disclosureRef
-Topic 715
-SubTopic 20
-Name Accounting Standards Codification
-Section 50
-Paragraph 1
-Subparagraph (d)(iii)
-Publisher FASB
-URI https://asc.fasb.org/1943274/2147480506/715-20-50-1
Reference 9: http://www.xbrl.org/2003/role/disclosureRef
-Topic 715
-SubTopic 20
-Name Accounting Standards Codification
-Section 50
-Paragraph 1
-Subparagraph (o)
-Publisher FASB
-URI https://asc.fasb.org/1943274/2147480506/715-20-50-1
Reference 10: http://www.xbrl.org/2003/role/disclosureRef
-Topic 715
-SubTopic 20
-Name Accounting Standards Codification
-Section 50
-Paragraph 1
-Subparagraph (p)
-Publisher FASB
-URI https://asc.fasb.org/1943274/2147480506/715-20-50-1
Reference 11: http://www.xbrl.org/2003/role/disclosureRef
-Topic 715
-SubTopic 20
-Name Accounting Standards Codification
-Section 50
-Paragraph 1
-Subparagraph (r)(1)
-Publisher FASB
-URI https://asc.fasb.org/1943274/2147480506/715-20-50-1
Reference 12: http://www.xbrl.org/2003/role/disclosureRef
-Topic 715
-SubTopic 20
-Name Accounting Standards Codification
-Section 50
-Paragraph 1
-Subparagraph (r)(2)
-Publisher FASB
-URI https://asc.fasb.org/1943274/2147480506/715-20-50-1
Reference 13: http://www.xbrl.org/2003/role/disclosureRef
-Topic 715
-SubTopic 20
-Name Accounting Standards Codification
-Section S99
-Paragraph 2
-Publisher FASB
-URI https://asc.fasb.org/1943274/2147480126/715-20-S99-2
Reference 14: http://www.xbrl.org/2003/role/disclosureRef
-Topic 715
-SubTopic 60
-Name Accounting Standards Codification
-Section 50
-Paragraph 3
-Subparagraph (c)
-Publisher FASB
-URI https://asc.fasb.org/1943274/2147480266/715-60-50-3
| Name: |
us-gaap_PensionAndOtherPostretirementBenefitsDisclosureTextBlock |
| Namespace Prefix: |
us-gaap_ |
| Data Type: |
dtr-types:textBlockItemType |
| Balance Type: |
na |
| Period Type: |
duration |
|
v3.24.2
Income Taxes
|
6 Months Ended |
Jun. 30, 2024 |
|---|
| Income Tax Disclosure [Abstract] |
|
| Income Taxes |
INCOME TAXES Upon formation, the Holding Company elected to be treated as a corporation for U.S. federal, state, and local tax purposes. All operations are carried on through the Holding Company’s subsidiaries, the majority of which are pass-through entities that are generally not subject to federal or state income taxation, as all of the taxable income, gains, losses, deductions, and credits are passed through to the partners. The Holding Company is responsible for income taxes on its allocable share of the Operating Company’s income or gain. During the three months ended June 30, 2024, the Company recorded a $5.9 million provision for income taxes on pre-tax income of $44.1 million. In the three months ended June 30, 2023, other than a small income tax provision attributed to one of the Company’s consolidated subsidiary corporations, the Company recorded no provision or benefit for income taxes (after application of a decrease in the Company’s valuation allowance) on pre-tax income of $50.6 million. During the six months ended June 30, 2024, the Company recorded a $6.8 million provision for income taxes on pre-tax income of $51.1 million. In the six months ended June 30, 2023, other than a small income tax provision attributed to one of the Company’s consolidated subsidiary corporations, the Company recorded no provision or benefit for income taxes (after application of a decrease in the Company’s valuation allowance) on pre-tax income of $40.8 million. The effective tax rate for the six months ended June 30, 2024 was higher than in the six months ended June 30, 2023 primarily due to the Company’s valuation allowance, which was released during the year ended December 31, 2023. The effective tax rates for both the six months ended June 30, 2024 and 2023 differ from the 21% federal statutory rate and applicable state statutory rates primarily due to the disallowance of executive compensation expenses not deductible for tax and to the pre-tax portion of income and losses that are passed through to the other partners of the Operating Company and the San Francisco Venture.
|
| X |
- DefinitionThe entire disclosure for income tax. Reference 1: http://www.xbrl.org/2003/role/disclosureRef
-Topic 740
-SubTopic 10
-Name Accounting Standards Codification
-Section 50
-Paragraph 12
-Publisher FASB
-URI https://asc.fasb.org/1943274/2147482685/740-10-50-12
Reference 2: http://www.xbrl.org/2003/role/exampleRef
-Topic 740
-SubTopic 10
-Name Accounting Standards Codification
-Section 55
-Paragraph 231
-Publisher FASB
-URI https://asc.fasb.org/1943274/2147482663/740-10-55-231
Reference 3: http://www.xbrl.org/2003/role/disclosureRef
-Topic 740
-SubTopic 10
-Name Accounting Standards Codification
-Section 50
-Paragraph 12C
-Publisher FASB
-URI https://asc.fasb.org/1943274/2147482685/740-10-50-12C
Reference 4: http://www.xbrl.org/2003/role/disclosureRef
-Topic 740
-SubTopic 10
-Name Accounting Standards Codification
-Section 50
-Paragraph 12B
-Publisher FASB
-URI https://asc.fasb.org/1943274/2147482685/740-10-50-12B
Reference 5: http://www.xbrl.org/2003/role/disclosureRef
-Topic 740
-SubTopic 270
-Name Accounting Standards Codification
-Section 50
-Paragraph 1
-Publisher FASB
-URI https://asc.fasb.org/1943274/2147477891/740-270-50-1
Reference 6: http://www.xbrl.org/2003/role/disclosureRef
-Topic 740
-SubTopic 10
-Name Accounting Standards Codification
-Section S99
-Paragraph 1
-Subparagraph (SAB Topic 6.I.5.Q1)
-Publisher FASB
-URI https://asc.fasb.org/1943274/2147479360/740-10-S99-1
Reference 7: http://www.xbrl.org/2003/role/disclosureRef
-Topic 946
-SubTopic 20
-Name Accounting Standards Codification
-Section 50
-Paragraph 13
-Publisher FASB
-URI https://asc.fasb.org/1943274/2147480990/946-20-50-13
Reference 8: http://www.xbrl.org/2003/role/disclosureRef
-Topic 235
-SubTopic 10
-Name Accounting Standards Codification
-Section S99
-Paragraph 1
-Subparagraph (SX 210.4-08(h)(2))
-Publisher FASB
-URI https://asc.fasb.org/1943274/2147480678/235-10-S99-1
Reference 9: http://www.xbrl.org/2003/role/disclosureRef
-Topic 740
-Name Accounting Standards Codification
-Publisher FASB
-URI https://asc.fasb.org/740/tableOfContent
Reference 10: http://www.xbrl.org/2003/role/disclosureRef
-Topic 740
-SubTopic 10
-Name Accounting Standards Codification
-Section 50
-Paragraph 14
-Publisher FASB
-URI https://asc.fasb.org/1943274/2147482685/740-10-50-14
Reference 11: http://www.xbrl.org/2003/role/disclosureRef
-Topic 740
-SubTopic 10
-Name Accounting Standards Codification
-Section 50
-Paragraph 21
-Publisher FASB
-URI https://asc.fasb.org/1943274/2147482685/740-10-50-21
Reference 12: http://www.xbrl.org/2003/role/disclosureRef
-Topic 740
-SubTopic 10
-Name Accounting Standards Codification
-Section 50
-Paragraph 17
-Subparagraph (b)
-Publisher FASB
-URI https://asc.fasb.org/1943274/2147482685/740-10-50-17
Reference 13: http://www.xbrl.org/2003/role/disclosureRef
-Topic 740
-SubTopic 10
-Name Accounting Standards Codification
-Section S99
-Paragraph 2
-Subparagraph (SAB Topic 11.C)
-Publisher FASB
-URI https://asc.fasb.org/1943274/2147479360/740-10-S99-2
Reference 14: http://www.xbrl.org/2003/role/disclosureRef
-Topic 740
-SubTopic 30
-Name Accounting Standards Codification
-Section 50
-Paragraph 2
-Subparagraph (a)
-Publisher FASB
-URI https://asc.fasb.org/1943274/2147482603/740-30-50-2
| Name: |
us-gaap_IncomeTaxDisclosureTextBlock |
| Namespace Prefix: |
us-gaap_ |
| Data Type: |
dtr-types:textBlockItemType |
| Balance Type: |
na |
| Period Type: |
duration |
|
v3.24.2
Financial Instruments and Fair Value Measurements and Disclosures
|
6 Months Ended |
Jun. 30, 2024 |
|---|
| Fair Value Disclosures [Abstract] |
|
| Financial Instruments and Fair Value Measurements and Disclosures |
FINANCIAL INSTRUMENTS AND FAIR VALUE MEASUREMENTS AND DISCLOSURES ASC Topic 820, Fair Value Measurement, emphasizes that a fair value measurement should be determined based on the assumptions that market participants would use in pricing the asset or liability. As a basis for considering market participant assumptions in fair value measurements, the guidance establishes a fair value hierarchy that distinguishes between market participant assumptions based on market data obtained from sources independent of the reporting entity and the reporting entity’s own assumptions about market participant assumptions. The following hierarchy classifies the inputs used to determine fair value into three levels: Level 1—Quoted prices for identical instruments in active markets Level 2—Quoted prices for similar instruments in active markets or inputs, other than quoted prices, that are observable for the instrument either directly or indirectly Level 3—Significant inputs to the valuation model are unobservable At each reporting period, the Company evaluates the fair value of its financial instruments compared to carrying values. Other than the Company’s notes payable, net, the carrying amount of the Company’s financial instruments, which includes cash and cash equivalents, restricted cash and certificates of deposit, certain related party assets and liabilities, and accounts payable and other liabilities, approximated the Company’s estimates of fair value at both June 30, 2024 and December 31, 2023. The fair value of the Company’s notes payable, net, are estimated based on quoted market prices or discounting the expected cash flows based on rates available to the Company (level 2). At June 30, 2024, the estimated fair value of notes payable, net was $537.6 million, compared to a carrying value of $524.1 million. At December 31, 2023, the estimated fair value of notes payable, net was $622.7 million, compared to a carrying value of $622.2 million. During the three and six months ended June 30, 2024 and 2023, the Company had no assets that were measured at fair value on a nonrecurring basis.
|
| X |
- References
+ Details
| Name: |
us-gaap_FairValueDisclosuresAbstract |
| Namespace Prefix: |
us-gaap_ |
| Data Type: |
xbrli:stringItemType |
| Balance Type: |
na |
| Period Type: |
duration |
|
| X |
- DefinitionThe entire disclosure for the fair value of financial instruments (as defined), including financial assets and financial liabilities (collectively, as defined), and the measurements of those instruments as well as disclosures related to the fair value of non-financial assets and liabilities. Such disclosures about the financial instruments, assets, and liabilities would include: (1) the fair value of the required items together with their carrying amounts (as appropriate); (2) for items for which it is not practicable to estimate fair value, disclosure would include: (a) information pertinent to estimating fair value (including, carrying amount, effective interest rate, and maturity, and (b) the reasons why it is not practicable to estimate fair value; (3) significant concentrations of credit risk including: (a) information about the activity, region, or economic characteristics identifying a concentration, (b) the maximum amount of loss the entity is exposed to based on the gross fair value of the related item, (c) policy for requiring collateral or other security and information as to accessing such collateral or security, and (d) the nature and brief description of such collateral or security; (4) quantitative information about market risks and how such risks are managed; (5) for items measured on both a recurring and nonrecurring basis information regarding the inputs used to develop the fair value measurement; and (6) for items presented in the financial statement for which fair value measurement is elected: (a) information necessary to understand the reasons for the election, (b) discussion of the effect of fair value changes on earnings, (c) a description of [similar groups] items for which the election is made and the relation thereof to the balance sheet, the aggregate carrying value of items included in the balance sheet that are not eligible for the election; (7) all other required (as defined) and desired information. Reference 1: http://www.xbrl.org/2003/role/exampleRef
-Topic 820
-SubTopic 10
-Name Accounting Standards Codification
-Section 55
-Paragraph 107
-Publisher FASB
-URI https://asc.fasb.org/1943274/2147482078/820-10-55-107
Reference 2: http://www.xbrl.org/2003/role/exampleRef
-Topic 820
-SubTopic 10
-Name Accounting Standards Codification
-Section 55
-Paragraph 100
-Publisher FASB
-URI https://asc.fasb.org/1943274/2147482078/820-10-55-100
Reference 3: http://www.xbrl.org/2003/role/disclosureRef
-Topic 820
-SubTopic 10
-Name Accounting Standards Codification
-Section 50
-Paragraph 2
-Subparagraph (c)(3)
-Publisher FASB
-URI https://asc.fasb.org/1943274/2147482106/820-10-50-2
Reference 4: http://www.xbrl.org/2003/role/disclosureRef
-Topic 820
-SubTopic 10
-Name Accounting Standards Codification
-Section 50
-Paragraph 6A
-Subparagraph (a)
-Publisher FASB
-URI https://asc.fasb.org/1943274/2147482106/820-10-50-6A
Reference 5: http://www.xbrl.org/2003/role/disclosureRef
-Topic 820
-SubTopic 10
-Name Accounting Standards Codification
-Section 50
-Paragraph 2E
-Publisher FASB
-URI https://asc.fasb.org/1943274/2147482106/820-10-50-2E
Reference 6: http://www.xbrl.org/2003/role/disclosureRef
-Topic 820
-SubTopic 10
-Name Accounting Standards Codification
-Section 50
-Paragraph 6A
-Subparagraph (h)
-Publisher FASB
-URI https://asc.fasb.org/1943274/2147482106/820-10-50-6A
Reference 7: http://www.xbrl.org/2003/role/disclosureRef
-Topic 820
-SubTopic 10
-Name Accounting Standards Codification
-Section 50
-Paragraph 6A
-Subparagraph (f)
-Publisher FASB
-URI https://asc.fasb.org/1943274/2147482106/820-10-50-6A
Reference 8: http://www.xbrl.org/2003/role/disclosureRef
-Topic 820
-SubTopic 10
-Name Accounting Standards Codification
-Section 50
-Paragraph 6A
-Subparagraph (e)
-Publisher FASB
-URI https://asc.fasb.org/1943274/2147482106/820-10-50-6A
Reference 9: http://www.xbrl.org/2003/role/disclosureRef
-Topic 820
-SubTopic 10
-Name Accounting Standards Codification
-Section 50
-Paragraph 6A
-Subparagraph (d)
-Publisher FASB
-URI https://asc.fasb.org/1943274/2147482106/820-10-50-6A
Reference 10: http://www.xbrl.org/2003/role/disclosureRef
-Topic 820
-SubTopic 10
-Name Accounting Standards Codification
-Section 50
-Paragraph 2
-Subparagraph (h)
-Publisher FASB
-URI https://asc.fasb.org/1943274/2147482106/820-10-50-2
Reference 11: http://www.xbrl.org/2003/role/disclosureRef
-Topic 820
-SubTopic 10
-Name Accounting Standards Codification
-Section 50
-Paragraph 2
-Subparagraph (g)
-Publisher FASB
-URI https://asc.fasb.org/1943274/2147482106/820-10-50-2
Reference 12: http://www.xbrl.org/2003/role/disclosureRef
-Topic 940
-SubTopic 820
-Name Accounting Standards Codification
-Section 50
-Paragraph 1
-Subparagraph (a)
-Publisher FASB
-URI https://asc.fasb.org/1943274/2147478119/940-820-50-1
| Name: |
us-gaap_FairValueDisclosuresTextBlock |
| Namespace Prefix: |
us-gaap_ |
| Data Type: |
dtr-types:textBlockItemType |
| Balance Type: |
na |
| Period Type: |
duration |
|
v3.24.2
Earnings Per Share
|
6 Months Ended |
Jun. 30, 2024 |
|---|
| Earnings Per Share [Abstract] |
|
| Earnings Per Share |
EARNINGS PER SHARE The Company uses the two-class method in its computation of earnings per share. The Company’s Class A common shares and Class B common shares are entitled to receive distributions at different rates, with each Class B common share receiving 0.03% of the distributions paid on each Class A common share. Under the two-class method, the Company’s net income available to common shareholders is allocated between the two classes of common shares on a fully-distributed basis and reflects residual net income after amounts attributed to noncontrolling interests. In the event of a net loss, the Company determined that both classes share in the Company’s losses, and they share in the losses using the same mechanism as the distributions. The Company also has restricted share awards that have a right to non-forfeitable dividends while unvested and are contemplated as participating when the Company is in a net income position. These awards participate in distributions on a basis equivalent to other Class A common shares but do not participate in losses. No distributions on common shares were declared for the three and six months ended June 30, 2024 or 2023. Diluted income (loss) per share calculations for both Class A common shares and Class B common shares contemplate adjustments to the numerator and the denominator under the if-converted method for the convertible Class B common shares, the exchangeable Class A units of the San Francisco Venture and the exchangeable Class A Common Units of the Operating Company. The Company uses the treasury stock method or the two-class method when evaluating dilution for restricted stock units (“RSUs”), restricted shares, and performance restricted units and shares. The more dilutive of the two methods is included in the calculation for diluted income (loss) per share. The following table summarizes the basic and diluted earnings per share calculations for the three and six months ended June 30, 2024 and 2023 (in thousands, except shares and per share amounts): | | | | | | | | | | | | | | | | | | | | | | | | | Three Months Ended June 30, | | Six Months Ended June 30, | | 2024 | | 2023 | | 2024 | | 2023 | Numerator: | | | | | | | | | Net income attributable to the Company | $ | 14,722 | | | $ | 23,571 | | | $ | 17,048 | | | $ | 19,035 | | | Adjustments to net income attributable to the Company | — | | | — | | | (9) | | | (13) | | | Net income attributable to common shareholders | $ | 14,722 | | | $ | 23,571 | | | $ | 17,039 | | | $ | 19,022 | | Numerator—basic common shares: | | | | | | | | | Net income attributable to common shareholders | $ | 14,722 | | | $ | 23,571 | | | $ | 17,039 | | | $ | 19,022 | | Less: net income allocated to participating securities | 25 | | | 132 | | | 26 | | | 100 | | | Allocation of basic net income among common shareholders | $ | 14,697 | | | $ | 23,439 | | | $ | 17,013 | | | $ | 18,922 | | | Numerator for basic net income available to Class A common shareholders | $ | 14,692 | | | $ | 23,431 | | | $ | 17,007 | | | $ | 18,915 | | | Numerator for basic net income available to Class B common shareholders | $ | 5 | | | $ | 8 | | | $ | 6 | | | $ | 7 | | Numerator—diluted common shares: | | | | | | | | | Net income attributable to common shareholders | $ | 14,722 | | | $ | 23,571 | | | $ | 17,039 | | | $ | 19,022 | | | Reallocation of income from dilutive potential securities | 15,992 | | | 25,878 | | | 18,512 | | | 20,917 | | Less: net income allocated to participating securities | 25 | | | 132 | | | 26 | | | 100 | | | Allocation of diluted net income among common shareholders | $ | 30,689 | | | $ | 49,317 | | | $ | 35,525 | | | $ | 39,839 | | | Numerator for diluted net income available to Class A common shareholders | $ | 30,684 | | | $ | 49,309 | | | $ | 35,519 | | | $ | 39,832 | | | Numerator for diluted net income available to Class B common shareholders | $ | 5 | | | $ | 8 | | | $ | 6 | | | $ | 7 | | Denominator: | | | | | | | | | Basic weighted average Class A common shares outstanding | 69,239,296 | | | 68,811,975 | | | 69,148,940 | | | 68,758,894 | | Diluted weighted average Class A common shares outstanding | 145,936,206 | | | 145,040,689 | | | 145,906,521 | | | 144,939,450 | | | Basic and diluted weighted average Class B common shares outstanding | 79,233,544 | | | 79,233,544 | | | 79,233,544 | | | 79,233,544 | | | | | | | | | | | Basic earnings per share: | | | | | | | | Class A common shares | $ | 0.21 | | | $ | 0.34 | | | $ | 0.25 | | | $ | 0.28 | | Class B common shares | $ | 0.00 | | | $ | 0.00 | | | $ | 0.00 | | | $ | 0.00 | | | Diluted earnings per share: | | | | | | | | Class A common shares | $ | 0.21 | | | $ | 0.34 | | | $ | 0.24 | | | $ | 0.27 | | Class B common shares | $ | 0.00 | | | $ | 0.00 | | | $ | 0.00 | | | $ | 0.00 | | | | | | | | | | Anti-dilutive potential RSUs | — | | | — | | | — | | | — | | Anti-dilutive potential Performance RSUs | 4,509,646 | | | 3,123,408 | | | 4,509,646 | | | 3,123,408 | | Anti-dilutive potential Restricted Shares (weighted average) | — | | | — | | | — | | | — | | | | | | | | | | | Anti-dilutive potential Class A common shares from exchanges (weighted average) | 3,137,134 | | | 3,137,134 | | | 3,137,134 | | | 3,137,134 | | | | | | | | | |
|
| X |
- References
+ Details
| Name: |
us-gaap_EarningsPerShareAbstract |
| Namespace Prefix: |
us-gaap_ |
| Data Type: |
xbrli:stringItemType |
| Balance Type: |
na |
| Period Type: |
duration |
|
| X |
- DefinitionThe entire disclosure for earnings per share. Reference 1: http://www.xbrl.org/2003/role/disclosureRef
-Topic 260
-SubTopic 10
-Name Accounting Standards Codification
-Section 50
-Paragraph 1
-Subparagraph (c)
-Publisher FASB
-URI https://asc.fasb.org/1943274/2147482662/260-10-50-1
Reference 2: http://www.xbrl.org/2003/role/disclosureRef
-Topic 260
-Name Accounting Standards Codification
-Publisher FASB
-URI https://asc.fasb.org/260/tableOfContent
Reference 3: http://www.xbrl.org/2003/role/disclosureRef
-Topic 260
-SubTopic 10
-Name Accounting Standards Codification
-Section 50
-Paragraph 2
-Publisher FASB
-URI https://asc.fasb.org/1943274/2147482662/260-10-50-2
Reference 4: http://www.xbrl.org/2003/role/disclosureRef
-Topic 260
-SubTopic 10
-Name Accounting Standards Codification
-Section 50
-Paragraph 3
-Publisher FASB
-URI https://asc.fasb.org/1943274/2147482662/260-10-50-3
| Name: |
us-gaap_EarningsPerShareTextBlock |
| Namespace Prefix: |
us-gaap_ |
| Data Type: |
dtr-types:textBlockItemType |
| Balance Type: |
na |
| Period Type: |
duration |
|
v3.24.2
Accumulated Other Comprehensive Loss
|
6 Months Ended |
Jun. 30, 2024 |
|---|
| Equity [Abstract] |
|
| Accumulated Other Comprehensive Loss |
ACCUMULATED OTHER COMPREHENSIVE LOSS Accumulated other comprehensive loss attributable to the Company consists of unamortized defined benefit pension plan net actuarial losses that totaled $2.3 million and $2.3 million at June 30, 2024 and December 31, 2023, respectively, net of tax benefits of $0.6 million and $0.6 million, respectively. Accumulated other comprehensive loss of $1.5 million and $1.5 million is included in noncontrolling interests at June 30, 2024 and December 31, 2023, respectively. Net actuarial gains or losses are re-determined annually or upon remeasurement events and principally arise from changes in the rate used to discount benefit obligations and differences between expected and actual returns on plan assets. Reclassifications from accumulated other comprehensive loss to net income attributable to the Company related to amortization of net actuarial losses were approximately $13,000 and $51,000, net of taxes, for the six months ended June 30, 2024 and 2023, respectively, and are included in other miscellaneous expense in the accompanying condensed consolidated statements of operations.
|
| X |
- DefinitionThe entire disclosure for comprehensive income, which includes, but is not limited to, 1) the amount of income tax expense or benefit allocated to each component of other comprehensive income, including reclassification adjustments, 2) the reclassification adjustments for each classification of other comprehensive income and 3) the ending accumulated balances for each component of comprehensive income. Reference 1: http://www.xbrl.org/2003/role/disclosureRef
-Topic 944
-SubTopic 220
-Name Accounting Standards Codification
-Section S99
-Paragraph 1
-Subparagraph (SX 210.7-04(19))
-Publisher FASB
-URI https://asc.fasb.org/1943274/2147477250/944-220-S99-1
Reference 2: http://www.xbrl.org/2003/role/disclosureRef
-Topic 220
-SubTopic 10
-Name Accounting Standards Codification
-Section S99
-Paragraph 2
-Subparagraph (SX 210.5-03(21))
-Publisher FASB
-URI https://asc.fasb.org/1943274/2147483621/220-10-S99-2
Reference 3: http://www.xbrl.org/2003/role/disclosureRef
-Topic 942
-SubTopic 220
-Name Accounting Standards Codification
-Section S99
-Paragraph 1
-Subparagraph (SX 210.9-04(23))
-Publisher FASB
-URI https://asc.fasb.org/1943274/2147478524/942-220-S99-1
Reference 4: http://fasb.org/us-gaap/role/ref/legacyRef
-Topic 220
-Name Accounting Standards Codification
-Publisher FASB
-URI https://asc.fasb.org/220/tableOfContent
| Name: |
us-gaap_ComprehensiveIncomeNoteTextBlock |
| Namespace Prefix: |
us-gaap_ |
| Data Type: |
dtr-types:textBlockItemType |
| Balance Type: |
na |
| Period Type: |
duration |
|
| X |
- References
+ Details
| Name: |
us-gaap_EquityAbstract |
| Namespace Prefix: |
us-gaap_ |
| Data Type: |
xbrli:stringItemType |
| Balance Type: |
na |
| Period Type: |
duration |
|
v3.24.2
Basis of Presentation (Policies)
|
6 Months Ended |
Jun. 30, 2024 |
|---|
| Accounting Policies [Abstract] |
|
| Principles of Consolidation |
Principles of consolidation—The accompanying condensed consolidated financial statements include the accounts of the Holding Company and the accounts of all subsidiaries in which the Holding Company has a controlling interest and the consolidated accounts of variable interest entities (“VIEs”) in which the Holding Company is deemed to be the primary beneficiary. All intercompany transactions and balances have been eliminated in consolidation.
|
| Unaudited Interim Financial Information |
Unaudited interim financial information—The accompanying condensed consolidated financial statements are unaudited and have been prepared in accordance with U.S. generally accepted accounting principles (“U.S. GAAP”) for interim financial information, the instructions to Form 10-Q and Article 10 of Regulation S-X. Accordingly, they do not include all of the information and notes required by U.S. GAAP for complete financial statements. These condensed consolidated financial statements should be read in conjunction with the Company’s Annual Report on Form 10-K for the year ended December 31, 2023. In the opinion of management, all adjustments (including normal recurring adjustments) considered necessary for a fair presentation have been included. Operating results and cash flows for the three and six months ended June 30, 2024 are not necessarily indicative of the operating results and cash flows that may be expected for the full year.
|
| Use of Estimates |
Use of estimates—The preparation of financial statements in conformity with U.S. GAAP requires management to make estimates and assumptions that affect the reported amounts of assets and liabilities, disclosure of contingent assets and liabilities at the date of the financial statements, and the reported amounts of revenues and expenses during the reporting periods. Management evaluates its estimates on an ongoing basis and makes revisions to these estimates and related disclosures as experience develops or new information becomes known. Actual results could differ from those estimates.
|
| Recently Issued Accounting Pronouncements |
Recently issued accounting pronouncements—In November 2023, the Financial Accounting Standards Board (“FASB”) issued Accounting Standards Update (“ASU”) 2023-07, Segment Reporting (Topic 280): Improvements to Reportable Segment Disclosures, which primarily requires expanded disclosure of significant segment expenses and other segment items on an annual and interim basis. The standard is effective for fiscal years beginning after December 15, 2023, and interim periods within fiscal years beginning after December 15, 2024, with early adoption permitted. The standard will be applied retrospectively to all prior periods presented in the financial statements. The Company is currently evaluating the effect of this update on the Company’s financial statement disclosures. In December 2023, the FASB issued ASU 2023-09, Income Taxes (Topic 740): Improvements to Income Tax Disclosures, which primarily requires expanded disclosures for income taxes paid and the effective tax rate reconciliation. The standard is effective for fiscal years beginning after December 15, 2024, with early adoption permitted and can be applied on either a prospective or retrospective basis. The Company is currently evaluating the effect of this update on the Company’s financial statement disclosures.
|
| X |
- References
+ Details
| Name: |
us-gaap_AccountingPoliciesAbstract |
| Namespace Prefix: |
us-gaap_ |
| Data Type: |
xbrli:stringItemType |
| Balance Type: |
na |
| Period Type: |
duration |
|
| X |
- DefinitionDisclosure of accounting policy for basis of accounting, or basis of presentation, used to prepare the financial statements (for example, US Generally Accepted Accounting Principles, Other Comprehensive Basis of Accounting, IFRS).
| Name: |
us-gaap_BasisOfAccountingPolicyPolicyTextBlock |
| Namespace Prefix: |
us-gaap_ |
| Data Type: |
dtr-types:textBlockItemType |
| Balance Type: |
na |
| Period Type: |
duration |
|
| X |
- DefinitionDisclosure of accounting policy regarding (1) the principles it follows in consolidating or combining the separate financial statements, including the principles followed in determining the inclusion or exclusion of subsidiaries or other entities in the consolidated or combined financial statements and (2) its treatment of interests (for example, common stock, a partnership interest or other means of exerting influence) in other entities, for example consolidation or use of the equity or cost methods of accounting. The accounting policy may also address the accounting treatment for intercompany accounts and transactions, noncontrolling interest, and the income statement treatment in consolidation for issuances of stock by a subsidiary. Reference 1: http://www.xbrl.org/2003/role/exampleRef
-Topic 235
-SubTopic 10
-Name Accounting Standards Codification
-Section 50
-Paragraph 4
-Subparagraph (a)
-Publisher FASB
-URI https://asc.fasb.org/1943274/2147483426/235-10-50-4
Reference 2: http://fasb.org/us-gaap/role/ref/legacyRef
-Name Accounting Standards Codification
-Topic 810
-SubTopic 10
-Section 50
-Paragraph 1
-Publisher FASB
-URI https://asc.fasb.org/1943274/2147481203/810-10-50-1
| Name: |
us-gaap_ConsolidationPolicyTextBlock |
| Namespace Prefix: |
us-gaap_ |
| Data Type: |
dtr-types:textBlockItemType |
| Balance Type: |
na |
| Period Type: |
duration |
|
| X |
- DefinitionDisclosure of accounting policy pertaining to new accounting pronouncements that may impact the entity's financial reporting. Includes, but is not limited to, quantification of the expected or actual impact.
| Name: |
us-gaap_NewAccountingPronouncementsPolicyPolicyTextBlock |
| Namespace Prefix: |
us-gaap_ |
| Data Type: |
dtr-types:textBlockItemType |
| Balance Type: |
na |
| Period Type: |
duration |
|
| X |
- DefinitionDisclosure of accounting policy for the use of estimates in the preparation of financial statements in conformity with generally accepted accounting principles. Reference 1: http://fasb.org/us-gaap/role/ref/legacyRef
-Name Accounting Standards Codification
-Topic 275
-SubTopic 10
-Section 50
-Paragraph 9
-Publisher FASB
-URI https://asc.fasb.org/1943274/2147482861/275-10-50-9
Reference 2: http://fasb.org/us-gaap/role/ref/legacyRef
-Name Accounting Standards Codification
-Topic 275
-SubTopic 10
-Section 50
-Paragraph 4
-Publisher FASB
-URI https://asc.fasb.org/1943274/2147482861/275-10-50-4
Reference 3: http://www.xbrl.org/2003/role/disclosureRef
-Name Accounting Standards Codification
-Section 50
-Paragraph 1
-Subparagraph (b)
-SubTopic 10
-Topic 275
-Publisher FASB
-URI https://asc.fasb.org/1943274/2147482861/275-10-50-1
Reference 4: http://www.xbrl.org/2003/role/disclosureRef
-Name Accounting Standards Codification
-Section 50
-Paragraph 1
-Subparagraph (c)
-SubTopic 10
-Topic 275
-Publisher FASB
-URI https://asc.fasb.org/1943274/2147482861/275-10-50-1
Reference 5: http://www.xbrl.org/2003/role/disclosureRef
-Name Accounting Standards Codification
-Section 50
-Paragraph 11
-SubTopic 10
-Topic 275
-Publisher FASB
-URI https://asc.fasb.org/1943274/2147482861/275-10-50-11
Reference 6: http://www.xbrl.org/2003/role/disclosureRef
-Name Accounting Standards Codification
-Section 50
-Paragraph 12
-SubTopic 10
-Topic 275
-Publisher FASB
-URI https://asc.fasb.org/1943274/2147482861/275-10-50-12
Reference 7: http://fasb.org/us-gaap/role/ref/legacyRef
-Name Accounting Standards Codification
-Topic 275
-SubTopic 10
-Section 50
-Paragraph 8
-Publisher FASB
-URI https://asc.fasb.org/1943274/2147482861/275-10-50-8
| Name: |
us-gaap_UseOfEstimates |
| Namespace Prefix: |
us-gaap_ |
| Data Type: |
dtr-types:textBlockItemType |
| Balance Type: |
na |
| Period Type: |
duration |
|
v3.24.2
Basis of Presentation (Tables)
|
6 Months Ended |
Jun. 30, 2024 |
|---|
| Accounting Policies [Abstract] |
|
| Schedule of Miscellaneous Other Income (Expense) |
Miscellaneous other income (expense)—Miscellaneous other income (expense) consisted of the following (in thousands): | | | | | | | | | | | | | | | | | | | | | | | | | Three Months Ended June 30, | | Six Months Ended June 30, | | 2024 | | 2023 | | 2024 | | 2023 | | Net periodic pension benefit (cost) | $ | 23 | | | $ | (20) | | | $ | 47 | | | $ | (41) | | Other(1) | 3 | | | — | | | (5,928) | | | — | | | | | | | | | | | Total miscellaneous other income (expense) | $ | 26 | | | $ | (20) | | | $ | (5,881) | | | $ | (41) | |
(1) In January 2024, the Company settled an exchange offer on its $625.0 million 7.875% Senior Notes (see Note 9). For the six months ended June 30, 2024, the Company incurred $5.9 million in third party costs related to the debt modification, which is included in other in the table above.
|
| X |
- References
+ Details
| Name: |
us-gaap_AccountingPoliciesAbstract |
| Namespace Prefix: |
us-gaap_ |
| Data Type: |
xbrli:stringItemType |
| Balance Type: |
na |
| Period Type: |
duration |
|
| X |
- DefinitionTabular disclosure of the detailed components of other nonoperating income. May include methodology, assumptions and amounts for: (a) dividends, (b) interest on securities, (c) profits on securities (net of losses), and (d) miscellaneous other income items. Reference 1: http://fasb.org/us-gaap/role/ref/legacyRef
-Topic 220
-SubTopic 10
-Name Accounting Standards Codification
-Section S99
-Paragraph 2
-Subparagraph (SX 210.5-03(7))
-Publisher FASB
-URI https://asc.fasb.org/1943274/2147483621/220-10-S99-2
| Name: |
us-gaap_ScheduleOfOtherNonoperatingIncomeByComponentTextBlock |
| Namespace Prefix: |
us-gaap_ |
| Data Type: |
dtr-types:textBlockItemType |
| Balance Type: |
na |
| Period Type: |
duration |
|
v3.24.2
Revenues (Tables)
|
6 Months Ended |
Jun. 30, 2024 |
|---|
| Revenue from Contract with Customer [Abstract] |
|
| Schedule of Revenue Disaggregated by Source and Reporting Segment |
The following tables present the Company’s consolidated revenues disaggregated by revenue source and reporting segment (in thousands): | | | | | | | | | | | | | | | | | | | | | | | | | | | | | | | | | | | | | | | | | | | | | | | | | | | | | | | | | | | | | Three Months Ended June 30, 2024 | | Six Months Ended June 30, 2024 | | Valencia | | San Francisco | | Great Park(1) | | Commercial(1) | | Total | | Valencia | | San Francisco | | Great Park(1) | | Commercial(1) | | Total | Land sales and land sales—related party | $ | 310 | | | $ | — | | | $ | — | | | $ | — | | | $ | 310 | | | $ | 842 | | | $ | — | | | $ | — | | | $ | — | | | $ | 842 | | Management services—related party | — | | | — | | | 50,151 | | | 128 | | | 50,279 | | | — | | | — | | | 58,764 | | | 241 | | | 59,005 | | | Operating properties | 168 | | | — | | | — | | | — | | | 168 | | | 243 | | | — | | | — | | | — | | | 243 | | | 478 | | | — | | | 50,151 | | | 128 | | | 50,757 | | | 1,085 | | | — | | | 58,764 | | | 241 | | | 60,090 | | | Operating properties leasing revenues | 267 | | | 168 | | | — | | | — | | | 435 | | | 701 | | | 336 | | | — | | | — | | | 1,037 | | | $ | 745 | | | $ | 168 | | | $ | 50,151 | | | $ | 128 | | | $ | 51,192 | | | $ | 1,786 | | | $ | 336 | | | $ | 58,764 | | | $ | 241 | | | $ | 61,127 | |
| | | | | | | | | | | | | | | | | | | | | | | | | | | | | | | | | | | | | | | | | | | | | | | | | | | | | | | | | | | | | Three Months Ended June 30, 2023 | | Six Months Ended June 30, 2023 | | Valencia | | San Francisco | | Great Park(1) | | Commercial(1) | | Total | | Valencia | | San Francisco | | Great Park(1) | | Commercial(1) | | Total | Land sales and land sales—related party | $ | (13) | | | $ | — | | | $ | — | | | $ | — | | | $ | (13) | | | $ | 586 | | | $ | — | | | $ | — | | | $ | — | | | $ | 586 | | Management services—related party | — | | | — | | | 20,670 | | | 104 | | | 20,774 | | | — | | | — | | | 24,799 | | | 211 | | | 25,010 | | | Operating properties | 141 | | | — | | | — | | | — | | | 141 | | | 499 | | | — | | | — | | | — | | | 499 | | | 128 | | | — | | | 20,670 | | | 104 | | | 20,902 | | | 1,085 | | | — | | | 24,799 | | | 211 | | | 26,095 | | | Operating properties leasing revenues | 285 | | | 162 | | | — | | | — | | | 447 | | | 631 | | | 324 | | | — | | | — | | | 955 | | | $ | 413 | | | $ | 162 | | | $ | 20,670 | | | $ | 104 | | | $ | 21,349 | | | $ | 1,716 | | | $ | 324 | | | $ | 24,799 | | | $ | 211 | | | $ | 27,050 | | | | | | | | | | | | | | | | | | | | | |
|
| X |
- DefinitionTabular disclosure of disaggregation of revenue into categories depicting how nature, amount, timing, and uncertainty of revenue and cash flows are affected by economic factor. Reference 1: http://www.xbrl.org/2009/role/commonPracticeRef
-Topic 606
-SubTopic 10
-Name Accounting Standards Codification
-Section 50
-Paragraph 5
-Publisher FASB
-URI https://asc.fasb.org/1943274/2147479806/606-10-50-5
| Name: |
us-gaap_DisaggregationOfRevenueTableTextBlock |
| Namespace Prefix: |
us-gaap_ |
| Data Type: |
dtr-types:textBlockItemType |
| Balance Type: |
na |
| Period Type: |
duration |
|
| X |
- References
+ Details
| Name: |
us-gaap_RevenueFromContractWithCustomerAbstract |
| Namespace Prefix: |
us-gaap_ |
| Data Type: |
xbrli:stringItemType |
| Balance Type: |
na |
| Period Type: |
duration |
|
v3.24.2
Investment In Unconsolidated Entities (Tables)
|
6 Months Ended |
Jun. 30, 2024 |
|---|
| Equity Method Investments and Joint Ventures [Abstract] |
|
| Schedule of Equity Method Investments |
The following table summarizes the statements of operations of the Great Park Venture for the six months ended June 30, 2024 and 2023 (in thousands): | | | | | | | | | | | | | Six Months Ended June 30, | | 2024 | | 2023 | | Land sale and related party land sale revenues | $ | 232,081 | | | $ | 369,196 | | | | | | Cost of land sales | (58,974) | | | (165,749) | | | | | | Other costs and expenses | (75,046) | | | (32,547) | | | Net income of Great Park Venture | $ | 98,061 | | | $ | 170,900 | | | The Company’s share of net income | $ | 36,773 | | | $ | 64,088 | | | Basis difference amortization, net | (3,643) | | | (10,604) | | | | | | | Equity in earnings from Great Park Venture | $ | 33,130 | | | $ | 53,484 | |
The following table summarizes the balance sheet data of the Great Park Venture and the Company’s investment balance as of June 30, 2024 and December 31, 2023 (in thousands): | | | | | | | | | | | | | June 30, 2024 | | December 31, 2023 | Inventories | $ | 304,477 | | | $ | 391,352 | | Cash and cash equivalents | 145,363 | | | 61,054 | | | Contract assets, receivables and other assets, net | 195,575 | | | 166,793 | | Total assets | $ | 645,415 | | | $ | 619,199 | | Accounts payable and other liabilities | $ | 253,935 | | | $ | 184,847 | | | | | | Redeemable Legacy Interests | 3,293 | | | 18,075 | | Capital (Percentage Interest) | 388,187 | | | 416,277 | | Total liabilities and capital | $ | 645,415 | | | $ | 619,199 | | The Company’s share of capital in Great Park Venture | $ | 145,572 | | | $ | 156,105 | | Unamortized basis difference | 54,038 | | | 57,681 | | The Company’s investment in the Great Park Venture | $ | 199,610 | | | $ | 213,786 | |
The following table summarizes the statements of operations of the Gateway Commercial Venture for the six months ended June 30, 2024 and 2023 (in thousands): | | | | | | | | | | | | | Six Months Ended June 30, | | 2024 | | 2023 | | Rental revenues | $ | 4,773 | | | $ | 4,175 | | | Rental operating and other expenses | (1,787) | | | (1,967) | | | Depreciation and amortization | (2,008) | | | (1,989) | | | | | | | Interest expense | (1,384) | | | (1,108) | | | Net loss of Gateway Commercial Venture | $ | (406) | | | $ | (889) | | | Equity in loss from Gateway Commercial Venture | $ | (305) | | | $ | (667) | |
The following table summarizes the balance sheet data of the Gateway Commercial Venture and the Company’s investment balance as of June 30, 2024 and December 31, 2023 (in thousands): | | | | | | | | | | | | | June 30, 2024 | | December 31, 2023 | | Real estate and related intangible assets, net | $ | 74,711 | | | $ | 76,719 | | | Cash and restricted cash | 6,706 | | | 5,574 | | | Other assets | 3,583 | | | 3,554 | | | Total assets | $ | 85,000 | | | $ | 85,847 | | | Notes payable, net | $ | 28,745 | | | $ | 28,850 | | | Other liabilities | 6,286 | | | 6,623 | | | Members’ capital | 49,969 | | | 50,374 | | | Total liabilities and capital | $ | 85,000 | | | $ | 85,847 | | | The Company’s investment in the Gateway Commercial Venture | $ | 37,476 | | | $ | 37,781 | |
|
| X |
- References
+ Details
| Name: |
us-gaap_EquityMethodInvestmentsAndJointVenturesAbstract |
| Namespace Prefix: |
us-gaap_ |
| Data Type: |
xbrli:stringItemType |
| Balance Type: |
na |
| Period Type: |
duration |
|
| X |
- DefinitionTabular disclosure of equity method investments including, but not limited to, name of each investee or group of investments, percentage ownership, difference between recorded amount of an investment and the value of the underlying equity in the net assets, and summarized financial information. Reference 1: http://www.xbrl.org/2003/role/disclosureRef
-Topic 323
-SubTopic 10
-Name Accounting Standards Codification
-Section 50
-Paragraph 3
-Publisher FASB
-URI https://asc.fasb.org/1943274/2147481687/323-10-50-3
| Name: |
us-gaap_EquityMethodInvestmentsTextBlock |
| Namespace Prefix: |
us-gaap_ |
| Data Type: |
dtr-types:textBlockItemType |
| Balance Type: |
na |
| Period Type: |
duration |
|
v3.24.2
Noncontrolling Interest (Tables)
|
6 Months Ended |
Jun. 30, 2024 |
|---|
| Noncontrolling Interest [Abstract] |
|
| Schedule of Tax Distributions |
Tax distributions to the partners of the Operating Company for the three and six months ended June 30, 2024 and 2023, were as follows (in thousands): | | | | | | | | | | | | | | | | | | | | | | | | | Three Months Ended June 30, | | Six Months Ended June 30, | | 2024 | | 2023 | | 2024 | | 2023 | | Management Partner | $ | — | | | $ | — | | | $ | — | | | $ | 1,974 | | | Other partners (excluding the Holding Company) | — | | | — | | | — | | | — | | | Total tax distributions | $ | — | | | $ | — | | | $ | — | | | $ | 1,974 | |
|
| X |
- DefinitionTabular disclosure of payment of cash or stock made to limited partner of limited partnership (LP). Reference 1: http://fasb.org/us-gaap/role/ref/legacyRef
-Topic 505
-SubTopic 10
-Name Accounting Standards Codification
-Section S99
-Paragraph 1
-Subparagraph (SX 210.3-04)
-Publisher FASB
-URI https://asc.fasb.org/1943274/2147480008/505-10-S99-1
| Name: |
us-gaap_DistributionsMadeToLimitedPartnerByDistributionTableTextBlock |
| Namespace Prefix: |
us-gaap_ |
| Data Type: |
dtr-types:textBlockItemType |
| Balance Type: |
na |
| Period Type: |
duration |
|
| X |
- References
+ Details
| Name: |
us-gaap_NoncontrollingInterestAbstract |
| Namespace Prefix: |
us-gaap_ |
| Data Type: |
xbrli:stringItemType |
| Balance Type: |
na |
| Period Type: |
duration |
|
v3.24.2
Intangible Asset, Net - Related Party (Tables)
|
6 Months Ended |
Jun. 30, 2024 |
|---|
| Goodwill and Intangible Assets Disclosure [Abstract] |
|
| Schedule of Finite-Lived Intangible Assets |
The carrying amount and accumulated amortization of the intangible asset as of June 30, 2024 and December 31, 2023 were as follows (in thousands): | | | | | | | | | | | | | June 30, 2024 | | December 31, 2023 | | Gross carrying amount | $ | 129,705 | | | $ | 129,705 | | | Accumulated amortization | (115,977) | | | (104,435) | | | Net book value | $ | 13,728 | | | $ | 25,270 | |
|
| X |
- References
+ Details
| Name: |
us-gaap_GoodwillAndIntangibleAssetsDisclosureAbstract |
| Namespace Prefix: |
us-gaap_ |
| Data Type: |
xbrli:stringItemType |
| Balance Type: |
na |
| Period Type: |
duration |
|
| X |
- DefinitionTabular disclosure of assets, excluding financial assets and goodwill, lacking physical substance with a finite life, by either major class or business segment. Reference 1: http://www.xbrl.org/2003/role/exampleRef
-Topic 350
-SubTopic 30
-Name Accounting Standards Codification
-Section 55
-Paragraph 40
-Publisher FASB
-URI https://asc.fasb.org/1943274/2147482640/350-30-55-40
Reference 2: http://www.xbrl.org/2009/role/commonPracticeRef
-Topic 350
-SubTopic 30
-Name Accounting Standards Codification
-Section 50
-Paragraph 2
-Subparagraph (a)
-Publisher FASB
-URI https://asc.fasb.org/1943274/2147482665/350-30-50-2
| Name: |
us-gaap_ScheduleOfFiniteLivedIntangibleAssetsTableTextBlock |
| Namespace Prefix: |
us-gaap_ |
| Data Type: |
dtr-types:textBlockItemType |
| Balance Type: |
na |
| Period Type: |
duration |
|
v3.24.2
Related Party Transactions (Tables)
|
6 Months Ended |
Jun. 30, 2024 |
|---|
| Related Party Transactions [Abstract] |
|
| Schedule of Related Party Transactions |
Related party assets and liabilities included in the Company’s condensed consolidated balance sheets as of June 30, 2024 and December 31, 2023 consisted of the following (in thousands): | | | | | | | | | | | | | June 30, 2024 | | December 31, 2023 | Related Party Assets: | | | | Contract assets (see Note 3) | $ | 106,881 | | | $ | 69,068 | | | Operating lease right-of-use asset (corporate office lease at Five Point Gateway Campus) | 12,808 | | | 14,040 | | Other | 862 | | | 862 | | | $ | 120,551 | | | $ | 83,970 | | Related Party Liabilities: | | | | Reimbursement obligation | $ | 60,717 | | | $ | 59,378 | | | | | | Payable to holders of Management Company’s Class B interests | 333 | | | 1,828 | | | Operating lease liability (corporate office lease at Five Point Gateway Campus) | 10,129 | | | 10,974 | | | Accrued advisory fees | 1,825 | | | 4,725 | | Other | 1,169 | | | 1,169 | | | $ | 74,173 | | | $ | 78,074 | |
|
| X |
- DefinitionTabular disclosure of related party transactions. Examples of related party transactions include, but are not limited to, transactions between (a) a parent company and its subsidiary; (b) subsidiaries of a common parent; (c) and entity and its principal owners and (d) affiliates.
| Name: |
us-gaap_ScheduleOfRelatedPartyTransactionsTableTextBlock |
| Namespace Prefix: |
us-gaap_ |
| Data Type: |
dtr-types:textBlockItemType |
| Balance Type: |
na |
| Period Type: |
duration |
|
v3.24.2
Notes Payable, Net (Tables)
|
6 Months Ended |
Jun. 30, 2024 |
|---|
| Debt Disclosure [Abstract] |
|
| Schedule of Long-term Debt Instruments |
At June 30, 2024 and December 31, 2023, notes payable, net consisted of the following (in thousands): | | | | | | | | | | | | | June 30, 2024 | | December 31, 2023 | 10.500% initial rate New Senior Notes due 2028 | $ | 523,494 | | | $ | — | | 7.875% Senior Notes due 2025 | 1,500 | | | 625,000 | | | Unamortized premium | 1,206 | | | — | | | Unamortized debt issuance costs | (2,096) | | | (2,814) | | | $ | 524,104 | | | $ | 622,186 | |
|
| X |
- References
+ Details
| Name: |
us-gaap_DebtDisclosureAbstract |
| Namespace Prefix: |
us-gaap_ |
| Data Type: |
xbrli:stringItemType |
| Balance Type: |
na |
| Period Type: |
duration |
|
| X |
- DefinitionTabular disclosure of long-debt instruments or arrangements, including identification, terms, features, collateral requirements and other information necessary to a fair presentation. These are debt arrangements that originally required repayment more than twelve months after issuance or greater than the normal operating cycle of the entity, if longer. Reference 1: http://fasb.org/us-gaap/role/ref/legacyRef
-Name Accounting Standards Codification
-Section S99
-Paragraph 1
-Subparagraph (SX 210.5-02(22))
-SubTopic 10
-Topic 210
-Publisher FASB
-URI https://asc.fasb.org/1943274/2147480566/210-10-S99-1
Reference 2: http://www.xbrl.org/2003/role/exampleRef
-Topic 470
-SubTopic 20
-Name Accounting Standards Codification
-Section 55
-Paragraph 69B
-Publisher FASB
-URI https://asc.fasb.org/1943274/2147481568/470-20-55-69B
Reference 3: http://www.xbrl.org/2003/role/exampleRef
-Topic 470
-SubTopic 20
-Name Accounting Standards Codification
-Section 55
-Paragraph 69E
-Publisher FASB
-URI https://asc.fasb.org/1943274/2147481568/470-20-55-69E
Reference 4: http://www.xbrl.org/2009/role/commonPracticeRef
-Topic 235
-SubTopic 10
-Name Accounting Standards Codification
-Section S99
-Paragraph 3
-Subparagraph (SX 210.12-04(a))
-Publisher FASB
-URI https://asc.fasb.org/1943274/2147480678/235-10-S99-3
Reference 5: http://www.xbrl.org/2009/role/commonPracticeRef
-Topic 835
-SubTopic 30
-Name Accounting Standards Codification
-Section 45
-Paragraph 2
-Publisher FASB
-URI https://asc.fasb.org/1943274/2147482925/835-30-45-2
Reference 6: http://fasb.org/us-gaap/role/ref/legacyRef
-Name Accounting Standards Codification
-Topic 505
-SubTopic 10
-Section 50
-Paragraph 3
-Publisher FASB
-URI https://asc.fasb.org/1943274/2147481112/505-10-50-3
Reference 7: http://fasb.org/us-gaap/role/ref/legacyRef
-Name Accounting Standards Codification
-Topic 942
-SubTopic 470
-Section 50
-Paragraph 3
-Publisher FASB
-URI https://asc.fasb.org/1943274/2147477734/942-470-50-3
Reference 8: http://fasb.org/us-gaap/role/ref/legacyRef
-Name Accounting Standards Codification
-Topic 505
-SubTopic 10
-Section 50
-Paragraph 8
-Publisher FASB
-URI https://asc.fasb.org/1943274/2147481112/505-10-50-8
Reference 9: http://fasb.org/us-gaap/role/ref/legacyRef
-Topic 505
-SubTopic 10
-Name Accounting Standards Codification
-Section 50
-Paragraph 6
-Publisher FASB
-URI https://asc.fasb.org/1943274/2147481112/505-10-50-6
Reference 10: http://fasb.org/us-gaap/role/ref/legacyRef
-Topic 505
-SubTopic 10
-Name Accounting Standards Codification
-Section 50
-Paragraph 7
-Publisher FASB
-URI https://asc.fasb.org/1943274/2147481112/505-10-50-7
| Name: |
us-gaap_ScheduleOfDebtInstrumentsTextBlock |
| Namespace Prefix: |
us-gaap_ |
| Data Type: |
dtr-types:textBlockItemType |
| Balance Type: |
na |
| Period Type: |
duration |
|
v3.24.2
Commitments and Contingencies (Tables)
|
6 Months Ended |
Jun. 30, 2024 |
|---|
| Commitments and Contingencies Disclosure [Abstract] |
|
| Schedule of Supplemental Balance Sheet Information |
Operating lease right-of-use assets are included in other assets or related party assets, and operating lease liabilities are included in accounts payable and other liabilities or related party liabilities on the condensed consolidated balance sheets and were as follows as of June 30, 2024 and December 31, 2023 (in thousands): | | | | | | | | | | | | | June 30, 2024 | | December 31, 2023 | Operating lease right-of-use assets ($12,808 and $14,040 related party, respectively) | $ | 14,618 | | | $ | 16,002 | | Operating lease liabilities ($10,129 and $10,974 related party, respectively) | $ | 11,982 | | | $ | 12,755 | |
|
| X |
- DefinitionAssets And Liabilities, Lessee [Table Text Block]
| Name: |
fph_AssetsAndLiabilitiesLesseeTableTextBlock |
| Namespace Prefix: |
fph_ |
| Data Type: |
dtr-types1:textBlockItemType |
| Balance Type: |
na |
| Period Type: |
duration |
|
| X |
- References
+ Details
| Name: |
us-gaap_CommitmentsAndContingenciesDisclosureAbstract |
| Namespace Prefix: |
us-gaap_ |
| Data Type: |
xbrli:stringItemType |
| Balance Type: |
na |
| Period Type: |
duration |
|
v3.24.2
Supplemental Cash Flow Information (Tables)
|
6 Months Ended |
Jun. 30, 2024 |
|---|
| Supplemental Cash Flow Elements [Abstract] |
|
| Schedule of Supplemental Cash Flow and Other Information Related to Leases |
Supplemental cash flow information for the six months ended June 30, 2024 and 2023 was as follows (in thousands): | | | | | | | | | | | | | Six Months Ended June 30, | | 2024 | | 2023 | | SUPPLEMENTAL CASH FLOW INFORMATION: | | | | | Cash paid for interest, all of which was capitalized to inventories | $ | 26,549 | | | $ | 25,998 | | | Noncash lease expense | $ | 1,383 | | | $ | 2,094 | | | | | | | NONCASH INVESTING AND FINANCING ACTIVITIES: | | | | | | | | | Adjustment to operating lease right-of-use assets from lease modification | $ | — | | | $ | (773) | | | Adjustment to liability recognized under TRA | $ | 143 | | | $ | 140 | | | Senior Notes due 2025 exchanged for New Senior Notes due 2028 (see Note 9) | $ | 523,500 | | | $ | — | | | | | | | | | | | | | | | | | |
|
| Schedule of Condensed Cash Flow Information |
The following table provides a reconciliation of cash, cash equivalents, and restricted cash reported within the condensed consolidated balance sheets that sum to the total of the same such amounts shown in the condensed consolidated statements of cash flows for the six months ended June 30, 2024 and 2023 (in thousands): | | | | | | | | | | | | | June 30, 2024 | | June 30, 2023 | | Cash and cash equivalents | $ | 217,387 | | | $ | 193,203 | | | Restricted cash and certificates of deposit | 992 | | | 992 | | | Total cash, cash equivalents, and restricted cash shown in the condensed consolidated statements of cash flows | $ | 218,379 | | | $ | 194,195 | |
|
| X |
- DefinitionTabular disclosure of supplemental cash flow information for the periods presented.
| Name: |
us-gaap_ScheduleOfCashFlowSupplementalDisclosuresTableTextBlock |
| Namespace Prefix: |
us-gaap_ |
| Data Type: |
dtr-types:textBlockItemType |
| Balance Type: |
na |
| Period Type: |
duration |
|
| X |
- DefinitionTabular disclosure of cash and cash equivalents restricted as to withdrawal or usage. Reference 1: http://www.xbrl.org/2009/role/commonPracticeRef
-Topic 944
-SubTopic 210
-Name Accounting Standards Codification
-Section S99
-Paragraph 1
-Subparagraph (SX 210.7-03(a)(2))
-Publisher FASB
-URI https://asc.fasb.org/1943274/2147478777/944-210-S99-1
Reference 2: http://fasb.org/us-gaap/role/ref/legacyRef
-Topic 942
-SubTopic 210
-Name Accounting Standards Codification
-Section S99
-Paragraph 1
-Subparagraph (SX 210.9-03(1)(a))
-Publisher FASB
-URI https://asc.fasb.org/1943274/2147478546/942-210-S99-1
Reference 3: http://fasb.org/us-gaap/role/ref/legacyRef
-Name Accounting Standards Codification
-Section 50
-Paragraph 8
-SubTopic 10
-Topic 230
-Publisher FASB
-URI https://asc.fasb.org/1943274/2147482913/230-10-50-8
| Name: |
us-gaap_ScheduleOfRestrictedCashAndCashEquivalentsTextBlock |
| Namespace Prefix: |
us-gaap_ |
| Data Type: |
dtr-types:textBlockItemType |
| Balance Type: |
na |
| Period Type: |
duration |
|
| X |
- References
+ Details
| Name: |
us-gaap_SupplementalCashFlowElementsAbstract |
| Namespace Prefix: |
us-gaap_ |
| Data Type: |
xbrli:stringItemType |
| Balance Type: |
na |
| Period Type: |
duration |
|
v3.24.2
Segment Reporting (Tables)
|
6 Months Ended |
Jun. 30, 2024 |
|---|
| Segment Reporting [Abstract] |
|
| Schedule of Segment Reporting Information, by Segment |
Segment operating results and reconciliations to the Company’s consolidated balances are as follows (in thousands): | | | | | | | | | | | | | | | | | | | | | | | | | | | | | | | | | | | | | | | | | | | | | | | | | Revenues | | Profit (Loss) | | Revenues | | Profit (Loss) | | Three Months Ended June 30, | | Six Months Ended June 30, | | 2024 | | 2023 | | 2024 | | 2023 | | 2024 | | 2023 | | 2024 | | 2023 | Valencia | $ | 745 | | | $ | 413 | | | $ | (3,382) | | | $ | (4,538) | | | $ | 1,786 | | | $ | 1,716 | | | $ | (6,485) | | | $ | (6,977) | | San Francisco | 168 | | | 162 | | | (1,109) | | | (885) | | | 336 | | | 324 | | | (2,061) | | | (1,915) | | Great Park | 189,523 | | | 381,266 | | | 83,768 | | | 179,145 | | | 290,845 | | | 393,995 | | | 141,614 | | | 183,651 | | Commercial | 2,352 | | | 2,125 | | | (162) | | | (502) | | | 5,014 | | | 4,386 | | | (165) | | | (678) | | | Total reportable segments | 192,788 | | | 383,966 | | | 79,115 | | | 173,220 | | | 297,981 | | | 400,421 | | | 132,903 | | | 174,081 | | Reconciling items: | | | | | | | | | | | | | | | | | Removal of results of unconsolidated entities— | | | | | | | | | | | | | | | | | Great Park Venture (1) | (139,372) | | | (360,596) | | | (44,932) | | | (168,157) | | | (232,081) | | | (369,196) | | | (98,061) | | | (170,900) | | | Gateway Commercial Venture (1) | (2,224) | | | (2,021) | | | 290 | | | 606 | | | (4,773) | | | (4,175) | | | 406 | | | 889 | | | Add equity in earnings (losses) from unconsolidated entities— | | | | | | | | | | | | | | | | | Great Park Venture | — | | | — | | | 15,473 | | | 52,322 | | | — | | | — | | | 33,130 | | | 53,484 | | | Gateway Commercial Venture | — | | | — | | | (218) | | | (455) | | | — | | | — | | | (305) | | | (667) | | Corporate and unallocated (2) | — | | | — | | | (11,501) | | | (6,981) | | | — | | | — | | | (23,763) | | | (16,066) | | Total consolidated balances | $ | 51,192 | | | $ | 21,349 | | | $ | 38,227 | | | $ | 50,555 | | | $ | 61,127 | | | $ | 27,050 | | | $ | 44,310 | | | $ | 40,821 | |
(1) Represents the removal of the Great Park Venture and Gateway Commercial Venture operating results, which are included in the Great Park segment and Commercial segment operating results at 100% of each venture’s historical basis, respectively, but are not included in the Company’s consolidated results and balances as the Company accounts for its investment in each venture using the equity method of accounting. (2) Corporate and unallocated activity is primarily comprised of corporate general and administrative expenses, deferred tax provision and Senior Notes exchange costs. Segment assets and reconciliations to the Company’s consolidated balances are as follows (in thousands): | | | | | | | | | | | | | June 30, 2024 | | December 31, 2023 | Valencia | $ | 942,548 | | | $ | 895,983 | | San Francisco | 1,389,951 | | | 1,360,036 | | Great Park | 763,854 | | | 710,665 | | Commercial | 85,000 | | | 85,847 | | | Total reportable segments | 3,181,353 | | | 3,052,531 | | Reconciling items: | | | | Removal of unconsolidated balances of Great Park Venture (1) | (645,415) | | | (619,199) | | Removal of unconsolidated balances of Gateway Commercial Venture (1) | (85,000) | | | (85,847) | | Other eliminations (2) | (547) | | | (174) | | Add investment balance in Great Park Venture | 199,610 | | | 213,786 | | Add investment balance in Gateway Commercial Venture | 37,476 | | | 37,781 | | Corporate and unallocated (3) | 232,662 | | | 370,410 | | Total consolidated balances | $ | 2,920,139 | | | $ | 2,969,288 | |
(1) Represents the removal of the Great Park Venture and Gateway Commercial Venture balances, which are included in the Great Park segment and Commercial segment balances at 100% of each venture’s historical basis, respectively, but are not included in the Company’s consolidated balances as the Company accounts for its investment in each venture using the equity method of accounting. (2) Represents intersegment balances that eliminate in consolidation. (3) Corporate and unallocated assets consist of cash and cash equivalents, receivables, right-of-use assets and prepaid expenses.
|
| X |
- DefinitionTabular disclosure of the profit or loss and total assets for each reportable segment. An entity discloses certain information on each reportable segment if the amounts (a) are included in the measure of segment profit or loss reviewed by the chief operating decision maker or (b) are otherwise regularly provided to the chief operating decision maker, even if not included in that measure of segment profit or loss. Reference 1: http://fasb.org/us-gaap/role/ref/legacyRef
-Name Accounting Standards Codification
-Topic 280
-SubTopic 10
-Section 50
-Paragraph 25
-Publisher FASB
-URI https://asc.fasb.org/1943274/2147482810/280-10-50-25
Reference 2: http://fasb.org/us-gaap/role/ref/legacyRef
-Name Accounting Standards Codification
-Topic 280
-SubTopic 10
-Section 50
-Paragraph 22
-Publisher FASB
-URI https://asc.fasb.org/1943274/2147482810/280-10-50-22
Reference 3: http://fasb.org/us-gaap/role/ref/legacyRef
-Name Accounting Standards Codification
-Topic 280
-SubTopic 10
-Section 50
-Paragraph 30
-Publisher FASB
-URI https://asc.fasb.org/1943274/2147482810/280-10-50-30
| Name: |
us-gaap_ScheduleOfSegmentReportingInformationBySegmentTextBlock |
| Namespace Prefix: |
us-gaap_ |
| Data Type: |
dtr-types:textBlockItemType |
| Balance Type: |
na |
| Period Type: |
duration |
|
| X |
- References
+ Details
| Name: |
us-gaap_SegmentReportingAbstract |
| Namespace Prefix: |
us-gaap_ |
| Data Type: |
xbrli:stringItemType |
| Balance Type: |
na |
| Period Type: |
duration |
|
v3.24.2
| X |
- DefinitionDisclosure of the number and weighted-average grant date fair value for restricted stock and restricted stock units that were outstanding at the beginning and end of the year, and the number of restricted stock and restricted stock units that were granted, vested, or forfeited during the year.
| Name: |
us-gaap_ScheduleOfSharebasedCompensationRestrictedStockAndRestrictedStockUnitsActivityTableTextBlock |
| Namespace Prefix: |
us-gaap_ |
| Data Type: |
dtr-types:textBlockItemType |
| Balance Type: |
na |
| Period Type: |
duration |
|
v3.24.2
Employee Benefit Plans (Tables)
|
6 Months Ended |
Jun. 30, 2024 |
|---|
| Retirement Benefits [Abstract] |
|
| Schedule of Net Benefit Costs |
The components of net periodic (benefit) cost for the three and six months ended June 30, 2024 and 2023, are as follows (in thousands): | | | | | | | | | | | | | | | | | | | | | | | | | Three Months Ended June 30, | | Six Months Ended June 30, | | 2024 | | 2023 | | 2024 | | 2023 | | Net periodic (benefit) cost: | | | | | | | | Interest cost | $ | 193 | | | $ | 202 | | | $ | 384 | | | $ | 404 | | Expected return on plan assets | (229) | | | (222) | | | (458) | | | (444) | | Amortization of net actuarial loss | 13 | | | 40 | | | 27 | | | 81 | | | Net periodic (benefit) cost | $ | (23) | | | $ | 20 | | | $ | (47) | | | $ | 41 | |
|
| X |
- References
+ Details
| Name: |
us-gaap_CompensationAndRetirementDisclosureAbstract |
| Namespace Prefix: |
us-gaap_ |
| Data Type: |
xbrli:stringItemType |
| Balance Type: |
na |
| Period Type: |
duration |
|
| X |
- DefinitionTabular disclosure of the components of net benefit costs for pension plans and/or other employee benefit plans including service cost, interest cost, expected return on plan assets, gain (loss), prior service cost or credit, transition asset or obligation, and gain (loss) recognized due to settlements or curtailments. Reference 1: http://fasb.org/us-gaap/role/ref/legacyRef
-Topic 715
-SubTopic 20
-Subparagraph (h)
-Name Accounting Standards Codification
-Paragraph 1
-Section 50
-Publisher FASB
-URI https://asc.fasb.org/1943274/2147480506/715-20-50-1
| Name: |
us-gaap_ScheduleOfNetBenefitCostsTableTextBlock |
| Namespace Prefix: |
us-gaap_ |
| Data Type: |
dtr-types:textBlockItemType |
| Balance Type: |
na |
| Period Type: |
duration |
|
v3.24.2
Earnings Per Share (Tables)
|
6 Months Ended |
Jun. 30, 2024 |
|---|
| Earnings Per Share [Abstract] |
|
| Schedule of Basic and Diluted Earnings Per Share |
The following table summarizes the basic and diluted earnings per share calculations for the three and six months ended June 30, 2024 and 2023 (in thousands, except shares and per share amounts): | | | | | | | | | | | | | | | | | | | | | | | | | Three Months Ended June 30, | | Six Months Ended June 30, | | 2024 | | 2023 | | 2024 | | 2023 | Numerator: | | | | | | | | | Net income attributable to the Company | $ | 14,722 | | | $ | 23,571 | | | $ | 17,048 | | | $ | 19,035 | | | Adjustments to net income attributable to the Company | — | | | — | | | (9) | | | (13) | | | Net income attributable to common shareholders | $ | 14,722 | | | $ | 23,571 | | | $ | 17,039 | | | $ | 19,022 | | Numerator—basic common shares: | | | | | | | | | Net income attributable to common shareholders | $ | 14,722 | | | $ | 23,571 | | | $ | 17,039 | | | $ | 19,022 | | Less: net income allocated to participating securities | 25 | | | 132 | | | 26 | | | 100 | | | Allocation of basic net income among common shareholders | $ | 14,697 | | | $ | 23,439 | | | $ | 17,013 | | | $ | 18,922 | | | Numerator for basic net income available to Class A common shareholders | $ | 14,692 | | | $ | 23,431 | | | $ | 17,007 | | | $ | 18,915 | | | Numerator for basic net income available to Class B common shareholders | $ | 5 | | | $ | 8 | | | $ | 6 | | | $ | 7 | | Numerator—diluted common shares: | | | | | | | | | Net income attributable to common shareholders | $ | 14,722 | | | $ | 23,571 | | | $ | 17,039 | | | $ | 19,022 | | | Reallocation of income from dilutive potential securities | 15,992 | | | 25,878 | | | 18,512 | | | 20,917 | | Less: net income allocated to participating securities | 25 | | | 132 | | | 26 | | | 100 | | | Allocation of diluted net income among common shareholders | $ | 30,689 | | | $ | 49,317 | | | $ | 35,525 | | | $ | 39,839 | | | Numerator for diluted net income available to Class A common shareholders | $ | 30,684 | | | $ | 49,309 | | | $ | 35,519 | | | $ | 39,832 | | | Numerator for diluted net income available to Class B common shareholders | $ | 5 | | | $ | 8 | | | $ | 6 | | | $ | 7 | | Denominator: | | | | | | | | | Basic weighted average Class A common shares outstanding | 69,239,296 | | | 68,811,975 | | | 69,148,940 | | | 68,758,894 | | Diluted weighted average Class A common shares outstanding | 145,936,206 | | | 145,040,689 | | | 145,906,521 | | | 144,939,450 | | | Basic and diluted weighted average Class B common shares outstanding | 79,233,544 | | | 79,233,544 | | | 79,233,544 | | | 79,233,544 | | | | | | | | | | | Basic earnings per share: | | | | | | | | Class A common shares | $ | 0.21 | | | $ | 0.34 | | | $ | 0.25 | | | $ | 0.28 | | Class B common shares | $ | 0.00 | | | $ | 0.00 | | | $ | 0.00 | | | $ | 0.00 | | | Diluted earnings per share: | | | | | | | | Class A common shares | $ | 0.21 | | | $ | 0.34 | | | $ | 0.24 | | | $ | 0.27 | | Class B common shares | $ | 0.00 | | | $ | 0.00 | | | $ | 0.00 | | | $ | 0.00 | | | | | | | | | | Anti-dilutive potential RSUs | — | | | — | | | — | | | — | | Anti-dilutive potential Performance RSUs | 4,509,646 | | | 3,123,408 | | | 4,509,646 | | | 3,123,408 | | Anti-dilutive potential Restricted Shares (weighted average) | — | | | — | | | — | | | — | | | | | | | | | | | Anti-dilutive potential Class A common shares from exchanges (weighted average) | 3,137,134 | | | 3,137,134 | | | 3,137,134 | | | 3,137,134 | | | | | | | | | |
|
| X |
- References
+ Details
| Name: |
us-gaap_EarningsPerShareAbstract |
| Namespace Prefix: |
us-gaap_ |
| Data Type: |
xbrli:stringItemType |
| Balance Type: |
na |
| Period Type: |
duration |
|
| X |
- DefinitionTabular disclosure of an entity's basic and diluted earnings per share calculations, including a reconciliation of numerators and denominators of the basic and diluted per-share computations for income from continuing operations. Reference 1: http://www.xbrl.org/2009/role/commonPracticeRef
-Topic 260
-SubTopic 10
-Name Accounting Standards Codification
-Section 50
-Paragraph 1
-Subparagraph (a)
-Publisher FASB
-URI https://asc.fasb.org/1943274/2147482662/260-10-50-1
| Name: |
us-gaap_ScheduleOfEarningsPerShareBasicAndDilutedTableTextBlock |
| Namespace Prefix: |
us-gaap_ |
| Data Type: |
dtr-types:textBlockItemType |
| Balance Type: |
na |
| Period Type: |
duration |
|
v3.24.2
Business and Organization (Details)
$ / shares in Units, $ in Thousands |
6 Months Ended |
|
|
|
Jun. 30, 2024
USD ($)
vote
member
|
Jul. 12, 2024
USD ($)
$ / shares
|
Dec. 31, 2023
USD ($)
|
| Class of Stock [Line Items] |
|
|
|
| Number of votes per share | vote |
1
|
|
|
| Right to exchange, conversion ratio |
1
|
|
|
| Other |
$ 74,173
|
|
$ 78,074
|
| Number of voting members | member |
3
|
|
|
| Number of votes of management | vote |
5
|
|
|
| Percentage of voting members required for approval |
75.00%
|
|
|
| Number of votes of company | vote |
2
|
|
|
| Number of votes for each member | vote |
1
|
|
|
| Great Park |
|
|
|
| Class of Stock [Line Items] |
|
|
|
| Percentage of equity ownership |
37.50%
|
|
|
| Number of voting members | member |
4
|
|
|
| Heritage Fields LLC |
|
|
|
| Class of Stock [Line Items] |
|
|
|
| Percentage of equity ownership |
37.50%
|
|
|
| Subsequent Event |
|
|
|
| Class of Stock [Line Items] |
|
|
|
| Closing price (in dollars per share) | $ / shares |
|
$ 2.99
|
|
| The San Francisco Venture |
|
|
|
| Class of Stock [Line Items] |
|
|
|
| Right to exchange, conversion ratio |
1
|
|
|
| Five Point Office Venture Holdings I, LLC Acquisition | FPOVHI Member, LLC |
|
|
|
| Class of Stock [Line Items] |
|
|
|
| Percentage of equity ownership |
75.00%
|
|
|
| Related Party |
|
|
|
| Class of Stock [Line Items] |
|
|
|
| Other |
$ 74,173
|
|
$ 78,074
|
| Equity Method Investee |
|
|
|
| Class of Stock [Line Items] |
|
|
|
| Distributions to holders of legacy interests |
1,500
|
|
|
| Equity Method Investee | Great Park | Contingent Payments Due from Related Parties |
|
|
|
| Class of Stock [Line Items] |
|
|
|
| Other |
$ 565,000
|
|
|
| Equity Method Investee | Subsequent Event | Great Park | Legacy Incentive Compensation Receivable |
|
|
|
| Class of Stock [Line Items] |
|
|
|
| Distributions to holders of legacy interests |
|
$ 561,700
|
|
| Five Point Operating Company, LLC | Related Party | The San Francisco Venture |
|
|
|
| Class of Stock [Line Items] |
|
|
|
| Right to exchange, conversion ratio |
1
|
|
|
| Percentage of distributions entitled to receive |
99.00%
|
|
|
| Five Point Land, LLC | Subsidiary of Common Parent |
|
|
|
| Class of Stock [Line Items] |
|
|
|
| Subsidiary ownership (as percent) |
100.00%
|
|
|
| FPOVHI Member, LLC | Five Point Office Venture Holdings I, LLC Acquisition |
|
|
|
| Class of Stock [Line Items] |
|
|
|
| Percentage of equity ownership |
75.00%
|
|
|
| San Francisco Venture | Subsidiary of Common Parent |
|
|
|
| Class of Stock [Line Items] |
|
|
|
| Subsidiary ownership (as percent) |
100.00%
|
|
|
| Parent Company | Five Point Operating Company, LLC | Related Party |
|
|
|
| Class of Stock [Line Items] |
|
|
|
| Right to exchange, conversion ratio |
1
|
|
|
| Parent Company | Five Point Operating Company, LLC | Related Party | Five Point Operating Company, LLC |
|
|
|
| Class of Stock [Line Items] |
|
|
|
| Ownership of class A common stock, percentage |
62.60%
|
|
|
| Parent Company | Five Point Operating Company, LLC | Related Party | Subsequent Event |
|
|
|
| Class of Stock [Line Items] |
|
|
|
| Market capitalization of company |
|
$ 444,400
|
|
| Common Class B |
|
|
|
| Class of Stock [Line Items] |
|
|
|
| Conversion of common shares, ratio |
0.0003
|
|
|
| X |
- DefinitionBusiness Acquisition, Right of Distributions, Percentage
| Name: |
fph_BusinessAcquisitionRightofDistributionsPercentage |
| Namespace Prefix: |
fph_ |
| Data Type: |
dtr-types1:percentItemType |
| Balance Type: |
na |
| Period Type: |
instant |
|
| X |
- DefinitionCommon Stock, Number of Votes for Each Share Owned
| Name: |
fph_CommonStockNumberofVotesforEachShareOwned |
| Namespace Prefix: |
fph_ |
| Data Type: |
xbrli:integerItemType |
| Balance Type: |
na |
| Period Type: |
duration |
|
| X |
- DefinitionRelated Party Transaction, Distributions
| Name: |
fph_DistributionMadetoLimitedLiabilityCompanyLLCMemberCashDistributionsPaidAggregate |
| Namespace Prefix: |
fph_ |
| Data Type: |
xbrli:monetaryItemType |
| Balance Type: |
credit |
| Period Type: |
instant |
|
| X |
- DefinitionMarket Capitalization, Amount
| Name: |
fph_MarketCapitalizationAmount |
| Namespace Prefix: |
fph_ |
| Data Type: |
xbrli:monetaryItemType |
| Balance Type: |
credit |
| Period Type: |
instant |
|
| X |
- DefinitionNoncontrolling Interest, Stockholders Right to Exchange, Conversion Ratio
| Name: |
fph_NoncontrollingInterestStockholdersRighttoExchangeConversionRatio |
| Namespace Prefix: |
fph_ |
| Data Type: |
xbrli:pureItemType |
| Balance Type: |
na |
| Period Type: |
duration |
|
| X |
- DefinitionNumber of Votes, Each Member of Company
| Name: |
fph_NumberofVotesEachMemberofCompany |
| Namespace Prefix: |
fph_ |
| Data Type: |
xbrli:integerItemType |
| Balance Type: |
na |
| Period Type: |
instant |
|
| X |
- DefinitionNumber of Votes, Management
| Name: |
fph_NumberofVotesManagement |
| Namespace Prefix: |
fph_ |
| Data Type: |
xbrli:integerItemType |
| Balance Type: |
na |
| Period Type: |
instant |
|
| X |
- DefinitionPercentage of Voting Members Required For Approval
| Name: |
fph_PercentageofVotingMembersRequiredForApproval |
| Namespace Prefix: |
fph_ |
| Data Type: |
dtr-types1:percentItemType |
| Balance Type: |
na |
| Period Type: |
instant |
|
| X |
- DefinitionStock Distributions, Percentage Of Distribution To Other Shares
| Name: |
fph_StockDistributionsPercentageOfDistributionToOtherShares |
| Namespace Prefix: |
fph_ |
| Data Type: |
xbrli:pureItemType |
| Balance Type: |
na |
| Period Type: |
duration |
|
| X |
- DefinitionSubsidiary, Percentage Ownership
| Name: |
fph_SubsidiaryPercentageOwnership |
| Namespace Prefix: |
fph_ |
| Data Type: |
dtr-types1:percentItemType |
| Balance Type: |
na |
| Period Type: |
duration |
|
| X |
- DefinitionPercentage of voting equity interests acquired at the acquisition date in the business combination. Reference 1: http://fasb.org/us-gaap/role/ref/legacyRef
-Name Accounting Standards Codification
-Topic 805
-SubTopic 10
-Section 50
-Paragraph 2
-Subparagraph (c)
-Publisher FASB
-URI https://asc.fasb.org/1943274/2147479328/805-10-50-2
| Name: |
us-gaap_BusinessAcquisitionPercentageOfVotingInterestsAcquired |
| Namespace Prefix: |
us-gaap_ |
| Data Type: |
dtr-types:percentItemType |
| Balance Type: |
na |
| Period Type: |
instant |
|
| X |
- DefinitionLine items represent financial concepts included in a table. These concepts are used to disclose reportable information associated with domain members defined in one or many axes to the table. Reference 1: http://www.xbrl.org/2003/role/exampleRef
-Topic 505
-SubTopic 10
-Name Accounting Standards Codification
-Section 50
-Paragraph 13
-Subparagraph (d)
-Publisher FASB
-URI https://asc.fasb.org/1943274/2147481112/505-10-50-13
Reference 2: http://www.xbrl.org/2003/role/recommendedDisclosureRef
-Topic 272
-SubTopic 10
-Name Accounting Standards Codification
-Section 45
-Paragraph 3
-Publisher FASB
-URI https://asc.fasb.org/1943274/2147483014/272-10-45-3
Reference 3: http://www.xbrl.org/2003/role/disclosureRef
-Topic 272
-SubTopic 10
-Name Accounting Standards Codification
-Section 50
-Paragraph 1
-Publisher FASB
-URI https://asc.fasb.org/1943274/2147482987/272-10-50-1
Reference 4: http://www.xbrl.org/2009/role/commonPracticeRef
-Topic 235
-SubTopic 10
-Name Accounting Standards Codification
-Section S99
-Paragraph 1
-Subparagraph (SX 210.4-08(d))
-Publisher FASB
-URI https://asc.fasb.org/1943274/2147480678/235-10-S99-1
Reference 5: http://www.xbrl.org/2003/role/disclosureRef
-Topic 505
-SubTopic 10
-Name Accounting Standards Codification
-Section 50
-Paragraph 13
-Subparagraph (a)
-Publisher FASB
-URI https://asc.fasb.org/1943274/2147481112/505-10-50-13
Reference 6: http://www.xbrl.org/2003/role/disclosureRef
-Topic 505
-SubTopic 10
-Name Accounting Standards Codification
-Section 50
-Paragraph 13
-Subparagraph (b)
-Publisher FASB
-URI https://asc.fasb.org/1943274/2147481112/505-10-50-13
Reference 7: http://www.xbrl.org/2003/role/disclosureRef
-Topic 505
-SubTopic 10
-Name Accounting Standards Codification
-Section 50
-Paragraph 13
-Subparagraph (e)
-Publisher FASB
-URI https://asc.fasb.org/1943274/2147481112/505-10-50-13
Reference 8: http://www.xbrl.org/2003/role/disclosureRef
-Topic 505
-SubTopic 10
-Name Accounting Standards Codification
-Section 50
-Paragraph 13
-Subparagraph (h)
-Publisher FASB
-URI https://asc.fasb.org/1943274/2147481112/505-10-50-13
Reference 9: http://www.xbrl.org/2003/role/disclosureRef
-Topic 505
-SubTopic 10
-Name Accounting Standards Codification
-Section 50
-Paragraph 14
-Subparagraph (b)
-Publisher FASB
-URI https://asc.fasb.org/1943274/2147481112/505-10-50-14
Reference 10: http://www.xbrl.org/2003/role/disclosureRef
-Topic 505
-SubTopic 10
-Name Accounting Standards Codification
-Section 50
-Paragraph 18
-Subparagraph (c)
-Publisher FASB
-URI https://asc.fasb.org/1943274/2147481112/505-10-50-18
Reference 11: http://www.xbrl.org/2003/role/disclosureRef
-Topic 210
-SubTopic 10
-Name Accounting Standards Codification
-Section S99
-Paragraph 1
-Subparagraph (SX 210.5-02(27)(b))
-Publisher FASB
-URI https://asc.fasb.org/1943274/2147480566/210-10-S99-1
Reference 12: http://www.xbrl.org/2003/role/disclosureRef
-Topic 210
-SubTopic 10
-Name Accounting Standards Codification
-Section S99
-Paragraph 1
-Subparagraph (SX 210.5-02(28))
-Publisher FASB
-URI https://asc.fasb.org/1943274/2147480566/210-10-S99-1
Reference 13: http://www.xbrl.org/2003/role/disclosureRef
-Topic 505
-SubTopic 10
-Name Accounting Standards Codification
-Section 50
-Paragraph 2
-Publisher FASB
-URI https://asc.fasb.org/1943274/2147481112/505-10-50-2
Reference 14: http://www.xbrl.org/2003/role/disclosureRef
-Topic 210
-SubTopic 10
-Name Accounting Standards Codification
-Section S99
-Paragraph 1
-Subparagraph (SX 210.5-02(29))
-Publisher FASB
-URI https://asc.fasb.org/1943274/2147480566/210-10-S99-1
Reference 15: http://www.xbrl.org/2003/role/disclosureRef
-Topic 946
-SubTopic 10
-Name Accounting Standards Codification
-Section S99
-Paragraph 3
-Subparagraph (SX 210.6-03(i)(2))
-Publisher FASB
-URI https://asc.fasb.org/1943274/2147479886/946-10-S99-3
Reference 16: http://www.xbrl.org/2003/role/disclosureRef
-Topic 946
-SubTopic 10
-Name Accounting Standards Codification
-Section S99
-Paragraph 3
-Subparagraph (SX 210.6-03(i)(1))
-Publisher FASB
-URI https://asc.fasb.org/1943274/2147479886/946-10-S99-3
Reference 17: http://www.xbrl.org/2003/role/disclosureRef
-Topic 946
-SubTopic 10
-Name Accounting Standards Codification
-Section S99
-Paragraph 3
-Subparagraph (SX 210.6-03(i)(2)(i))
-Publisher FASB
-URI https://asc.fasb.org/1943274/2147479886/946-10-S99-3
Reference 18: http://www.xbrl.org/2003/role/disclosureRef
-Topic 946
-SubTopic 10
-Name Accounting Standards Codification
-Section S99
-Paragraph 3
-Subparagraph (SX 210.6-03(i)(2)(ii))
-Publisher FASB
-URI https://asc.fasb.org/1943274/2147479886/946-10-S99-3
| Name: |
us-gaap_ClassOfStockLineItems |
| Namespace Prefix: |
us-gaap_ |
| Data Type: |
xbrli:stringItemType |
| Balance Type: |
na |
| Period Type: |
duration |
|
| X |
- DefinitionThe percentage of ownership of common stock or equity participation in the investee accounted for under the equity method of accounting. Reference 1: http://www.xbrl.org/2003/role/disclosureRef
-Topic 323
-SubTopic 10
-Name Accounting Standards Codification
-Section 50
-Paragraph 3
-Subparagraph (a)(1)
-Publisher FASB
-URI https://asc.fasb.org/1943274/2147481687/323-10-50-3
| Name: |
us-gaap_EquityMethodInvestmentOwnershipPercentage |
| Namespace Prefix: |
us-gaap_ |
| Data Type: |
dtr-types:percentItemType |
| Balance Type: |
na |
| Period Type: |
instant |
|
| X |
- DefinitionPercentage investment held by members or limited partners of limited liability company (LLC) or limited partnership (LP). Reference 1: http://fasb.org/us-gaap/role/ref/legacyRef
-Name Accounting Standards Codification
-Topic 272
-SubTopic 10
-Section 50
-Paragraph 3
-Subparagraph (b)
-Publisher FASB
-URI https://asc.fasb.org/1943274/2147482987/272-10-50-3
| Name: |
us-gaap_LimitedLiabilityCompanyLLCOrLimitedPartnershipLPMembersOrLimitedPartnersOwnershipInterest |
| Namespace Prefix: |
us-gaap_ |
| Data Type: |
dtr-types:percentItemType |
| Balance Type: |
na |
| Period Type: |
duration |
|
| X |
- DefinitionAmount of liabilities classified as other. Reference 1: http://fasb.org/us-gaap/role/ref/legacyRef
-Topic 942
-SubTopic 210
-Name Accounting Standards Codification
-Section S99
-Paragraph 1
-Subparagraph (SX 210.9-03(15))
-Publisher FASB
-URI https://asc.fasb.org/1943274/2147478546/942-210-S99-1
Reference 2: http://www.xbrl.org/2003/role/disclosureRef
-Topic 944
-SubTopic 210
-Name Accounting Standards Codification
-Section S99
-Paragraph 1
-Subparagraph (SX 210.7-03(a)(15))
-Publisher FASB
-URI https://asc.fasb.org/1943274/2147478777/944-210-S99-1
Reference 3: http://www.xbrl.org/2003/role/exampleRef
-Topic 946
-SubTopic 830
-Name Accounting Standards Codification
-Section 55
-Paragraph 12
-Publisher FASB
-URI https://asc.fasb.org/1943274/2147479168/946-830-55-12
Reference 4: http://www.xbrl.org/2003/role/disclosureRef
-Topic 946
-SubTopic 210
-Name Accounting Standards Codification
-Section S99
-Paragraph 1
-Subparagraph (SX 210.6-04(12)(b)(2))
-Publisher FASB
-URI https://asc.fasb.org/1943274/2147479170/946-210-S99-1
Reference 5: http://www.xbrl.org/2003/role/disclosureRef
-Topic 946
-SubTopic 210
-Name Accounting Standards Codification
-Section S99
-Paragraph 1
-Subparagraph (SX 210.6-04(12)(b)(3))
-Publisher FASB
-URI https://asc.fasb.org/1943274/2147479170/946-210-S99-1
Reference 6: http://www.xbrl.org/2009/role/commonPracticeRef
-Topic 946
-SubTopic 210
-Name Accounting Standards Codification
-Section S99
-Paragraph 1
-Subparagraph (SX 210.6-04(12)(b)(1))
-Publisher FASB
-URI https://asc.fasb.org/1943274/2147479170/946-210-S99-1
Reference 7: http://www.xbrl.org/2009/role/commonPracticeRef
-Topic 944
-SubTopic 210
-Name Accounting Standards Codification
-Section S99
-Paragraph 1
-Subparagraph (SX 210.7-03(a)(17))
-Publisher FASB
-URI https://asc.fasb.org/1943274/2147478777/944-210-S99-1
| Name: |
us-gaap_OtherLiabilities |
| Namespace Prefix: |
us-gaap_ |
| Data Type: |
xbrli:monetaryItemType |
| Balance Type: |
credit |
| Period Type: |
instant |
|
| X |
- DefinitionPrice of a single share of a number of saleable stocks of a company.
| Name: |
us-gaap_SharePrice |
| Namespace Prefix: |
us-gaap_ |
| Data Type: |
dtr-types:perShareItemType |
| Balance Type: |
na |
| Period Type: |
instant |
|
| X |
- Details
| Name: |
srt_ScheduleOfEquityMethodInvestmentEquityMethodInvesteeNameAxis=fph_GreatParkVentureMember |
| Namespace Prefix: |
|
| Data Type: |
na |
| Balance Type: |
|
| Period Type: |
|
|
| X |
- Details
| Name: |
srt_ScheduleOfEquityMethodInvestmentEquityMethodInvesteeNameAxis=fph_HeritageFieldsLLCMember |
| Namespace Prefix: |
|
| Data Type: |
na |
| Balance Type: |
|
| Period Type: |
|
|
| X |
- Details
| Name: |
us-gaap_SubsequentEventTypeAxis=us-gaap_SubsequentEventMember |
| Namespace Prefix: |
|
| Data Type: |
na |
| Balance Type: |
|
| Period Type: |
|
|
| X |
- Details
| Name: |
us-gaap_BusinessAcquisitionAxis=fph_TheSanFranciscoVentureMember |
| Namespace Prefix: |
|
| Data Type: |
na |
| Balance Type: |
|
| Period Type: |
|
|
| X |
- Details
| Name: |
us-gaap_BusinessAcquisitionAxis=fph_FivePointOfficeVentureHoldingsILLCAcquisitionMember |
| Namespace Prefix: |
|
| Data Type: |
na |
| Balance Type: |
|
| Period Type: |
|
|
| X |
- Details
| Name: |
srt_ScheduleOfEquityMethodInvestmentEquityMethodInvesteeNameAxis=fph_FPOVHIMemberLLCMember |
| Namespace Prefix: |
|
| Data Type: |
na |
| Balance Type: |
|
| Period Type: |
|
|
| X |
- Details
| Name: |
dei_LegalEntityAxis=fph_FivePointOperatingCompanyLLCMember |
| Namespace Prefix: |
|
| Data Type: |
na |
| Balance Type: |
|
| Period Type: |
|
|
| X |
- Details
| Name: |
dei_LegalEntityAxis=fph_FivePointLandLLCMember |
| Namespace Prefix: |
|
| Data Type: |
na |
| Balance Type: |
|
| Period Type: |
|
|
| X |
- Details
| Name: |
dei_LegalEntityAxis=fph_FPOVHIMemberLLCMember |
| Namespace Prefix: |
|
| Data Type: |
na |
| Balance Type: |
|
| Period Type: |
|
|
| X |
- Details
| Name: |
dei_LegalEntityAxis=fph_SanFranciscoVentureMember |
| Namespace Prefix: |
|
| Data Type: |
na |
| Balance Type: |
|
| Period Type: |
|
|
| X |
- Details
| Name: |
srt_ConsolidatedEntitiesAxis=srt_ParentCompanyMember |
| Namespace Prefix: |
|
| Data Type: |
na |
| Balance Type: |
|
| Period Type: |
|
|
| X |
- Details
| Name: |
srt_OwnershipAxis=fph_FivePointOperatingCompanyLLCMember |
| Namespace Prefix: |
|
| Data Type: |
na |
| Balance Type: |
|
| Period Type: |
|
|
| X |
- Details
| Name: |
us-gaap_ConversionOfStockByUniqueDescriptionAxis=us-gaap_CommonClassBMember |
| Namespace Prefix: |
|
| Data Type: |
na |
| Balance Type: |
|
| Period Type: |
|
|
v3.24.2
| X |
- DefinitionDebt Instrument, Modification Costs
| Name: |
fph_DebtInstrumentModificationCosts |
| Namespace Prefix: |
fph_ |
| Data Type: |
xbrli:monetaryItemType |
| Balance Type: |
debit |
| Period Type: |
duration |
|
| X |
- DefinitionOther Nonoperating Income, Miscellaneous
| Name: |
fph_OtherNonoperatingIncomeMiscellaneous |
| Namespace Prefix: |
fph_ |
| Data Type: |
xbrli:monetaryItemType |
| Balance Type: |
credit |
| Period Type: |
duration |
|
| X |
- DefinitionFace (par) amount of debt instrument at time of issuance. Reference 1: http://www.xbrl.org/2003/role/exampleRef
-Topic 835
-SubTopic 30
-Name Accounting Standards Codification
-Section 55
-Paragraph 8
-Publisher FASB
-URI https://asc.fasb.org/1943274/2147482949/835-30-55-8
Reference 2: http://www.xbrl.org/2003/role/disclosureRef
-Topic 470
-SubTopic 20
-Name Accounting Standards Codification
-Section 50
-Paragraph 1B
-Subparagraph (a)
-Publisher FASB
-URI https://asc.fasb.org/1943274/2147481139/470-20-50-1B
Reference 3: http://www.xbrl.org/2003/role/exampleRef
-Topic 470
-SubTopic 20
-Name Accounting Standards Codification
-Section 55
-Paragraph 69B
-Publisher FASB
-URI https://asc.fasb.org/1943274/2147481568/470-20-55-69B
Reference 4: http://www.xbrl.org/2003/role/exampleRef
-Topic 470
-SubTopic 20
-Name Accounting Standards Codification
-Section 55
-Paragraph 69C
-Publisher FASB
-URI https://asc.fasb.org/1943274/2147481568/470-20-55-69C
Reference 5: http://www.xbrl.org/2003/role/disclosureRef
-Topic 835
-SubTopic 30
-Name Accounting Standards Codification
-Section 50
-Paragraph 1
-Publisher FASB
-URI https://asc.fasb.org/1943274/2147482900/835-30-50-1
Reference 6: http://www.xbrl.org/2003/role/disclosureRef
-Topic 835
-SubTopic 30
-Name Accounting Standards Codification
-Section 45
-Paragraph 2
-Publisher FASB
-URI https://asc.fasb.org/1943274/2147482925/835-30-45-2
| Name: |
us-gaap_DebtInstrumentFaceAmount |
| Namespace Prefix: |
us-gaap_ |
| Data Type: |
xbrli:monetaryItemType |
| Balance Type: |
credit |
| Period Type: |
instant |
|
| X |
- DefinitionContractual interest rate for funds borrowed, under the debt agreement. Reference 1: http://fasb.org/us-gaap/role/ref/legacyRef
-Topic 210
-SubTopic 10
-Name Accounting Standards Codification
-Section S99
-Paragraph 1
-Subparagraph (SX 210.5-02(22)(a)(1))
-Publisher FASB
-URI https://asc.fasb.org/1943274/2147480566/210-10-S99-1
Reference 2: http://www.xbrl.org/2003/role/disclosureRef
-Topic 470
-SubTopic 20
-Name Accounting Standards Codification
-Section 50
-Paragraph 1B
-Subparagraph (b)
-Publisher FASB
-URI https://asc.fasb.org/1943274/2147481139/470-20-50-1B
| Name: |
us-gaap_DebtInstrumentInterestRateStatedPercentage |
| Namespace Prefix: |
us-gaap_ |
| Data Type: |
dtr-types:percentItemType |
| Balance Type: |
na |
| Period Type: |
instant |
|
| X |
- DefinitionAmount of net periodic benefit cost (credit) for defined benefit plan. Reference 1: http://www.xbrl.org/2003/role/exampleRef
-Topic 715
-SubTopic 20
-Name Accounting Standards Codification
-Section 55
-Paragraph 17
-Publisher FASB
-URI https://asc.fasb.org/1943274/2147480482/715-20-55-17
Reference 2: http://www.xbrl.org/2003/role/exampleRef
-Topic 715
-SubTopic 20
-Name Accounting Standards Codification
-Section 55
-Paragraph 18
-Publisher FASB
-URI https://asc.fasb.org/1943274/2147480482/715-20-55-18
Reference 3: http://www.xbrl.org/2003/role/disclosureRef
-Topic 715
-SubTopic 20
-Name Accounting Standards Codification
-Section 50
-Paragraph 1
-Subparagraph (h)
-Publisher FASB
-URI https://asc.fasb.org/1943274/2147480506/715-20-50-1
Reference 4: http://www.xbrl.org/2003/role/disclosureRef
-Topic 715
-SubTopic 20
-Name Accounting Standards Codification
-Section 50
-Paragraph 6
-Subparagraph (a)
-Publisher FASB
-URI https://asc.fasb.org/1943274/2147480506/715-20-50-6
| Name: |
us-gaap_DefinedBenefitPlanNetPeriodicBenefitCost |
| Namespace Prefix: |
us-gaap_ |
| Data Type: |
xbrli:monetaryItemType |
| Balance Type: |
debit |
| Period Type: |
duration |
|
| X |
- DefinitionAmount of income (expense) related to nonoperating activities, classified as other. Reference 1: http://fasb.org/us-gaap/role/ref/legacyRef
-Topic 220
-SubTopic 10
-Name Accounting Standards Codification
-Section S99
-Paragraph 2
-Subparagraph (SX 210.5-03(9))
-Publisher FASB
-URI https://asc.fasb.org/1943274/2147483621/220-10-S99-2
| Name: |
us-gaap_OtherNonoperatingIncomeExpense |
| Namespace Prefix: |
us-gaap_ |
| Data Type: |
xbrli:monetaryItemType |
| Balance Type: |
credit |
| Period Type: |
duration |
|
| X |
- DefinitionLine items represent financial concepts included in a table. These concepts are used to disclose reportable information associated with domain members defined in one or many axes to the table. Reference 1: http://www.xbrl.org/2003/role/disclosureRef
-Topic 420
-SubTopic 10
-Name Accounting Standards Codification
-Section S99
-Paragraph 2
-Subparagraph (SAB Topic 5.P.4.d)
-Publisher FASB
-URI https://asc.fasb.org/1943274/2147479823/420-10-S99-2
Reference 2: http://www.xbrl.org/2003/role/disclosureRef
-Topic 420
-SubTopic 10
-Name Accounting Standards Codification
-Section S99
-Paragraph 2
-Subparagraph (SAB Topic 5.P.4.b.1)
-Publisher FASB
-URI https://asc.fasb.org/1943274/2147479823/420-10-S99-2
Reference 3: http://www.xbrl.org/2003/role/disclosureRef
-Topic 420
-SubTopic 10
-Name Accounting Standards Codification
-Section S99
-Paragraph 2
-Subparagraph (SAB Topic 5.P.4.b.2)
-Publisher FASB
-URI https://asc.fasb.org/1943274/2147479823/420-10-S99-2
Reference 4: http://www.xbrl.org/2003/role/disclosureRef
-Topic 420
-SubTopic 10
-Name Accounting Standards Codification
-Section 50
-Paragraph 1
-Subparagraph (c)
-Publisher FASB
-URI https://asc.fasb.org/1943274/2147482017/420-10-50-1
Reference 5: http://www.xbrl.org/2003/role/disclosureRef
-Topic 420
-SubTopic 10
-Name Accounting Standards Codification
-Section 50
-Paragraph 1
-Subparagraph (b)(2)
-Publisher FASB
-URI https://asc.fasb.org/1943274/2147482017/420-10-50-1
Reference 6: http://www.xbrl.org/2003/role/disclosureRef
-Topic 420
-SubTopic 10
-Name Accounting Standards Codification
-Section 50
-Paragraph 1
-Subparagraph (b)(1)
-Publisher FASB
-URI https://asc.fasb.org/1943274/2147482017/420-10-50-1
Reference 7: http://www.xbrl.org/2003/role/disclosureRef
-Topic 420
-SubTopic 10
-Name Accounting Standards Codification
-Section 50
-Paragraph 1
-Subparagraph (d)
-Publisher FASB
-URI https://asc.fasb.org/1943274/2147482017/420-10-50-1
| Name: |
us-gaap_RestructuringCostAndReserveLineItems |
| Namespace Prefix: |
us-gaap_ |
| Data Type: |
xbrli:stringItemType |
| Balance Type: |
na |
| Period Type: |
duration |
|
| X |
- Details
| Name: |
us-gaap_DebtInstrumentAxis=fph_SeniorNotesDue20257.875Member |
| Namespace Prefix: |
|
| Data Type: |
na |
| Balance Type: |
|
| Period Type: |
|
|
| X |
- Details
| Name: |
us-gaap_LongtermDebtTypeAxis=us-gaap_SeniorNotesMember |
| Namespace Prefix: |
|
| Data Type: |
na |
| Balance Type: |
|
| Period Type: |
|
|
v3.24.2
Revenues - Disaggregation of Revenue (Details) - USD ($)
$ in Thousands |
3 Months Ended |
6 Months Ended |
Jun. 30, 2024 |
Jun. 30, 2023 |
Jun. 30, 2024 |
Jun. 30, 2023 |
| Disaggregation of Revenue [Line Items] |
|
|
|
|
| Revenue from customers |
$ 50,757
|
$ 20,902
|
$ 60,090
|
$ 26,095
|
| Revenues |
51,192
|
21,349
|
61,127
|
27,050
|
| Land sales |
|
|
|
|
| Disaggregation of Revenue [Line Items] |
|
|
|
|
| Revenue from customers |
310
|
(13)
|
842
|
586
|
| Management services |
|
|
|
|
| Disaggregation of Revenue [Line Items] |
|
|
|
|
| Revenue from customers |
50,279
|
20,774
|
59,005
|
25,010
|
| Operating properties |
|
|
|
|
| Disaggregation of Revenue [Line Items] |
|
|
|
|
| Revenue from customers |
168
|
141
|
243
|
499
|
| Operating properties leasing revenues |
435
|
447
|
1,037
|
955
|
| Valencia |
|
|
|
|
| Disaggregation of Revenue [Line Items] |
|
|
|
|
| Revenue from customers |
478
|
128
|
1,085
|
1,085
|
| Revenues |
745
|
413
|
1,786
|
1,716
|
| Valencia | Land sales |
|
|
|
|
| Disaggregation of Revenue [Line Items] |
|
|
|
|
| Revenue from customers |
310
|
(13)
|
842
|
586
|
| Valencia | Management services |
|
|
|
|
| Disaggregation of Revenue [Line Items] |
|
|
|
|
| Revenue from customers |
0
|
0
|
0
|
0
|
| Valencia | Operating properties |
|
|
|
|
| Disaggregation of Revenue [Line Items] |
|
|
|
|
| Revenue from customers |
168
|
141
|
243
|
499
|
| Operating properties leasing revenues |
267
|
285
|
701
|
631
|
| San Francisco |
|
|
|
|
| Disaggregation of Revenue [Line Items] |
|
|
|
|
| Revenue from customers |
0
|
0
|
0
|
0
|
| Revenues |
168
|
162
|
336
|
324
|
| San Francisco | Land sales |
|
|
|
|
| Disaggregation of Revenue [Line Items] |
|
|
|
|
| Revenue from customers |
0
|
0
|
0
|
0
|
| San Francisco | Management services |
|
|
|
|
| Disaggregation of Revenue [Line Items] |
|
|
|
|
| Revenue from customers |
0
|
0
|
0
|
0
|
| San Francisco | Operating properties |
|
|
|
|
| Disaggregation of Revenue [Line Items] |
|
|
|
|
| Revenue from customers |
0
|
0
|
0
|
0
|
| Operating properties leasing revenues |
168
|
162
|
336
|
324
|
| Great Park |
|
|
|
|
| Disaggregation of Revenue [Line Items] |
|
|
|
|
| Revenue from customers |
50,151
|
20,670
|
58,764
|
24,799
|
| Revenues |
50,151
|
20,670
|
58,764
|
24,799
|
| Great Park | Land sales |
|
|
|
|
| Disaggregation of Revenue [Line Items] |
|
|
|
|
| Revenue from customers |
0
|
0
|
0
|
0
|
| Great Park | Management services |
|
|
|
|
| Disaggregation of Revenue [Line Items] |
|
|
|
|
| Revenue from customers |
50,151
|
20,670
|
58,764
|
24,799
|
| Great Park | Operating properties |
|
|
|
|
| Disaggregation of Revenue [Line Items] |
|
|
|
|
| Revenue from customers |
0
|
0
|
0
|
0
|
| Operating properties leasing revenues |
0
|
0
|
0
|
0
|
| Commercial |
|
|
|
|
| Disaggregation of Revenue [Line Items] |
|
|
|
|
| Revenue from customers |
128
|
104
|
241
|
211
|
| Revenues |
128
|
104
|
241
|
211
|
| Commercial | Land sales |
|
|
|
|
| Disaggregation of Revenue [Line Items] |
|
|
|
|
| Revenue from customers |
0
|
0
|
0
|
0
|
| Commercial | Management services |
|
|
|
|
| Disaggregation of Revenue [Line Items] |
|
|
|
|
| Revenue from customers |
128
|
104
|
241
|
211
|
| Commercial | Operating properties |
|
|
|
|
| Disaggregation of Revenue [Line Items] |
|
|
|
|
| Revenue from customers |
0
|
0
|
0
|
0
|
| Operating properties leasing revenues |
$ 0
|
$ 0
|
$ 0
|
$ 0
|
| X |
- DefinitionLine items represent financial concepts included in a table. These concepts are used to disclose reportable information associated with domain members defined in one or many axes to the table. Reference 1: http://www.xbrl.org/2003/role/disclosureRef
-Topic 606
-SubTopic 10
-Name Accounting Standards Codification
-Section 50
-Paragraph 5
-Publisher FASB
-URI https://asc.fasb.org/1943274/2147479806/606-10-50-5
Reference 2: http://www.xbrl.org/2003/role/exampleRef
-Topic 606
-SubTopic 10
-Name Accounting Standards Codification
-Section 55
-Paragraph 91
-Subparagraph (a)
-Publisher FASB
-URI https://asc.fasb.org/1943274/2147479777/606-10-55-91
Reference 3: http://www.xbrl.org/2003/role/exampleRef
-Topic 606
-SubTopic 10
-Name Accounting Standards Codification
-Section 55
-Paragraph 91
-Subparagraph (b)
-Publisher FASB
-URI https://asc.fasb.org/1943274/2147479777/606-10-55-91
Reference 4: http://www.xbrl.org/2003/role/exampleRef
-Topic 606
-SubTopic 10
-Name Accounting Standards Codification
-Section 55
-Paragraph 91
-Subparagraph (c)
-Publisher FASB
-URI https://asc.fasb.org/1943274/2147479777/606-10-55-91
Reference 5: http://www.xbrl.org/2003/role/exampleRef
-Topic 606
-SubTopic 10
-Name Accounting Standards Codification
-Section 55
-Paragraph 91
-Subparagraph (d)
-Publisher FASB
-URI https://asc.fasb.org/1943274/2147479777/606-10-55-91
Reference 6: http://www.xbrl.org/2003/role/exampleRef
-Topic 606
-SubTopic 10
-Name Accounting Standards Codification
-Section 55
-Paragraph 91
-Subparagraph (e)
-Publisher FASB
-URI https://asc.fasb.org/1943274/2147479777/606-10-55-91
Reference 7: http://www.xbrl.org/2003/role/exampleRef
-Topic 606
-SubTopic 10
-Name Accounting Standards Codification
-Section 55
-Paragraph 91
-Subparagraph (f)
-Publisher FASB
-URI https://asc.fasb.org/1943274/2147479777/606-10-55-91
Reference 8: http://www.xbrl.org/2003/role/exampleRef
-Topic 606
-SubTopic 10
-Name Accounting Standards Codification
-Section 55
-Paragraph 91
-Subparagraph (g)
-Publisher FASB
-URI https://asc.fasb.org/1943274/2147479777/606-10-55-91
| Name: |
us-gaap_DisaggregationOfRevenueLineItems |
| Namespace Prefix: |
us-gaap_ |
| Data Type: |
xbrli:stringItemType |
| Balance Type: |
na |
| Period Type: |
duration |
|
| X |
- DefinitionAmount of operating lease income from lease payments and variable lease payments paid and payable to lessor. Includes, but is not limited to, variable lease payments not included in measurement of lease receivable. Reference 1: http://www.xbrl.org/2003/role/disclosureRef
-Topic 842
-SubTopic 30
-Name Accounting Standards Codification
-Section 50
-Paragraph 5
-Publisher FASB
-URI https://asc.fasb.org/1943274/2147479773/842-30-50-5
Reference 2: http://www.xbrl.org/2003/role/disclosureRef
-Topic 270
-SubTopic 10
-Name Accounting Standards Codification
-Section 50
-Paragraph 6A
-Publisher FASB
-URI https://asc.fasb.org/1943274/2147482964/270-10-50-6A
Reference 3: http://www.xbrl.org/2003/role/disclosureRef
-Topic 842
-SubTopic 30
-Name Accounting Standards Codification
-Section 45
-Paragraph 3
-Publisher FASB
-URI https://asc.fasb.org/1943274/2147479016/842-30-45-3
| Name: |
us-gaap_OperatingLeaseLeaseIncome |
| Namespace Prefix: |
us-gaap_ |
| Data Type: |
xbrli:monetaryItemType |
| Balance Type: |
credit |
| Period Type: |
duration |
|
| X |
- DefinitionAmount, excluding tax collected from customer, of revenue from satisfaction of performance obligation by transferring promised good or service to customer. Tax collected from customer is tax assessed by governmental authority that is both imposed on and concurrent with specific revenue-producing transaction, including, but not limited to, sales, use, value added and excise. Reference 1: http://www.xbrl.org/2003/role/disclosureRef
-Topic 280
-SubTopic 10
-Name Accounting Standards Codification
-Section 50
-Paragraph 41
-Subparagraph (a)
-Publisher FASB
-URI https://asc.fasb.org/1943274/2147482810/280-10-50-41
Reference 2: http://www.xbrl.org/2003/role/disclosureRef
-Topic 270
-SubTopic 10
-Name Accounting Standards Codification
-Section 50
-Paragraph 1
-Subparagraph (i)
-Publisher FASB
-URI https://asc.fasb.org/1943274/2147482964/270-10-50-1
Reference 3: http://www.xbrl.org/2003/role/disclosureRef
-Topic 280
-SubTopic 10
-Name Accounting Standards Codification
-Section 50
-Paragraph 32
-Subparagraph (ee)
-Publisher FASB
-URI https://asc.fasb.org/1943274/2147482810/280-10-50-32
Reference 4: http://fasb.org/us-gaap/role/ref/otherTransitionRef
-Topic 280
-SubTopic 10
-Name Accounting Standards Codification
-Section 50
-Paragraph 32
-Subparagraph (b)
-Publisher FASB
-URI https://asc.fasb.org/1943274/2147482810/280-10-50-32
Reference 5: http://fasb.org/us-gaap/role/ref/otherTransitionRef
-Topic 280
-SubTopic 10
-Name Accounting Standards Codification
-Section 50
-Paragraph 32
-Subparagraph (a)
-Publisher FASB
-URI https://asc.fasb.org/1943274/2147482810/280-10-50-32
Reference 6: http://www.xbrl.org/2003/role/disclosureRef
-Topic 924
-SubTopic 10
-Name Accounting Standards Codification
-Section S99
-Paragraph 1
-Subparagraph (SAB Topic 11.L)
-Publisher FASB
-URI https://asc.fasb.org/1943274/2147479941/924-10-S99-1
Reference 7: http://www.xbrl.org/2003/role/disclosureRef
-Topic 606
-SubTopic 10
-Name Accounting Standards Codification
-Section 50
-Paragraph 5
-Publisher FASB
-URI https://asc.fasb.org/1943274/2147479806/606-10-50-5
Reference 8: http://www.xbrl.org/2003/role/disclosureRef
-Topic 280
-SubTopic 10
-Name Accounting Standards Codification
-Section 50
-Paragraph 30
-Subparagraph (a)
-Publisher FASB
-URI https://asc.fasb.org/1943274/2147482810/280-10-50-30
Reference 9: http://www.xbrl.org/2003/role/disclosureRef
-Topic 280
-SubTopic 10
-Name Accounting Standards Codification
-Section 50
-Paragraph 42
-Publisher FASB
-URI https://asc.fasb.org/1943274/2147482810/280-10-50-42
Reference 10: http://www.xbrl.org/2003/role/disclosureRef
-Topic 280
-SubTopic 10
-Name Accounting Standards Codification
-Section 50
-Paragraph 22
-Subparagraph (b)
-Publisher FASB
-URI https://asc.fasb.org/1943274/2147482810/280-10-50-22
Reference 11: http://www.xbrl.org/2003/role/disclosureRef
-Topic 280
-SubTopic 10
-Name Accounting Standards Codification
-Section 50
-Paragraph 40
-Publisher FASB
-URI https://asc.fasb.org/1943274/2147482810/280-10-50-40
Reference 12: http://www.xbrl.org/2003/role/disclosureRef
-Topic 280
-SubTopic 10
-Name Accounting Standards Codification
-Section 50
-Paragraph 22
-Subparagraph (a)
-Publisher FASB
-URI https://asc.fasb.org/1943274/2147482810/280-10-50-22
Reference 13: http://www.xbrl.org/2003/role/disclosureRef
-Topic 606
-SubTopic 10
-Name Accounting Standards Codification
-Section 50
-Paragraph 4
-Subparagraph (a)
-Publisher FASB
-URI https://asc.fasb.org/1943274/2147479806/606-10-50-4
| Name: |
us-gaap_RevenueFromContractWithCustomerExcludingAssessedTax |
| Namespace Prefix: |
us-gaap_ |
| Data Type: |
xbrli:monetaryItemType |
| Balance Type: |
credit |
| Period Type: |
duration |
|
| X |
- DefinitionAmount of revenue recognized from goods sold, services rendered, insurance premiums, or other activities that constitute an earning process. Includes, but is not limited to, investment and interest income before deduction of interest expense when recognized as a component of revenue, and sales and trading gain (loss). Reference 1: http://www.xbrl.org/2003/role/exampleRef
-Topic 280
-SubTopic 10
-Name Accounting Standards Codification
-Section 55
-Paragraph 48
-Publisher FASB
-URI https://asc.fasb.org/1943274/2147482785/280-10-55-48
Reference 2: http://www.xbrl.org/2003/role/disclosureRef
-Topic 280
-SubTopic 10
-Name Accounting Standards Codification
-Section 50
-Paragraph 41
-Subparagraph (a)
-Publisher FASB
-URI https://asc.fasb.org/1943274/2147482810/280-10-50-41
Reference 3: http://www.xbrl.org/2003/role/disclosureRef
-Topic 270
-SubTopic 10
-Name Accounting Standards Codification
-Section 50
-Paragraph 1
-Subparagraph (i)
-Publisher FASB
-URI https://asc.fasb.org/1943274/2147482964/270-10-50-1
Reference 4: http://www.xbrl.org/2003/role/disclosureRef
-Topic 280
-SubTopic 10
-Name Accounting Standards Codification
-Section 50
-Paragraph 32
-Subparagraph (ee)
-Publisher FASB
-URI https://asc.fasb.org/1943274/2147482810/280-10-50-32
Reference 5: http://fasb.org/us-gaap/role/ref/otherTransitionRef
-Topic 280
-SubTopic 10
-Name Accounting Standards Codification
-Section 50
-Paragraph 32
-Subparagraph (b)
-Publisher FASB
-URI https://asc.fasb.org/1943274/2147482810/280-10-50-32
Reference 6: http://fasb.org/us-gaap/role/ref/otherTransitionRef
-Topic 280
-SubTopic 10
-Name Accounting Standards Codification
-Section 50
-Paragraph 32
-Subparagraph (a)
-Publisher FASB
-URI https://asc.fasb.org/1943274/2147482810/280-10-50-32
Reference 7: http://www.xbrl.org/2003/role/disclosureRef
-Topic 235
-SubTopic 10
-Name Accounting Standards Codification
-Section S99
-Paragraph 1
-Subparagraph (SX 210.4-08(g)(1)(ii))
-Publisher FASB
-URI https://asc.fasb.org/1943274/2147480678/235-10-S99-1
Reference 8: http://www.xbrl.org/2003/role/disclosureRef
-Topic 323
-SubTopic 10
-Name Accounting Standards Codification
-Section 50
-Paragraph 3
-Subparagraph (c)
-Publisher FASB
-URI https://asc.fasb.org/1943274/2147481687/323-10-50-3
Reference 9: http://www.xbrl.org/2003/role/disclosureRef
-Topic 825
-SubTopic 10
-Name Accounting Standards Codification
-Section 50
-Paragraph 28
-Subparagraph (f)
-Publisher FASB
-URI https://asc.fasb.org/1943274/2147482907/825-10-50-28
Reference 10: http://www.xbrl.org/2003/role/disclosureRef
-Topic 470
-SubTopic 10
-Name Accounting Standards Codification
-Section S99
-Paragraph 1A
-Subparagraph (SX 210.13-01(a)(4)(i))
-Publisher FASB
-URI https://asc.fasb.org/1943274/2147480097/470-10-S99-1A
Reference 11: http://www.xbrl.org/2009/role/commonPracticeRef
-Topic 470
-SubTopic 10
-Name Accounting Standards Codification
-Section S99
-Paragraph 1A
-Subparagraph (SX 210.13-01(a)(4)(ii))
-Publisher FASB
-URI https://asc.fasb.org/1943274/2147480097/470-10-S99-1A
Reference 12: http://www.xbrl.org/2003/role/disclosureRef
-Topic 470
-SubTopic 10
-Name Accounting Standards Codification
-Section S99
-Paragraph 1A
-Subparagraph (SX 210.13-01(a)(4)(iii)(A))
-Publisher FASB
-URI https://asc.fasb.org/1943274/2147480097/470-10-S99-1A
Reference 13: http://www.xbrl.org/2003/role/disclosureRef
-Topic 470
-SubTopic 10
-Name Accounting Standards Codification
-Section S99
-Paragraph 1A
-Subparagraph (SX 210.13-01(a)(4)(iv))
-Publisher FASB
-URI https://asc.fasb.org/1943274/2147480097/470-10-S99-1A
Reference 14: http://www.xbrl.org/2003/role/disclosureRef
-Topic 470
-SubTopic 10
-Name Accounting Standards Codification
-Section S99
-Paragraph 1A
-Subparagraph (SX 210.13-01(a)(5))
-Publisher FASB
-URI https://asc.fasb.org/1943274/2147480097/470-10-S99-1A
Reference 15: http://www.xbrl.org/2003/role/disclosureRef
-Topic 470
-SubTopic 10
-Name Accounting Standards Codification
-Section S99
-Paragraph 1B
-Subparagraph (SX 210.13-02(a)(4)(i))
-Publisher FASB
-URI https://asc.fasb.org/1943274/2147480097/470-10-S99-1B
Reference 16: http://www.xbrl.org/2003/role/disclosureRef
-Topic 470
-SubTopic 10
-Name Accounting Standards Codification
-Section S99
-Paragraph 1B
-Subparagraph (SX 210.13-02(a)(4)(iii)(A))
-Publisher FASB
-URI https://asc.fasb.org/1943274/2147480097/470-10-S99-1B
Reference 17: http://www.xbrl.org/2003/role/disclosureRef
-Topic 470
-SubTopic 10
-Name Accounting Standards Codification
-Section S99
-Paragraph 1B
-Subparagraph (SX 210.13-02(a)(4)(iii)(B))
-Publisher FASB
-URI https://asc.fasb.org/1943274/2147480097/470-10-S99-1B
Reference 18: http://www.xbrl.org/2003/role/disclosureRef
-Topic 470
-SubTopic 10
-Name Accounting Standards Codification
-Section S99
-Paragraph 1B
-Subparagraph (SX 210.13-02(a)(4)(iv))
-Publisher FASB
-URI https://asc.fasb.org/1943274/2147480097/470-10-S99-1B
Reference 19: http://www.xbrl.org/2003/role/disclosureRef
-Topic 470
-SubTopic 10
-Name Accounting Standards Codification
-Section S99
-Paragraph 1B
-Subparagraph (SX 210.13-02(a)(5))
-Publisher FASB
-URI https://asc.fasb.org/1943274/2147480097/470-10-S99-1B
Reference 20: http://www.xbrl.org/2003/role/disclosureRef
-Topic 280
-SubTopic 10
-Name Accounting Standards Codification
-Section 50
-Paragraph 30
-Subparagraph (a)
-Publisher FASB
-URI https://asc.fasb.org/1943274/2147482810/280-10-50-30
Reference 21: http://www.xbrl.org/2003/role/disclosureRef
-Topic 280
-SubTopic 10
-Name Accounting Standards Codification
-Section 50
-Paragraph 42
-Publisher FASB
-URI https://asc.fasb.org/1943274/2147482810/280-10-50-42
Reference 22: http://www.xbrl.org/2003/role/disclosureRef
-Topic 280
-SubTopic 10
-Name Accounting Standards Codification
-Section 50
-Paragraph 22
-Subparagraph (b)
-Publisher FASB
-URI https://asc.fasb.org/1943274/2147482810/280-10-50-22
Reference 23: http://www.xbrl.org/2003/role/disclosureRef
-Topic 280
-SubTopic 10
-Name Accounting Standards Codification
-Section 50
-Paragraph 40
-Publisher FASB
-URI https://asc.fasb.org/1943274/2147482810/280-10-50-40
Reference 24: http://www.xbrl.org/2003/role/disclosureRef
-Topic 280
-SubTopic 10
-Name Accounting Standards Codification
-Section 50
-Paragraph 22
-Subparagraph (a)
-Publisher FASB
-URI https://asc.fasb.org/1943274/2147482810/280-10-50-22
Reference 25: http://www.xbrl.org/2003/role/disclosureRef
-Topic 942
-SubTopic 235
-Name Accounting Standards Codification
-Section S99
-Paragraph 1
-Subparagraph (SX 210.9-05(b)(2))
-Publisher FASB
-URI https://asc.fasb.org/1943274/2147477314/942-235-S99-1
Reference 26: http://www.xbrl.org/2003/role/disclosureRef
-Topic 220
-SubTopic 10
-Name Accounting Standards Codification
-Section S99
-Paragraph 2
-Subparagraph (SX 210.5-03(1))
-Publisher FASB
-URI https://asc.fasb.org/1943274/2147483621/220-10-S99-2
| Name: |
us-gaap_Revenues |
| Namespace Prefix: |
us-gaap_ |
| Data Type: |
xbrli:monetaryItemType |
| Balance Type: |
credit |
| Period Type: |
duration |
|
| X |
- Details
| Name: |
srt_ProductOrServiceAxis=us-gaap_LandMember |
| Namespace Prefix: |
|
| Data Type: |
na |
| Balance Type: |
|
| Period Type: |
|
|
| X |
- Details
| Name: |
srt_ProductOrServiceAxis=us-gaap_ManagementServiceMember |
| Namespace Prefix: |
|
| Data Type: |
na |
| Balance Type: |
|
| Period Type: |
|
|
| X |
- Details
| Name: |
srt_ProductOrServiceAxis=fph_OperatingPropertiesMember |
| Namespace Prefix: |
|
| Data Type: |
na |
| Balance Type: |
|
| Period Type: |
|
|
| X |
- Details
| Name: |
us-gaap_StatementBusinessSegmentsAxis=fph_ValenciaMember |
| Namespace Prefix: |
|
| Data Type: |
na |
| Balance Type: |
|
| Period Type: |
|
|
| X |
- Details
| Name: |
us-gaap_StatementBusinessSegmentsAxis=fph_SanFranciscoMember |
| Namespace Prefix: |
|
| Data Type: |
na |
| Balance Type: |
|
| Period Type: |
|
|
| X |
- Details
| Name: |
us-gaap_StatementBusinessSegmentsAxis=fph_GreatParkVentureMember |
| Namespace Prefix: |
|
| Data Type: |
na |
| Balance Type: |
|
| Period Type: |
|
|
| X |
- Details
| Name: |
us-gaap_StatementBusinessSegmentsAxis=fph_CommercialLeasingMember |
| Namespace Prefix: |
|
| Data Type: |
na |
| Balance Type: |
|
| Period Type: |
|
|
v3.24.2
| X |
- DefinitionIncrease (Decrease) In Contract With Customer, Asset [Roll Forward]
| Name: |
fph_IncreaseDecreaseInContractWithCustomerAssetRollForward |
| Namespace Prefix: |
fph_ |
| Data Type: |
xbrli:stringItemType |
| Balance Type: |
na |
| Period Type: |
duration |
|
| X |
- DefinitionAmount, after allowance for credit loss, of right to consideration in exchange for good or service transferred to customer when right is conditioned on something other than passage of time. Reference 1: http://www.xbrl.org/2003/role/disclosureRef
-Topic 606
-SubTopic 10
-Name Accounting Standards Codification
-Section 45
-Paragraph 3
-Publisher FASB
-URI https://asc.fasb.org/1943274/2147479837/606-10-45-3
Reference 2: http://www.xbrl.org/2003/role/disclosureRef
-Topic 606
-SubTopic 10
-Name Accounting Standards Codification
-Section 45
-Paragraph 1
-Publisher FASB
-URI https://asc.fasb.org/1943274/2147479837/606-10-45-1
Reference 3: http://www.xbrl.org/2003/role/disclosureRef
-Topic 606
-SubTopic 10
-Name Accounting Standards Codification
-Section 50
-Paragraph 8
-Subparagraph (a)
-Publisher FASB
-URI https://asc.fasb.org/1943274/2147479806/606-10-50-8
| Name: |
us-gaap_ContractWithCustomerAssetNet |
| Namespace Prefix: |
us-gaap_ |
| Data Type: |
xbrli:monetaryItemType |
| Balance Type: |
debit |
| Period Type: |
instant |
|
| X |
- DefinitionAmount of increase (decrease) in right to consideration in exchange for good or service transferred to customer when right is conditioned on something other than passage of time. Reference 1: http://www.xbrl.org/2009/role/commonPracticeRef
-Topic 230
-SubTopic 10
-Name Accounting Standards Codification
-Section 45
-Paragraph 28
-Subparagraph (a)
-Publisher FASB
-URI https://asc.fasb.org/1943274/2147482740/230-10-45-28
| Name: |
us-gaap_IncreaseDecreaseInContractWithCustomerAsset |
| Namespace Prefix: |
us-gaap_ |
| Data Type: |
xbrli:monetaryItemType |
| Balance Type: |
credit |
| Period Type: |
duration |
|
| X |
- DefinitionCash receipts from customers during the current period which are usually for sales of goods and services. Reference 1: http://fasb.org/us-gaap/role/ref/legacyRef
-Topic 230
-SubTopic 10
-Name Accounting Standards Codification
-Section 45
-Paragraph 25
-Subparagraph (a)
-Publisher FASB
-URI https://asc.fasb.org/1943274/2147482740/230-10-45-25
| Name: |
us-gaap_ProceedsFromCustomers |
| Namespace Prefix: |
us-gaap_ |
| Data Type: |
xbrli:monetaryItemType |
| Balance Type: |
debit |
| Period Type: |
duration |
|
| X |
- Details
| Name: |
srt_CounterpartyNameAxis=fph_GreatParkVentureMember |
| Namespace Prefix: |
|
| Data Type: |
na |
| Balance Type: |
|
| Period Type: |
|
|
v3.24.2
Investment In Unconsolidated Entities - Additional Information (Details)
$ in Thousands, ft² in Millions |
3 Months Ended |
6 Months Ended |
|
|
Jun. 30, 2024
USD ($)
a
ft²
individual
building
|
Jun. 30, 2023
USD ($)
|
Jun. 30, 2024
USD ($)
a
ft²
individual
building
|
Jun. 30, 2023
USD ($)
|
Dec. 31, 2023
USD ($)
|
| Schedule of Equity Method Investments [Line Items] |
|
|
|
|
|
| Revenue from customers |
$ 50,757
|
$ 20,902
|
$ 60,090
|
$ 26,095
|
|
| Number of buildings owned | building |
1
|
|
1
|
|
|
| Area of land (in acres) | a |
50
|
|
50
|
|
|
| Number of buildings on campus | building |
4
|
|
4
|
|
|
| Revenues |
$ 51,192
|
21,349
|
$ 61,127
|
27,050
|
|
| The Company’s investment in the Great Park Venture |
237,777
|
|
237,777
|
|
$ 252,816
|
| Equity in earnings (losses) from unconsolidated entities |
15,498
|
52,128
|
33,084
|
53,176
|
|
| Land sales |
|
|
|
|
|
| Schedule of Equity Method Investments [Line Items] |
|
|
|
|
|
| Revenue from customers |
310
|
(13)
|
842
|
586
|
|
| Land sales | Related Party |
|
|
|
|
|
| Schedule of Equity Method Investments [Line Items] |
|
|
|
|
|
| Revenues |
3
|
(29)
|
0
|
595
|
|
| Land sales | Nonrelated Party |
|
|
|
|
|
| Schedule of Equity Method Investments [Line Items] |
|
|
|
|
|
| Revenues |
$ 307
|
$ 16
|
842
|
(9)
|
|
| Great Park Venture |
|
|
|
|
|
| Schedule of Equity Method Investments [Line Items] |
|
|
|
|
|
| Distribution to holders of Legacy Interests |
|
|
14,800
|
|
|
| Distributions to holders of Percentage Interests |
|
|
126,200
|
|
|
| Great Park Venture | Land sales | Related Party |
|
|
|
|
|
| Schedule of Equity Method Investments [Line Items] |
|
|
|
|
|
| Revenue from customers |
|
|
16,600
|
7,400
|
|
| Great Park Venture | Land sales | Nonrelated Party |
|
|
|
|
|
| Schedule of Equity Method Investments [Line Items] |
|
|
|
|
|
| Revenue from customers |
|
|
215,500
|
361,800
|
|
| Great Park Venture | Homesites Sold | Nonrelated Party |
|
|
|
|
|
| Schedule of Equity Method Investments [Line Items] |
|
|
|
|
|
| Revenue from customers |
|
|
|
357,800
|
|
| Gateway Commercial Venture |
|
|
|
|
|
| Schedule of Equity Method Investments [Line Items] |
|
|
|
|
|
| Revenue from customers |
|
|
$ 4,773
|
4,175
|
|
| Area of land (in acres) | a |
73
|
|
73
|
|
|
| Number of buildings on campus | building |
4
|
|
4
|
|
|
| Area of gateway campus | ft² |
1
|
|
1
|
|
|
| Gateway Commercial Venture | Rental Revenue |
|
|
|
|
|
| Schedule of Equity Method Investments [Line Items] |
|
|
|
|
|
| Revenues |
|
|
$ 4,800
|
4,200
|
|
| Great Park Venture |
|
|
|
|
|
| Schedule of Equity Method Investments [Line Items] |
|
|
|
|
|
| Percentage of equity ownership |
37.50%
|
|
37.50%
|
|
|
| Return of investment |
|
|
$ 47,300
|
|
|
| Remaining maximum participating Legacy Interest distribution rights |
|
|
$ 3,300
|
|
|
| Percent of future distributions to legacy interest holders |
|
|
10.00%
|
|
|
| The Company’s investment in the Great Park Venture |
$ 199,610
|
|
$ 199,610
|
|
213,786
|
| Equity in earnings (losses) from unconsolidated entities |
|
|
$ 33,130
|
53,484
|
|
| Gateway Commercial Venture |
|
|
|
|
|
| Schedule of Equity Method Investments [Line Items] |
|
|
|
|
|
| Percentage of equity ownership |
75.00%
|
|
75.00%
|
|
|
| Springing guaranty, percent of outstanding note balance |
50.00%
|
|
50.00%
|
|
|
| The Company’s investment in the Great Park Venture |
$ 37,476
|
|
$ 37,476
|
|
37,781
|
| Equity in earnings (losses) from unconsolidated entities |
|
|
$ (305)
|
(667)
|
|
| Gateway Commercial Venture | Five Point Office Venture Holdings I, LLC Acquisition |
|
|
|
|
|
| Schedule of Equity Method Investments [Line Items] |
|
|
|
|
|
| Percentage of equity ownership |
75.00%
|
|
75.00%
|
|
|
| Number of individuals entitled to be appointed to executive committee | individual |
2
|
|
2
|
|
|
| Valencia Landbank Venture |
|
|
|
|
|
| Schedule of Equity Method Investments [Line Items] |
|
|
|
|
|
| Percentage of equity ownership |
10.00%
|
|
10.00%
|
|
|
| The Company’s investment in the Great Park Venture |
$ 700
|
|
$ 700
|
|
$ 1,200
|
| Equity in earnings (losses) from unconsolidated entities |
|
|
$ 300
|
$ 400
|
|
| X |
- DefinitionDistribution Made to Limited Liability Company (LLC) Member, Percentage Interests Distribution Paid, Aggregate
| Name: |
fph_DistributionMadeToLimitedLiabilityCompanyLLCMemberPercentageInterestsDistributionPaidAggregate |
| Namespace Prefix: |
fph_ |
| Data Type: |
xbrli:monetaryItemType |
| Balance Type: |
credit |
| Period Type: |
duration |
|
| X |
- DefinitionDistribution Made to Limited Liability Company (LLC) Member, Priority Distribution Paid, Aggregate
| Name: |
fph_DistributionMadeToLimitedLiabilityCompanyLLCMemberPriorityDistributionPaidAggregate |
| Namespace Prefix: |
fph_ |
| Data Type: |
xbrli:monetaryItemType |
| Balance Type: |
credit |
| Period Type: |
duration |
|
| X |
- DefinitionEquity Method Investment, Springing Guaranty, Percent of Outstanding Note Balance
| Name: |
fph_EquityMethodInvestmentSpringingGuarantyPercentOfOutstandingNoteBalance |
| Namespace Prefix: |
fph_ |
| Data Type: |
dtr-types:percentItemType |
| Balance Type: |
na |
| Period Type: |
instant |
|
| X |
- DefinitionEquity Method Investments, Number of Governing Individuals
| Name: |
fph_EquityMethodInvestmentsNumberofGoverningIndividuals |
| Namespace Prefix: |
fph_ |
| Data Type: |
xbrli:integerItemType |
| Balance Type: |
na |
| Period Type: |
instant |
|
| X |
- DefinitionNumber Of Buildings Owned
| Name: |
fph_NumberOfBuildingsOwned |
| Namespace Prefix: |
fph_ |
| Data Type: |
xbrli:integerItemType |
| Balance Type: |
na |
| Period Type: |
instant |
|
| X |
- DefinitionProceeds from Equity Method Investment, Aggregate Distribution
| Name: |
fph_ProceedsFromEquityMethodInvestmentAggregateDistribution |
| Namespace Prefix: |
fph_ |
| Data Type: |
xbrli:monetaryItemType |
| Balance Type: |
debit |
| Period Type: |
duration |
|
| X |
- DefinitionProceeds from Equity Method Investment, Percent of Future Distributions to Legacy Interest Holders
| Name: |
fph_ProceedsFromEquityMethodInvestmentPercentOfFutureDistributionsToLegacyInterestHolders |
| Namespace Prefix: |
fph_ |
| Data Type: |
dtr-types1:percentItemType |
| Balance Type: |
na |
| Period Type: |
duration |
|
| X |
- DefinitionProceeds from Equity Method Investment, Remaining Maximum Participating Legacy Interest Distribution Rights
| Name: |
fph_ProceedsFromEquityMethodInvestmentRemainingMaximumParticipatingLegacyInterestDistributionRights |
| Namespace Prefix: |
fph_ |
| Data Type: |
xbrli:monetaryItemType |
| Balance Type: |
debit |
| Period Type: |
duration |
|
| X |
- DefinitionThe percentage of ownership of common stock or equity participation in the investee accounted for under the equity method of accounting. Reference 1: http://www.xbrl.org/2003/role/disclosureRef
-Topic 323
-SubTopic 10
-Name Accounting Standards Codification
-Section 50
-Paragraph 3
-Subparagraph (a)(1)
-Publisher FASB
-URI https://asc.fasb.org/1943274/2147481687/323-10-50-3
| Name: |
us-gaap_EquityMethodInvestmentOwnershipPercentage |
| Namespace Prefix: |
us-gaap_ |
| Data Type: |
dtr-types:percentItemType |
| Balance Type: |
na |
| Period Type: |
instant |
|
| X |
- DefinitionThis item represents the carrying amount on the entity's balance sheet of its investment in common stock of an equity method investee. This is not an indicator of the fair value of the investment, rather it is the initial cost adjusted for the entity's share of earnings and losses of the investee, adjusted for any distributions (dividends) and other than temporary impairment (OTTI) losses recognized. Reference 1: http://www.xbrl.org/2003/role/disclosureRef
-Topic 270
-SubTopic 10
-Name Accounting Standards Codification
-Section 50
-Paragraph 1
-Subparagraph (i)
-Publisher FASB
-URI https://asc.fasb.org/1943274/2147482964/270-10-50-1
Reference 2: http://www.xbrl.org/2003/role/disclosureRef
-Topic 280
-SubTopic 10
-Name Accounting Standards Codification
-Section 50
-Paragraph 32
-Subparagraph (ee)
-Publisher FASB
-URI https://asc.fasb.org/1943274/2147482810/280-10-50-32
Reference 3: http://www.xbrl.org/2003/role/disclosureRef
-Topic 323
-SubTopic 10
-Name Accounting Standards Codification
-Section 45
-Paragraph 1
-Publisher FASB
-URI https://asc.fasb.org/1943274/2147481664/323-10-45-1
Reference 4: http://www.xbrl.org/2009/role/commonPracticeRef
-Topic 323
-SubTopic 10
-Name Accounting Standards Codification
-Section 50
-Paragraph 3
-Subparagraph (a)(3)
-Publisher FASB
-URI https://asc.fasb.org/1943274/2147481687/323-10-50-3
Reference 5: http://www.xbrl.org/2009/role/commonPracticeRef
-Topic 210
-SubTopic 10
-Name Accounting Standards Codification
-Section S99
-Paragraph 1
-Subparagraph (SX 210.5-02(10))
-Publisher FASB
-URI https://asc.fasb.org/1943274/2147480566/210-10-S99-1
Reference 6: http://www.xbrl.org/2003/role/disclosureRef
-Topic 280
-SubTopic 10
-Name Accounting Standards Codification
-Section 50
-Paragraph 25
-Subparagraph (a)
-Publisher FASB
-URI https://asc.fasb.org/1943274/2147482810/280-10-50-25
| Name: |
us-gaap_EquityMethodInvestments |
| Namespace Prefix: |
us-gaap_ |
| Data Type: |
xbrli:monetaryItemType |
| Balance Type: |
debit |
| Period Type: |
instant |
|
| X |
- DefinitionAmount of income (loss) for proportionate share of equity method investee's income (loss). Reference 1: http://fasb.org/us-gaap/role/ref/legacyRef
-Name Accounting Standards Codification
-Section 45
-Paragraph 28
-Subparagraph (b)
-SubTopic 10
-Topic 230
-Publisher FASB
-URI https://asc.fasb.org/1943274/2147482740/230-10-45-28
Reference 2: http://www.xbrl.org/2003/role/disclosureRef
-Topic 270
-SubTopic 10
-Name Accounting Standards Codification
-Section 50
-Paragraph 1
-Subparagraph (i)
-Publisher FASB
-URI https://asc.fasb.org/1943274/2147482964/270-10-50-1
Reference 3: http://www.xbrl.org/2003/role/disclosureRef
-Topic 280
-SubTopic 10
-Name Accounting Standards Codification
-Section 50
-Paragraph 32
-Subparagraph (ee)
-Publisher FASB
-URI https://asc.fasb.org/1943274/2147482810/280-10-50-32
Reference 4: http://www.xbrl.org/2003/role/disclosureRef
-Topic 944
-SubTopic 220
-Name Accounting Standards Codification
-Section S99
-Paragraph 1
-Subparagraph (SX 210.7-04(10))
-Publisher FASB
-URI https://asc.fasb.org/1943274/2147477250/944-220-S99-1
Reference 5: http://www.xbrl.org/2003/role/disclosureRef
-Topic 323
-SubTopic 10
-Name Accounting Standards Codification
-Section 45
-Paragraph 1
-Publisher FASB
-URI https://asc.fasb.org/1943274/2147481664/323-10-45-1
Reference 6: http://www.xbrl.org/2003/role/disclosureRef
-Topic 280
-SubTopic 10
-Name Accounting Standards Codification
-Section 50
-Paragraph 22
-Subparagraph (g)
-Publisher FASB
-URI https://asc.fasb.org/1943274/2147482810/280-10-50-22
Reference 7: http://fasb.org/us-gaap/role/ref/legacyRef
-Topic 220
-SubTopic 10
-Name Accounting Standards Codification
-Section S99
-Paragraph 2
-Subparagraph (SX 210.5-03(12))
-Publisher FASB
-URI https://asc.fasb.org/1943274/2147483621/220-10-S99-2
Reference 8: http://fasb.org/us-gaap/role/ref/legacyRef
-Topic 942
-SubTopic 220
-Name Accounting Standards Codification
-Section S99
-Paragraph 1
-Subparagraph (SX 210.9-04(13)(f))
-Publisher FASB
-URI https://asc.fasb.org/1943274/2147478524/942-220-S99-1
| Name: |
us-gaap_IncomeLossFromEquityMethodInvestments |
| Namespace Prefix: |
us-gaap_ |
| Data Type: |
xbrli:monetaryItemType |
| Balance Type: |
credit |
| Period Type: |
duration |
|
| X |
- DefinitionAmount, excluding tax collected from customer, of revenue from satisfaction of performance obligation by transferring promised good or service to customer. Tax collected from customer is tax assessed by governmental authority that is both imposed on and concurrent with specific revenue-producing transaction, including, but not limited to, sales, use, value added and excise. Reference 1: http://www.xbrl.org/2003/role/disclosureRef
-Topic 280
-SubTopic 10
-Name Accounting Standards Codification
-Section 50
-Paragraph 41
-Subparagraph (a)
-Publisher FASB
-URI https://asc.fasb.org/1943274/2147482810/280-10-50-41
Reference 2: http://www.xbrl.org/2003/role/disclosureRef
-Topic 270
-SubTopic 10
-Name Accounting Standards Codification
-Section 50
-Paragraph 1
-Subparagraph (i)
-Publisher FASB
-URI https://asc.fasb.org/1943274/2147482964/270-10-50-1
Reference 3: http://www.xbrl.org/2003/role/disclosureRef
-Topic 280
-SubTopic 10
-Name Accounting Standards Codification
-Section 50
-Paragraph 32
-Subparagraph (ee)
-Publisher FASB
-URI https://asc.fasb.org/1943274/2147482810/280-10-50-32
Reference 4: http://fasb.org/us-gaap/role/ref/otherTransitionRef
-Topic 280
-SubTopic 10
-Name Accounting Standards Codification
-Section 50
-Paragraph 32
-Subparagraph (b)
-Publisher FASB
-URI https://asc.fasb.org/1943274/2147482810/280-10-50-32
Reference 5: http://fasb.org/us-gaap/role/ref/otherTransitionRef
-Topic 280
-SubTopic 10
-Name Accounting Standards Codification
-Section 50
-Paragraph 32
-Subparagraph (a)
-Publisher FASB
-URI https://asc.fasb.org/1943274/2147482810/280-10-50-32
Reference 6: http://www.xbrl.org/2003/role/disclosureRef
-Topic 924
-SubTopic 10
-Name Accounting Standards Codification
-Section S99
-Paragraph 1
-Subparagraph (SAB Topic 11.L)
-Publisher FASB
-URI https://asc.fasb.org/1943274/2147479941/924-10-S99-1
Reference 7: http://www.xbrl.org/2003/role/disclosureRef
-Topic 606
-SubTopic 10
-Name Accounting Standards Codification
-Section 50
-Paragraph 5
-Publisher FASB
-URI https://asc.fasb.org/1943274/2147479806/606-10-50-5
Reference 8: http://www.xbrl.org/2003/role/disclosureRef
-Topic 280
-SubTopic 10
-Name Accounting Standards Codification
-Section 50
-Paragraph 30
-Subparagraph (a)
-Publisher FASB
-URI https://asc.fasb.org/1943274/2147482810/280-10-50-30
Reference 9: http://www.xbrl.org/2003/role/disclosureRef
-Topic 280
-SubTopic 10
-Name Accounting Standards Codification
-Section 50
-Paragraph 42
-Publisher FASB
-URI https://asc.fasb.org/1943274/2147482810/280-10-50-42
Reference 10: http://www.xbrl.org/2003/role/disclosureRef
-Topic 280
-SubTopic 10
-Name Accounting Standards Codification
-Section 50
-Paragraph 22
-Subparagraph (b)
-Publisher FASB
-URI https://asc.fasb.org/1943274/2147482810/280-10-50-22
Reference 11: http://www.xbrl.org/2003/role/disclosureRef
-Topic 280
-SubTopic 10
-Name Accounting Standards Codification
-Section 50
-Paragraph 40
-Publisher FASB
-URI https://asc.fasb.org/1943274/2147482810/280-10-50-40
Reference 12: http://www.xbrl.org/2003/role/disclosureRef
-Topic 280
-SubTopic 10
-Name Accounting Standards Codification
-Section 50
-Paragraph 22
-Subparagraph (a)
-Publisher FASB
-URI https://asc.fasb.org/1943274/2147482810/280-10-50-22
Reference 13: http://www.xbrl.org/2003/role/disclosureRef
-Topic 606
-SubTopic 10
-Name Accounting Standards Codification
-Section 50
-Paragraph 4
-Subparagraph (a)
-Publisher FASB
-URI https://asc.fasb.org/1943274/2147479806/606-10-50-4
| Name: |
us-gaap_RevenueFromContractWithCustomerExcludingAssessedTax |
| Namespace Prefix: |
us-gaap_ |
| Data Type: |
xbrli:monetaryItemType |
| Balance Type: |
credit |
| Period Type: |
duration |
|
| X |
- DefinitionAmount of revenue recognized from goods sold, services rendered, insurance premiums, or other activities that constitute an earning process. Includes, but is not limited to, investment and interest income before deduction of interest expense when recognized as a component of revenue, and sales and trading gain (loss). Reference 1: http://www.xbrl.org/2003/role/exampleRef
-Topic 280
-SubTopic 10
-Name Accounting Standards Codification
-Section 55
-Paragraph 48
-Publisher FASB
-URI https://asc.fasb.org/1943274/2147482785/280-10-55-48
Reference 2: http://www.xbrl.org/2003/role/disclosureRef
-Topic 280
-SubTopic 10
-Name Accounting Standards Codification
-Section 50
-Paragraph 41
-Subparagraph (a)
-Publisher FASB
-URI https://asc.fasb.org/1943274/2147482810/280-10-50-41
Reference 3: http://www.xbrl.org/2003/role/disclosureRef
-Topic 270
-SubTopic 10
-Name Accounting Standards Codification
-Section 50
-Paragraph 1
-Subparagraph (i)
-Publisher FASB
-URI https://asc.fasb.org/1943274/2147482964/270-10-50-1
Reference 4: http://www.xbrl.org/2003/role/disclosureRef
-Topic 280
-SubTopic 10
-Name Accounting Standards Codification
-Section 50
-Paragraph 32
-Subparagraph (ee)
-Publisher FASB
-URI https://asc.fasb.org/1943274/2147482810/280-10-50-32
Reference 5: http://fasb.org/us-gaap/role/ref/otherTransitionRef
-Topic 280
-SubTopic 10
-Name Accounting Standards Codification
-Section 50
-Paragraph 32
-Subparagraph (b)
-Publisher FASB
-URI https://asc.fasb.org/1943274/2147482810/280-10-50-32
Reference 6: http://fasb.org/us-gaap/role/ref/otherTransitionRef
-Topic 280
-SubTopic 10
-Name Accounting Standards Codification
-Section 50
-Paragraph 32
-Subparagraph (a)
-Publisher FASB
-URI https://asc.fasb.org/1943274/2147482810/280-10-50-32
Reference 7: http://www.xbrl.org/2003/role/disclosureRef
-Topic 235
-SubTopic 10
-Name Accounting Standards Codification
-Section S99
-Paragraph 1
-Subparagraph (SX 210.4-08(g)(1)(ii))
-Publisher FASB
-URI https://asc.fasb.org/1943274/2147480678/235-10-S99-1
Reference 8: http://www.xbrl.org/2003/role/disclosureRef
-Topic 323
-SubTopic 10
-Name Accounting Standards Codification
-Section 50
-Paragraph 3
-Subparagraph (c)
-Publisher FASB
-URI https://asc.fasb.org/1943274/2147481687/323-10-50-3
Reference 9: http://www.xbrl.org/2003/role/disclosureRef
-Topic 825
-SubTopic 10
-Name Accounting Standards Codification
-Section 50
-Paragraph 28
-Subparagraph (f)
-Publisher FASB
-URI https://asc.fasb.org/1943274/2147482907/825-10-50-28
Reference 10: http://www.xbrl.org/2003/role/disclosureRef
-Topic 470
-SubTopic 10
-Name Accounting Standards Codification
-Section S99
-Paragraph 1A
-Subparagraph (SX 210.13-01(a)(4)(i))
-Publisher FASB
-URI https://asc.fasb.org/1943274/2147480097/470-10-S99-1A
Reference 11: http://www.xbrl.org/2009/role/commonPracticeRef
-Topic 470
-SubTopic 10
-Name Accounting Standards Codification
-Section S99
-Paragraph 1A
-Subparagraph (SX 210.13-01(a)(4)(ii))
-Publisher FASB
-URI https://asc.fasb.org/1943274/2147480097/470-10-S99-1A
Reference 12: http://www.xbrl.org/2003/role/disclosureRef
-Topic 470
-SubTopic 10
-Name Accounting Standards Codification
-Section S99
-Paragraph 1A
-Subparagraph (SX 210.13-01(a)(4)(iii)(A))
-Publisher FASB
-URI https://asc.fasb.org/1943274/2147480097/470-10-S99-1A
Reference 13: http://www.xbrl.org/2003/role/disclosureRef
-Topic 470
-SubTopic 10
-Name Accounting Standards Codification
-Section S99
-Paragraph 1A
-Subparagraph (SX 210.13-01(a)(4)(iv))
-Publisher FASB
-URI https://asc.fasb.org/1943274/2147480097/470-10-S99-1A
Reference 14: http://www.xbrl.org/2003/role/disclosureRef
-Topic 470
-SubTopic 10
-Name Accounting Standards Codification
-Section S99
-Paragraph 1A
-Subparagraph (SX 210.13-01(a)(5))
-Publisher FASB
-URI https://asc.fasb.org/1943274/2147480097/470-10-S99-1A
Reference 15: http://www.xbrl.org/2003/role/disclosureRef
-Topic 470
-SubTopic 10
-Name Accounting Standards Codification
-Section S99
-Paragraph 1B
-Subparagraph (SX 210.13-02(a)(4)(i))
-Publisher FASB
-URI https://asc.fasb.org/1943274/2147480097/470-10-S99-1B
Reference 16: http://www.xbrl.org/2003/role/disclosureRef
-Topic 470
-SubTopic 10
-Name Accounting Standards Codification
-Section S99
-Paragraph 1B
-Subparagraph (SX 210.13-02(a)(4)(iii)(A))
-Publisher FASB
-URI https://asc.fasb.org/1943274/2147480097/470-10-S99-1B
Reference 17: http://www.xbrl.org/2003/role/disclosureRef
-Topic 470
-SubTopic 10
-Name Accounting Standards Codification
-Section S99
-Paragraph 1B
-Subparagraph (SX 210.13-02(a)(4)(iii)(B))
-Publisher FASB
-URI https://asc.fasb.org/1943274/2147480097/470-10-S99-1B
Reference 18: http://www.xbrl.org/2003/role/disclosureRef
-Topic 470
-SubTopic 10
-Name Accounting Standards Codification
-Section S99
-Paragraph 1B
-Subparagraph (SX 210.13-02(a)(4)(iv))
-Publisher FASB
-URI https://asc.fasb.org/1943274/2147480097/470-10-S99-1B
Reference 19: http://www.xbrl.org/2003/role/disclosureRef
-Topic 470
-SubTopic 10
-Name Accounting Standards Codification
-Section S99
-Paragraph 1B
-Subparagraph (SX 210.13-02(a)(5))
-Publisher FASB
-URI https://asc.fasb.org/1943274/2147480097/470-10-S99-1B
Reference 20: http://www.xbrl.org/2003/role/disclosureRef
-Topic 280
-SubTopic 10
-Name Accounting Standards Codification
-Section 50
-Paragraph 30
-Subparagraph (a)
-Publisher FASB
-URI https://asc.fasb.org/1943274/2147482810/280-10-50-30
Reference 21: http://www.xbrl.org/2003/role/disclosureRef
-Topic 280
-SubTopic 10
-Name Accounting Standards Codification
-Section 50
-Paragraph 42
-Publisher FASB
-URI https://asc.fasb.org/1943274/2147482810/280-10-50-42
Reference 22: http://www.xbrl.org/2003/role/disclosureRef
-Topic 280
-SubTopic 10
-Name Accounting Standards Codification
-Section 50
-Paragraph 22
-Subparagraph (b)
-Publisher FASB
-URI https://asc.fasb.org/1943274/2147482810/280-10-50-22
Reference 23: http://www.xbrl.org/2003/role/disclosureRef
-Topic 280
-SubTopic 10
-Name Accounting Standards Codification
-Section 50
-Paragraph 40
-Publisher FASB
-URI https://asc.fasb.org/1943274/2147482810/280-10-50-40
Reference 24: http://www.xbrl.org/2003/role/disclosureRef
-Topic 280
-SubTopic 10
-Name Accounting Standards Codification
-Section 50
-Paragraph 22
-Subparagraph (a)
-Publisher FASB
-URI https://asc.fasb.org/1943274/2147482810/280-10-50-22
Reference 25: http://www.xbrl.org/2003/role/disclosureRef
-Topic 942
-SubTopic 235
-Name Accounting Standards Codification
-Section S99
-Paragraph 1
-Subparagraph (SX 210.9-05(b)(2))
-Publisher FASB
-URI https://asc.fasb.org/1943274/2147477314/942-235-S99-1
Reference 26: http://www.xbrl.org/2003/role/disclosureRef
-Topic 220
-SubTopic 10
-Name Accounting Standards Codification
-Section S99
-Paragraph 2
-Subparagraph (SX 210.5-03(1))
-Publisher FASB
-URI https://asc.fasb.org/1943274/2147483621/220-10-S99-2
| Name: |
us-gaap_Revenues |
| Namespace Prefix: |
us-gaap_ |
| Data Type: |
xbrli:monetaryItemType |
| Balance Type: |
credit |
| Period Type: |
duration |
|
| X |
- DefinitionLine items represent financial concepts included in a table. These concepts are used to disclose reportable information associated with domain members defined in one or many axes to the table. Reference 1: http://www.xbrl.org/2003/role/disclosureRef
-Topic 235
-SubTopic 10
-Name Accounting Standards Codification
-Section S99
-Paragraph 1
-Subparagraph (SX 210.4-08(g)(1)(ii))
-Publisher FASB
-URI https://asc.fasb.org/1943274/2147480678/235-10-S99-1
Reference 2: http://www.xbrl.org/2003/role/disclosureRef
-Topic 323
-SubTopic 10
-Name Accounting Standards Codification
-Section 50
-Paragraph 3
-Subparagraph (c)
-Publisher FASB
-URI https://asc.fasb.org/1943274/2147481687/323-10-50-3
Reference 3: http://www.xbrl.org/2003/role/disclosureRef
-Topic 825
-SubTopic 10
-Name Accounting Standards Codification
-Section 50
-Paragraph 28
-Subparagraph (f)
-Publisher FASB
-URI https://asc.fasb.org/1943274/2147482907/825-10-50-28
Reference 4: http://www.xbrl.org/2003/role/disclosureRef
-Topic 323
-SubTopic 10
-Name Accounting Standards Codification
-Section 50
-Paragraph 3
-Subparagraph (a)(1)
-Publisher FASB
-URI https://asc.fasb.org/1943274/2147481687/323-10-50-3
Reference 5: http://www.xbrl.org/2003/role/disclosureRef
-Topic 323
-SubTopic 10
-Name Accounting Standards Codification
-Section 50
-Paragraph 3
-Subparagraph (a)(2)
-Publisher FASB
-URI https://asc.fasb.org/1943274/2147481687/323-10-50-3
Reference 6: http://www.xbrl.org/2003/role/disclosureRef
-Topic 323
-SubTopic 10
-Name Accounting Standards Codification
-Section 50
-Paragraph 3
-Subparagraph (b)
-Publisher FASB
-URI https://asc.fasb.org/1943274/2147481687/323-10-50-3
| Name: |
us-gaap_ScheduleOfEquityMethodInvestmentsLineItems |
| Namespace Prefix: |
us-gaap_ |
| Data Type: |
xbrli:stringItemType |
| Balance Type: |
na |
| Period Type: |
duration |
|
| X |
- Details
| Name: |
srt_ProductOrServiceAxis=us-gaap_LandMember |
| Namespace Prefix: |
|
| Data Type: |
na |
| Balance Type: |
|
| Period Type: |
|
|
| X |
- Details
| Name: |
us-gaap_EquityMethodInvestmentNonconsolidatedInvesteeAxis=fph_GreatParkVentureMember |
| Namespace Prefix: |
|
| Data Type: |
na |
| Balance Type: |
|
| Period Type: |
|
|
| X |
- Details
| Name: |
srt_ProductOrServiceAxis=fph_HomesitesSoldMember |
| Namespace Prefix: |
|
| Data Type: |
na |
| Balance Type: |
|
| Period Type: |
|
|
| X |
- Details
| Name: |
us-gaap_EquityMethodInvestmentNonconsolidatedInvesteeAxis=fph_GatewayCommercialVentureLLCAMember |
| Namespace Prefix: |
|
| Data Type: |
na |
| Balance Type: |
|
| Period Type: |
|
|
| X |
- Details
| Name: |
srt_ProductOrServiceAxis=fph_RentalRevenueMember |
| Namespace Prefix: |
|
| Data Type: |
na |
| Balance Type: |
|
| Period Type: |
|
|
| X |
- Details
| Name: |
srt_ScheduleOfEquityMethodInvestmentEquityMethodInvesteeNameAxis=fph_GreatParkVentureMember |
| Namespace Prefix: |
|
| Data Type: |
na |
| Balance Type: |
|
| Period Type: |
|
|
| X |
- Details
| Name: |
srt_ScheduleOfEquityMethodInvestmentEquityMethodInvesteeNameAxis=fph_GatewayCommercialVentureLLCAMember |
| Namespace Prefix: |
|
| Data Type: |
na |
| Balance Type: |
|
| Period Type: |
|
|
| X |
- Details
| Name: |
us-gaap_IncomeStatementBalanceSheetAndAdditionalDisclosuresByDisposalGroupsIncludingDiscontinuedOperationsAxis=fph_FivePointOfficeVentureHoldingsILLCAcquisitionMember |
| Namespace Prefix: |
|
| Data Type: |
na |
| Balance Type: |
|
| Period Type: |
|
|
| X |
- Details
| Name: |
srt_ScheduleOfEquityMethodInvestmentEquityMethodInvesteeNameAxis=fph_ValenciaLandbankVentureMember |
| Namespace Prefix: |
|
| Data Type: |
na |
| Balance Type: |
|
| Period Type: |
|
|
v3.24.2
Investment In Unconsolidated Entities - Summarized Statement of Operations (Details) - USD ($)
$ in Thousands |
3 Months Ended |
6 Months Ended |
Jun. 30, 2024 |
Jun. 30, 2023 |
Jun. 30, 2024 |
Jun. 30, 2023 |
| Add equity in earnings (losses) from unconsolidated entities |
|
|
|
|
| Revenue from customers |
$ 50,757
|
$ 20,902
|
$ 60,090
|
$ 26,095
|
| Other costs and expenses |
(25,379)
|
(24,190)
|
(43,181)
|
(41,480)
|
| Net income |
38,227
|
50,555
|
44,310
|
40,821
|
| The Company’s share of net income |
14,722
|
23,571
|
17,048
|
19,035
|
| Equity in earnings (losses) from unconsolidated entities |
$ 15,498
|
$ 52,128
|
33,084
|
53,176
|
| Great Park Venture |
|
|
|
|
| Add equity in earnings (losses) from unconsolidated entities |
|
|
|
|
| The Company’s share of net income |
|
|
36,773
|
64,088
|
| Basis difference amortization, net |
|
|
(3,643)
|
(10,604)
|
| Equity in earnings (losses) from unconsolidated entities |
|
|
33,130
|
53,484
|
| Gateway Commercial Venture |
|
|
|
|
| Add equity in earnings (losses) from unconsolidated entities |
|
|
|
|
| Equity in earnings (losses) from unconsolidated entities |
|
|
(305)
|
(667)
|
| Great Park Venture |
|
|
|
|
| Add equity in earnings (losses) from unconsolidated entities |
|
|
|
|
| Other costs and expenses |
|
|
(75,046)
|
(32,547)
|
| Net income |
|
|
98,061
|
170,900
|
| Great Park Venture | Land sales and land sales—related party |
|
|
|
|
| Add equity in earnings (losses) from unconsolidated entities |
|
|
|
|
| Revenue from customers |
|
|
232,081
|
369,196
|
| Great Park Venture | Land sales |
|
|
|
|
| Add equity in earnings (losses) from unconsolidated entities |
|
|
|
|
| Rental operating and other expenses |
|
|
(58,974)
|
(165,749)
|
| Gateway Commercial Venture |
|
|
|
|
| Add equity in earnings (losses) from unconsolidated entities |
|
|
|
|
| Revenue from customers |
|
|
4,773
|
4,175
|
| Rental operating and other expenses |
|
|
(1,787)
|
(1,967)
|
| Depreciation and amortization |
|
|
(2,008)
|
(1,989)
|
| Interest expense |
|
|
(1,384)
|
(1,108)
|
| The Company’s share of net income |
|
|
$ (406)
|
$ (889)
|
| X |
- DefinitionEquity Method Investment, Difference Between Carrying Amount and Underlying Equity, Accretion (Amortization)
| Name: |
fph_EquityMethodInvestmentDifferenceBetweenCarryingAmountAndUnderlyingEquityAccretionAmortization |
| Namespace Prefix: |
fph_ |
| Data Type: |
xbrli:monetaryItemType |
| Balance Type: |
credit |
| Period Type: |
duration |
|
| X |
- DefinitionThe aggregate costs related to goods produced and sold and services rendered by an entity during the reporting period. This excludes costs incurred during the reporting period related to financial services rendered and other revenue generating activities. Reference 1: http://fasb.org/us-gaap/role/ref/legacyRef
-Topic 220
-SubTopic 10
-Name Accounting Standards Codification
-Section S99
-Paragraph 2
-Subparagraph (SX 210.5-03(2)(d))
-Publisher FASB
-URI https://asc.fasb.org/1943274/2147483621/220-10-S99-2
Reference 2: http://fasb.org/us-gaap/role/ref/legacyRef
-Topic 220
-SubTopic 10
-Name Accounting Standards Codification
-Section S99
-Paragraph 2
-Subparagraph (SX 210.5-03(2)(a))
-Publisher FASB
-URI https://asc.fasb.org/1943274/2147483621/220-10-S99-2
Reference 3: http://www.xbrl.org/2003/role/disclosureRef
-Topic 924
-SubTopic 10
-Name Accounting Standards Codification
-Section S99
-Paragraph 1
-Subparagraph (SAB Topic 11.L)
-Publisher FASB
-URI https://asc.fasb.org/1943274/2147479941/924-10-S99-1
| Name: |
us-gaap_CostOfGoodsAndServicesSold |
| Namespace Prefix: |
us-gaap_ |
| Data Type: |
xbrli:monetaryItemType |
| Balance Type: |
debit |
| Period Type: |
duration |
|
| X |
- DefinitionAmount of expense for allocation of cost of tangible and intangible assets over their useful lives directly used in production of good and rendering of service. Reference 1: http://www.xbrl.org/2009/role/commonPracticeRef
-Topic 220
-SubTopic 10
-Name Accounting Standards Codification
-Section S99
-Paragraph 2
-Subparagraph (SX 210.5-03(2))
-Publisher FASB
-URI https://asc.fasb.org/1943274/2147483621/220-10-S99-2
| Name: |
us-gaap_CostOfGoodsAndServicesSoldDepreciationAndAmortization |
| Namespace Prefix: |
us-gaap_ |
| Data Type: |
xbrli:monetaryItemType |
| Balance Type: |
debit |
| Period Type: |
duration |
|
| X |
- DefinitionTotal costs of sales and operating expenses for the period. Reference 1: http://fasb.org/us-gaap/role/ref/legacyRef
-Topic 220
-SubTopic 10
-Name Accounting Standards Codification
-Section S99
-Paragraph 2
-Subparagraph (SX 210.5-03)
-Publisher FASB
-URI https://asc.fasb.org/1943274/2147483621/220-10-S99-2
| Name: |
us-gaap_CostsAndExpenses |
| Namespace Prefix: |
us-gaap_ |
| Data Type: |
xbrli:monetaryItemType |
| Balance Type: |
debit |
| Period Type: |
duration |
|
| X |
- DefinitionAmount of income (loss) for proportionate share of equity method investee's income (loss). Reference 1: http://fasb.org/us-gaap/role/ref/legacyRef
-Name Accounting Standards Codification
-Section 45
-Paragraph 28
-Subparagraph (b)
-SubTopic 10
-Topic 230
-Publisher FASB
-URI https://asc.fasb.org/1943274/2147482740/230-10-45-28
Reference 2: http://www.xbrl.org/2003/role/disclosureRef
-Topic 270
-SubTopic 10
-Name Accounting Standards Codification
-Section 50
-Paragraph 1
-Subparagraph (i)
-Publisher FASB
-URI https://asc.fasb.org/1943274/2147482964/270-10-50-1
Reference 3: http://www.xbrl.org/2003/role/disclosureRef
-Topic 280
-SubTopic 10
-Name Accounting Standards Codification
-Section 50
-Paragraph 32
-Subparagraph (ee)
-Publisher FASB
-URI https://asc.fasb.org/1943274/2147482810/280-10-50-32
Reference 4: http://www.xbrl.org/2003/role/disclosureRef
-Topic 944
-SubTopic 220
-Name Accounting Standards Codification
-Section S99
-Paragraph 1
-Subparagraph (SX 210.7-04(10))
-Publisher FASB
-URI https://asc.fasb.org/1943274/2147477250/944-220-S99-1
Reference 5: http://www.xbrl.org/2003/role/disclosureRef
-Topic 323
-SubTopic 10
-Name Accounting Standards Codification
-Section 45
-Paragraph 1
-Publisher FASB
-URI https://asc.fasb.org/1943274/2147481664/323-10-45-1
Reference 6: http://www.xbrl.org/2003/role/disclosureRef
-Topic 280
-SubTopic 10
-Name Accounting Standards Codification
-Section 50
-Paragraph 22
-Subparagraph (g)
-Publisher FASB
-URI https://asc.fasb.org/1943274/2147482810/280-10-50-22
Reference 7: http://fasb.org/us-gaap/role/ref/legacyRef
-Topic 220
-SubTopic 10
-Name Accounting Standards Codification
-Section S99
-Paragraph 2
-Subparagraph (SX 210.5-03(12))
-Publisher FASB
-URI https://asc.fasb.org/1943274/2147483621/220-10-S99-2
Reference 8: http://fasb.org/us-gaap/role/ref/legacyRef
-Topic 942
-SubTopic 220
-Name Accounting Standards Codification
-Section S99
-Paragraph 1
-Subparagraph (SX 210.9-04(13)(f))
-Publisher FASB
-URI https://asc.fasb.org/1943274/2147478524/942-220-S99-1
| Name: |
us-gaap_IncomeLossFromEquityMethodInvestments |
| Namespace Prefix: |
us-gaap_ |
| Data Type: |
xbrli:monetaryItemType |
| Balance Type: |
credit |
| Period Type: |
duration |
|
| X |
- DefinitionAmount of interest expense classified as operating and nonoperating. Includes, but is not limited to, cost of borrowing accounted for as interest expense. Reference 1: http://www.xbrl.org/2003/role/disclosureRef
-Topic 280
-SubTopic 10
-Name Accounting Standards Codification
-Section 50
-Paragraph 22
-Subparagraph (d)
-Publisher FASB
-URI https://asc.fasb.org/1943274/2147482810/280-10-50-22
Reference 2: http://www.xbrl.org/2003/role/exampleRef
-Topic 280
-SubTopic 10
-Name Accounting Standards Codification
-Section 55
-Paragraph 48
-Publisher FASB
-URI https://asc.fasb.org/1943274/2147482785/280-10-55-48
Reference 3: http://www.xbrl.org/2003/role/exampleRef
-Topic 280
-SubTopic 10
-Name Accounting Standards Codification
-Section 55
-Paragraph 49
-Publisher FASB
-URI https://asc.fasb.org/1943274/2147482785/280-10-55-49
Reference 4: http://www.xbrl.org/2003/role/disclosureRef
-Topic 270
-SubTopic 10
-Name Accounting Standards Codification
-Section 50
-Paragraph 1
-Subparagraph (i)
-Publisher FASB
-URI https://asc.fasb.org/1943274/2147482964/270-10-50-1
Reference 5: http://www.xbrl.org/2003/role/disclosureRef
-Topic 280
-SubTopic 10
-Name Accounting Standards Codification
-Section 50
-Paragraph 32
-Subparagraph (ee)
-Publisher FASB
-URI https://asc.fasb.org/1943274/2147482810/280-10-50-32
Reference 6: http://www.xbrl.org/2003/role/disclosureRef
-Topic 280
-SubTopic 10
-Name Accounting Standards Codification
-Section 50
-Paragraph 24
-Publisher FASB
-URI https://asc.fasb.org/1943274/2147482810/280-10-50-24
Reference 7: http://www.xbrl.org/2003/role/disclosureRef
-Topic 280
-SubTopic 10
-Name Accounting Standards Codification
-Section 50
-Paragraph 22
-Publisher FASB
-URI https://asc.fasb.org/1943274/2147482810/280-10-50-22
Reference 8: http://www.xbrl.org/2003/role/disclosureRef
-Topic 835
-SubTopic 20
-Name Accounting Standards Codification
-Section 50
-Paragraph 1
-Subparagraph (a)
-Publisher FASB
-URI https://asc.fasb.org/1943274/2147483013/835-20-50-1
| Name: |
us-gaap_InterestExpense |
| Namespace Prefix: |
us-gaap_ |
| Data Type: |
xbrli:monetaryItemType |
| Balance Type: |
debit |
| Period Type: |
duration |
|
| X |
- DefinitionThe portion of profit or loss for the period, net of income taxes, which is attributable to the parent. Reference 1: http://www.xbrl.org/2003/role/disclosureRef
-Topic 250
-SubTopic 10
-Name Accounting Standards Codification
-Section 50
-Paragraph 6
-Publisher FASB
-URI https://asc.fasb.org/1943274/2147483443/250-10-50-6
Reference 2: http://www.xbrl.org/2003/role/disclosureRef
-Topic 250
-SubTopic 10
-Name Accounting Standards Codification
-Section 50
-Paragraph 9
-Publisher FASB
-URI https://asc.fasb.org/1943274/2147483443/250-10-50-9
Reference 3: http://www.xbrl.org/2003/role/disclosureRef
-Topic 805
-SubTopic 60
-Name Accounting Standards Codification
-Section 65
-Paragraph 1
-Subparagraph (g)
-Publisher FASB
-URI https://asc.fasb.org/1943274/2147476176/805-60-65-1
Reference 4: http://www.xbrl.org/2003/role/disclosureRef
-Topic 740
-SubTopic 323
-Name Accounting Standards Codification
-Section 65
-Paragraph 2
-Subparagraph (g)(3)
-Publisher FASB
-URI https://asc.fasb.org/1943274/2147478666/740-323-65-2
Reference 5: http://fasb.org/us-gaap/role/ref/legacyRef
-Topic 220
-SubTopic 10
-Name Accounting Standards Codification
-Section S99
-Paragraph 2
-Subparagraph (SX 210.5-03(20))
-Publisher FASB
-URI https://asc.fasb.org/1943274/2147483621/220-10-S99-2
Reference 6: http://www.xbrl.org/2003/role/disclosureRef
-Topic 235
-SubTopic 10
-Name Accounting Standards Codification
-Section S99
-Paragraph 1
-Subparagraph (SX 210.4-08(g)(1)(ii))
-Publisher FASB
-URI https://asc.fasb.org/1943274/2147480678/235-10-S99-1
Reference 7: http://www.xbrl.org/2003/role/disclosureRef
-Topic 323
-SubTopic 10
-Name Accounting Standards Codification
-Section 50
-Paragraph 3
-Subparagraph (c)
-Publisher FASB
-URI https://asc.fasb.org/1943274/2147481687/323-10-50-3
Reference 8: http://www.xbrl.org/2003/role/disclosureRef
-Topic 825
-SubTopic 10
-Name Accounting Standards Codification
-Section 50
-Paragraph 28
-Subparagraph (f)
-Publisher FASB
-URI https://asc.fasb.org/1943274/2147482907/825-10-50-28
Reference 9: http://www.xbrl.org/2003/role/disclosureRef
-Topic 220
-SubTopic 10
-Name Accounting Standards Codification
-Section 50
-Paragraph 6
-Publisher FASB
-URI https://asc.fasb.org/1943274/2147482765/220-10-50-6
Reference 10: http://www.xbrl.org/2003/role/disclosureRef
-Topic 250
-SubTopic 10
-Name Accounting Standards Codification
-Section 50
-Paragraph 3
-Publisher FASB
-URI https://asc.fasb.org/1943274/2147483443/250-10-50-3
Reference 11: http://www.xbrl.org/2003/role/disclosureRef
-Topic 250
-SubTopic 10
-Name Accounting Standards Codification
-Section 50
-Paragraph 1
-Subparagraph (b)(2)
-Publisher FASB
-URI https://asc.fasb.org/1943274/2147483443/250-10-50-1
Reference 12: http://www.xbrl.org/2003/role/disclosureRef
-Topic 815
-SubTopic 40
-Name Accounting Standards Codification
-Section 65
-Paragraph 1
-Subparagraph (f)
-Publisher FASB
-URI https://asc.fasb.org/1943274/2147480175/815-40-65-1
Reference 13: http://www.xbrl.org/2003/role/disclosureRef
-Topic 250
-SubTopic 10
-Name Accounting Standards Codification
-Section 50
-Paragraph 8
-Publisher FASB
-URI https://asc.fasb.org/1943274/2147483443/250-10-50-8
Reference 14: http://www.xbrl.org/2003/role/disclosureRef
-Topic 250
-SubTopic 10
-Name Accounting Standards Codification
-Section 50
-Paragraph 11
-Subparagraph (a)
-Publisher FASB
-URI https://asc.fasb.org/1943274/2147483443/250-10-50-11
Reference 15: http://www.xbrl.org/2003/role/disclosureRef
-Topic 250
-SubTopic 10
-Name Accounting Standards Codification
-Section 50
-Paragraph 11
-Subparagraph (b)
-Publisher FASB
-URI https://asc.fasb.org/1943274/2147483443/250-10-50-11
Reference 16: http://www.xbrl.org/2003/role/disclosureRef
-Topic 250
-SubTopic 10
-Name Accounting Standards Codification
-Section 50
-Paragraph 4
-Publisher FASB
-URI https://asc.fasb.org/1943274/2147483443/250-10-50-4
Reference 17: http://www.xbrl.org/2003/role/exampleRef
-Topic 946
-SubTopic 830
-Name Accounting Standards Codification
-Section 55
-Paragraph 10
-Publisher FASB
-URI https://asc.fasb.org/1943274/2147479168/946-830-55-10
Reference 18: http://www.xbrl.org/2003/role/disclosureRef
-Topic 946
-SubTopic 220
-Name Accounting Standards Codification
-Section 45
-Paragraph 7
-Publisher FASB
-URI https://asc.fasb.org/1943274/2147479105/946-220-45-7
Reference 19: http://www.xbrl.org/2003/role/disclosureRef
-Topic 944
-SubTopic 220
-Name Accounting Standards Codification
-Section S99
-Paragraph 1
-Subparagraph (SX 210.7-04(18))
-Publisher FASB
-URI https://asc.fasb.org/1943274/2147477250/944-220-S99-1
Reference 20: http://www.xbrl.org/2003/role/disclosureRef
-Topic 946
-SubTopic 220
-Name Accounting Standards Codification
-Section S99
-Paragraph 1
-Subparagraph (SX 210.6-07(9))
-Publisher FASB
-URI https://asc.fasb.org/1943274/2147479134/946-220-S99-1
Reference 21: http://www.xbrl.org/2003/role/disclosureRef
-Topic 946
-SubTopic 220
-Name Accounting Standards Codification
-Section S99
-Paragraph 3
-Subparagraph (SX 210.6-09(1)(d))
-Publisher FASB
-URI https://asc.fasb.org/1943274/2147479134/946-220-S99-3
Reference 22: http://www.xbrl.org/2003/role/disclosureRef
-Topic 470
-SubTopic 10
-Name Accounting Standards Codification
-Section S99
-Paragraph 1A
-Subparagraph (SX 210.13-01(a)(4)(i))
-Publisher FASB
-URI https://asc.fasb.org/1943274/2147480097/470-10-S99-1A
Reference 23: http://www.xbrl.org/2009/role/commonPracticeRef
-Topic 470
-SubTopic 10
-Name Accounting Standards Codification
-Section S99
-Paragraph 1A
-Subparagraph (SX 210.13-01(a)(4)(ii))
-Publisher FASB
-URI https://asc.fasb.org/1943274/2147480097/470-10-S99-1A
Reference 24: http://www.xbrl.org/2003/role/disclosureRef
-Topic 470
-SubTopic 10
-Name Accounting Standards Codification
-Section S99
-Paragraph 1A
-Subparagraph (SX 210.13-01(a)(4)(iii)(A))
-Publisher FASB
-URI https://asc.fasb.org/1943274/2147480097/470-10-S99-1A
Reference 25: http://www.xbrl.org/2003/role/disclosureRef
-Topic 470
-SubTopic 10
-Name Accounting Standards Codification
-Section S99
-Paragraph 1A
-Subparagraph (SX 210.13-01(a)(4)(iv))
-Publisher FASB
-URI https://asc.fasb.org/1943274/2147480097/470-10-S99-1A
Reference 26: http://www.xbrl.org/2003/role/disclosureRef
-Topic 470
-SubTopic 10
-Name Accounting Standards Codification
-Section S99
-Paragraph 1A
-Subparagraph (SX 210.13-01(a)(5))
-Publisher FASB
-URI https://asc.fasb.org/1943274/2147480097/470-10-S99-1A
Reference 27: http://www.xbrl.org/2003/role/disclosureRef
-Topic 470
-SubTopic 10
-Name Accounting Standards Codification
-Section S99
-Paragraph 1B
-Subparagraph (SX 210.13-02(a)(4)(i))
-Publisher FASB
-URI https://asc.fasb.org/1943274/2147480097/470-10-S99-1B
Reference 28: http://www.xbrl.org/2003/role/disclosureRef
-Topic 470
-SubTopic 10
-Name Accounting Standards Codification
-Section S99
-Paragraph 1B
-Subparagraph (SX 210.13-02(a)(4)(iii)(A))
-Publisher FASB
-URI https://asc.fasb.org/1943274/2147480097/470-10-S99-1B
Reference 29: http://www.xbrl.org/2003/role/disclosureRef
-Topic 470
-SubTopic 10
-Name Accounting Standards Codification
-Section S99
-Paragraph 1B
-Subparagraph (SX 210.13-02(a)(4)(iii)(B))
-Publisher FASB
-URI https://asc.fasb.org/1943274/2147480097/470-10-S99-1B
Reference 30: http://www.xbrl.org/2003/role/disclosureRef
-Topic 470
-SubTopic 10
-Name Accounting Standards Codification
-Section S99
-Paragraph 1B
-Subparagraph (SX 210.13-02(a)(4)(iv))
-Publisher FASB
-URI https://asc.fasb.org/1943274/2147480097/470-10-S99-1B
Reference 31: http://www.xbrl.org/2003/role/disclosureRef
-Topic 470
-SubTopic 10
-Name Accounting Standards Codification
-Section S99
-Paragraph 1B
-Subparagraph (SX 210.13-02(a)(5))
-Publisher FASB
-URI https://asc.fasb.org/1943274/2147480097/470-10-S99-1B
Reference 32: http://www.xbrl.org/2003/role/disclosureRef
-Topic 260
-SubTopic 10
-Name Accounting Standards Codification
-Section 45
-Paragraph 60B
-Subparagraph (a)
-Publisher FASB
-URI https://asc.fasb.org/1943274/2147482689/260-10-45-60B
Reference 33: http://www.xbrl.org/2003/role/disclosureRef
-Topic 205
-SubTopic 20
-Name Accounting Standards Codification
-Section 50
-Paragraph 7
-Publisher FASB
-URI https://asc.fasb.org/1943274/2147483499/205-20-50-7
Reference 34: http://fasb.org/us-gaap/role/ref/legacyRef
-Topic 230
-SubTopic 10
-Name Accounting Standards Codification
-Section 45
-Paragraph 28
-Publisher FASB
-URI https://asc.fasb.org/1943274/2147482740/230-10-45-28
Reference 35: http://www.xbrl.org/2003/role/disclosureRef
-Topic 220
-SubTopic 10
-Name Accounting Standards Codification
-Section 45
-Paragraph 1A
-Subparagraph (a)
-Publisher FASB
-URI https://asc.fasb.org/1943274/2147482790/220-10-45-1A
Reference 36: http://www.xbrl.org/2003/role/disclosureRef
-Topic 220
-SubTopic 10
-Name Accounting Standards Codification
-Section 45
-Paragraph 1B
-Subparagraph (a)
-Publisher FASB
-URI https://asc.fasb.org/1943274/2147482790/220-10-45-1B
Reference 37: http://fasb.org/us-gaap/role/ref/legacyRef
-Topic 942
-SubTopic 220
-Name Accounting Standards Codification
-Section S99
-Paragraph 1
-Subparagraph (SX 210.9-04(22))
-Publisher FASB
-URI https://asc.fasb.org/1943274/2147478524/942-220-S99-1
| Name: |
us-gaap_NetIncomeLoss |
| Namespace Prefix: |
us-gaap_ |
| Data Type: |
xbrli:monetaryItemType |
| Balance Type: |
credit |
| Period Type: |
duration |
|
| X |
- DefinitionThe consolidated profit or loss for the period, net of income taxes, including the portion attributable to the noncontrolling interest. Reference 1: http://www.xbrl.org/2003/role/disclosureRef
-Topic 250
-SubTopic 10
-Name Accounting Standards Codification
-Section 50
-Paragraph 6
-Publisher FASB
-URI https://asc.fasb.org/1943274/2147483443/250-10-50-6
Reference 2: http://www.xbrl.org/2003/role/disclosureRef
-Topic 250
-SubTopic 10
-Name Accounting Standards Codification
-Section 50
-Paragraph 9
-Publisher FASB
-URI https://asc.fasb.org/1943274/2147483443/250-10-50-9
Reference 3: http://www.xbrl.org/2003/role/disclosureRef
-Topic 805
-SubTopic 60
-Name Accounting Standards Codification
-Section 65
-Paragraph 1
-Subparagraph (g)
-Publisher FASB
-URI https://asc.fasb.org/1943274/2147476176/805-60-65-1
Reference 4: http://www.xbrl.org/2003/role/disclosureRef
-Topic 740
-SubTopic 323
-Name Accounting Standards Codification
-Section 65
-Paragraph 2
-Subparagraph (g)(3)
-Publisher FASB
-URI https://asc.fasb.org/1943274/2147478666/740-323-65-2
Reference 5: http://www.xbrl.org/2003/role/disclosureRef
-Topic 235
-SubTopic 10
-Name Accounting Standards Codification
-Section S99
-Paragraph 1
-Subparagraph (SX 210.4-08(g)(1)(ii))
-Publisher FASB
-URI https://asc.fasb.org/1943274/2147480678/235-10-S99-1
Reference 6: http://www.xbrl.org/2003/role/disclosureRef
-Topic 323
-SubTopic 10
-Name Accounting Standards Codification
-Section 50
-Paragraph 3
-Subparagraph (c)
-Publisher FASB
-URI https://asc.fasb.org/1943274/2147481687/323-10-50-3
Reference 7: http://www.xbrl.org/2003/role/disclosureRef
-Topic 825
-SubTopic 10
-Name Accounting Standards Codification
-Section 50
-Paragraph 28
-Subparagraph (f)
-Publisher FASB
-URI https://asc.fasb.org/1943274/2147482907/825-10-50-28
Reference 8: http://www.xbrl.org/2003/role/disclosureRef
-Topic 250
-SubTopic 10
-Name Accounting Standards Codification
-Section 50
-Paragraph 1
-Subparagraph (b)(2)
-Publisher FASB
-URI https://asc.fasb.org/1943274/2147483443/250-10-50-1
Reference 9: http://www.xbrl.org/2003/role/disclosureRef
-Topic 815
-SubTopic 40
-Name Accounting Standards Codification
-Section 65
-Paragraph 1
-Subparagraph (f)
-Publisher FASB
-URI https://asc.fasb.org/1943274/2147480175/815-40-65-1
Reference 10: http://www.xbrl.org/2003/role/disclosureRef
-Topic 250
-SubTopic 10
-Name Accounting Standards Codification
-Section 50
-Paragraph 8
-Publisher FASB
-URI https://asc.fasb.org/1943274/2147483443/250-10-50-8
Reference 11: http://www.xbrl.org/2003/role/exampleRef
-Topic 946
-SubTopic 830
-Name Accounting Standards Codification
-Section 55
-Paragraph 11
-Publisher FASB
-URI https://asc.fasb.org/1943274/2147479168/946-830-55-11
Reference 12: http://www.xbrl.org/2003/role/disclosureRef
-Topic 946
-SubTopic 205
-Name Accounting Standards Codification
-Section 45
-Paragraph 3
-Subparagraph (a)
-Publisher FASB
-URI https://asc.fasb.org/1943274/2147478009/946-205-45-3
Reference 13: http://www.xbrl.org/2003/role/disclosureRef
-Topic 946
-SubTopic 220
-Name Accounting Standards Codification
-Section 45
-Paragraph 7
-Publisher FASB
-URI https://asc.fasb.org/1943274/2147479105/946-220-45-7
Reference 14: http://www.xbrl.org/2003/role/disclosureRef
-Topic 944
-SubTopic 220
-Name Accounting Standards Codification
-Section S99
-Paragraph 1
-Subparagraph (SX 210.7-04(16))
-Publisher FASB
-URI https://asc.fasb.org/1943274/2147477250/944-220-S99-1
Reference 15: http://www.xbrl.org/2003/role/disclosureRef
-Topic 946
-SubTopic 220
-Name Accounting Standards Codification
-Section S99
-Paragraph 1
-Subparagraph (SX 210.6-07(9))
-Publisher FASB
-URI https://asc.fasb.org/1943274/2147479134/946-220-S99-1
Reference 16: http://www.xbrl.org/2003/role/disclosureRef
-Topic 946
-SubTopic 220
-Name Accounting Standards Codification
-Section S99
-Paragraph 3
-Subparagraph (SX 210.6-09(1)(d))
-Publisher FASB
-URI https://asc.fasb.org/1943274/2147479134/946-220-S99-3
Reference 17: http://www.xbrl.org/2003/role/disclosureRef
-Topic 810
-SubTopic 10
-Name Accounting Standards Codification
-Section 45
-Paragraph 19
-Publisher FASB
-URI https://asc.fasb.org/1943274/2147481231/810-10-45-19
Reference 18: http://www.xbrl.org/2009/role/commonPracticeRef
-Topic 220
-SubTopic 10
-Name Accounting Standards Codification
-Section 50
-Paragraph 6
-Publisher FASB
-URI https://asc.fasb.org/1943274/2147482765/220-10-50-6
Reference 19: http://www.xbrl.org/2003/role/disclosureRef
-Topic 470
-SubTopic 10
-Name Accounting Standards Codification
-Section S99
-Paragraph 1A
-Subparagraph (SX 210.13-01(a)(4)(i))
-Publisher FASB
-URI https://asc.fasb.org/1943274/2147480097/470-10-S99-1A
Reference 20: http://www.xbrl.org/2009/role/commonPracticeRef
-Topic 470
-SubTopic 10
-Name Accounting Standards Codification
-Section S99
-Paragraph 1A
-Subparagraph (SX 210.13-01(a)(4)(ii))
-Publisher FASB
-URI https://asc.fasb.org/1943274/2147480097/470-10-S99-1A
Reference 21: http://www.xbrl.org/2003/role/disclosureRef
-Topic 470
-SubTopic 10
-Name Accounting Standards Codification
-Section S99
-Paragraph 1A
-Subparagraph (SX 210.13-01(a)(4)(iii)(A))
-Publisher FASB
-URI https://asc.fasb.org/1943274/2147480097/470-10-S99-1A
Reference 22: http://www.xbrl.org/2003/role/disclosureRef
-Topic 470
-SubTopic 10
-Name Accounting Standards Codification
-Section S99
-Paragraph 1A
-Subparagraph (SX 210.13-01(a)(4)(iv))
-Publisher FASB
-URI https://asc.fasb.org/1943274/2147480097/470-10-S99-1A
Reference 23: http://www.xbrl.org/2003/role/disclosureRef
-Topic 470
-SubTopic 10
-Name Accounting Standards Codification
-Section S99
-Paragraph 1A
-Subparagraph (SX 210.13-01(a)(5))
-Publisher FASB
-URI https://asc.fasb.org/1943274/2147480097/470-10-S99-1A
Reference 24: http://www.xbrl.org/2003/role/disclosureRef
-Topic 470
-SubTopic 10
-Name Accounting Standards Codification
-Section S99
-Paragraph 1B
-Subparagraph (SX 210.13-02(a)(4)(i))
-Publisher FASB
-URI https://asc.fasb.org/1943274/2147480097/470-10-S99-1B
Reference 25: http://www.xbrl.org/2003/role/disclosureRef
-Topic 470
-SubTopic 10
-Name Accounting Standards Codification
-Section S99
-Paragraph 1B
-Subparagraph (SX 210.13-02(a)(4)(iii)(A))
-Publisher FASB
-URI https://asc.fasb.org/1943274/2147480097/470-10-S99-1B
Reference 26: http://www.xbrl.org/2003/role/disclosureRef
-Topic 470
-SubTopic 10
-Name Accounting Standards Codification
-Section S99
-Paragraph 1B
-Subparagraph (SX 210.13-02(a)(4)(iii)(B))
-Publisher FASB
-URI https://asc.fasb.org/1943274/2147480097/470-10-S99-1B
Reference 27: http://www.xbrl.org/2003/role/disclosureRef
-Topic 470
-SubTopic 10
-Name Accounting Standards Codification
-Section S99
-Paragraph 1B
-Subparagraph (SX 210.13-02(a)(4)(iv))
-Publisher FASB
-URI https://asc.fasb.org/1943274/2147480097/470-10-S99-1B
Reference 28: http://www.xbrl.org/2003/role/disclosureRef
-Topic 470
-SubTopic 10
-Name Accounting Standards Codification
-Section S99
-Paragraph 1B
-Subparagraph (SX 210.13-02(a)(5))
-Publisher FASB
-URI https://asc.fasb.org/1943274/2147480097/470-10-S99-1B
Reference 29: http://www.xbrl.org/2003/role/disclosureRef
-Topic 942
-SubTopic 235
-Name Accounting Standards Codification
-Section S99
-Paragraph 1
-Subparagraph (SX 210.9-05(b)(2))
-Publisher FASB
-URI https://asc.fasb.org/1943274/2147477314/942-235-S99-1
Reference 30: http://www.xbrl.org/2003/role/disclosureRef
-Topic 205
-SubTopic 20
-Name Accounting Standards Codification
-Section 50
-Paragraph 7
-Publisher FASB
-URI https://asc.fasb.org/1943274/2147483499/205-20-50-7
Reference 31: http://www.xbrl.org/2003/role/exampleRef
-Topic 810
-SubTopic 10
-Name Accounting Standards Codification
-Section 55
-Paragraph 4J
-Publisher FASB
-URI https://asc.fasb.org/1943274/2147481175/810-10-55-4J
Reference 32: http://www.xbrl.org/2003/role/exampleRef
-Topic 810
-SubTopic 10
-Name Accounting Standards Codification
-Section 55
-Paragraph 4K
-Publisher FASB
-URI https://asc.fasb.org/1943274/2147481175/810-10-55-4K
Reference 33: http://www.xbrl.org/2003/role/disclosureRef
-Topic 220
-SubTopic 10
-Name Accounting Standards Codification
-Section 45
-Paragraph 1A
-Subparagraph (a)
-Publisher FASB
-URI https://asc.fasb.org/1943274/2147482790/220-10-45-1A
Reference 34: http://www.xbrl.org/2003/role/disclosureRef
-Topic 220
-SubTopic 10
-Name Accounting Standards Codification
-Section 45
-Paragraph 1B
-Subparagraph (a)
-Publisher FASB
-URI https://asc.fasb.org/1943274/2147482790/220-10-45-1B
Reference 35: http://www.xbrl.org/2003/role/disclosureRef
-Topic 230
-SubTopic 10
-Name Accounting Standards Codification
-Section 45
-Paragraph 2
-Publisher FASB
-URI https://asc.fasb.org/1943274/2147482740/230-10-45-2
Reference 36: http://www.xbrl.org/2003/role/disclosureRef
-Topic 810
-SubTopic 10
-Name Accounting Standards Codification
-Section 50
-Paragraph 1A
-Subparagraph (a)(1)
-Publisher FASB
-URI https://asc.fasb.org/1943274/2147481203/810-10-50-1A
Reference 37: http://www.xbrl.org/2003/role/disclosureRef
-Topic 810
-SubTopic 10
-Name Accounting Standards Codification
-Section 50
-Paragraph 1A
-Subparagraph (c)(1)
-Publisher FASB
-URI https://asc.fasb.org/1943274/2147481203/810-10-50-1A
| Name: |
us-gaap_ProfitLoss |
| Namespace Prefix: |
us-gaap_ |
| Data Type: |
xbrli:monetaryItemType |
| Balance Type: |
credit |
| Period Type: |
duration |
|
| X |
- DefinitionAmount, excluding tax collected from customer, of revenue from satisfaction of performance obligation by transferring promised good or service to customer. Tax collected from customer is tax assessed by governmental authority that is both imposed on and concurrent with specific revenue-producing transaction, including, but not limited to, sales, use, value added and excise. Reference 1: http://www.xbrl.org/2003/role/disclosureRef
-Topic 280
-SubTopic 10
-Name Accounting Standards Codification
-Section 50
-Paragraph 41
-Subparagraph (a)
-Publisher FASB
-URI https://asc.fasb.org/1943274/2147482810/280-10-50-41
Reference 2: http://www.xbrl.org/2003/role/disclosureRef
-Topic 270
-SubTopic 10
-Name Accounting Standards Codification
-Section 50
-Paragraph 1
-Subparagraph (i)
-Publisher FASB
-URI https://asc.fasb.org/1943274/2147482964/270-10-50-1
Reference 3: http://www.xbrl.org/2003/role/disclosureRef
-Topic 280
-SubTopic 10
-Name Accounting Standards Codification
-Section 50
-Paragraph 32
-Subparagraph (ee)
-Publisher FASB
-URI https://asc.fasb.org/1943274/2147482810/280-10-50-32
Reference 4: http://fasb.org/us-gaap/role/ref/otherTransitionRef
-Topic 280
-SubTopic 10
-Name Accounting Standards Codification
-Section 50
-Paragraph 32
-Subparagraph (b)
-Publisher FASB
-URI https://asc.fasb.org/1943274/2147482810/280-10-50-32
Reference 5: http://fasb.org/us-gaap/role/ref/otherTransitionRef
-Topic 280
-SubTopic 10
-Name Accounting Standards Codification
-Section 50
-Paragraph 32
-Subparagraph (a)
-Publisher FASB
-URI https://asc.fasb.org/1943274/2147482810/280-10-50-32
Reference 6: http://www.xbrl.org/2003/role/disclosureRef
-Topic 924
-SubTopic 10
-Name Accounting Standards Codification
-Section S99
-Paragraph 1
-Subparagraph (SAB Topic 11.L)
-Publisher FASB
-URI https://asc.fasb.org/1943274/2147479941/924-10-S99-1
Reference 7: http://www.xbrl.org/2003/role/disclosureRef
-Topic 606
-SubTopic 10
-Name Accounting Standards Codification
-Section 50
-Paragraph 5
-Publisher FASB
-URI https://asc.fasb.org/1943274/2147479806/606-10-50-5
Reference 8: http://www.xbrl.org/2003/role/disclosureRef
-Topic 280
-SubTopic 10
-Name Accounting Standards Codification
-Section 50
-Paragraph 30
-Subparagraph (a)
-Publisher FASB
-URI https://asc.fasb.org/1943274/2147482810/280-10-50-30
Reference 9: http://www.xbrl.org/2003/role/disclosureRef
-Topic 280
-SubTopic 10
-Name Accounting Standards Codification
-Section 50
-Paragraph 42
-Publisher FASB
-URI https://asc.fasb.org/1943274/2147482810/280-10-50-42
Reference 10: http://www.xbrl.org/2003/role/disclosureRef
-Topic 280
-SubTopic 10
-Name Accounting Standards Codification
-Section 50
-Paragraph 22
-Subparagraph (b)
-Publisher FASB
-URI https://asc.fasb.org/1943274/2147482810/280-10-50-22
Reference 11: http://www.xbrl.org/2003/role/disclosureRef
-Topic 280
-SubTopic 10
-Name Accounting Standards Codification
-Section 50
-Paragraph 40
-Publisher FASB
-URI https://asc.fasb.org/1943274/2147482810/280-10-50-40
Reference 12: http://www.xbrl.org/2003/role/disclosureRef
-Topic 280
-SubTopic 10
-Name Accounting Standards Codification
-Section 50
-Paragraph 22
-Subparagraph (a)
-Publisher FASB
-URI https://asc.fasb.org/1943274/2147482810/280-10-50-22
Reference 13: http://www.xbrl.org/2003/role/disclosureRef
-Topic 606
-SubTopic 10
-Name Accounting Standards Codification
-Section 50
-Paragraph 4
-Subparagraph (a)
-Publisher FASB
-URI https://asc.fasb.org/1943274/2147479806/606-10-50-4
| Name: |
us-gaap_RevenueFromContractWithCustomerExcludingAssessedTax |
| Namespace Prefix: |
us-gaap_ |
| Data Type: |
xbrli:monetaryItemType |
| Balance Type: |
credit |
| Period Type: |
duration |
|
| X |
- Details
| Name: |
srt_ScheduleOfEquityMethodInvestmentEquityMethodInvesteeNameAxis=fph_GreatParkVentureMember |
| Namespace Prefix: |
|
| Data Type: |
na |
| Balance Type: |
|
| Period Type: |
|
|
| X |
- Details
| Name: |
srt_ScheduleOfEquityMethodInvestmentEquityMethodInvesteeNameAxis=fph_GatewayCommercialVentureLLCAMember |
| Namespace Prefix: |
|
| Data Type: |
na |
| Balance Type: |
|
| Period Type: |
|
|
| X |
- Details
| Name: |
us-gaap_EquityMethodInvestmentNonconsolidatedInvesteeAxis=fph_GreatParkVentureMember |
| Namespace Prefix: |
|
| Data Type: |
na |
| Balance Type: |
|
| Period Type: |
|
|
| X |
- Details
| Name: |
srt_ProductOrServiceAxis=fph_LandSalesAffiliatedEntityAndThirdPartyMember |
| Namespace Prefix: |
|
| Data Type: |
na |
| Balance Type: |
|
| Period Type: |
|
|
| X |
- Details
| Name: |
srt_ProductOrServiceAxis=fph_LandSalesMember |
| Namespace Prefix: |
|
| Data Type: |
na |
| Balance Type: |
|
| Period Type: |
|
|
| X |
- Details
| Name: |
us-gaap_EquityMethodInvestmentNonconsolidatedInvesteeAxis=fph_GatewayCommercialVentureLLCAMember |
| Namespace Prefix: |
|
| Data Type: |
na |
| Balance Type: |
|
| Period Type: |
|
|
v3.24.2
Investment In Unconsolidated Entities - Summarized Balance Sheet Data (Details) - USD ($)
$ in Thousands |
Jun. 30, 2024 |
Dec. 31, 2023 |
Jun. 30, 2023 |
Dec. 31, 2022 |
| ASSETS |
|
|
|
|
| Inventories |
$ 2,292,264
|
$ 2,213,479
|
|
|
| Cash and cash equivalents |
217,387
|
353,801
|
$ 193,203
|
|
| INTANGIBLE ASSET, NET—RELATED PARTY |
13,728
|
25,270
|
|
|
| Cash and restricted cash |
218,379
|
354,793
|
$ 194,195
|
$ 132,763
|
| TOTAL |
2,920,139
|
2,969,288
|
|
|
| LIABILITIES: |
|
|
|
|
| Accounts payable and other liabilities |
83,267
|
81,649
|
|
|
| Redeemable Legacy Interests |
593,211
|
591,606
|
|
|
| Capital (Percentage Interest) |
696,718
|
678,054
|
|
|
| Notes payable, net |
524,104
|
622,186
|
|
|
| Other |
74,173
|
78,074
|
|
|
| Members’ capital |
2,027,327
|
1,982,104
|
|
|
| TOTAL |
2,920,139
|
2,969,288
|
|
|
| The Company’s investment in the Great Park Venture |
237,777
|
252,816
|
|
|
| Great Park Venture |
|
|
|
|
| LIABILITIES: |
|
|
|
|
| The Company’s share of capital in Great Park Venture |
145,572
|
156,105
|
|
|
| Unamortized basis difference |
54,038
|
57,681
|
|
|
| The Company’s investment in the Great Park Venture |
199,610
|
213,786
|
|
|
| Gateway Commercial Venture |
|
|
|
|
| LIABILITIES: |
|
|
|
|
| The Company’s investment in the Great Park Venture |
37,476
|
37,781
|
|
|
| Great Park Venture |
|
|
|
|
| ASSETS |
|
|
|
|
| Inventories |
304,477
|
391,352
|
|
|
| Cash and cash equivalents |
145,363
|
61,054
|
|
|
| Other assets |
195,575
|
166,793
|
|
|
| TOTAL |
645,415
|
619,199
|
|
|
| LIABILITIES: |
|
|
|
|
| Accounts payable and other liabilities |
253,935
|
184,847
|
|
|
| Redeemable Legacy Interests |
3,293
|
18,075
|
|
|
| Capital (Percentage Interest) |
388,187
|
416,277
|
|
|
| TOTAL |
645,415
|
619,199
|
|
|
| Gateway Commercial Venture |
|
|
|
|
| ASSETS |
|
|
|
|
| INTANGIBLE ASSET, NET—RELATED PARTY |
74,711
|
76,719
|
|
|
| Cash and restricted cash |
6,706
|
5,574
|
|
|
| Other assets |
3,583
|
3,554
|
|
|
| TOTAL |
85,000
|
85,847
|
|
|
| LIABILITIES: |
|
|
|
|
| Notes payable, net |
28,745
|
28,850
|
|
|
| Other |
6,286
|
6,623
|
|
|
| Members’ capital |
49,969
|
50,374
|
|
|
| TOTAL |
$ 85,000
|
$ 85,847
|
|
|
| X |
- DefinitionAmount of liabilities incurred and payable to vendors for goods and services received, and accrued liabilities classified as other. Reference 1: http://www.xbrl.org/2003/role/disclosureRef
-Topic 946
-SubTopic 210
-Name Accounting Standards Codification
-Section S99
-Paragraph 1
-Subparagraph (SX 210.6-04(10)(d))
-Publisher FASB
-URI https://asc.fasb.org/1943274/2147479170/946-210-S99-1
| Name: |
us-gaap_AccountsPayableAndOtherAccruedLiabilities |
| Namespace Prefix: |
us-gaap_ |
| Data Type: |
xbrli:monetaryItemType |
| Balance Type: |
credit |
| Period Type: |
instant |
|
| X |
- DefinitionAmount of asset recognized for present right to economic benefit. Reference 1: http://www.xbrl.org/2003/role/exampleRef
-Topic 280
-SubTopic 10
-Name Accounting Standards Codification
-Section 55
-Paragraph 48
-Publisher FASB
-URI https://asc.fasb.org/1943274/2147482785/280-10-55-48
Reference 2: http://www.xbrl.org/2003/role/exampleRef
-Topic 280
-SubTopic 10
-Name Accounting Standards Codification
-Section 55
-Paragraph 49
-Publisher FASB
-URI https://asc.fasb.org/1943274/2147482785/280-10-55-49
Reference 3: http://www.xbrl.org/2003/role/disclosureRef
-Topic 270
-SubTopic 10
-Name Accounting Standards Codification
-Section 50
-Paragraph 1
-Subparagraph (i)
-Publisher FASB
-URI https://asc.fasb.org/1943274/2147482964/270-10-50-1
Reference 4: http://www.xbrl.org/2003/role/disclosureRef
-Topic 280
-SubTopic 10
-Name Accounting Standards Codification
-Section 50
-Paragraph 32
-Subparagraph (ee)
-Publisher FASB
-URI https://asc.fasb.org/1943274/2147482810/280-10-50-32
Reference 5: http://fasb.org/us-gaap/role/ref/otherTransitionRef
-Topic 280
-SubTopic 10
-Name Accounting Standards Codification
-Section 50
-Paragraph 32
-Subparagraph (d)
-Publisher FASB
-URI https://asc.fasb.org/1943274/2147482810/280-10-50-32
Reference 6: http://www.xbrl.org/2003/role/disclosureRef
-Topic 280
-SubTopic 10
-Name Accounting Standards Codification
-Section 50
-Paragraph 22
-Publisher FASB
-URI https://asc.fasb.org/1943274/2147482810/280-10-50-22
Reference 7: http://www.xbrl.org/2003/role/disclosureRef
-Topic 810
-SubTopic 10
-Name Accounting Standards Codification
-Section 50
-Paragraph 3
-Subparagraph (bb)
-Publisher FASB
-URI https://asc.fasb.org/1943274/2147481203/810-10-50-3
Reference 8: http://www.xbrl.org/2003/role/disclosureRef
-Topic 810
-SubTopic 10
-Name Accounting Standards Codification
-Section 45
-Paragraph 25
-Subparagraph (a)
-Publisher FASB
-URI https://asc.fasb.org/1943274/2147481231/810-10-45-25
Reference 9: http://www.xbrl.org/2003/role/disclosureRef
-Topic 235
-SubTopic 10
-Name Accounting Standards Codification
-Section S99
-Paragraph 1
-Subparagraph (SX 210.4-08(g)(1)(ii))
-Publisher FASB
-URI https://asc.fasb.org/1943274/2147480678/235-10-S99-1
Reference 10: http://www.xbrl.org/2003/role/disclosureRef
-Topic 323
-SubTopic 10
-Name Accounting Standards Codification
-Section 50
-Paragraph 3
-Subparagraph (c)
-Publisher FASB
-URI https://asc.fasb.org/1943274/2147481687/323-10-50-3
Reference 11: http://www.xbrl.org/2003/role/disclosureRef
-Topic 825
-SubTopic 10
-Name Accounting Standards Codification
-Section 50
-Paragraph 28
-Subparagraph (f)
-Publisher FASB
-URI https://asc.fasb.org/1943274/2147482907/825-10-50-28
Reference 12: http://www.xbrl.org/2003/role/exampleRef
-Topic 852
-SubTopic 10
-Name Accounting Standards Codification
-Section 55
-Paragraph 10
-Publisher FASB
-URI https://asc.fasb.org/1943274/2147481372/852-10-55-10
Reference 13: http://www.xbrl.org/2003/role/exampleRef
-Topic 946
-SubTopic 830
-Name Accounting Standards Codification
-Section 55
-Paragraph 12
-Publisher FASB
-URI https://asc.fasb.org/1943274/2147479168/946-830-55-12
Reference 14: http://www.xbrl.org/2003/role/disclosureRef
-Topic 944
-SubTopic 210
-Name Accounting Standards Codification
-Section S99
-Paragraph 1
-Subparagraph (SX 210.7-03(a)(12))
-Publisher FASB
-URI https://asc.fasb.org/1943274/2147478777/944-210-S99-1
Reference 15: http://www.xbrl.org/2003/role/disclosureRef
-Topic 946
-SubTopic 210
-Name Accounting Standards Codification
-Section S99
-Paragraph 1
-Subparagraph (SX 210.6-04(8))
-Publisher FASB
-URI https://asc.fasb.org/1943274/2147479170/946-210-S99-1
Reference 16: http://www.xbrl.org/2003/role/disclosureRef
-Topic 210
-SubTopic 10
-Name Accounting Standards Codification
-Section S99
-Paragraph 1
-Subparagraph (SX 210.5-02(18))
-Publisher FASB
-URI https://asc.fasb.org/1943274/2147480566/210-10-S99-1
Reference 17: http://www.xbrl.org/2003/role/disclosureRef
-Topic 470
-SubTopic 10
-Name Accounting Standards Codification
-Section S99
-Paragraph 1A
-Subparagraph (SX 210.13-01(a)(4)(i))
-Publisher FASB
-URI https://asc.fasb.org/1943274/2147480097/470-10-S99-1A
Reference 18: http://www.xbrl.org/2009/role/commonPracticeRef
-Topic 470
-SubTopic 10
-Name Accounting Standards Codification
-Section S99
-Paragraph 1A
-Subparagraph (SX 210.13-01(a)(4)(ii))
-Publisher FASB
-URI https://asc.fasb.org/1943274/2147480097/470-10-S99-1A
Reference 19: http://www.xbrl.org/2009/role/commonPracticeRef
-Topic 470
-SubTopic 10
-Name Accounting Standards Codification
-Section S99
-Paragraph 1A
-Subparagraph (SX 210.13-01(a)(4)(iii))
-Publisher FASB
-URI https://asc.fasb.org/1943274/2147480097/470-10-S99-1A
Reference 20: http://www.xbrl.org/2003/role/disclosureRef
-Topic 470
-SubTopic 10
-Name Accounting Standards Codification
-Section S99
-Paragraph 1A
-Subparagraph (SX 210.13-01(a)(4)(iii)(A))
-Publisher FASB
-URI https://asc.fasb.org/1943274/2147480097/470-10-S99-1A
Reference 21: http://www.xbrl.org/2003/role/disclosureRef
-Topic 470
-SubTopic 10
-Name Accounting Standards Codification
-Section S99
-Paragraph 1A
-Subparagraph (SX 210.13-01(a)(4)(iv))
-Publisher FASB
-URI https://asc.fasb.org/1943274/2147480097/470-10-S99-1A
Reference 22: http://www.xbrl.org/2003/role/disclosureRef
-Topic 470
-SubTopic 10
-Name Accounting Standards Codification
-Section S99
-Paragraph 1A
-Subparagraph (SX 210.13-01(a)(5))
-Publisher FASB
-URI https://asc.fasb.org/1943274/2147480097/470-10-S99-1A
Reference 23: http://www.xbrl.org/2003/role/disclosureRef
-Topic 470
-SubTopic 10
-Name Accounting Standards Codification
-Section S99
-Paragraph 1B
-Subparagraph (SX 210.13-02(a)(4)(i))
-Publisher FASB
-URI https://asc.fasb.org/1943274/2147480097/470-10-S99-1B
Reference 24: http://www.xbrl.org/2003/role/disclosureRef
-Topic 470
-SubTopic 10
-Name Accounting Standards Codification
-Section S99
-Paragraph 1B
-Subparagraph (SX 210.13-02(a)(4)(iii)(A))
-Publisher FASB
-URI https://asc.fasb.org/1943274/2147480097/470-10-S99-1B
Reference 25: http://www.xbrl.org/2003/role/disclosureRef
-Topic 470
-SubTopic 10
-Name Accounting Standards Codification
-Section S99
-Paragraph 1B
-Subparagraph (SX 210.13-02(a)(4)(iii)(B))
-Publisher FASB
-URI https://asc.fasb.org/1943274/2147480097/470-10-S99-1B
Reference 26: http://www.xbrl.org/2003/role/disclosureRef
-Topic 470
-SubTopic 10
-Name Accounting Standards Codification
-Section S99
-Paragraph 1B
-Subparagraph (SX 210.13-02(a)(4)(iv))
-Publisher FASB
-URI https://asc.fasb.org/1943274/2147480097/470-10-S99-1B
Reference 27: http://www.xbrl.org/2003/role/disclosureRef
-Topic 470
-SubTopic 10
-Name Accounting Standards Codification
-Section S99
-Paragraph 1B
-Subparagraph (SX 210.13-02(a)(5))
-Publisher FASB
-URI https://asc.fasb.org/1943274/2147480097/470-10-S99-1B
Reference 28: http://www.xbrl.org/2009/role/commonPracticeRef
-Topic 852
-SubTopic 10
-Name Accounting Standards Codification
-Section 50
-Paragraph 7
-Subparagraph (a)
-Publisher FASB
-URI https://asc.fasb.org/1943274/2147481404/852-10-50-7
Reference 29: http://www.xbrl.org/2003/role/disclosureRef
-Topic 280
-SubTopic 10
-Name Accounting Standards Codification
-Section 50
-Paragraph 30
-Subparagraph (c)
-Publisher FASB
-URI https://asc.fasb.org/1943274/2147482810/280-10-50-30
Reference 30: http://fasb.org/us-gaap/role/ref/legacyRef
-Topic 942
-SubTopic 210
-Name Accounting Standards Codification
-Section S99
-Paragraph 1
-Subparagraph (SX 210.9-03(11))
-Publisher FASB
-URI https://asc.fasb.org/1943274/2147478546/942-210-S99-1
| Name: |
us-gaap_Assets |
| Namespace Prefix: |
us-gaap_ |
| Data Type: |
xbrli:monetaryItemType |
| Balance Type: |
debit |
| Period Type: |
instant |
|
| X |
- References
+ Details
| Name: |
us-gaap_AssetsAbstract |
| Namespace Prefix: |
us-gaap_ |
| Data Type: |
xbrli:stringItemType |
| Balance Type: |
na |
| Period Type: |
duration |
|
| X |
- DefinitionAmount of currency on hand as well as demand deposits with banks or financial institutions. Includes other kinds of accounts that have the general characteristics of demand deposits. Also includes short-term, highly liquid investments that are both readily convertible to known amounts of cash and so near their maturity that they present insignificant risk of changes in value because of changes in interest rates. Excludes cash and cash equivalents within disposal group and discontinued operation. Reference 1: http://www.xbrl.org/2003/role/disclosureRef
-Topic 210
-SubTopic 10
-Name Accounting Standards Codification
-Section S99
-Paragraph 1
-Subparagraph (SX 210.5-02(1))
-Publisher FASB
-URI https://asc.fasb.org/1943274/2147480566/210-10-S99-1
Reference 2: http://www.xbrl.org/2003/role/exampleRef
-Topic 210
-SubTopic 10
-Name Accounting Standards Codification
-Section 45
-Paragraph 1
-Subparagraph (a)
-Publisher FASB
-URI https://asc.fasb.org/1943274/2147483467/210-10-45-1
Reference 3: http://fasb.org/us-gaap/role/ref/legacyRef
-Name Accounting Standards Codification
-Topic 230
-SubTopic 10
-Section 45
-Paragraph 4
-Publisher FASB
-URI https://asc.fasb.org/1943274/2147482740/230-10-45-4
| Name: |
us-gaap_CashAndCashEquivalentsAtCarryingValue |
| Namespace Prefix: |
us-gaap_ |
| Data Type: |
xbrli:monetaryItemType |
| Balance Type: |
debit |
| Period Type: |
instant |
|
| X |
- DefinitionAmount of cash and cash equivalents, and cash and cash equivalents restricted to withdrawal or usage. Excludes amount for disposal group and discontinued operations. Cash includes, but is not limited to, currency on hand, demand deposits with banks or financial institutions, and other accounts with general characteristics of demand deposits. Cash equivalents include, but are not limited to, short-term, highly liquid investments that are both readily convertible to known amounts of cash and so near their maturity that they present insignificant risk of changes in value because of changes in interest rates. Reference 1: http://www.xbrl.org/2003/role/disclosureRef
-Topic 230
-SubTopic 10
-Name Accounting Standards Codification
-Section 50
-Paragraph 8
-Publisher FASB
-URI https://asc.fasb.org/1943274/2147482913/230-10-50-8
Reference 2: http://fasb.org/us-gaap/role/ref/legacyRef
-Topic 230
-SubTopic 10
-Name Accounting Standards Codification
-Section 45
-Paragraph 24
-Publisher FASB
-URI https://asc.fasb.org/1943274/2147482740/230-10-45-24
Reference 3: http://fasb.org/us-gaap/role/ref/legacyRef
-Name Accounting Standards Codification
-Topic 230
-SubTopic 10
-Section 45
-Paragraph 4
-Publisher FASB
-URI https://asc.fasb.org/1943274/2147482740/230-10-45-4
| Name: |
us-gaap_CashCashEquivalentsRestrictedCashAndRestrictedCashEquivalents |
| Namespace Prefix: |
us-gaap_ |
| Data Type: |
xbrli:monetaryItemType |
| Balance Type: |
debit |
| Period Type: |
instant |
|
| X |
- DefinitionDifference between amount at which an investment accounted for under the equity method of accounting is carried (reported) on the balance sheet and amount of underlying equity in net assets the reporting Entity has in the investee. Reference 1: http://www.xbrl.org/2003/role/disclosureRef
-Topic 323
-SubTopic 10
-Name Accounting Standards Codification
-Section 50
-Paragraph 3
-Subparagraph (a)(3)
-Publisher FASB
-URI https://asc.fasb.org/1943274/2147481687/323-10-50-3
| Name: |
us-gaap_EquityMethodInvestmentDifferenceBetweenCarryingAmountAndUnderlyingEquity |
| Namespace Prefix: |
us-gaap_ |
| Data Type: |
xbrli:monetaryItemType |
| Balance Type: |
debit |
| Period Type: |
instant |
|
| X |
- DefinitionThis item represents the entity's ownership percentage in the investee multiplied by the investee's total equity. Reference 1: http://www.xbrl.org/2009/role/commonPracticeRef
-Topic 323
-SubTopic 10
-Name Accounting Standards Codification
-Section 50
-Paragraph 3
-Subparagraph (a)(3)
-Publisher FASB
-URI https://asc.fasb.org/1943274/2147481687/323-10-50-3
| Name: |
us-gaap_EquityMethodInvestmentUnderlyingEquityInNetAssets |
| Namespace Prefix: |
us-gaap_ |
| Data Type: |
xbrli:monetaryItemType |
| Balance Type: |
credit |
| Period Type: |
instant |
|
| X |
- DefinitionThis item represents the carrying amount on the entity's balance sheet of its investment in common stock of an equity method investee. This is not an indicator of the fair value of the investment, rather it is the initial cost adjusted for the entity's share of earnings and losses of the investee, adjusted for any distributions (dividends) and other than temporary impairment (OTTI) losses recognized. Reference 1: http://www.xbrl.org/2003/role/disclosureRef
-Topic 270
-SubTopic 10
-Name Accounting Standards Codification
-Section 50
-Paragraph 1
-Subparagraph (i)
-Publisher FASB
-URI https://asc.fasb.org/1943274/2147482964/270-10-50-1
Reference 2: http://www.xbrl.org/2003/role/disclosureRef
-Topic 280
-SubTopic 10
-Name Accounting Standards Codification
-Section 50
-Paragraph 32
-Subparagraph (ee)
-Publisher FASB
-URI https://asc.fasb.org/1943274/2147482810/280-10-50-32
Reference 3: http://www.xbrl.org/2003/role/disclosureRef
-Topic 323
-SubTopic 10
-Name Accounting Standards Codification
-Section 45
-Paragraph 1
-Publisher FASB
-URI https://asc.fasb.org/1943274/2147481664/323-10-45-1
Reference 4: http://www.xbrl.org/2009/role/commonPracticeRef
-Topic 323
-SubTopic 10
-Name Accounting Standards Codification
-Section 50
-Paragraph 3
-Subparagraph (a)(3)
-Publisher FASB
-URI https://asc.fasb.org/1943274/2147481687/323-10-50-3
Reference 5: http://www.xbrl.org/2009/role/commonPracticeRef
-Topic 210
-SubTopic 10
-Name Accounting Standards Codification
-Section S99
-Paragraph 1
-Subparagraph (SX 210.5-02(10))
-Publisher FASB
-URI https://asc.fasb.org/1943274/2147480566/210-10-S99-1
Reference 6: http://www.xbrl.org/2003/role/disclosureRef
-Topic 280
-SubTopic 10
-Name Accounting Standards Codification
-Section 50
-Paragraph 25
-Subparagraph (a)
-Publisher FASB
-URI https://asc.fasb.org/1943274/2147482810/280-10-50-25
| Name: |
us-gaap_EquityMethodInvestments |
| Namespace Prefix: |
us-gaap_ |
| Data Type: |
xbrli:monetaryItemType |
| Balance Type: |
debit |
| Period Type: |
instant |
|
| X |
- DefinitionAmount after amortization of assets, excluding financial assets and goodwill, lacking physical substance with a finite life. Reference 1: http://www.xbrl.org/2009/role/commonPracticeRef
-Topic 350
-SubTopic 30
-Name Accounting Standards Codification
-Section 50
-Paragraph 2
-Subparagraph (a)(1)
-Publisher FASB
-URI https://asc.fasb.org/1943274/2147482665/350-30-50-2
Reference 2: http://www.xbrl.org/2003/role/disclosureRef
-Topic 926
-SubTopic 20
-Name Accounting Standards Codification
-Section 50
-Paragraph 5
-Publisher FASB
-URI https://asc.fasb.org/1943274/2147483154/926-20-50-5
| Name: |
us-gaap_FiniteLivedIntangibleAssetsNet |
| Namespace Prefix: |
us-gaap_ |
| Data Type: |
xbrli:monetaryItemType |
| Balance Type: |
debit |
| Period Type: |
instant |
|
| X |
- DefinitionTotal of (1) improvements, (2) held-for-sale, (3) land and land under development, (4) construction-in-process, (5) mortgage loans held-in-inventory, and (6) other real estate investments which are considered inventory due to being held for sale or disposition.
| Name: |
us-gaap_InventoryRealEstate |
| Namespace Prefix: |
us-gaap_ |
| Data Type: |
xbrli:monetaryItemType |
| Balance Type: |
debit |
| Period Type: |
instant |
|
| X |
- References
+ Details
| Name: |
us-gaap_LiabilitiesAbstract |
| Namespace Prefix: |
us-gaap_ |
| Data Type: |
xbrli:stringItemType |
| Balance Type: |
na |
| Period Type: |
duration |
|
| X |
- DefinitionAmount of liabilities and equity items, including the portion of equity attributable to noncontrolling interests, if any. Reference 1: http://www.xbrl.org/2003/role/exampleRef
-Topic 852
-SubTopic 10
-Name Accounting Standards Codification
-Section 55
-Paragraph 10
-Publisher FASB
-URI https://asc.fasb.org/1943274/2147481372/852-10-55-10
Reference 2: http://www.xbrl.org/2003/role/disclosureRef
-Topic 944
-SubTopic 210
-Name Accounting Standards Codification
-Section S99
-Paragraph 1
-Subparagraph (SX 210.7-03(a)(25))
-Publisher FASB
-URI https://asc.fasb.org/1943274/2147478777/944-210-S99-1
Reference 3: http://www.xbrl.org/2009/role/commonPracticeRef
-Topic 235
-SubTopic 10
-Name Accounting Standards Codification
-Section S99
-Paragraph 1
-Subparagraph (SX 210.4-08(g)(1)(ii))
-Publisher FASB
-URI https://asc.fasb.org/1943274/2147480678/235-10-S99-1
Reference 4: http://www.xbrl.org/2009/role/commonPracticeRef
-Topic 323
-SubTopic 10
-Name Accounting Standards Codification
-Section 50
-Paragraph 3
-Subparagraph (c)
-Publisher FASB
-URI https://asc.fasb.org/1943274/2147481687/323-10-50-3
Reference 5: http://www.xbrl.org/2009/role/commonPracticeRef
-Topic 825
-SubTopic 10
-Name Accounting Standards Codification
-Section 50
-Paragraph 28
-Subparagraph (f)
-Publisher FASB
-URI https://asc.fasb.org/1943274/2147482907/825-10-50-28
Reference 6: http://fasb.org/us-gaap/role/ref/legacyRef
-Topic 942
-SubTopic 210
-Name Accounting Standards Codification
-Section S99
-Paragraph 1
-Subparagraph (SX 210.9-03(23))
-Publisher FASB
-URI https://asc.fasb.org/1943274/2147478546/942-210-S99-1
Reference 7: http://fasb.org/us-gaap/role/ref/legacyRef
-Topic 210
-SubTopic 10
-Name Accounting Standards Codification
-Section S99
-Paragraph 1
-Subparagraph (SX 210.5-02(32))
-Publisher FASB
-URI https://asc.fasb.org/1943274/2147480566/210-10-S99-1
| Name: |
us-gaap_LiabilitiesAndStockholdersEquity |
| Namespace Prefix: |
us-gaap_ |
| Data Type: |
xbrli:monetaryItemType |
| Balance Type: |
credit |
| Period Type: |
instant |
|
| X |
- DefinitionAmount of ownership interest in a limited liability company (LLC), including portions attributable to both the parent and noncontrolling interests. Reference 1: http://www.xbrl.org/2003/role/disclosureRef
-Topic 272
-SubTopic 10
-Name Accounting Standards Codification
-Section 45
-Paragraph 1
-Publisher FASB
-URI https://asc.fasb.org/1943274/2147483014/272-10-45-1
Reference 2: http://fasb.org/us-gaap/role/ref/legacyRef
-Topic 505
-SubTopic 10
-Name Accounting Standards Codification
-Section S99
-Paragraph 1
-Subparagraph (SX 210.3-04)
-Publisher FASB
-URI https://asc.fasb.org/1943274/2147480008/505-10-S99-1
| Name: |
us-gaap_LimitedLiabilityCompanyLlcMembersEquityIncludingPortionAttributableToNoncontrollingInterest |
| Namespace Prefix: |
us-gaap_ |
| Data Type: |
xbrli:monetaryItemType |
| Balance Type: |
credit |
| Period Type: |
instant |
|
| X |
- DefinitionAmount of member capital in limited liability company (LLC). Reference 1: http://fasb.org/us-gaap/role/ref/legacyRef
-Topic 505
-SubTopic 10
-Name Accounting Standards Codification
-Section S99
-Paragraph 1
-Subparagraph (SX 210.3-04)
-Publisher FASB
-URI https://asc.fasb.org/1943274/2147480008/505-10-S99-1
| Name: |
us-gaap_MembersCapital |
| Namespace Prefix: |
us-gaap_ |
| Data Type: |
xbrli:monetaryItemType |
| Balance Type: |
credit |
| Period Type: |
instant |
|
| X |
- DefinitionAmount of ownership interest in limited liability company (LLC), attributable to the parent entity. Reference 1: http://www.xbrl.org/2003/role/disclosureRef
-Topic 272
-SubTopic 10
-Name Accounting Standards Codification
-Section 50
-Paragraph 1
-Publisher FASB
-URI https://asc.fasb.org/1943274/2147482987/272-10-50-1
Reference 2: http://www.xbrl.org/2003/role/disclosureRef
-Topic 272
-SubTopic 10
-Name Accounting Standards Codification
-Section 50
-Paragraph 3
-Subparagraph (b)
-Publisher FASB
-URI https://asc.fasb.org/1943274/2147482987/272-10-50-3
Reference 3: http://www.xbrl.org/2003/role/disclosureRef
-Topic 272
-SubTopic 10
-Name Accounting Standards Codification
-Section 45
-Paragraph 3
-Publisher FASB
-URI https://asc.fasb.org/1943274/2147483014/272-10-45-3
Reference 4: http://www.xbrl.org/2003/role/disclosureRef
-Topic 272
-SubTopic 10
-Name Accounting Standards Codification
-Section 45
-Paragraph 4
-Publisher FASB
-URI https://asc.fasb.org/1943274/2147483014/272-10-45-4
Reference 5: http://fasb.org/us-gaap/role/ref/legacyRef
-Topic 505
-SubTopic 10
-Name Accounting Standards Codification
-Section S99
-Paragraph 1
-Subparagraph (SX 210.3-04)
-Publisher FASB
-URI https://asc.fasb.org/1943274/2147480008/505-10-S99-1
| Name: |
us-gaap_MembersEquity |
| Namespace Prefix: |
us-gaap_ |
| Data Type: |
xbrli:monetaryItemType |
| Balance Type: |
credit |
| Period Type: |
instant |
|
| X |
- DefinitionIncluding the current and noncurrent portions, aggregate carrying amount of all types of notes payable, as of the balance sheet date, with initial maturities beyond one year or beyond the normal operating cycle, if longer. Reference 1: http://fasb.org/us-gaap/role/ref/legacyRef
-Name Accounting Standards Codification
-Section S99
-Paragraph 1
-Subparagraph (SX 210.5-02(22))
-SubTopic 10
-Topic 210
-Publisher FASB
-URI https://asc.fasb.org/1943274/2147480566/210-10-S99-1
Reference 2: http://fasb.org/us-gaap/role/ref/legacyRef
-Topic 942
-SubTopic 210
-Name Accounting Standards Codification
-Section S99
-Paragraph 1
-Subparagraph (SX 210.9-03(16))
-Publisher FASB
-URI https://asc.fasb.org/1943274/2147478546/942-210-S99-1
Reference 3: http://www.xbrl.org/2009/role/commonPracticeRef
-Topic 944
-SubTopic 210
-Name Accounting Standards Codification
-Section S99
-Paragraph 1
-Subparagraph (SX 210.7-03(a)(16)(a)(2))
-Publisher FASB
-URI https://asc.fasb.org/1943274/2147478777/944-210-S99-1
Reference 4: http://www.xbrl.org/2009/role/commonPracticeRef
-Topic 944
-SubTopic 210
-Name Accounting Standards Codification
-Section S99
-Paragraph 1
-Subparagraph (SX 210.7-03(a)(17))
-Publisher FASB
-URI https://asc.fasb.org/1943274/2147478777/944-210-S99-1
| Name: |
us-gaap_NotesPayable |
| Namespace Prefix: |
us-gaap_ |
| Data Type: |
xbrli:monetaryItemType |
| Balance Type: |
credit |
| Period Type: |
instant |
|
| X |
- DefinitionAmount of assets classified as other. Reference 1: http://www.xbrl.org/2003/role/exampleRef
-Topic 280
-SubTopic 10
-Name Accounting Standards Codification
-Section 55
-Paragraph 49
-Publisher FASB
-URI https://asc.fasb.org/1943274/2147482785/280-10-55-49
Reference 2: http://fasb.org/us-gaap/role/ref/legacyRef
-Topic 942
-SubTopic 210
-Name Accounting Standards Codification
-Section S99
-Paragraph 1
-Subparagraph (SX 210.9-03(10))
-Publisher FASB
-URI https://asc.fasb.org/1943274/2147478546/942-210-S99-1
Reference 3: http://www.xbrl.org/2003/role/exampleRef
-Topic 946
-SubTopic 830
-Name Accounting Standards Codification
-Section 55
-Paragraph 12
-Publisher FASB
-URI https://asc.fasb.org/1943274/2147479168/946-830-55-12
Reference 4: http://www.xbrl.org/2003/role/disclosureRef
-Topic 944
-SubTopic 210
-Name Accounting Standards Codification
-Section S99
-Paragraph 1
-Subparagraph (SX 210.7-03(a)(10))
-Publisher FASB
-URI https://asc.fasb.org/1943274/2147478777/944-210-S99-1
Reference 5: http://www.xbrl.org/2003/role/disclosureRef
-Topic 210
-SubTopic 10
-Name Accounting Standards Codification
-Section S99
-Paragraph 1
-Subparagraph (SX 210.5-02(17))
-Publisher FASB
-URI https://asc.fasb.org/1943274/2147480566/210-10-S99-1
| Name: |
us-gaap_OtherAssets |
| Namespace Prefix: |
us-gaap_ |
| Data Type: |
xbrli:monetaryItemType |
| Balance Type: |
debit |
| Period Type: |
instant |
|
| X |
- DefinitionAmount of liabilities classified as other. Reference 1: http://fasb.org/us-gaap/role/ref/legacyRef
-Topic 942
-SubTopic 210
-Name Accounting Standards Codification
-Section S99
-Paragraph 1
-Subparagraph (SX 210.9-03(15))
-Publisher FASB
-URI https://asc.fasb.org/1943274/2147478546/942-210-S99-1
Reference 2: http://www.xbrl.org/2003/role/disclosureRef
-Topic 944
-SubTopic 210
-Name Accounting Standards Codification
-Section S99
-Paragraph 1
-Subparagraph (SX 210.7-03(a)(15))
-Publisher FASB
-URI https://asc.fasb.org/1943274/2147478777/944-210-S99-1
Reference 3: http://www.xbrl.org/2003/role/exampleRef
-Topic 946
-SubTopic 830
-Name Accounting Standards Codification
-Section 55
-Paragraph 12
-Publisher FASB
-URI https://asc.fasb.org/1943274/2147479168/946-830-55-12
Reference 4: http://www.xbrl.org/2003/role/disclosureRef
-Topic 946
-SubTopic 210
-Name Accounting Standards Codification
-Section S99
-Paragraph 1
-Subparagraph (SX 210.6-04(12)(b)(2))
-Publisher FASB
-URI https://asc.fasb.org/1943274/2147479170/946-210-S99-1
Reference 5: http://www.xbrl.org/2003/role/disclosureRef
-Topic 946
-SubTopic 210
-Name Accounting Standards Codification
-Section S99
-Paragraph 1
-Subparagraph (SX 210.6-04(12)(b)(3))
-Publisher FASB
-URI https://asc.fasb.org/1943274/2147479170/946-210-S99-1
Reference 6: http://www.xbrl.org/2009/role/commonPracticeRef
-Topic 946
-SubTopic 210
-Name Accounting Standards Codification
-Section S99
-Paragraph 1
-Subparagraph (SX 210.6-04(12)(b)(1))
-Publisher FASB
-URI https://asc.fasb.org/1943274/2147479170/946-210-S99-1
Reference 7: http://www.xbrl.org/2009/role/commonPracticeRef
-Topic 944
-SubTopic 210
-Name Accounting Standards Codification
-Section S99
-Paragraph 1
-Subparagraph (SX 210.7-03(a)(17))
-Publisher FASB
-URI https://asc.fasb.org/1943274/2147478777/944-210-S99-1
| Name: |
us-gaap_OtherLiabilities |
| Namespace Prefix: |
us-gaap_ |
| Data Type: |
xbrli:monetaryItemType |
| Balance Type: |
credit |
| Period Type: |
instant |
|
| X |
- Details
| Name: |
srt_ScheduleOfEquityMethodInvestmentEquityMethodInvesteeNameAxis=fph_GreatParkVentureMember |
| Namespace Prefix: |
|
| Data Type: |
na |
| Balance Type: |
|
| Period Type: |
|
|
| X |
- Details
| Name: |
srt_ScheduleOfEquityMethodInvestmentEquityMethodInvesteeNameAxis=fph_GatewayCommercialVentureLLCAMember |
| Namespace Prefix: |
|
| Data Type: |
na |
| Balance Type: |
|
| Period Type: |
|
|
| X |
- Details
| Name: |
us-gaap_EquityMethodInvestmentNonconsolidatedInvesteeAxis=fph_GreatParkVentureMember |
| Namespace Prefix: |
|
| Data Type: |
na |
| Balance Type: |
|
| Period Type: |
|
|
| X |
- Details
| Name: |
us-gaap_EquityMethodInvestmentNonconsolidatedInvesteeAxis=fph_GatewayCommercialVentureLLCAMember |
| Namespace Prefix: |
|
| Data Type: |
na |
| Balance Type: |
|
| Period Type: |
|
|
v3.24.2
Noncontrolling Interests - Additional Information (Details)
shares in Millions, $ in Millions |
6 Months Ended |
12 Months Ended |
|
|
Jun. 30, 2024
USD ($)
class
|
Dec. 31, 2019
USD ($)
shares
|
Dec. 31, 2023
USD ($)
|
| Noncontrolling Interest [Line Items] |
|
|
|
| Holding period for right to exchange (in months) |
12 months
|
|
|
| Right to exchange, conversion ratio |
1
|
|
|
| Redeemable noncontrolling interest, common stock class C units |
$ 25.0
|
|
$ 25.0
|
| San Francisco Venture |
|
|
|
| Noncontrolling Interest [Line Items] |
|
|
|
| Issuance of Class C common shares (in shares) | shares |
|
25.0
|
|
| Proceeds from issuance of redeemable noncontrolling interest |
|
$ 25.0
|
|
| Maximum amount payable, class C units |
|
25.0
|
|
| Infrastructure development costs |
|
25.0
|
|
| San Francisco Venture | Maximum |
|
|
|
| Noncontrolling Interest [Line Items] |
|
|
|
| Authorized contribution amount |
|
$ 25.0
|
|
| The San Francisco Venture |
|
|
|
| Noncontrolling Interest [Line Items] |
|
|
|
| Holding period for right to exchange (in months) |
12 months
|
|
|
| Right to exchange, conversion ratio |
1
|
|
|
| Number of classes of membership units | class |
3
|
|
|
| Unitholder request for redemption, minimum ownership |
50.10%
|
|
|
| Conversion of Class B Common Shares Into Class A Common Shares |
|
|
|
| Noncontrolling Interest [Line Items] |
|
|
|
| Conversion of common shares, ratio |
0.0003
|
|
|
| Five Point Operating Company, LLC |
|
|
|
| Noncontrolling Interest [Line Items] |
|
|
|
| Noncontrolling interest percentage of outstanding common units |
37.40%
|
|
|
| Five Point Operating Company, LLC | Class A Units | Related Party |
|
|
|
| Noncontrolling Interest [Line Items] |
|
|
|
| Ownership percentage of outstanding common units |
62.60%
|
|
|
| Five Point Operating Company, LLC | Class B Units | Related Party |
|
|
|
| Noncontrolling Interest [Line Items] |
|
|
|
| Ownership percentage of outstanding common units |
100.00%
|
|
|
| X |
- DefinitionAuthorized Redemption Amount
| Name: |
fph_AuthorizedRedemptionAmount |
| Namespace Prefix: |
fph_ |
| Data Type: |
xbrli:monetaryItemType |
| Balance Type: |
debit |
| Period Type: |
duration |
|
| X |
- DefinitionLimited Liability Company or Limited Partnership, Redemption Threshold
| Name: |
fph_LimitedLiabilityCompanyorLimitedPartnershipRedemptionThreshold |
| Namespace Prefix: |
fph_ |
| Data Type: |
dtr-types1:percentItemType |
| Balance Type: |
na |
| Period Type: |
duration |
|
| X |
- DefinitionStockholders Right To Exchange, Holding Period
| Name: |
fph_NoncontrollingInterestStockholdersRightToExchangeHoldingPeriod |
| Namespace Prefix: |
fph_ |
| Data Type: |
xbrli:durationItemType |
| Balance Type: |
na |
| Period Type: |
duration |
|
| X |
- DefinitionNoncontrolling Interest, Stockholders Right to Exchange, Conversion Ratio
| Name: |
fph_NoncontrollingInterestStockholdersRighttoExchangeConversionRatio |
| Namespace Prefix: |
fph_ |
| Data Type: |
xbrli:pureItemType |
| Balance Type: |
na |
| Period Type: |
duration |
|
| X |
- DefinitionNumber of Classes Of Membership Units
| Name: |
fph_NumberofClassesOfMembershipUnits |
| Namespace Prefix: |
fph_ |
| Data Type: |
xbrli:integerItemType |
| Balance Type: |
na |
| Period Type: |
duration |
|
| X |
- DefinitionStock Distributions, Percentage Of Distribution To Other Shares
| Name: |
fph_StockDistributionsPercentageOfDistributionToOtherShares |
| Namespace Prefix: |
fph_ |
| Data Type: |
xbrli:pureItemType |
| Balance Type: |
na |
| Period Type: |
duration |
|
| X |
- DefinitionLine items represent financial concepts included in a table. These concepts are used to disclose reportable information associated with domain members defined in one or many axes to the table.
| Name: |
us-gaap_MinorityInterestLineItems |
| Namespace Prefix: |
us-gaap_ |
| Data Type: |
xbrli:stringItemType |
| Balance Type: |
na |
| Period Type: |
duration |
|
| X |
- DefinitionThe equity interest of noncontrolling shareholders, partners or other equity holders in consolidated entity.
| Name: |
us-gaap_MinorityInterestOwnershipPercentageByNoncontrollingOwners |
| Namespace Prefix: |
us-gaap_ |
| Data Type: |
dtr-types:percentItemType |
| Balance Type: |
na |
| Period Type: |
instant |
|
| X |
- DefinitionThe parent entity's interest in net assets of the subsidiary, expressed as a percentage.
| Name: |
us-gaap_MinorityInterestOwnershipPercentageByParent |
| Namespace Prefix: |
us-gaap_ |
| Data Type: |
dtr-types:percentItemType |
| Balance Type: |
na |
| Period Type: |
instant |
|
| X |
- DefinitionThe cash inflow from issuance of preferred stock that is classified as callable. Reference 1: http://fasb.org/us-gaap/role/ref/legacyRef
-Name Accounting Standards Codification
-Section 45
-Paragraph 14
-Subparagraph (a)
-SubTopic 10
-Topic 230
-Publisher FASB
-URI https://asc.fasb.org/1943274/2147482740/230-10-45-14
| Name: |
us-gaap_ProceedsFromIssuanceOfRedeemablePreferredStock |
| Namespace Prefix: |
us-gaap_ |
| Data Type: |
xbrli:monetaryItemType |
| Balance Type: |
debit |
| Period Type: |
duration |
|
| X |
- DefinitionRedemption value, as if currently redeemable, of redeemable noncontrolling interest for common shares, units or ownership interests classified as temporary equity and the election has been made to accrete changes in redemption value to the earliest redemption date. Reference 1: http://fasb.org/us-gaap/role/ref/legacyRef
-Topic 480
-SubTopic 10
-Name Accounting Standards Codification
-Section S99
-Paragraph 3A
-Subparagraph (24)(b)
-Publisher FASB
-URI https://asc.fasb.org/1943274/2147480244/480-10-S99-3A
| Name: |
us-gaap_RedeemableNoncontrollingInterestEquityCommonRedemptionValue |
| Namespace Prefix: |
us-gaap_ |
| Data Type: |
xbrli:monetaryItemType |
| Balance Type: |
credit |
| Period Type: |
instant |
|
| X |
- DefinitionNumber of new stock issued during the period. Reference 1: http://fasb.org/us-gaap/role/ref/legacyRef
-Name Accounting Standards Codification
-Section 50
-Paragraph 2
-SubTopic 10
-Topic 505
-Publisher FASB
-URI https://asc.fasb.org/1943274/2147481112/505-10-50-2
Reference 2: http://fasb.org/us-gaap/role/ref/legacyRef
-Topic 210
-SubTopic 10
-Name Accounting Standards Codification
-Section S99
-Paragraph 1
-Subparagraph (SX 210.5-02(28))
-Publisher FASB
-URI https://asc.fasb.org/1943274/2147480566/210-10-S99-1
Reference 3: http://fasb.org/us-gaap/role/ref/legacyRef
-Topic 210
-SubTopic 10
-Name Accounting Standards Codification
-Section S99
-Paragraph 1
-Subparagraph (SX 210.5-02(29))
-Publisher FASB
-URI https://asc.fasb.org/1943274/2147480566/210-10-S99-1
Reference 4: http://www.xbrl.org/2003/role/disclosureRef
-Topic 946
-SubTopic 505
-Name Accounting Standards Codification
-Section 50
-Paragraph 2
-Subparagraph (a)
-Publisher FASB
-URI https://asc.fasb.org/1943274/2147478448/946-505-50-2
Reference 5: http://www.xbrl.org/2003/role/disclosureRef
-Topic 946
-SubTopic 220
-Name Accounting Standards Codification
-Section S99
-Paragraph 3
-Subparagraph (SX 210.6-09(4)(b))
-Publisher FASB
-URI https://asc.fasb.org/1943274/2147479134/946-220-S99-3
Reference 6: http://www.xbrl.org/2003/role/disclosureRef
-Topic 946
-SubTopic 10
-Name Accounting Standards Codification
-Section S99
-Paragraph 3
-Subparagraph (SX 210.6-03(i)(1))
-Publisher FASB
-URI https://asc.fasb.org/1943274/2147479886/946-10-S99-3
Reference 7: http://fasb.org/us-gaap/role/ref/legacyRef
-Topic 505
-SubTopic 10
-Name Accounting Standards Codification
-Section S99
-Paragraph 1
-Subparagraph (SX 210.3-04)
-Publisher FASB
-URI https://asc.fasb.org/1943274/2147480008/505-10-S99-1
| Name: |
us-gaap_StockIssuedDuringPeriodSharesNewIssues |
| Namespace Prefix: |
us-gaap_ |
| Data Type: |
xbrli:sharesItemType |
| Balance Type: |
na |
| Period Type: |
duration |
|
| X |
- Details
| Name: |
dei_LegalEntityAxis=fph_SanFranciscoVentureMember |
| Namespace Prefix: |
|
| Data Type: |
na |
| Balance Type: |
|
| Period Type: |
|
|
| X |
- Details
| Name: |
srt_RangeAxis=srt_MaximumMember |
| Namespace Prefix: |
|
| Data Type: |
na |
| Balance Type: |
|
| Period Type: |
|
|
| X |
- Details
| Name: |
us-gaap_BusinessAcquisitionAxis=fph_TheSanFranciscoVentureMember |
| Namespace Prefix: |
|
| Data Type: |
na |
| Balance Type: |
|
| Period Type: |
|
|
| X |
- Details
| Name: |
us-gaap_ConversionOfStockByUniqueDescriptionAxis=fph_ConversionofClassBCommonSharesIntoClassACommonSharesMember |
| Namespace Prefix: |
|
| Data Type: |
na |
| Balance Type: |
|
| Period Type: |
|
|
| X |
- Details
| Name: |
srt_OwnershipAxis=fph_FivePointOperatingCompanyLLCMember |
| Namespace Prefix: |
|
| Data Type: |
na |
| Balance Type: |
|
| Period Type: |
|
|
| X |
- Details
| Name: |
us-gaap_CapitalUnitsByClassAxis=us-gaap_CapitalUnitClassAMember |
| Namespace Prefix: |
|
| Data Type: |
na |
| Balance Type: |
|
| Period Type: |
|
|
| X |
- Details
| Name: |
us-gaap_CapitalUnitsByClassAxis=us-gaap_CapitalUnitClassBMember |
| Namespace Prefix: |
|
| Data Type: |
na |
| Balance Type: |
|
| Period Type: |
|
|
v3.24.2
Noncontrolling Interests - Schedule of Tax Distributions (Details) - USD ($)
$ in Thousands |
3 Months Ended |
6 Months Ended |
Jun. 30, 2024 |
Jun. 30, 2023 |
Jun. 30, 2024 |
Jun. 30, 2023 |
| Noncontrolling Interest [Line Items] |
|
|
|
|
| Total tax distributions |
|
|
$ 0
|
$ 1,974
|
| Five Point Operating Company, LLC |
|
|
|
|
| Noncontrolling Interest [Line Items] |
|
|
|
|
| Total tax distributions |
$ 0
|
$ 0
|
0
|
1,974
|
| Five Point Operating Company, LLC | Management Partner |
|
|
|
|
| Noncontrolling Interest [Line Items] |
|
|
|
|
| Total tax distributions |
0
|
0
|
0
|
1,974
|
| Five Point Operating Company, LLC | Other partners (excluding the Holding Company) |
|
|
|
|
| Noncontrolling Interest [Line Items] |
|
|
|
|
| Total tax distributions |
$ 0
|
$ 0
|
$ 0
|
$ 0
|
| X |
- DefinitionLine items represent financial concepts included in a table. These concepts are used to disclose reportable information associated with domain members defined in one or many axes to the table.
| Name: |
us-gaap_MinorityInterestLineItems |
| Namespace Prefix: |
us-gaap_ |
| Data Type: |
xbrli:stringItemType |
| Balance Type: |
na |
| Period Type: |
duration |
|
| X |
- DefinitionCash outflow to owners or shareholders, excluding ordinary dividends. Includes special dividends. Reference 1: http://fasb.org/us-gaap/role/ref/legacyRef
-Topic 230
-SubTopic 10
-Name Accounting Standards Codification
-Section 45
-Paragraph 15
-Subparagraph (a)
-Publisher FASB
-URI https://asc.fasb.org/1943274/2147482740/230-10-45-15
| Name: |
us-gaap_PaymentsOfCapitalDistribution |
| Namespace Prefix: |
us-gaap_ |
| Data Type: |
xbrli:monetaryItemType |
| Balance Type: |
credit |
| Period Type: |
duration |
|
| X |
- Details
| Name: |
srt_OwnershipAxis=fph_FivePointOperatingCompanyLLCMember |
| Namespace Prefix: |
|
| Data Type: |
na |
| Balance Type: |
|
| Period Type: |
|
|
| X |
- Details
| Name: |
dei_LegalEntityAxis=fph_ManagementPartnerMember |
| Namespace Prefix: |
|
| Data Type: |
na |
| Balance Type: |
|
| Period Type: |
|
|
| X |
- Details
| Name: |
dei_LegalEntityAxis=fph_OtherPartnersMember |
| Namespace Prefix: |
|
| Data Type: |
na |
| Balance Type: |
|
| Period Type: |
|
|
v3.24.2
Consolidated Variable Interest Entity (Details) - USD ($)
$ in Thousands |
6 Months Ended |
|
Jun. 30, 2024 |
Dec. 31, 2023 |
| Variable Interest Entity [Line Items] |
|
|
| Combined assets |
$ 2,920,139
|
$ 2,969,288
|
| Inventories |
2,292,264
|
2,213,479
|
| Combined liabilities |
867,812
|
962,184
|
| Other |
74,173
|
78,074
|
| Intangibles |
13,728
|
25,270
|
| Accounts payable and other liabilities |
83,267
|
81,649
|
| Related Party |
|
|
| Variable Interest Entity [Line Items] |
|
|
| OTHER ASSETS |
120,551
|
83,970
|
| Other |
$ 74,173
|
78,074
|
| San Francisco Venture |
|
|
| Variable Interest Entity [Line Items] |
|
|
| Distributions (as percent) |
99.00%
|
|
| San Francisco Venture | Variable Interest Entity, Primary Beneficiary |
|
|
| Variable Interest Entity [Line Items] |
|
|
| Combined assets |
$ 1,390,000
|
1,360,000
|
| Inventories |
1,390,000
|
1,360,000
|
| Combined liabilities |
65,700
|
61,900
|
| Other |
60,700
|
59,400
|
| San Francisco Venture | Variable Interest Entity, Primary Beneficiary | Related Party |
|
|
| Variable Interest Entity [Line Items] |
|
|
| OTHER ASSETS |
900
|
900
|
| FP LP And FPL | Variable Interest Entity, Primary Beneficiary |
|
|
| Variable Interest Entity [Line Items] |
|
|
| Combined assets |
1,100,000
|
1,000,000
|
| Inventories |
904,800
|
855,600
|
| Combined liabilities |
63,000
|
60,000
|
| Other |
1,200
|
2,700
|
| Intangibles |
13,700
|
25,300
|
| Accounts payable and other liabilities |
61,800
|
57,300
|
| FP LP And FPL | Variable Interest Entity, Primary Beneficiary | Related Party |
|
|
| Variable Interest Entity [Line Items] |
|
|
| OTHER ASSETS |
$ 106,900
|
$ 69,100
|
| X |
- DefinitionVariable Interest Entity, Distribution Percentage
| Name: |
fph_VariableInterestEntityDistributionPercentage |
| Namespace Prefix: |
fph_ |
| Data Type: |
dtr-types1:percentItemType |
| Balance Type: |
na |
| Period Type: |
duration |
|
| X |
- DefinitionAmount of liabilities incurred and payable to vendors for goods and services received, and accrued liabilities classified as other. Reference 1: http://www.xbrl.org/2003/role/disclosureRef
-Topic 946
-SubTopic 210
-Name Accounting Standards Codification
-Section S99
-Paragraph 1
-Subparagraph (SX 210.6-04(10)(d))
-Publisher FASB
-URI https://asc.fasb.org/1943274/2147479170/946-210-S99-1
| Name: |
us-gaap_AccountsPayableAndOtherAccruedLiabilities |
| Namespace Prefix: |
us-gaap_ |
| Data Type: |
xbrli:monetaryItemType |
| Balance Type: |
credit |
| Period Type: |
instant |
|
| X |
- DefinitionAmount of asset recognized for present right to economic benefit. Reference 1: http://www.xbrl.org/2003/role/exampleRef
-Topic 280
-SubTopic 10
-Name Accounting Standards Codification
-Section 55
-Paragraph 48
-Publisher FASB
-URI https://asc.fasb.org/1943274/2147482785/280-10-55-48
Reference 2: http://www.xbrl.org/2003/role/exampleRef
-Topic 280
-SubTopic 10
-Name Accounting Standards Codification
-Section 55
-Paragraph 49
-Publisher FASB
-URI https://asc.fasb.org/1943274/2147482785/280-10-55-49
Reference 3: http://www.xbrl.org/2003/role/disclosureRef
-Topic 270
-SubTopic 10
-Name Accounting Standards Codification
-Section 50
-Paragraph 1
-Subparagraph (i)
-Publisher FASB
-URI https://asc.fasb.org/1943274/2147482964/270-10-50-1
Reference 4: http://www.xbrl.org/2003/role/disclosureRef
-Topic 280
-SubTopic 10
-Name Accounting Standards Codification
-Section 50
-Paragraph 32
-Subparagraph (ee)
-Publisher FASB
-URI https://asc.fasb.org/1943274/2147482810/280-10-50-32
Reference 5: http://fasb.org/us-gaap/role/ref/otherTransitionRef
-Topic 280
-SubTopic 10
-Name Accounting Standards Codification
-Section 50
-Paragraph 32
-Subparagraph (d)
-Publisher FASB
-URI https://asc.fasb.org/1943274/2147482810/280-10-50-32
Reference 6: http://www.xbrl.org/2003/role/disclosureRef
-Topic 280
-SubTopic 10
-Name Accounting Standards Codification
-Section 50
-Paragraph 22
-Publisher FASB
-URI https://asc.fasb.org/1943274/2147482810/280-10-50-22
Reference 7: http://www.xbrl.org/2003/role/disclosureRef
-Topic 810
-SubTopic 10
-Name Accounting Standards Codification
-Section 50
-Paragraph 3
-Subparagraph (bb)
-Publisher FASB
-URI https://asc.fasb.org/1943274/2147481203/810-10-50-3
Reference 8: http://www.xbrl.org/2003/role/disclosureRef
-Topic 810
-SubTopic 10
-Name Accounting Standards Codification
-Section 45
-Paragraph 25
-Subparagraph (a)
-Publisher FASB
-URI https://asc.fasb.org/1943274/2147481231/810-10-45-25
Reference 9: http://www.xbrl.org/2003/role/disclosureRef
-Topic 235
-SubTopic 10
-Name Accounting Standards Codification
-Section S99
-Paragraph 1
-Subparagraph (SX 210.4-08(g)(1)(ii))
-Publisher FASB
-URI https://asc.fasb.org/1943274/2147480678/235-10-S99-1
Reference 10: http://www.xbrl.org/2003/role/disclosureRef
-Topic 323
-SubTopic 10
-Name Accounting Standards Codification
-Section 50
-Paragraph 3
-Subparagraph (c)
-Publisher FASB
-URI https://asc.fasb.org/1943274/2147481687/323-10-50-3
Reference 11: http://www.xbrl.org/2003/role/disclosureRef
-Topic 825
-SubTopic 10
-Name Accounting Standards Codification
-Section 50
-Paragraph 28
-Subparagraph (f)
-Publisher FASB
-URI https://asc.fasb.org/1943274/2147482907/825-10-50-28
Reference 12: http://www.xbrl.org/2003/role/exampleRef
-Topic 852
-SubTopic 10
-Name Accounting Standards Codification
-Section 55
-Paragraph 10
-Publisher FASB
-URI https://asc.fasb.org/1943274/2147481372/852-10-55-10
Reference 13: http://www.xbrl.org/2003/role/exampleRef
-Topic 946
-SubTopic 830
-Name Accounting Standards Codification
-Section 55
-Paragraph 12
-Publisher FASB
-URI https://asc.fasb.org/1943274/2147479168/946-830-55-12
Reference 14: http://www.xbrl.org/2003/role/disclosureRef
-Topic 944
-SubTopic 210
-Name Accounting Standards Codification
-Section S99
-Paragraph 1
-Subparagraph (SX 210.7-03(a)(12))
-Publisher FASB
-URI https://asc.fasb.org/1943274/2147478777/944-210-S99-1
Reference 15: http://www.xbrl.org/2003/role/disclosureRef
-Topic 946
-SubTopic 210
-Name Accounting Standards Codification
-Section S99
-Paragraph 1
-Subparagraph (SX 210.6-04(8))
-Publisher FASB
-URI https://asc.fasb.org/1943274/2147479170/946-210-S99-1
Reference 16: http://www.xbrl.org/2003/role/disclosureRef
-Topic 210
-SubTopic 10
-Name Accounting Standards Codification
-Section S99
-Paragraph 1
-Subparagraph (SX 210.5-02(18))
-Publisher FASB
-URI https://asc.fasb.org/1943274/2147480566/210-10-S99-1
Reference 17: http://www.xbrl.org/2003/role/disclosureRef
-Topic 470
-SubTopic 10
-Name Accounting Standards Codification
-Section S99
-Paragraph 1A
-Subparagraph (SX 210.13-01(a)(4)(i))
-Publisher FASB
-URI https://asc.fasb.org/1943274/2147480097/470-10-S99-1A
Reference 18: http://www.xbrl.org/2009/role/commonPracticeRef
-Topic 470
-SubTopic 10
-Name Accounting Standards Codification
-Section S99
-Paragraph 1A
-Subparagraph (SX 210.13-01(a)(4)(ii))
-Publisher FASB
-URI https://asc.fasb.org/1943274/2147480097/470-10-S99-1A
Reference 19: http://www.xbrl.org/2009/role/commonPracticeRef
-Topic 470
-SubTopic 10
-Name Accounting Standards Codification
-Section S99
-Paragraph 1A
-Subparagraph (SX 210.13-01(a)(4)(iii))
-Publisher FASB
-URI https://asc.fasb.org/1943274/2147480097/470-10-S99-1A
Reference 20: http://www.xbrl.org/2003/role/disclosureRef
-Topic 470
-SubTopic 10
-Name Accounting Standards Codification
-Section S99
-Paragraph 1A
-Subparagraph (SX 210.13-01(a)(4)(iii)(A))
-Publisher FASB
-URI https://asc.fasb.org/1943274/2147480097/470-10-S99-1A
Reference 21: http://www.xbrl.org/2003/role/disclosureRef
-Topic 470
-SubTopic 10
-Name Accounting Standards Codification
-Section S99
-Paragraph 1A
-Subparagraph (SX 210.13-01(a)(4)(iv))
-Publisher FASB
-URI https://asc.fasb.org/1943274/2147480097/470-10-S99-1A
Reference 22: http://www.xbrl.org/2003/role/disclosureRef
-Topic 470
-SubTopic 10
-Name Accounting Standards Codification
-Section S99
-Paragraph 1A
-Subparagraph (SX 210.13-01(a)(5))
-Publisher FASB
-URI https://asc.fasb.org/1943274/2147480097/470-10-S99-1A
Reference 23: http://www.xbrl.org/2003/role/disclosureRef
-Topic 470
-SubTopic 10
-Name Accounting Standards Codification
-Section S99
-Paragraph 1B
-Subparagraph (SX 210.13-02(a)(4)(i))
-Publisher FASB
-URI https://asc.fasb.org/1943274/2147480097/470-10-S99-1B
Reference 24: http://www.xbrl.org/2003/role/disclosureRef
-Topic 470
-SubTopic 10
-Name Accounting Standards Codification
-Section S99
-Paragraph 1B
-Subparagraph (SX 210.13-02(a)(4)(iii)(A))
-Publisher FASB
-URI https://asc.fasb.org/1943274/2147480097/470-10-S99-1B
Reference 25: http://www.xbrl.org/2003/role/disclosureRef
-Topic 470
-SubTopic 10
-Name Accounting Standards Codification
-Section S99
-Paragraph 1B
-Subparagraph (SX 210.13-02(a)(4)(iii)(B))
-Publisher FASB
-URI https://asc.fasb.org/1943274/2147480097/470-10-S99-1B
Reference 26: http://www.xbrl.org/2003/role/disclosureRef
-Topic 470
-SubTopic 10
-Name Accounting Standards Codification
-Section S99
-Paragraph 1B
-Subparagraph (SX 210.13-02(a)(4)(iv))
-Publisher FASB
-URI https://asc.fasb.org/1943274/2147480097/470-10-S99-1B
Reference 27: http://www.xbrl.org/2003/role/disclosureRef
-Topic 470
-SubTopic 10
-Name Accounting Standards Codification
-Section S99
-Paragraph 1B
-Subparagraph (SX 210.13-02(a)(5))
-Publisher FASB
-URI https://asc.fasb.org/1943274/2147480097/470-10-S99-1B
Reference 28: http://www.xbrl.org/2009/role/commonPracticeRef
-Topic 852
-SubTopic 10
-Name Accounting Standards Codification
-Section 50
-Paragraph 7
-Subparagraph (a)
-Publisher FASB
-URI https://asc.fasb.org/1943274/2147481404/852-10-50-7
Reference 29: http://www.xbrl.org/2003/role/disclosureRef
-Topic 280
-SubTopic 10
-Name Accounting Standards Codification
-Section 50
-Paragraph 30
-Subparagraph (c)
-Publisher FASB
-URI https://asc.fasb.org/1943274/2147482810/280-10-50-30
Reference 30: http://fasb.org/us-gaap/role/ref/legacyRef
-Topic 942
-SubTopic 210
-Name Accounting Standards Codification
-Section S99
-Paragraph 1
-Subparagraph (SX 210.9-03(11))
-Publisher FASB
-URI https://asc.fasb.org/1943274/2147478546/942-210-S99-1
| Name: |
us-gaap_Assets |
| Namespace Prefix: |
us-gaap_ |
| Data Type: |
xbrli:monetaryItemType |
| Balance Type: |
debit |
| Period Type: |
instant |
|
| X |
- DefinitionAmount after amortization of assets, excluding financial assets and goodwill, lacking physical substance with a finite life. Reference 1: http://www.xbrl.org/2009/role/commonPracticeRef
-Topic 350
-SubTopic 30
-Name Accounting Standards Codification
-Section 50
-Paragraph 2
-Subparagraph (a)(1)
-Publisher FASB
-URI https://asc.fasb.org/1943274/2147482665/350-30-50-2
Reference 2: http://www.xbrl.org/2003/role/disclosureRef
-Topic 926
-SubTopic 20
-Name Accounting Standards Codification
-Section 50
-Paragraph 5
-Publisher FASB
-URI https://asc.fasb.org/1943274/2147483154/926-20-50-5
| Name: |
us-gaap_FiniteLivedIntangibleAssetsNet |
| Namespace Prefix: |
us-gaap_ |
| Data Type: |
xbrli:monetaryItemType |
| Balance Type: |
debit |
| Period Type: |
instant |
|
| X |
- DefinitionTotal of (1) improvements, (2) held-for-sale, (3) land and land under development, (4) construction-in-process, (5) mortgage loans held-in-inventory, and (6) other real estate investments which are considered inventory due to being held for sale or disposition.
| Name: |
us-gaap_InventoryRealEstate |
| Namespace Prefix: |
us-gaap_ |
| Data Type: |
xbrli:monetaryItemType |
| Balance Type: |
debit |
| Period Type: |
instant |
|
| X |
- DefinitionAmount of liability recognized for present obligation requiring transfer or otherwise providing economic benefit to others. Reference 1: http://fasb.org/us-gaap/role/ref/legacyRef
-Name Accounting Standards Codification
-Section S99
-Paragraph 1
-Subparagraph (SX 210.5-02(22))
-SubTopic 10
-Topic 210
-Publisher FASB
-URI https://asc.fasb.org/1943274/2147480566/210-10-S99-1
Reference 2: http://fasb.org/us-gaap/role/ref/legacyRef
-Topic 210
-SubTopic 10
-Name Accounting Standards Codification
-Section S99
-Paragraph 1
-Subparagraph (SX 210.5-02(20))
-Publisher FASB
-URI https://asc.fasb.org/1943274/2147480566/210-10-S99-1
Reference 3: http://fasb.org/us-gaap/role/ref/legacyRef
-Topic 210
-SubTopic 10
-Name Accounting Standards Codification
-Section S99
-Paragraph 1
-Subparagraph (SX 210.5-02(24))
-Publisher FASB
-URI https://asc.fasb.org/1943274/2147480566/210-10-S99-1
Reference 4: http://fasb.org/us-gaap/role/ref/legacyRef
-Topic 210
-SubTopic 10
-Name Accounting Standards Codification
-Section S99
-Paragraph 1
-Subparagraph (SX 210.5-02(19))
-Publisher FASB
-URI https://asc.fasb.org/1943274/2147480566/210-10-S99-1
Reference 5: http://fasb.org/us-gaap/role/ref/legacyRef
-Topic 210
-SubTopic 10
-Name Accounting Standards Codification
-Section S99
-Paragraph 1
-Subparagraph (SX 210.5-02(25))
-Publisher FASB
-URI https://asc.fasb.org/1943274/2147480566/210-10-S99-1
Reference 6: http://fasb.org/us-gaap/role/ref/legacyRef
-Topic 210
-SubTopic 10
-Name Accounting Standards Codification
-Section S99
-Paragraph 1
-Subparagraph (SX 210.5-02(26))
-Publisher FASB
-URI https://asc.fasb.org/1943274/2147480566/210-10-S99-1
Reference 7: http://fasb.org/us-gaap/role/ref/legacyRef
-Topic 210
-SubTopic 10
-Name Accounting Standards Codification
-Section S99
-Paragraph 1
-Subparagraph (SX 210.5-02(23))
-Publisher FASB
-URI https://asc.fasb.org/1943274/2147480566/210-10-S99-1
Reference 8: http://fasb.org/us-gaap/role/ref/legacyRef
-Topic 210
-SubTopic 10
-Name Accounting Standards Codification
-Section S99
-Paragraph 1
-Subparagraph (SX 210.5-02(21))
-Publisher FASB
-URI https://asc.fasb.org/1943274/2147480566/210-10-S99-1
Reference 9: http://www.xbrl.org/2003/role/disclosureRef
-Topic 810
-SubTopic 10
-Name Accounting Standards Codification
-Section 50
-Paragraph 3
-Subparagraph (c)
-Publisher FASB
-URI https://asc.fasb.org/1943274/2147481203/810-10-50-3
Reference 10: http://www.xbrl.org/2003/role/disclosureRef
-Topic 810
-SubTopic 10
-Name Accounting Standards Codification
-Section 45
-Paragraph 25
-Subparagraph (b)
-Publisher FASB
-URI https://asc.fasb.org/1943274/2147481231/810-10-45-25
Reference 11: http://www.xbrl.org/2003/role/disclosureRef
-Topic 810
-SubTopic 10
-Name Accounting Standards Codification
-Section 50
-Paragraph 3
-Subparagraph (bb)
-Publisher FASB
-URI https://asc.fasb.org/1943274/2147481203/810-10-50-3
Reference 12: http://www.xbrl.org/2003/role/disclosureRef
-Topic 235
-SubTopic 10
-Name Accounting Standards Codification
-Section S99
-Paragraph 1
-Subparagraph (SX 210.4-08(g)(1)(ii))
-Publisher FASB
-URI https://asc.fasb.org/1943274/2147480678/235-10-S99-1
Reference 13: http://www.xbrl.org/2003/role/disclosureRef
-Topic 323
-SubTopic 10
-Name Accounting Standards Codification
-Section 50
-Paragraph 3
-Subparagraph (c)
-Publisher FASB
-URI https://asc.fasb.org/1943274/2147481687/323-10-50-3
Reference 14: http://www.xbrl.org/2003/role/disclosureRef
-Topic 825
-SubTopic 10
-Name Accounting Standards Codification
-Section 50
-Paragraph 28
-Subparagraph (f)
-Publisher FASB
-URI https://asc.fasb.org/1943274/2147482907/825-10-50-28
Reference 15: http://www.xbrl.org/2003/role/exampleRef
-Topic 946
-SubTopic 830
-Name Accounting Standards Codification
-Section 55
-Paragraph 12
-Publisher FASB
-URI https://asc.fasb.org/1943274/2147479168/946-830-55-12
Reference 16: http://www.xbrl.org/2003/role/disclosureRef
-Topic 946
-SubTopic 210
-Name Accounting Standards Codification
-Section S99
-Paragraph 1
-Subparagraph (SX 210.6-04(14))
-Publisher FASB
-URI https://asc.fasb.org/1943274/2147479170/946-210-S99-1
Reference 17: http://www.xbrl.org/2003/role/disclosureRef
-Topic 470
-SubTopic 10
-Name Accounting Standards Codification
-Section S99
-Paragraph 1A
-Subparagraph (SX 210.13-01(a)(4)(i))
-Publisher FASB
-URI https://asc.fasb.org/1943274/2147480097/470-10-S99-1A
Reference 18: http://www.xbrl.org/2009/role/commonPracticeRef
-Topic 470
-SubTopic 10
-Name Accounting Standards Codification
-Section S99
-Paragraph 1A
-Subparagraph (SX 210.13-01(a)(4)(ii))
-Publisher FASB
-URI https://asc.fasb.org/1943274/2147480097/470-10-S99-1A
Reference 19: http://www.xbrl.org/2003/role/disclosureRef
-Topic 470
-SubTopic 10
-Name Accounting Standards Codification
-Section S99
-Paragraph 1A
-Subparagraph (SX 210.13-01(a)(4)(iii)(A))
-Publisher FASB
-URI https://asc.fasb.org/1943274/2147480097/470-10-S99-1A
Reference 20: http://www.xbrl.org/2003/role/disclosureRef
-Topic 470
-SubTopic 10
-Name Accounting Standards Codification
-Section S99
-Paragraph 1A
-Subparagraph (SX 210.13-01(a)(4)(iv))
-Publisher FASB
-URI https://asc.fasb.org/1943274/2147480097/470-10-S99-1A
Reference 21: http://www.xbrl.org/2003/role/disclosureRef
-Topic 470
-SubTopic 10
-Name Accounting Standards Codification
-Section S99
-Paragraph 1A
-Subparagraph (SX 210.13-01(a)(5))
-Publisher FASB
-URI https://asc.fasb.org/1943274/2147480097/470-10-S99-1A
Reference 22: http://www.xbrl.org/2003/role/disclosureRef
-Topic 470
-SubTopic 10
-Name Accounting Standards Codification
-Section S99
-Paragraph 1B
-Subparagraph (SX 210.13-02(a)(4)(i))
-Publisher FASB
-URI https://asc.fasb.org/1943274/2147480097/470-10-S99-1B
Reference 23: http://www.xbrl.org/2003/role/disclosureRef
-Topic 470
-SubTopic 10
-Name Accounting Standards Codification
-Section S99
-Paragraph 1B
-Subparagraph (SX 210.13-02(a)(4)(iii)(A))
-Publisher FASB
-URI https://asc.fasb.org/1943274/2147480097/470-10-S99-1B
Reference 24: http://www.xbrl.org/2003/role/disclosureRef
-Topic 470
-SubTopic 10
-Name Accounting Standards Codification
-Section S99
-Paragraph 1B
-Subparagraph (SX 210.13-02(a)(4)(iii)(B))
-Publisher FASB
-URI https://asc.fasb.org/1943274/2147480097/470-10-S99-1B
Reference 25: http://www.xbrl.org/2003/role/disclosureRef
-Topic 470
-SubTopic 10
-Name Accounting Standards Codification
-Section S99
-Paragraph 1B
-Subparagraph (SX 210.13-02(a)(4)(iv))
-Publisher FASB
-URI https://asc.fasb.org/1943274/2147480097/470-10-S99-1B
Reference 26: http://www.xbrl.org/2003/role/disclosureRef
-Topic 470
-SubTopic 10
-Name Accounting Standards Codification
-Section S99
-Paragraph 1B
-Subparagraph (SX 210.13-02(a)(5))
-Publisher FASB
-URI https://asc.fasb.org/1943274/2147480097/470-10-S99-1B
Reference 27: http://www.xbrl.org/2009/role/commonPracticeRef
-Topic 852
-SubTopic 10
-Name Accounting Standards Codification
-Section 50
-Paragraph 7
-Subparagraph (a)
-Publisher FASB
-URI https://asc.fasb.org/1943274/2147481404/852-10-50-7
Reference 28: http://www.xbrl.org/2009/role/commonPracticeRef
-Topic 852
-SubTopic 10
-Name Accounting Standards Codification
-Section 50
-Paragraph 7
-Subparagraph (b)
-Publisher FASB
-URI https://asc.fasb.org/1943274/2147481404/852-10-50-7
Reference 29: http://www.xbrl.org/2003/role/exampleRef
-Topic 280
-SubTopic 10
-Name Accounting Standards Codification
-Section 50
-Paragraph 30
-Subparagraph (d)
-Publisher FASB
-URI https://asc.fasb.org/1943274/2147482810/280-10-50-30
| Name: |
us-gaap_Liabilities |
| Namespace Prefix: |
us-gaap_ |
| Data Type: |
xbrli:monetaryItemType |
| Balance Type: |
credit |
| Period Type: |
instant |
|
| X |
- DefinitionAmount of assets classified as other. Reference 1: http://www.xbrl.org/2003/role/exampleRef
-Topic 280
-SubTopic 10
-Name Accounting Standards Codification
-Section 55
-Paragraph 49
-Publisher FASB
-URI https://asc.fasb.org/1943274/2147482785/280-10-55-49
Reference 2: http://fasb.org/us-gaap/role/ref/legacyRef
-Topic 942
-SubTopic 210
-Name Accounting Standards Codification
-Section S99
-Paragraph 1
-Subparagraph (SX 210.9-03(10))
-Publisher FASB
-URI https://asc.fasb.org/1943274/2147478546/942-210-S99-1
Reference 3: http://www.xbrl.org/2003/role/exampleRef
-Topic 946
-SubTopic 830
-Name Accounting Standards Codification
-Section 55
-Paragraph 12
-Publisher FASB
-URI https://asc.fasb.org/1943274/2147479168/946-830-55-12
Reference 4: http://www.xbrl.org/2003/role/disclosureRef
-Topic 944
-SubTopic 210
-Name Accounting Standards Codification
-Section S99
-Paragraph 1
-Subparagraph (SX 210.7-03(a)(10))
-Publisher FASB
-URI https://asc.fasb.org/1943274/2147478777/944-210-S99-1
Reference 5: http://www.xbrl.org/2003/role/disclosureRef
-Topic 210
-SubTopic 10
-Name Accounting Standards Codification
-Section S99
-Paragraph 1
-Subparagraph (SX 210.5-02(17))
-Publisher FASB
-URI https://asc.fasb.org/1943274/2147480566/210-10-S99-1
| Name: |
us-gaap_OtherAssets |
| Namespace Prefix: |
us-gaap_ |
| Data Type: |
xbrli:monetaryItemType |
| Balance Type: |
debit |
| Period Type: |
instant |
|
| X |
- DefinitionAmount of liabilities classified as other. Reference 1: http://fasb.org/us-gaap/role/ref/legacyRef
-Topic 942
-SubTopic 210
-Name Accounting Standards Codification
-Section S99
-Paragraph 1
-Subparagraph (SX 210.9-03(15))
-Publisher FASB
-URI https://asc.fasb.org/1943274/2147478546/942-210-S99-1
Reference 2: http://www.xbrl.org/2003/role/disclosureRef
-Topic 944
-SubTopic 210
-Name Accounting Standards Codification
-Section S99
-Paragraph 1
-Subparagraph (SX 210.7-03(a)(15))
-Publisher FASB
-URI https://asc.fasb.org/1943274/2147478777/944-210-S99-1
Reference 3: http://www.xbrl.org/2003/role/exampleRef
-Topic 946
-SubTopic 830
-Name Accounting Standards Codification
-Section 55
-Paragraph 12
-Publisher FASB
-URI https://asc.fasb.org/1943274/2147479168/946-830-55-12
Reference 4: http://www.xbrl.org/2003/role/disclosureRef
-Topic 946
-SubTopic 210
-Name Accounting Standards Codification
-Section S99
-Paragraph 1
-Subparagraph (SX 210.6-04(12)(b)(2))
-Publisher FASB
-URI https://asc.fasb.org/1943274/2147479170/946-210-S99-1
Reference 5: http://www.xbrl.org/2003/role/disclosureRef
-Topic 946
-SubTopic 210
-Name Accounting Standards Codification
-Section S99
-Paragraph 1
-Subparagraph (SX 210.6-04(12)(b)(3))
-Publisher FASB
-URI https://asc.fasb.org/1943274/2147479170/946-210-S99-1
Reference 6: http://www.xbrl.org/2009/role/commonPracticeRef
-Topic 946
-SubTopic 210
-Name Accounting Standards Codification
-Section S99
-Paragraph 1
-Subparagraph (SX 210.6-04(12)(b)(1))
-Publisher FASB
-URI https://asc.fasb.org/1943274/2147479170/946-210-S99-1
Reference 7: http://www.xbrl.org/2009/role/commonPracticeRef
-Topic 944
-SubTopic 210
-Name Accounting Standards Codification
-Section S99
-Paragraph 1
-Subparagraph (SX 210.7-03(a)(17))
-Publisher FASB
-URI https://asc.fasb.org/1943274/2147478777/944-210-S99-1
| Name: |
us-gaap_OtherLiabilities |
| Namespace Prefix: |
us-gaap_ |
| Data Type: |
xbrli:monetaryItemType |
| Balance Type: |
credit |
| Period Type: |
instant |
|
| X |
- DefinitionLine items represent financial concepts included in a table. These concepts are used to disclose reportable information associated with domain members defined in one or many axes to the table. Reference 1: http://www.xbrl.org/2003/role/disclosureRef
-Topic 810
-SubTopic 10
-Name Accounting Standards Codification
-Section 50
-Paragraph 3
-Subparagraph (c)
-Publisher FASB
-URI https://asc.fasb.org/1943274/2147481203/810-10-50-3
Reference 2: http://www.xbrl.org/2003/role/disclosureRef
-Topic 810
-SubTopic 10
-Name Accounting Standards Codification
-Section 45
-Paragraph 25
-Subparagraph (b)
-Publisher FASB
-URI https://asc.fasb.org/1943274/2147481231/810-10-45-25
Reference 3: http://www.xbrl.org/2003/role/disclosureRef
-Topic 810
-SubTopic 10
-Name Accounting Standards Codification
-Section 50
-Paragraph 3
-Subparagraph (bb)
-Publisher FASB
-URI https://asc.fasb.org/1943274/2147481203/810-10-50-3
Reference 4: http://www.xbrl.org/2003/role/disclosureRef
-Topic 810
-SubTopic 10
-Name Accounting Standards Codification
-Section 45
-Paragraph 25
-Subparagraph (a)
-Publisher FASB
-URI https://asc.fasb.org/1943274/2147481231/810-10-45-25
Reference 5: http://www.xbrl.org/2003/role/disclosureRef
-Topic 860
-SubTopic 30
-Name Accounting Standards Codification
-Section 50
-Paragraph 1A
-Subparagraph (b)(1)(i)
-Publisher FASB
-URI https://asc.fasb.org/1943274/2147481420/860-30-50-1A
Reference 6: http://www.xbrl.org/2003/role/disclosureRef
-Topic 860
-SubTopic 30
-Name Accounting Standards Codification
-Section 50
-Paragraph 1A
-Subparagraph (b)(1)(ii)
-Publisher FASB
-URI https://asc.fasb.org/1943274/2147481420/860-30-50-1A
Reference 7: http://www.xbrl.org/2003/role/disclosureRef
-Topic 860
-SubTopic 30
-Name Accounting Standards Codification
-Section 50
-Paragraph 1A
-Subparagraph (b)(2)
-Publisher FASB
-URI https://asc.fasb.org/1943274/2147481420/860-30-50-1A
| Name: |
us-gaap_VariableInterestEntityLineItems |
| Namespace Prefix: |
us-gaap_ |
| Data Type: |
xbrli:stringItemType |
| Balance Type: |
na |
| Period Type: |
duration |
|
| X |
- Details
| Name: |
srt_CounterpartyNameAxis=fph_SanFranciscoVentureMember |
| Namespace Prefix: |
|
| Data Type: |
na |
| Balance Type: |
|
| Period Type: |
|
|
| X |
- Details
| Name: |
srt_ConsolidatedEntitiesAxis=us-gaap_VariableInterestEntityPrimaryBeneficiaryMember |
| Namespace Prefix: |
|
| Data Type: |
na |
| Balance Type: |
|
| Period Type: |
|
|
| X |
- Details
| Name: |
srt_CounterpartyNameAxis=fph_FPLPAndFPLMember |
| Namespace Prefix: |
|
| Data Type: |
na |
| Balance Type: |
|
| Period Type: |
|
|
v3.24.2
Intangible Asset, Net - Related Party (Details) - USD ($)
$ in Thousands |
3 Months Ended |
6 Months Ended |
|
Jun. 30, 2024 |
Jun. 30, 2023 |
Jun. 30, 2024 |
Jun. 30, 2023 |
Dec. 31, 2023 |
| Goodwill and Intangible Assets Disclosure [Abstract] |
|
|
|
|
|
| Gross carrying amount |
$ 129,705
|
|
$ 129,705
|
|
$ 129,705
|
| Accumulated amortization |
(115,977)
|
|
(115,977)
|
|
(104,435)
|
| Net book value |
13,728
|
|
13,728
|
|
$ 25,270
|
| Amortization expense |
$ 9,500
|
$ 8,000
|
$ 11,500
|
$ 8,600
|
|
| X |
- DefinitionThe aggregate expense charged against earnings to allocate the cost of intangible assets (nonphysical assets not used in production) in a systematic and rational manner to the periods expected to benefit from such assets. As a noncash expense, this element is added back to net income when calculating cash provided by or used in operations using the indirect method. Reference 1: http://fasb.org/us-gaap/role/ref/legacyRef
-Name Accounting Standards Codification
-Section 45
-Paragraph 28
-Subparagraph (b)
-SubTopic 10
-Topic 230
-Publisher FASB
-URI https://asc.fasb.org/1943274/2147482740/230-10-45-28
Reference 2: http://www.xbrl.org/2003/role/exampleRef
-Topic 350
-SubTopic 30
-Name Accounting Standards Codification
-Section 55
-Paragraph 40
-Publisher FASB
-URI https://asc.fasb.org/1943274/2147482640/350-30-55-40
Reference 3: http://www.xbrl.org/2003/role/disclosureRef
-Topic 350
-SubTopic 30
-Name Accounting Standards Codification
-Section 50
-Paragraph 2
-Subparagraph (a)(2)
-Publisher FASB
-URI https://asc.fasb.org/1943274/2147482665/350-30-50-2
Reference 4: http://www.xbrl.org/2003/role/disclosureRef
-Topic 350
-SubTopic 30
-Name Accounting Standards Codification
-Section 45
-Paragraph 2
-Publisher FASB
-URI https://asc.fasb.org/1943274/2147482686/350-30-45-2
| Name: |
us-gaap_AmortizationOfIntangibleAssets |
| Namespace Prefix: |
us-gaap_ |
| Data Type: |
xbrli:monetaryItemType |
| Balance Type: |
debit |
| Period Type: |
duration |
|
| X |
- DefinitionAccumulated amount of amortization of assets, excluding financial assets and goodwill, lacking physical substance with a finite life. Reference 1: http://www.xbrl.org/2003/role/exampleRef
-Topic 350
-SubTopic 30
-Name Accounting Standards Codification
-Section 55
-Paragraph 40
-Publisher FASB
-URI https://asc.fasb.org/1943274/2147482640/350-30-55-40
Reference 2: http://www.xbrl.org/2003/role/disclosureRef
-Topic 350
-SubTopic 10
-Name Accounting Standards Codification
-Section S45
-Paragraph 1
-Publisher FASB
-URI https://asc.fasb.org/1943274/2147480265/350-10-S45-1
Reference 3: http://www.xbrl.org/2003/role/disclosureRef
-Topic 350
-SubTopic 30
-Name Accounting Standards Codification
-Section 50
-Paragraph 2
-Subparagraph (a)(1)
-Publisher FASB
-URI https://asc.fasb.org/1943274/2147482665/350-30-50-2
Reference 4: http://www.xbrl.org/2003/role/disclosureRef
-Topic 210
-SubTopic 10
-Name Accounting Standards Codification
-Section S99
-Paragraph 1
-Subparagraph (SX 210.5-02(16))
-Publisher FASB
-URI https://asc.fasb.org/1943274/2147480566/210-10-S99-1
| Name: |
us-gaap_FiniteLivedIntangibleAssetsAccumulatedAmortization |
| Namespace Prefix: |
us-gaap_ |
| Data Type: |
xbrli:monetaryItemType |
| Balance Type: |
credit |
| Period Type: |
instant |
|
| X |
- DefinitionAmount before amortization of assets, excluding financial assets and goodwill, lacking physical substance with a finite life. Reference 1: http://www.xbrl.org/2003/role/exampleRef
-Topic 350
-SubTopic 30
-Name Accounting Standards Codification
-Section 55
-Paragraph 40
-Publisher FASB
-URI https://asc.fasb.org/1943274/2147482640/350-30-55-40
Reference 2: http://www.xbrl.org/2003/role/disclosureRef
-Topic 350
-SubTopic 10
-Name Accounting Standards Codification
-Section S45
-Paragraph 1
-Publisher FASB
-URI https://asc.fasb.org/1943274/2147480265/350-10-S45-1
Reference 3: http://www.xbrl.org/2003/role/disclosureRef
-Topic 350
-SubTopic 30
-Name Accounting Standards Codification
-Section 50
-Paragraph 2
-Subparagraph (a)(1)
-Publisher FASB
-URI https://asc.fasb.org/1943274/2147482665/350-30-50-2
Reference 4: http://www.xbrl.org/2003/role/disclosureRef
-Topic 928
-SubTopic 340
-Name Accounting Standards Codification
-Section 50
-Paragraph 1
-Publisher FASB
-URI https://asc.fasb.org/1943274/2147478859/928-340-50-1
| Name: |
us-gaap_FiniteLivedIntangibleAssetsGross |
| Namespace Prefix: |
us-gaap_ |
| Data Type: |
xbrli:monetaryItemType |
| Balance Type: |
debit |
| Period Type: |
instant |
|
| X |
- DefinitionAmount after amortization of assets, excluding financial assets and goodwill, lacking physical substance with a finite life. Reference 1: http://www.xbrl.org/2009/role/commonPracticeRef
-Topic 350
-SubTopic 30
-Name Accounting Standards Codification
-Section 50
-Paragraph 2
-Subparagraph (a)(1)
-Publisher FASB
-URI https://asc.fasb.org/1943274/2147482665/350-30-50-2
Reference 2: http://www.xbrl.org/2003/role/disclosureRef
-Topic 926
-SubTopic 20
-Name Accounting Standards Codification
-Section 50
-Paragraph 5
-Publisher FASB
-URI https://asc.fasb.org/1943274/2147483154/926-20-50-5
| Name: |
us-gaap_FiniteLivedIntangibleAssetsNet |
| Namespace Prefix: |
us-gaap_ |
| Data Type: |
xbrli:monetaryItemType |
| Balance Type: |
debit |
| Period Type: |
instant |
|
| X |
- References
+ Details
| Name: |
us-gaap_GoodwillAndIntangibleAssetsDisclosureAbstract |
| Namespace Prefix: |
us-gaap_ |
| Data Type: |
xbrli:stringItemType |
| Balance Type: |
na |
| Period Type: |
duration |
|
v3.24.2
Related Party Transactions - Related Party Assets and Liabilities (Details) - USD ($)
$ in Thousands |
Jun. 30, 2024 |
Dec. 31, 2023 |
| Related Party Transaction [Line Items] |
|
|
| Related party liabilities |
$ 74,173
|
$ 78,074
|
| Related Party |
|
|
| Related Party Transaction [Line Items] |
|
|
| Other assets |
120,551
|
83,970
|
| Related party liabilities |
74,173
|
78,074
|
| Related Party | Contract Assets |
|
|
| Related Party Transaction [Line Items] |
|
|
| Other assets |
106,881
|
69,068
|
| Related Party | Operating Lease |
|
|
| Related Party Transaction [Line Items] |
|
|
| Other assets |
12,808
|
14,040
|
| Related party liabilities |
10,129
|
10,974
|
| Related Party | Other |
|
|
| Related Party Transaction [Line Items] |
|
|
| Other assets |
862
|
862
|
| Related party liabilities |
1,169
|
1,169
|
| Related Party | Reimbursement obligation |
|
|
| Related Party Transaction [Line Items] |
|
|
| Related party liabilities |
60,717
|
59,378
|
| Related Party | Payable to holders of Management Company’s Class B interests |
|
|
| Related Party Transaction [Line Items] |
|
|
| Related party liabilities |
333
|
1,828
|
| Related Party | Accrued advisory fees |
|
|
| Related Party Transaction [Line Items] |
|
|
| Related party liabilities |
$ 1,825
|
$ 4,725
|
| X |
- DefinitionAmount of assets classified as other. Reference 1: http://www.xbrl.org/2003/role/exampleRef
-Topic 280
-SubTopic 10
-Name Accounting Standards Codification
-Section 55
-Paragraph 49
-Publisher FASB
-URI https://asc.fasb.org/1943274/2147482785/280-10-55-49
Reference 2: http://fasb.org/us-gaap/role/ref/legacyRef
-Topic 942
-SubTopic 210
-Name Accounting Standards Codification
-Section S99
-Paragraph 1
-Subparagraph (SX 210.9-03(10))
-Publisher FASB
-URI https://asc.fasb.org/1943274/2147478546/942-210-S99-1
Reference 3: http://www.xbrl.org/2003/role/exampleRef
-Topic 946
-SubTopic 830
-Name Accounting Standards Codification
-Section 55
-Paragraph 12
-Publisher FASB
-URI https://asc.fasb.org/1943274/2147479168/946-830-55-12
Reference 4: http://www.xbrl.org/2003/role/disclosureRef
-Topic 944
-SubTopic 210
-Name Accounting Standards Codification
-Section S99
-Paragraph 1
-Subparagraph (SX 210.7-03(a)(10))
-Publisher FASB
-URI https://asc.fasb.org/1943274/2147478777/944-210-S99-1
Reference 5: http://www.xbrl.org/2003/role/disclosureRef
-Topic 210
-SubTopic 10
-Name Accounting Standards Codification
-Section S99
-Paragraph 1
-Subparagraph (SX 210.5-02(17))
-Publisher FASB
-URI https://asc.fasb.org/1943274/2147480566/210-10-S99-1
| Name: |
us-gaap_OtherAssets |
| Namespace Prefix: |
us-gaap_ |
| Data Type: |
xbrli:monetaryItemType |
| Balance Type: |
debit |
| Period Type: |
instant |
|
| X |
- DefinitionAmount of liabilities classified as other. Reference 1: http://fasb.org/us-gaap/role/ref/legacyRef
-Topic 942
-SubTopic 210
-Name Accounting Standards Codification
-Section S99
-Paragraph 1
-Subparagraph (SX 210.9-03(15))
-Publisher FASB
-URI https://asc.fasb.org/1943274/2147478546/942-210-S99-1
Reference 2: http://www.xbrl.org/2003/role/disclosureRef
-Topic 944
-SubTopic 210
-Name Accounting Standards Codification
-Section S99
-Paragraph 1
-Subparagraph (SX 210.7-03(a)(15))
-Publisher FASB
-URI https://asc.fasb.org/1943274/2147478777/944-210-S99-1
Reference 3: http://www.xbrl.org/2003/role/exampleRef
-Topic 946
-SubTopic 830
-Name Accounting Standards Codification
-Section 55
-Paragraph 12
-Publisher FASB
-URI https://asc.fasb.org/1943274/2147479168/946-830-55-12
Reference 4: http://www.xbrl.org/2003/role/disclosureRef
-Topic 946
-SubTopic 210
-Name Accounting Standards Codification
-Section S99
-Paragraph 1
-Subparagraph (SX 210.6-04(12)(b)(2))
-Publisher FASB
-URI https://asc.fasb.org/1943274/2147479170/946-210-S99-1
Reference 5: http://www.xbrl.org/2003/role/disclosureRef
-Topic 946
-SubTopic 210
-Name Accounting Standards Codification
-Section S99
-Paragraph 1
-Subparagraph (SX 210.6-04(12)(b)(3))
-Publisher FASB
-URI https://asc.fasb.org/1943274/2147479170/946-210-S99-1
Reference 6: http://www.xbrl.org/2009/role/commonPracticeRef
-Topic 946
-SubTopic 210
-Name Accounting Standards Codification
-Section S99
-Paragraph 1
-Subparagraph (SX 210.6-04(12)(b)(1))
-Publisher FASB
-URI https://asc.fasb.org/1943274/2147479170/946-210-S99-1
Reference 7: http://www.xbrl.org/2009/role/commonPracticeRef
-Topic 944
-SubTopic 210
-Name Accounting Standards Codification
-Section S99
-Paragraph 1
-Subparagraph (SX 210.7-03(a)(17))
-Publisher FASB
-URI https://asc.fasb.org/1943274/2147478777/944-210-S99-1
| Name: |
us-gaap_OtherLiabilities |
| Namespace Prefix: |
us-gaap_ |
| Data Type: |
xbrli:monetaryItemType |
| Balance Type: |
credit |
| Period Type: |
instant |
|
v3.24.2
Related Party Transactions - Additional Information (Details) - USD ($)
$ in Thousands |
3 Months Ended |
6 Months Ended |
|
Jun. 30, 2024 |
Jun. 30, 2023 |
Jun. 30, 2024 |
Jun. 30, 2023 |
Dec. 31, 2023 |
| Related Party Transaction [Line Items] |
|
|
|
|
|
| Revenues |
$ 51,192
|
$ 21,349
|
$ 61,127
|
$ 27,050
|
|
| Equity Method Investee |
|
|
|
|
|
| Related Party Transaction [Line Items] |
|
|
|
|
|
| Distribution to certain interest holders, aggregate |
1,500
|
|
1,500
|
|
|
| Related Party |
|
|
|
|
|
| Related Party Transaction [Line Items] |
|
|
|
|
|
| Other assets |
120,551
|
|
120,551
|
|
$ 83,970
|
| Related Party | Management services |
|
|
|
|
|
| Related Party Transaction [Line Items] |
|
|
|
|
|
| Revenues |
50,279
|
20,774
|
59,005
|
25,010
|
|
| Legacy Incentive Compensation Receivable | Equity Method Investee |
|
|
|
|
|
| Related Party Transaction [Line Items] |
|
|
|
|
|
| Revenue from customers |
|
|
1,500
|
|
|
| Legacy Incentive Compensation Receivable | Related Party |
|
|
|
|
|
| Related Party Transaction [Line Items] |
|
|
|
|
|
| Other assets |
104,600
|
|
104,600
|
|
$ 66,100
|
| Contract Assets - Non-Legacy Incentive Compensation Receivable | Equity Method Investee |
|
|
|
|
|
| Related Party Transaction [Line Items] |
|
|
|
|
|
| Revenue from customers |
|
|
12,800
|
|
|
| Development Management Agreement | Related Party | Management services |
|
|
|
|
|
| Related Party Transaction [Line Items] |
|
|
|
|
|
| Revenues |
$ 50,200
|
$ 20,700
|
$ 58,800
|
$ 24,800
|
|
| Great Park Venture | Legacy Incentive Compensation Receivable | Equity Method Investee |
|
|
|
|
|
| Related Party Transaction [Line Items] |
|
|
|
|
|
| Percentage of distributions during initial term |
|
|
9.00%
|
|
|
| Percentage of distributions after initial term |
|
|
6.75%
|
|
|
| X |
- DefinitionRelated Party Transaction, Distributions
| Name: |
fph_DistributionMadetoLimitedLiabilityCompanyLLCMemberCashDistributionsPaidAggregate |
| Namespace Prefix: |
fph_ |
| Data Type: |
xbrli:monetaryItemType |
| Balance Type: |
credit |
| Period Type: |
instant |
|
| X |
- DefinitionPercentage of Distributions After Initial Term
| Name: |
fph_PercentageOfDistributionsAfterInitialTerm |
| Namespace Prefix: |
fph_ |
| Data Type: |
dtr-types1:percentItemType |
| Balance Type: |
na |
| Period Type: |
duration |
|
| X |
- DefinitionPercentage of Distributions During Initial Term
| Name: |
fph_PercentageOfDistributionsDuringInitialTerm |
| Namespace Prefix: |
fph_ |
| Data Type: |
dtr-types1:percentItemType |
| Balance Type: |
na |
| Period Type: |
duration |
|
| X |
- DefinitionAmount of assets classified as other. Reference 1: http://www.xbrl.org/2003/role/exampleRef
-Topic 280
-SubTopic 10
-Name Accounting Standards Codification
-Section 55
-Paragraph 49
-Publisher FASB
-URI https://asc.fasb.org/1943274/2147482785/280-10-55-49
Reference 2: http://fasb.org/us-gaap/role/ref/legacyRef
-Topic 942
-SubTopic 210
-Name Accounting Standards Codification
-Section S99
-Paragraph 1
-Subparagraph (SX 210.9-03(10))
-Publisher FASB
-URI https://asc.fasb.org/1943274/2147478546/942-210-S99-1
Reference 3: http://www.xbrl.org/2003/role/exampleRef
-Topic 946
-SubTopic 830
-Name Accounting Standards Codification
-Section 55
-Paragraph 12
-Publisher FASB
-URI https://asc.fasb.org/1943274/2147479168/946-830-55-12
Reference 4: http://www.xbrl.org/2003/role/disclosureRef
-Topic 944
-SubTopic 210
-Name Accounting Standards Codification
-Section S99
-Paragraph 1
-Subparagraph (SX 210.7-03(a)(10))
-Publisher FASB
-URI https://asc.fasb.org/1943274/2147478777/944-210-S99-1
Reference 5: http://www.xbrl.org/2003/role/disclosureRef
-Topic 210
-SubTopic 10
-Name Accounting Standards Codification
-Section S99
-Paragraph 1
-Subparagraph (SX 210.5-02(17))
-Publisher FASB
-URI https://asc.fasb.org/1943274/2147480566/210-10-S99-1
| Name: |
us-gaap_OtherAssets |
| Namespace Prefix: |
us-gaap_ |
| Data Type: |
xbrli:monetaryItemType |
| Balance Type: |
debit |
| Period Type: |
instant |
|
| X |
- DefinitionCash receipts from customers during the current period which are usually for sales of goods and services. Reference 1: http://fasb.org/us-gaap/role/ref/legacyRef
-Topic 230
-SubTopic 10
-Name Accounting Standards Codification
-Section 45
-Paragraph 25
-Subparagraph (a)
-Publisher FASB
-URI https://asc.fasb.org/1943274/2147482740/230-10-45-25
| Name: |
us-gaap_ProceedsFromCustomers |
| Namespace Prefix: |
us-gaap_ |
| Data Type: |
xbrli:monetaryItemType |
| Balance Type: |
debit |
| Period Type: |
duration |
|
| X |
- DefinitionAmount of revenue recognized from goods sold, services rendered, insurance premiums, or other activities that constitute an earning process. Includes, but is not limited to, investment and interest income before deduction of interest expense when recognized as a component of revenue, and sales and trading gain (loss). Reference 1: http://www.xbrl.org/2003/role/exampleRef
-Topic 280
-SubTopic 10
-Name Accounting Standards Codification
-Section 55
-Paragraph 48
-Publisher FASB
-URI https://asc.fasb.org/1943274/2147482785/280-10-55-48
Reference 2: http://www.xbrl.org/2003/role/disclosureRef
-Topic 280
-SubTopic 10
-Name Accounting Standards Codification
-Section 50
-Paragraph 41
-Subparagraph (a)
-Publisher FASB
-URI https://asc.fasb.org/1943274/2147482810/280-10-50-41
Reference 3: http://www.xbrl.org/2003/role/disclosureRef
-Topic 270
-SubTopic 10
-Name Accounting Standards Codification
-Section 50
-Paragraph 1
-Subparagraph (i)
-Publisher FASB
-URI https://asc.fasb.org/1943274/2147482964/270-10-50-1
Reference 4: http://www.xbrl.org/2003/role/disclosureRef
-Topic 280
-SubTopic 10
-Name Accounting Standards Codification
-Section 50
-Paragraph 32
-Subparagraph (ee)
-Publisher FASB
-URI https://asc.fasb.org/1943274/2147482810/280-10-50-32
Reference 5: http://fasb.org/us-gaap/role/ref/otherTransitionRef
-Topic 280
-SubTopic 10
-Name Accounting Standards Codification
-Section 50
-Paragraph 32
-Subparagraph (b)
-Publisher FASB
-URI https://asc.fasb.org/1943274/2147482810/280-10-50-32
Reference 6: http://fasb.org/us-gaap/role/ref/otherTransitionRef
-Topic 280
-SubTopic 10
-Name Accounting Standards Codification
-Section 50
-Paragraph 32
-Subparagraph (a)
-Publisher FASB
-URI https://asc.fasb.org/1943274/2147482810/280-10-50-32
Reference 7: http://www.xbrl.org/2003/role/disclosureRef
-Topic 235
-SubTopic 10
-Name Accounting Standards Codification
-Section S99
-Paragraph 1
-Subparagraph (SX 210.4-08(g)(1)(ii))
-Publisher FASB
-URI https://asc.fasb.org/1943274/2147480678/235-10-S99-1
Reference 8: http://www.xbrl.org/2003/role/disclosureRef
-Topic 323
-SubTopic 10
-Name Accounting Standards Codification
-Section 50
-Paragraph 3
-Subparagraph (c)
-Publisher FASB
-URI https://asc.fasb.org/1943274/2147481687/323-10-50-3
Reference 9: http://www.xbrl.org/2003/role/disclosureRef
-Topic 825
-SubTopic 10
-Name Accounting Standards Codification
-Section 50
-Paragraph 28
-Subparagraph (f)
-Publisher FASB
-URI https://asc.fasb.org/1943274/2147482907/825-10-50-28
Reference 10: http://www.xbrl.org/2003/role/disclosureRef
-Topic 470
-SubTopic 10
-Name Accounting Standards Codification
-Section S99
-Paragraph 1A
-Subparagraph (SX 210.13-01(a)(4)(i))
-Publisher FASB
-URI https://asc.fasb.org/1943274/2147480097/470-10-S99-1A
Reference 11: http://www.xbrl.org/2009/role/commonPracticeRef
-Topic 470
-SubTopic 10
-Name Accounting Standards Codification
-Section S99
-Paragraph 1A
-Subparagraph (SX 210.13-01(a)(4)(ii))
-Publisher FASB
-URI https://asc.fasb.org/1943274/2147480097/470-10-S99-1A
Reference 12: http://www.xbrl.org/2003/role/disclosureRef
-Topic 470
-SubTopic 10
-Name Accounting Standards Codification
-Section S99
-Paragraph 1A
-Subparagraph (SX 210.13-01(a)(4)(iii)(A))
-Publisher FASB
-URI https://asc.fasb.org/1943274/2147480097/470-10-S99-1A
Reference 13: http://www.xbrl.org/2003/role/disclosureRef
-Topic 470
-SubTopic 10
-Name Accounting Standards Codification
-Section S99
-Paragraph 1A
-Subparagraph (SX 210.13-01(a)(4)(iv))
-Publisher FASB
-URI https://asc.fasb.org/1943274/2147480097/470-10-S99-1A
Reference 14: http://www.xbrl.org/2003/role/disclosureRef
-Topic 470
-SubTopic 10
-Name Accounting Standards Codification
-Section S99
-Paragraph 1A
-Subparagraph (SX 210.13-01(a)(5))
-Publisher FASB
-URI https://asc.fasb.org/1943274/2147480097/470-10-S99-1A
Reference 15: http://www.xbrl.org/2003/role/disclosureRef
-Topic 470
-SubTopic 10
-Name Accounting Standards Codification
-Section S99
-Paragraph 1B
-Subparagraph (SX 210.13-02(a)(4)(i))
-Publisher FASB
-URI https://asc.fasb.org/1943274/2147480097/470-10-S99-1B
Reference 16: http://www.xbrl.org/2003/role/disclosureRef
-Topic 470
-SubTopic 10
-Name Accounting Standards Codification
-Section S99
-Paragraph 1B
-Subparagraph (SX 210.13-02(a)(4)(iii)(A))
-Publisher FASB
-URI https://asc.fasb.org/1943274/2147480097/470-10-S99-1B
Reference 17: http://www.xbrl.org/2003/role/disclosureRef
-Topic 470
-SubTopic 10
-Name Accounting Standards Codification
-Section S99
-Paragraph 1B
-Subparagraph (SX 210.13-02(a)(4)(iii)(B))
-Publisher FASB
-URI https://asc.fasb.org/1943274/2147480097/470-10-S99-1B
Reference 18: http://www.xbrl.org/2003/role/disclosureRef
-Topic 470
-SubTopic 10
-Name Accounting Standards Codification
-Section S99
-Paragraph 1B
-Subparagraph (SX 210.13-02(a)(4)(iv))
-Publisher FASB
-URI https://asc.fasb.org/1943274/2147480097/470-10-S99-1B
Reference 19: http://www.xbrl.org/2003/role/disclosureRef
-Topic 470
-SubTopic 10
-Name Accounting Standards Codification
-Section S99
-Paragraph 1B
-Subparagraph (SX 210.13-02(a)(5))
-Publisher FASB
-URI https://asc.fasb.org/1943274/2147480097/470-10-S99-1B
Reference 20: http://www.xbrl.org/2003/role/disclosureRef
-Topic 280
-SubTopic 10
-Name Accounting Standards Codification
-Section 50
-Paragraph 30
-Subparagraph (a)
-Publisher FASB
-URI https://asc.fasb.org/1943274/2147482810/280-10-50-30
Reference 21: http://www.xbrl.org/2003/role/disclosureRef
-Topic 280
-SubTopic 10
-Name Accounting Standards Codification
-Section 50
-Paragraph 42
-Publisher FASB
-URI https://asc.fasb.org/1943274/2147482810/280-10-50-42
Reference 22: http://www.xbrl.org/2003/role/disclosureRef
-Topic 280
-SubTopic 10
-Name Accounting Standards Codification
-Section 50
-Paragraph 22
-Subparagraph (b)
-Publisher FASB
-URI https://asc.fasb.org/1943274/2147482810/280-10-50-22
Reference 23: http://www.xbrl.org/2003/role/disclosureRef
-Topic 280
-SubTopic 10
-Name Accounting Standards Codification
-Section 50
-Paragraph 40
-Publisher FASB
-URI https://asc.fasb.org/1943274/2147482810/280-10-50-40
Reference 24: http://www.xbrl.org/2003/role/disclosureRef
-Topic 280
-SubTopic 10
-Name Accounting Standards Codification
-Section 50
-Paragraph 22
-Subparagraph (a)
-Publisher FASB
-URI https://asc.fasb.org/1943274/2147482810/280-10-50-22
Reference 25: http://www.xbrl.org/2003/role/disclosureRef
-Topic 942
-SubTopic 235
-Name Accounting Standards Codification
-Section S99
-Paragraph 1
-Subparagraph (SX 210.9-05(b)(2))
-Publisher FASB
-URI https://asc.fasb.org/1943274/2147477314/942-235-S99-1
Reference 26: http://www.xbrl.org/2003/role/disclosureRef
-Topic 220
-SubTopic 10
-Name Accounting Standards Codification
-Section S99
-Paragraph 2
-Subparagraph (SX 210.5-03(1))
-Publisher FASB
-URI https://asc.fasb.org/1943274/2147483621/220-10-S99-2
| Name: |
us-gaap_Revenues |
| Namespace Prefix: |
us-gaap_ |
| Data Type: |
xbrli:monetaryItemType |
| Balance Type: |
credit |
| Period Type: |
duration |
|
| X |
- Details
| Name: |
srt_ProductOrServiceAxis=us-gaap_ManagementServiceMember |
| Namespace Prefix: |
|
| Data Type: |
na |
| Balance Type: |
|
| Period Type: |
|
|
| X |
- Details
| Name: |
srt_ScheduleOfEquityMethodInvestmentEquityMethodInvesteeNameAxis=fph_GreatParkVentureMember |
| Namespace Prefix: |
|
| Data Type: |
na |
| Balance Type: |
|
| Period Type: |
|
|
v3.24.2
Notes Payable, Net - Long-term Debt Instruments (Details) - USD ($)
$ in Thousands |
Jun. 30, 2024 |
Jan. 16, 2024 |
Dec. 31, 2023 |
| Debt Instrument [Line Items] |
|
|
|
| Promissory note issued |
$ 524,104
|
|
$ 622,186
|
| Unamortized premium |
1,206
|
|
0
|
| Unamortized debt issuance costs |
$ (2,096)
|
|
(2,814)
|
| $10.500% initial rate New Senior Notes due 2028 | Senior Notes |
|
|
|
| Debt Instrument [Line Items] |
|
|
|
| Interest rate on new notes (as percent) |
10.50%
|
10.50%
|
|
| Promissory note issued |
$ 523,494
|
|
0
|
| 7.875% Senior Notes due 2025 | Senior Notes |
|
|
|
| Debt Instrument [Line Items] |
|
|
|
| Interest rate on new notes (as percent) |
7.875%
|
|
|
| Promissory note issued |
$ 1,500
|
|
$ 625,000
|
| X |
- DefinitionAmount, before unamortized (discount) premium and debt issuance costs, of long-term debt. Includes, but is not limited to, notes payable, bonds payable, commercial loans, mortgage loans, convertible debt, subordinated debt and other types of debt. Reference 1: http://fasb.org/us-gaap/role/ref/legacyRef
-Name Accounting Standards Codification
-Section S99
-Paragraph 1
-Subparagraph (SX 210.5-02(22))
-SubTopic 10
-Topic 210
-Publisher FASB
-URI https://asc.fasb.org/1943274/2147480566/210-10-S99-1
Reference 2: http://fasb.org/us-gaap/role/ref/legacyRef
-Topic 942
-SubTopic 210
-Name Accounting Standards Codification
-Section S99
-Paragraph 1
-Subparagraph (SX 210.9-03(16))
-Publisher FASB
-URI https://asc.fasb.org/1943274/2147478546/942-210-S99-1
Reference 3: http://www.xbrl.org/2003/role/disclosureRef
-Topic 470
-SubTopic 20
-Name Accounting Standards Codification
-Section 50
-Paragraph 4
-Subparagraph (b)(1)
-Publisher FASB
-URI https://asc.fasb.org/1943274/2147481139/470-20-50-4
| Name: |
us-gaap_DebtInstrumentCarryingAmount |
| Namespace Prefix: |
us-gaap_ |
| Data Type: |
xbrli:monetaryItemType |
| Balance Type: |
credit |
| Period Type: |
instant |
|
| X |
- DefinitionContractual interest rate for funds borrowed, under the debt agreement. Reference 1: http://fasb.org/us-gaap/role/ref/legacyRef
-Topic 210
-SubTopic 10
-Name Accounting Standards Codification
-Section S99
-Paragraph 1
-Subparagraph (SX 210.5-02(22)(a)(1))
-Publisher FASB
-URI https://asc.fasb.org/1943274/2147480566/210-10-S99-1
Reference 2: http://www.xbrl.org/2003/role/disclosureRef
-Topic 470
-SubTopic 20
-Name Accounting Standards Codification
-Section 50
-Paragraph 1B
-Subparagraph (b)
-Publisher FASB
-URI https://asc.fasb.org/1943274/2147481139/470-20-50-1B
| Name: |
us-gaap_DebtInstrumentInterestRateStatedPercentage |
| Namespace Prefix: |
us-gaap_ |
| Data Type: |
dtr-types:percentItemType |
| Balance Type: |
na |
| Period Type: |
instant |
|
| X |
- DefinitionLine items represent financial concepts included in a table. These concepts are used to disclose reportable information associated with domain members defined in one or many axes to the table. Reference 1: http://www.xbrl.org/2003/role/exampleRef
-Topic 835
-SubTopic 30
-Name Accounting Standards Codification
-Section 55
-Paragraph 8
-Publisher FASB
-URI https://asc.fasb.org/1943274/2147482949/835-30-55-8
Reference 2: http://www.xbrl.org/2009/role/commonPracticeRef
-Topic 235
-SubTopic 10
-Name Accounting Standards Codification
-Section S99
-Paragraph 1
-Subparagraph (SX 210.4-08(f))
-Publisher FASB
-URI https://asc.fasb.org/1943274/2147480678/235-10-S99-1
Reference 3: http://www.xbrl.org/2003/role/disclosureRef
-Topic 235
-SubTopic 10
-Name Accounting Standards Codification
-Section S99
-Paragraph 3
-Subparagraph (SX 210.12-04(a))
-Publisher FASB
-URI https://asc.fasb.org/1943274/2147480678/235-10-S99-3
Reference 4: http://www.xbrl.org/2003/role/disclosureRef
-Topic 470
-SubTopic 20
-Name Accounting Standards Codification
-Section 50
-Paragraph 1B
-Subparagraph (a)
-Publisher FASB
-URI https://asc.fasb.org/1943274/2147481139/470-20-50-1B
Reference 5: http://www.xbrl.org/2003/role/exampleRef
-Topic 470
-SubTopic 20
-Name Accounting Standards Codification
-Section 55
-Paragraph 69B
-Publisher FASB
-URI https://asc.fasb.org/1943274/2147481568/470-20-55-69B
Reference 6: http://www.xbrl.org/2003/role/exampleRef
-Topic 470
-SubTopic 20
-Name Accounting Standards Codification
-Section 55
-Paragraph 69C
-Publisher FASB
-URI https://asc.fasb.org/1943274/2147481568/470-20-55-69C
Reference 7: http://www.xbrl.org/2003/role/exampleRef
-Topic 470
-SubTopic 20
-Name Accounting Standards Codification
-Section 55
-Paragraph 69E
-Publisher FASB
-URI https://asc.fasb.org/1943274/2147481568/470-20-55-69E
Reference 8: http://www.xbrl.org/2003/role/exampleRef
-Topic 470
-SubTopic 20
-Name Accounting Standards Codification
-Section 55
-Paragraph 69F
-Publisher FASB
-URI https://asc.fasb.org/1943274/2147481568/470-20-55-69F
Reference 9: http://www.xbrl.org/2003/role/disclosureRef
-Topic 470
-SubTopic 20
-Name Accounting Standards Codification
-Section 50
-Paragraph 1B
-Subparagraph (b)
-Publisher FASB
-URI https://asc.fasb.org/1943274/2147481139/470-20-50-1B
Reference 10: http://www.xbrl.org/2003/role/disclosureRef
-Topic 470
-SubTopic 20
-Name Accounting Standards Codification
-Section 50
-Paragraph 1B
-Subparagraph (c)
-Publisher FASB
-URI https://asc.fasb.org/1943274/2147481139/470-20-50-1B
Reference 11: http://www.xbrl.org/2003/role/exampleRef
-Topic 470
-SubTopic 20
-Name Accounting Standards Codification
-Section 50
-Paragraph 1B
-Subparagraph (d)
-Publisher FASB
-URI https://asc.fasb.org/1943274/2147481139/470-20-50-1B
Reference 12: http://www.xbrl.org/2003/role/disclosureRef
-Topic 470
-SubTopic 20
-Name Accounting Standards Codification
-Section 50
-Paragraph 1B
-Subparagraph (e)
-Publisher FASB
-URI https://asc.fasb.org/1943274/2147481139/470-20-50-1B
Reference 13: http://www.xbrl.org/2003/role/disclosureRef
-Topic 470
-SubTopic 20
-Name Accounting Standards Codification
-Section 50
-Paragraph 1B
-Subparagraph (f)
-Publisher FASB
-URI https://asc.fasb.org/1943274/2147481139/470-20-50-1B
Reference 14: http://www.xbrl.org/2003/role/disclosureRef
-Topic 470
-SubTopic 20
-Name Accounting Standards Codification
-Section 50
-Paragraph 1B
-Subparagraph (h)
-Publisher FASB
-URI https://asc.fasb.org/1943274/2147481139/470-20-50-1B
Reference 15: http://www.xbrl.org/2003/role/disclosureRef
-Topic 470
-SubTopic 20
-Name Accounting Standards Codification
-Section 50
-Paragraph 1D
-Subparagraph (a)
-Publisher FASB
-URI https://asc.fasb.org/1943274/2147481139/470-20-50-1D
Reference 16: http://www.xbrl.org/2003/role/disclosureRef
-Topic 470
-SubTopic 20
-Name Accounting Standards Codification
-Section 50
-Paragraph 1D
-Subparagraph (b)
-Publisher FASB
-URI https://asc.fasb.org/1943274/2147481139/470-20-50-1D
Reference 17: http://www.xbrl.org/2003/role/disclosureRef
-Topic 470
-SubTopic 20
-Name Accounting Standards Codification
-Section 50
-Paragraph 1D
-Subparagraph (c)
-Publisher FASB
-URI https://asc.fasb.org/1943274/2147481139/470-20-50-1D
Reference 18: http://www.xbrl.org/2003/role/disclosureRef
-Topic 470
-SubTopic 20
-Name Accounting Standards Codification
-Section 50
-Paragraph 1E
-Subparagraph (a)
-Publisher FASB
-URI https://asc.fasb.org/1943274/2147481139/470-20-50-1E
Reference 19: http://www.xbrl.org/2003/role/disclosureRef
-Topic 470
-SubTopic 20
-Name Accounting Standards Codification
-Section 50
-Paragraph 1E
-Subparagraph (c)
-Publisher FASB
-URI https://asc.fasb.org/1943274/2147481139/470-20-50-1E
Reference 20: http://www.xbrl.org/2003/role/disclosureRef
-Topic 470
-SubTopic 20
-Name Accounting Standards Codification
-Section 50
-Paragraph 1E
-Subparagraph (d)
-Publisher FASB
-URI https://asc.fasb.org/1943274/2147481139/470-20-50-1E
Reference 21: http://www.xbrl.org/2003/role/disclosureRef
-Topic 470
-SubTopic 20
-Name Accounting Standards Codification
-Section 50
-Paragraph 1F
-Subparagraph (a)
-Publisher FASB
-URI https://asc.fasb.org/1943274/2147481139/470-20-50-1F
Reference 22: http://www.xbrl.org/2003/role/disclosureRef
-Topic 470
-SubTopic 20
-Name Accounting Standards Codification
-Section 50
-Paragraph 1F
-Subparagraph (b)
-Publisher FASB
-URI https://asc.fasb.org/1943274/2147481139/470-20-50-1F
Reference 23: http://www.xbrl.org/2003/role/disclosureRef
-Topic 470
-SubTopic 20
-Name Accounting Standards Codification
-Section 50
-Paragraph 1F
-Subparagraph (b)(1)
-Publisher FASB
-URI https://asc.fasb.org/1943274/2147481139/470-20-50-1F
Reference 24: http://www.xbrl.org/2003/role/disclosureRef
-Topic 470
-SubTopic 20
-Name Accounting Standards Codification
-Section 50
-Paragraph 1F
-Subparagraph (b)(2)
-Publisher FASB
-URI https://asc.fasb.org/1943274/2147481139/470-20-50-1F
Reference 25: http://www.xbrl.org/2003/role/disclosureRef
-Topic 470
-SubTopic 20
-Name Accounting Standards Codification
-Section 50
-Paragraph 1I
-Subparagraph (c)
-Publisher FASB
-URI https://asc.fasb.org/1943274/2147481139/470-20-50-1I
Reference 26: http://www.xbrl.org/2009/role/commonPracticeRef
-Topic 835
-SubTopic 30
-Name Accounting Standards Codification
-Section 45
-Paragraph 2
-Publisher FASB
-URI https://asc.fasb.org/1943274/2147482925/835-30-45-2
Reference 27: http://www.xbrl.org/2009/role/commonPracticeRef
-Topic 835
-SubTopic 30
-Name Accounting Standards Codification
-Section 50
-Paragraph 1
-Publisher FASB
-URI https://asc.fasb.org/1943274/2147482900/835-30-50-1
| Name: |
us-gaap_DebtInstrumentLineItems |
| Namespace Prefix: |
us-gaap_ |
| Data Type: |
xbrli:stringItemType |
| Balance Type: |
na |
| Period Type: |
duration |
|
| X |
- DefinitionAmount, after accumulated amortization, of debt premium. Reference 1: http://www.xbrl.org/2009/role/commonPracticeRef
-Topic 835
-SubTopic 30
-Name Accounting Standards Codification
-Section 45
-Paragraph 1A
-Publisher FASB
-URI https://asc.fasb.org/1943274/2147482925/835-30-45-1A
Reference 2: http://www.xbrl.org/2009/role/commonPracticeRef
-Topic 835
-SubTopic 30
-Name Accounting Standards Codification
-Section 45
-Paragraph 2
-Publisher FASB
-URI https://asc.fasb.org/1943274/2147482925/835-30-45-2
Reference 3: http://www.xbrl.org/2009/role/commonPracticeRef
-Topic 835
-SubTopic 30
-Name Accounting Standards Codification
-Section 50
-Paragraph 1
-Publisher FASB
-URI https://asc.fasb.org/1943274/2147482900/835-30-50-1
Reference 4: http://www.xbrl.org/2009/role/commonPracticeRef
-Topic 470
-SubTopic 20
-Name Accounting Standards Codification
-Section 50
-Paragraph 1D
-Subparagraph (a)
-Publisher FASB
-URI https://asc.fasb.org/1943274/2147481139/470-20-50-1D
| Name: |
us-gaap_DebtInstrumentUnamortizedPremium |
| Namespace Prefix: |
us-gaap_ |
| Data Type: |
xbrli:monetaryItemType |
| Balance Type: |
credit |
| Period Type: |
instant |
|
| X |
- DefinitionAmount, after accumulated amortization, of debt issuance costs. Includes, but is not limited to, legal, accounting, underwriting, printing, and registration costs. Reference 1: http://www.xbrl.org/2009/role/commonPracticeRef
-Topic 835
-SubTopic 30
-Name Accounting Standards Codification
-Section 45
-Paragraph 1A
-Publisher FASB
-URI https://asc.fasb.org/1943274/2147482925/835-30-45-1A
Reference 2: http://www.xbrl.org/2009/role/commonPracticeRef
-Topic 835
-SubTopic 30
-Name Accounting Standards Codification
-Section 45
-Paragraph 2
-Publisher FASB
-URI https://asc.fasb.org/1943274/2147482925/835-30-45-2
Reference 3: http://www.xbrl.org/2009/role/commonPracticeRef
-Topic 835
-SubTopic 30
-Name Accounting Standards Codification
-Section 50
-Paragraph 1
-Publisher FASB
-URI https://asc.fasb.org/1943274/2147482900/835-30-50-1
Reference 4: http://www.xbrl.org/2009/role/commonPracticeRef
-Topic 470
-SubTopic 20
-Name Accounting Standards Codification
-Section 50
-Paragraph 1D
-Subparagraph (a)
-Publisher FASB
-URI https://asc.fasb.org/1943274/2147481139/470-20-50-1D
| Name: |
us-gaap_DeferredFinanceCostsNet |
| Namespace Prefix: |
us-gaap_ |
| Data Type: |
xbrli:monetaryItemType |
| Balance Type: |
debit |
| Period Type: |
instant |
|
| X |
- Details
| Name: |
us-gaap_DebtInstrumentAxis=fph_SeniorNotesDue202810.500Member |
| Namespace Prefix: |
|
| Data Type: |
na |
| Balance Type: |
|
| Period Type: |
|
|
| X |
- Details
| Name: |
us-gaap_LongtermDebtTypeAxis=us-gaap_SeniorNotesMember |
| Namespace Prefix: |
|
| Data Type: |
na |
| Balance Type: |
|
| Period Type: |
|
|
| X |
- Details
| Name: |
us-gaap_DebtInstrumentAxis=fph_SeniorNotesDue20257.875Member |
| Namespace Prefix: |
|
| Data Type: |
na |
| Balance Type: |
|
| Period Type: |
|
|
v3.24.2
Notes Payable, Net - Additional Information (Details) - USD ($)
|
|
6 Months Ended |
|
Jan. 16, 2024 |
Jun. 30, 2024 |
Dec. 31, 2023 |
| Debt Instrument [Line Items] |
|
|
|
| Debt modification costs |
|
$ 5,900,000
|
|
| Outstanding letters of credit |
|
1,000,000
|
$ 1,000,000
|
| Senior Notes |
|
|
|
| Debt Instrument [Line Items] |
|
|
|
| Repayments of debt |
$ 100,000,000
|
|
|
| Unsecured Debt | Revolving Credit Facility |
|
|
|
| Debt Instrument [Line Items] |
|
|
|
| Senior unsecured revolving credit facility, maximum borrowing capacity |
|
$ 125,000,000
|
|
| Debt Instrument, Variable Interest Rate, Type [Extensible Enumeration] |
|
Secured Overnight Financing Rate (SOFR) [Member]
|
|
| Accordion Feature, increase limit |
|
$ 150,000,000
|
|
| Long-term line of credit |
|
0
|
|
| Outstanding letters of credit |
|
$ 0
|
|
| Unsecured Debt | Revolving Credit Facility | Variable Rate Component One |
|
|
|
| Debt Instrument [Line Items] |
|
|
|
| Additional basis spread on variable rate (as percent) |
|
0.10%
|
|
| Unsecured Debt | Revolving Credit Facility | Variable Rate Component two | Minimum |
|
|
|
| Debt Instrument [Line Items] |
|
|
|
| Basis spread on variable rate (as percent) |
|
2.25%
|
|
| Unsecured Debt | Revolving Credit Facility | Variable Rate Component two | Maximum |
|
|
|
| Debt Instrument [Line Items] |
|
|
|
| Basis spread on variable rate (as percent) |
|
2.50%
|
|
| 7.875% Senior Notes due 2025 | Senior Notes |
|
|
|
| Debt Instrument [Line Items] |
|
|
|
| Aggregate principal amount |
|
$ 625,000,000
|
|
| Interest rate on new notes (as percent) |
|
7.875%
|
|
| Repurchase amount |
$ 623,500,000
|
|
|
| Aggregate principal redeemed (up to) (as percent) |
99.76%
|
|
|
| $10.500% initial rate New Senior Notes due 2028 | Senior Notes |
|
|
|
| Debt Instrument [Line Items] |
|
|
|
| Aggregate principal amount |
$ 523,500,000
|
|
|
| Interest rate on new notes (as percent) |
10.50%
|
10.50%
|
|
| $10.500% initial rate New Senior Notes due 2028 | Senior Notes | January 16, 2024 To November 14, 2025 |
|
|
|
| Debt Instrument [Line Items] |
|
|
|
| Interest rate on new notes (as percent) |
10.50%
|
|
|
| $10.500% initial rate New Senior Notes due 2028 | Senior Notes | November 15, 2025 To November 14, 2026 |
|
|
|
| Debt Instrument [Line Items] |
|
|
|
| Interest rate on new notes (as percent) |
11.00%
|
|
|
| $10.500% initial rate New Senior Notes due 2028 | Senior Notes | November 15, 2026 To January 14, 2028 |
|
|
|
| Debt Instrument [Line Items] |
|
|
|
| Interest rate on new notes (as percent) |
12.00%
|
|
|
| Revolving Credit Facility due in July 2027 | Unsecured Debt | Revolving Credit Facility |
|
|
|
| Debt Instrument [Line Items] |
|
|
|
| Senior unsecured revolving credit facility, maximum borrowing capacity |
|
$ 100,000,000
|
|
| Revolving Credit Facility due in April 2026 | Unsecured Debt | Revolving Credit Facility |
|
|
|
| Debt Instrument [Line Items] |
|
|
|
| Senior unsecured revolving credit facility, maximum borrowing capacity |
|
$ 25,000,000
|
|
| X |
- DefinitionDebt Instrument, Additional Basis Spread on Variable Rate
| Name: |
fph_DebtInstrumentAdditionalBasisSpreadOnVariableRate |
| Namespace Prefix: |
fph_ |
| Data Type: |
dtr-types:percentItemType |
| Balance Type: |
na |
| Period Type: |
duration |
|
| X |
- DefinitionDebt Instrument, Modification Costs
| Name: |
fph_DebtInstrumentModificationCosts |
| Namespace Prefix: |
fph_ |
| Data Type: |
xbrli:monetaryItemType |
| Balance Type: |
debit |
| Period Type: |
duration |
|
| X |
- DefinitionLine of credit facility, accordion feature, increase limit, subject to certain conditions by obtaining additional commitments from existing and/or new lenders.
| Name: |
fph_LineofCreditFacilityAccordionFeatureIncreaseLimit |
| Namespace Prefix: |
fph_ |
| Data Type: |
xbrli:monetaryItemType |
| Balance Type: |
credit |
| Period Type: |
instant |
|
| X |
- DefinitionPercentage points added to the reference rate to compute the variable rate on the debt instrument.
| Name: |
us-gaap_DebtInstrumentBasisSpreadOnVariableRate1 |
| Namespace Prefix: |
us-gaap_ |
| Data Type: |
dtr-types:percentItemType |
| Balance Type: |
na |
| Period Type: |
duration |
|
| X |
- DefinitionFace (par) amount of debt instrument at time of issuance. Reference 1: http://www.xbrl.org/2003/role/exampleRef
-Topic 835
-SubTopic 30
-Name Accounting Standards Codification
-Section 55
-Paragraph 8
-Publisher FASB
-URI https://asc.fasb.org/1943274/2147482949/835-30-55-8
Reference 2: http://www.xbrl.org/2003/role/disclosureRef
-Topic 470
-SubTopic 20
-Name Accounting Standards Codification
-Section 50
-Paragraph 1B
-Subparagraph (a)
-Publisher FASB
-URI https://asc.fasb.org/1943274/2147481139/470-20-50-1B
Reference 3: http://www.xbrl.org/2003/role/exampleRef
-Topic 470
-SubTopic 20
-Name Accounting Standards Codification
-Section 55
-Paragraph 69B
-Publisher FASB
-URI https://asc.fasb.org/1943274/2147481568/470-20-55-69B
Reference 4: http://www.xbrl.org/2003/role/exampleRef
-Topic 470
-SubTopic 20
-Name Accounting Standards Codification
-Section 55
-Paragraph 69C
-Publisher FASB
-URI https://asc.fasb.org/1943274/2147481568/470-20-55-69C
Reference 5: http://www.xbrl.org/2003/role/disclosureRef
-Topic 835
-SubTopic 30
-Name Accounting Standards Codification
-Section 50
-Paragraph 1
-Publisher FASB
-URI https://asc.fasb.org/1943274/2147482900/835-30-50-1
Reference 6: http://www.xbrl.org/2003/role/disclosureRef
-Topic 835
-SubTopic 30
-Name Accounting Standards Codification
-Section 45
-Paragraph 2
-Publisher FASB
-URI https://asc.fasb.org/1943274/2147482925/835-30-45-2
| Name: |
us-gaap_DebtInstrumentFaceAmount |
| Namespace Prefix: |
us-gaap_ |
| Data Type: |
xbrli:monetaryItemType |
| Balance Type: |
credit |
| Period Type: |
instant |
|
| X |
- DefinitionContractual interest rate for funds borrowed, under the debt agreement. Reference 1: http://fasb.org/us-gaap/role/ref/legacyRef
-Topic 210
-SubTopic 10
-Name Accounting Standards Codification
-Section S99
-Paragraph 1
-Subparagraph (SX 210.5-02(22)(a)(1))
-Publisher FASB
-URI https://asc.fasb.org/1943274/2147480566/210-10-S99-1
Reference 2: http://www.xbrl.org/2003/role/disclosureRef
-Topic 470
-SubTopic 20
-Name Accounting Standards Codification
-Section 50
-Paragraph 1B
-Subparagraph (b)
-Publisher FASB
-URI https://asc.fasb.org/1943274/2147481139/470-20-50-1B
| Name: |
us-gaap_DebtInstrumentInterestRateStatedPercentage |
| Namespace Prefix: |
us-gaap_ |
| Data Type: |
dtr-types:percentItemType |
| Balance Type: |
na |
| Period Type: |
instant |
|
| X |
- DefinitionLine items represent financial concepts included in a table. These concepts are used to disclose reportable information associated with domain members defined in one or many axes to the table. Reference 1: http://www.xbrl.org/2003/role/exampleRef
-Topic 835
-SubTopic 30
-Name Accounting Standards Codification
-Section 55
-Paragraph 8
-Publisher FASB
-URI https://asc.fasb.org/1943274/2147482949/835-30-55-8
Reference 2: http://www.xbrl.org/2009/role/commonPracticeRef
-Topic 235
-SubTopic 10
-Name Accounting Standards Codification
-Section S99
-Paragraph 1
-Subparagraph (SX 210.4-08(f))
-Publisher FASB
-URI https://asc.fasb.org/1943274/2147480678/235-10-S99-1
Reference 3: http://www.xbrl.org/2003/role/disclosureRef
-Topic 235
-SubTopic 10
-Name Accounting Standards Codification
-Section S99
-Paragraph 3
-Subparagraph (SX 210.12-04(a))
-Publisher FASB
-URI https://asc.fasb.org/1943274/2147480678/235-10-S99-3
Reference 4: http://www.xbrl.org/2003/role/disclosureRef
-Topic 470
-SubTopic 20
-Name Accounting Standards Codification
-Section 50
-Paragraph 1B
-Subparagraph (a)
-Publisher FASB
-URI https://asc.fasb.org/1943274/2147481139/470-20-50-1B
Reference 5: http://www.xbrl.org/2003/role/exampleRef
-Topic 470
-SubTopic 20
-Name Accounting Standards Codification
-Section 55
-Paragraph 69B
-Publisher FASB
-URI https://asc.fasb.org/1943274/2147481568/470-20-55-69B
Reference 6: http://www.xbrl.org/2003/role/exampleRef
-Topic 470
-SubTopic 20
-Name Accounting Standards Codification
-Section 55
-Paragraph 69C
-Publisher FASB
-URI https://asc.fasb.org/1943274/2147481568/470-20-55-69C
Reference 7: http://www.xbrl.org/2003/role/exampleRef
-Topic 470
-SubTopic 20
-Name Accounting Standards Codification
-Section 55
-Paragraph 69E
-Publisher FASB
-URI https://asc.fasb.org/1943274/2147481568/470-20-55-69E
Reference 8: http://www.xbrl.org/2003/role/exampleRef
-Topic 470
-SubTopic 20
-Name Accounting Standards Codification
-Section 55
-Paragraph 69F
-Publisher FASB
-URI https://asc.fasb.org/1943274/2147481568/470-20-55-69F
Reference 9: http://www.xbrl.org/2003/role/disclosureRef
-Topic 470
-SubTopic 20
-Name Accounting Standards Codification
-Section 50
-Paragraph 1B
-Subparagraph (b)
-Publisher FASB
-URI https://asc.fasb.org/1943274/2147481139/470-20-50-1B
Reference 10: http://www.xbrl.org/2003/role/disclosureRef
-Topic 470
-SubTopic 20
-Name Accounting Standards Codification
-Section 50
-Paragraph 1B
-Subparagraph (c)
-Publisher FASB
-URI https://asc.fasb.org/1943274/2147481139/470-20-50-1B
Reference 11: http://www.xbrl.org/2003/role/exampleRef
-Topic 470
-SubTopic 20
-Name Accounting Standards Codification
-Section 50
-Paragraph 1B
-Subparagraph (d)
-Publisher FASB
-URI https://asc.fasb.org/1943274/2147481139/470-20-50-1B
Reference 12: http://www.xbrl.org/2003/role/disclosureRef
-Topic 470
-SubTopic 20
-Name Accounting Standards Codification
-Section 50
-Paragraph 1B
-Subparagraph (e)
-Publisher FASB
-URI https://asc.fasb.org/1943274/2147481139/470-20-50-1B
Reference 13: http://www.xbrl.org/2003/role/disclosureRef
-Topic 470
-SubTopic 20
-Name Accounting Standards Codification
-Section 50
-Paragraph 1B
-Subparagraph (f)
-Publisher FASB
-URI https://asc.fasb.org/1943274/2147481139/470-20-50-1B
Reference 14: http://www.xbrl.org/2003/role/disclosureRef
-Topic 470
-SubTopic 20
-Name Accounting Standards Codification
-Section 50
-Paragraph 1B
-Subparagraph (h)
-Publisher FASB
-URI https://asc.fasb.org/1943274/2147481139/470-20-50-1B
Reference 15: http://www.xbrl.org/2003/role/disclosureRef
-Topic 470
-SubTopic 20
-Name Accounting Standards Codification
-Section 50
-Paragraph 1D
-Subparagraph (a)
-Publisher FASB
-URI https://asc.fasb.org/1943274/2147481139/470-20-50-1D
Reference 16: http://www.xbrl.org/2003/role/disclosureRef
-Topic 470
-SubTopic 20
-Name Accounting Standards Codification
-Section 50
-Paragraph 1D
-Subparagraph (b)
-Publisher FASB
-URI https://asc.fasb.org/1943274/2147481139/470-20-50-1D
Reference 17: http://www.xbrl.org/2003/role/disclosureRef
-Topic 470
-SubTopic 20
-Name Accounting Standards Codification
-Section 50
-Paragraph 1D
-Subparagraph (c)
-Publisher FASB
-URI https://asc.fasb.org/1943274/2147481139/470-20-50-1D
Reference 18: http://www.xbrl.org/2003/role/disclosureRef
-Topic 470
-SubTopic 20
-Name Accounting Standards Codification
-Section 50
-Paragraph 1E
-Subparagraph (a)
-Publisher FASB
-URI https://asc.fasb.org/1943274/2147481139/470-20-50-1E
Reference 19: http://www.xbrl.org/2003/role/disclosureRef
-Topic 470
-SubTopic 20
-Name Accounting Standards Codification
-Section 50
-Paragraph 1E
-Subparagraph (c)
-Publisher FASB
-URI https://asc.fasb.org/1943274/2147481139/470-20-50-1E
Reference 20: http://www.xbrl.org/2003/role/disclosureRef
-Topic 470
-SubTopic 20
-Name Accounting Standards Codification
-Section 50
-Paragraph 1E
-Subparagraph (d)
-Publisher FASB
-URI https://asc.fasb.org/1943274/2147481139/470-20-50-1E
Reference 21: http://www.xbrl.org/2003/role/disclosureRef
-Topic 470
-SubTopic 20
-Name Accounting Standards Codification
-Section 50
-Paragraph 1F
-Subparagraph (a)
-Publisher FASB
-URI https://asc.fasb.org/1943274/2147481139/470-20-50-1F
Reference 22: http://www.xbrl.org/2003/role/disclosureRef
-Topic 470
-SubTopic 20
-Name Accounting Standards Codification
-Section 50
-Paragraph 1F
-Subparagraph (b)
-Publisher FASB
-URI https://asc.fasb.org/1943274/2147481139/470-20-50-1F
Reference 23: http://www.xbrl.org/2003/role/disclosureRef
-Topic 470
-SubTopic 20
-Name Accounting Standards Codification
-Section 50
-Paragraph 1F
-Subparagraph (b)(1)
-Publisher FASB
-URI https://asc.fasb.org/1943274/2147481139/470-20-50-1F
Reference 24: http://www.xbrl.org/2003/role/disclosureRef
-Topic 470
-SubTopic 20
-Name Accounting Standards Codification
-Section 50
-Paragraph 1F
-Subparagraph (b)(2)
-Publisher FASB
-URI https://asc.fasb.org/1943274/2147481139/470-20-50-1F
Reference 25: http://www.xbrl.org/2003/role/disclosureRef
-Topic 470
-SubTopic 20
-Name Accounting Standards Codification
-Section 50
-Paragraph 1I
-Subparagraph (c)
-Publisher FASB
-URI https://asc.fasb.org/1943274/2147481139/470-20-50-1I
Reference 26: http://www.xbrl.org/2009/role/commonPracticeRef
-Topic 835
-SubTopic 30
-Name Accounting Standards Codification
-Section 45
-Paragraph 2
-Publisher FASB
-URI https://asc.fasb.org/1943274/2147482925/835-30-45-2
Reference 27: http://www.xbrl.org/2009/role/commonPracticeRef
-Topic 835
-SubTopic 30
-Name Accounting Standards Codification
-Section 50
-Paragraph 1
-Publisher FASB
-URI https://asc.fasb.org/1943274/2147482900/835-30-50-1
| Name: |
us-gaap_DebtInstrumentLineItems |
| Namespace Prefix: |
us-gaap_ |
| Data Type: |
xbrli:stringItemType |
| Balance Type: |
na |
| Period Type: |
duration |
|
| X |
- DefinitionPercentage of principal amount of debt redeemed.
| Name: |
us-gaap_DebtInstrumentRedemptionPricePercentageOfPrincipalAmountRedeemed |
| Namespace Prefix: |
us-gaap_ |
| Data Type: |
dtr-types:percentItemType |
| Balance Type: |
na |
| Period Type: |
duration |
|
| X |
- DefinitionFair value amount of debt instrument that was repurchased.
| Name: |
us-gaap_DebtInstrumentRepurchaseAmount |
| Namespace Prefix: |
us-gaap_ |
| Data Type: |
xbrli:monetaryItemType |
| Balance Type: |
debit |
| Period Type: |
instant |
|
| X |
- DefinitionIndicates type of variable interest rate on debt instrument. Reference 1: http://www.xbrl.org/2003/role/disclosureRef
-Topic 942
-SubTopic 470
-Name Accounting Standards Codification
-Section 50
-Paragraph 3
-Subparagraph (b)
-Publisher FASB
-URI https://asc.fasb.org/1943274/2147477734/942-470-50-3
| Name: |
us-gaap_DebtInstrumentVariableInterestRateTypeExtensibleEnumeration |
| Namespace Prefix: |
us-gaap_ |
| Data Type: |
enum2:enumerationSetItemType |
| Balance Type: |
na |
| Period Type: |
duration |
|
| X |
- DefinitionThe total amount of the contingent obligation under letters of credit outstanding as of the reporting date.
| Name: |
us-gaap_LettersOfCreditOutstandingAmount |
| Namespace Prefix: |
us-gaap_ |
| Data Type: |
xbrli:monetaryItemType |
| Balance Type: |
credit |
| Period Type: |
instant |
|
| X |
- DefinitionThe carrying value as of the balance sheet date of the current and noncurrent portions of long-term obligations drawn from a line of credit, which is a bank's commitment to make loans up to a specific amount. Examples of items that might be included in the application of this element may consist of letters of credit, standby letters of credit, and revolving credit arrangements, under which borrowings can be made up to a maximum amount as of any point in time conditional on satisfaction of specified terms before, as of and after the date of drawdowns on the line. Includes short-term obligations that would normally be classified as current liabilities but for which (a) postbalance sheet date issuance of a long term obligation to refinance the short term obligation on a long term basis, or (b) the enterprise has entered into a financing agreement that clearly permits the enterprise to refinance the short-term obligation on a long term basis and the following conditions are met (1) the agreement does not expire within 1 year and is not cancelable by the lender except for violation of an objectively determinable provision, (2) no violation exists at the BS date, and (3) the lender has entered into the financing agreement is expected to be financially capable of honoring the agreement. Reference 1: http://fasb.org/us-gaap/role/ref/legacyRef
-Name Accounting Standards Codification
-Section S99
-Paragraph 1
-Subparagraph (SX 210.5-02(22))
-SubTopic 10
-Topic 210
-Publisher FASB
-URI https://asc.fasb.org/1943274/2147480566/210-10-S99-1
Reference 2: http://fasb.org/us-gaap/role/ref/legacyRef
-Topic 942
-SubTopic 210
-Name Accounting Standards Codification
-Section S99
-Paragraph 1
-Subparagraph (SX 210.9-03(16))
-Publisher FASB
-URI https://asc.fasb.org/1943274/2147478546/942-210-S99-1
Reference 3: http://www.xbrl.org/2009/role/commonPracticeRef
-Topic 944
-SubTopic 210
-Name Accounting Standards Codification
-Section S99
-Paragraph 1
-Subparagraph (SX 210.7-03(a)(16)(a)(2))
-Publisher FASB
-URI https://asc.fasb.org/1943274/2147478777/944-210-S99-1
| Name: |
us-gaap_LineOfCredit |
| Namespace Prefix: |
us-gaap_ |
| Data Type: |
xbrli:monetaryItemType |
| Balance Type: |
credit |
| Period Type: |
instant |
|
| X |
- DefinitionMaximum borrowing capacity under the credit facility without consideration of any current restrictions on the amount that could be borrowed or the amounts currently outstanding under the facility. Reference 1: http://fasb.org/us-gaap/role/ref/legacyRef
-Topic 210
-SubTopic 10
-Name Accounting Standards Codification
-Section S99
-Paragraph 1
-Subparagraph (SX 210.5-02(22)(b))
-Publisher FASB
-URI https://asc.fasb.org/1943274/2147480566/210-10-S99-1
Reference 2: http://fasb.org/us-gaap/role/ref/legacyRef
-Topic 210
-SubTopic 10
-Name Accounting Standards Codification
-Section S99
-Paragraph 1
-Subparagraph (SX 210.5-02(19)(b))
-Publisher FASB
-URI https://asc.fasb.org/1943274/2147480566/210-10-S99-1
| Name: |
us-gaap_LineOfCreditFacilityMaximumBorrowingCapacity |
| Namespace Prefix: |
us-gaap_ |
| Data Type: |
xbrli:monetaryItemType |
| Balance Type: |
credit |
| Period Type: |
instant |
|
| X |
- DefinitionThe net cash inflow or outflow in aggregate debt due to repayments and proceeds from additional borrowings.
| Name: |
us-gaap_ProceedsFromRepaymentsOfDebt |
| Namespace Prefix: |
us-gaap_ |
| Data Type: |
xbrli:monetaryItemType |
| Balance Type: |
debit |
| Period Type: |
duration |
|
| X |
- Details
| Name: |
us-gaap_LongtermDebtTypeAxis=us-gaap_SeniorNotesMember |
| Namespace Prefix: |
|
| Data Type: |
na |
| Balance Type: |
|
| Period Type: |
|
|
| X |
- Details
| Name: |
us-gaap_LongtermDebtTypeAxis=us-gaap_UnsecuredDebtMember |
| Namespace Prefix: |
|
| Data Type: |
na |
| Balance Type: |
|
| Period Type: |
|
|
| X |
- Details
| Name: |
us-gaap_CreditFacilityAxis=us-gaap_RevolvingCreditFacilityMember |
| Namespace Prefix: |
|
| Data Type: |
na |
| Balance Type: |
|
| Period Type: |
|
|
| X |
- Details
| Name: |
fph_VariableRateComponentAxis=fph_VariableRateComponentOneMember |
| Namespace Prefix: |
|
| Data Type: |
na |
| Balance Type: |
|
| Period Type: |
|
|
| X |
- Details
| Name: |
fph_VariableRateComponentAxis=fph_VariableRateComponentTwoMember |
| Namespace Prefix: |
|
| Data Type: |
na |
| Balance Type: |
|
| Period Type: |
|
|
| X |
- Details
| Name: |
srt_RangeAxis=srt_MinimumMember |
| Namespace Prefix: |
|
| Data Type: |
na |
| Balance Type: |
|
| Period Type: |
|
|
| X |
- Details
| Name: |
srt_RangeAxis=srt_MaximumMember |
| Namespace Prefix: |
|
| Data Type: |
na |
| Balance Type: |
|
| Period Type: |
|
|
| X |
- Details
| Name: |
us-gaap_DebtInstrumentAxis=fph_SeniorNotesDue20257.875Member |
| Namespace Prefix: |
|
| Data Type: |
na |
| Balance Type: |
|
| Period Type: |
|
|
| X |
- Details
| Name: |
us-gaap_DebtInstrumentAxis=fph_SeniorNotesDue202810.500Member |
| Namespace Prefix: |
|
| Data Type: |
na |
| Balance Type: |
|
| Period Type: |
|
|
| X |
- Details
| Name: |
fph_InterestRatePeriodAxis=fph_January162024ToNovember142025Member |
| Namespace Prefix: |
|
| Data Type: |
na |
| Balance Type: |
|
| Period Type: |
|
|
| X |
- Details
| Name: |
fph_InterestRatePeriodAxis=fph_November152025ToNovember142026Member |
| Namespace Prefix: |
|
| Data Type: |
na |
| Balance Type: |
|
| Period Type: |
|
|
| X |
- Details
| Name: |
fph_InterestRatePeriodAxis=fph_November152026ToJanuary142028Member |
| Namespace Prefix: |
|
| Data Type: |
na |
| Balance Type: |
|
| Period Type: |
|
|
| X |
- Details
| Name: |
us-gaap_DebtInstrumentAxis=fph_RevolvingCreditFacilityDueInJuly2027Member |
| Namespace Prefix: |
|
| Data Type: |
na |
| Balance Type: |
|
| Period Type: |
|
|
| X |
- Details
| Name: |
us-gaap_DebtInstrumentAxis=fph_RevolvingCreditFacilityDueInApril2026Member |
| Namespace Prefix: |
|
| Data Type: |
na |
| Balance Type: |
|
| Period Type: |
|
|
v3.24.2
| X |
- DefinitionAggregate Payments for Contractual Obligation
| Name: |
fph_AggregatePaymentsforContractualObligation |
| Namespace Prefix: |
fph_ |
| Data Type: |
xbrli:monetaryItemType |
| Balance Type: |
credit |
| Period Type: |
duration |
|
| X |
- DefinitionTax Receivable Agreement, Liability, Noncurrent
| Name: |
fph_TaxReceivableAgreementLiabilityNoncurrent |
| Namespace Prefix: |
fph_ |
| Data Type: |
xbrli:monetaryItemType |
| Balance Type: |
credit |
| Period Type: |
instant |
|
| X |
- References
+ Details
| Name: |
us-gaap_OtherLiabilitiesDisclosureAbstract |
| Namespace Prefix: |
us-gaap_ |
| Data Type: |
xbrli:stringItemType |
| Balance Type: |
na |
| Period Type: |
duration |
|
v3.24.2
Commitments and Contingencies - Supplemental Balance Sheet Information (Details) - USD ($)
$ in Thousands |
Jun. 30, 2024 |
Dec. 31, 2023 |
| Lessee, Lease, Description [Line Items] |
|
|
| Operating lease right-of-use assets |
$ 14,618
|
$ 16,002
|
| Operating lease liabilities |
11,982
|
12,755
|
| Other |
$ 74,173
|
$ 78,074
|
| Operating Lease, Right-of-Use Asset, Statement of Financial Position [Extensible List] |
OTHER ASSETS
|
OTHER ASSETS
|
| Operating Lease, Liability, Statement of Financial Position [Extensible List] |
Accounts Payable and Accrued Liabilities, Other
|
Accounts Payable and Accrued Liabilities, Other
|
| Related Party |
|
|
| Lessee, Lease, Description [Line Items] |
|
|
| OTHER ASSETS |
$ 120,551
|
$ 83,970
|
| Other |
74,173
|
78,074
|
| Operating Lease | Related Party |
|
|
| Lessee, Lease, Description [Line Items] |
|
|
| OTHER ASSETS |
12,808
|
14,040
|
| Other |
$ 10,129
|
$ 10,974
|
| X |
- DefinitionLine items represent financial concepts included in a table. These concepts are used to disclose reportable information associated with domain members defined in one or many axes to the table. Reference 1: http://www.xbrl.org/2003/role/disclosureRef
-Topic 842
-SubTopic 20
-Name Accounting Standards Codification
-Section 50
-Paragraph 7A
-Subparagraph (c)
-Publisher FASB
-URI https://asc.fasb.org/1943274/2147478964/842-20-50-7A
Reference 2: http://www.xbrl.org/2003/role/disclosureRef
-Topic 842
-SubTopic 20
-Name Accounting Standards Codification
-Section 50
-Paragraph 3
-Publisher FASB
-URI https://asc.fasb.org/1943274/2147478964/842-20-50-3
| Name: |
us-gaap_LesseeLeaseDescriptionLineItems |
| Namespace Prefix: |
us-gaap_ |
| Data Type: |
xbrli:stringItemType |
| Balance Type: |
na |
| Period Type: |
duration |
|
| X |
- DefinitionPresent value of lessee's discounted obligation for lease payments from operating lease. Reference 1: http://www.xbrl.org/2003/role/disclosureRef
-Topic 842
-SubTopic 20
-Name Accounting Standards Codification
-Section 45
-Paragraph 1
-Subparagraph (b)
-Publisher FASB
-URI https://asc.fasb.org/1943274/2147479041/842-20-45-1
| Name: |
us-gaap_OperatingLeaseLiability |
| Namespace Prefix: |
us-gaap_ |
| Data Type: |
xbrli:monetaryItemType |
| Balance Type: |
credit |
| Period Type: |
instant |
|
| X |
- DefinitionIndicates line item in statement of financial position that includes operating lease liability. Reference 1: http://www.xbrl.org/2003/role/disclosureRef
-Topic 842
-SubTopic 20
-Name Accounting Standards Codification
-Section 45
-Paragraph 2
-Publisher FASB
-URI https://asc.fasb.org/1943274/2147479041/842-20-45-2
| Name: |
us-gaap_OperatingLeaseLiabilityStatementOfFinancialPositionExtensibleList |
| Namespace Prefix: |
us-gaap_ |
| Data Type: |
enum2:enumerationSetItemType |
| Balance Type: |
na |
| Period Type: |
instant |
|
| X |
- DefinitionAmount of lessee's right to use underlying asset under operating lease. Reference 1: http://www.xbrl.org/2003/role/disclosureRef
-Topic 842
-SubTopic 20
-Name Accounting Standards Codification
-Section 45
-Paragraph 1
-Subparagraph (a)
-Publisher FASB
-URI https://asc.fasb.org/1943274/2147479041/842-20-45-1
| Name: |
us-gaap_OperatingLeaseRightOfUseAsset |
| Namespace Prefix: |
us-gaap_ |
| Data Type: |
xbrli:monetaryItemType |
| Balance Type: |
debit |
| Period Type: |
instant |
|
| X |
- DefinitionIndicates line item in statement of financial position that includes operating lease right-of-use asset. Reference 1: http://www.xbrl.org/2003/role/disclosureRef
-Topic 842
-SubTopic 20
-Name Accounting Standards Codification
-Section 45
-Paragraph 2
-Publisher FASB
-URI https://asc.fasb.org/1943274/2147479041/842-20-45-2
| Name: |
us-gaap_OperatingLeaseRightOfUseAssetStatementOfFinancialPositionExtensibleList |
| Namespace Prefix: |
us-gaap_ |
| Data Type: |
enum2:enumerationSetItemType |
| Balance Type: |
na |
| Period Type: |
instant |
|
| X |
- DefinitionAmount of assets classified as other. Reference 1: http://www.xbrl.org/2003/role/exampleRef
-Topic 280
-SubTopic 10
-Name Accounting Standards Codification
-Section 55
-Paragraph 49
-Publisher FASB
-URI https://asc.fasb.org/1943274/2147482785/280-10-55-49
Reference 2: http://fasb.org/us-gaap/role/ref/legacyRef
-Topic 942
-SubTopic 210
-Name Accounting Standards Codification
-Section S99
-Paragraph 1
-Subparagraph (SX 210.9-03(10))
-Publisher FASB
-URI https://asc.fasb.org/1943274/2147478546/942-210-S99-1
Reference 3: http://www.xbrl.org/2003/role/exampleRef
-Topic 946
-SubTopic 830
-Name Accounting Standards Codification
-Section 55
-Paragraph 12
-Publisher FASB
-URI https://asc.fasb.org/1943274/2147479168/946-830-55-12
Reference 4: http://www.xbrl.org/2003/role/disclosureRef
-Topic 944
-SubTopic 210
-Name Accounting Standards Codification
-Section S99
-Paragraph 1
-Subparagraph (SX 210.7-03(a)(10))
-Publisher FASB
-URI https://asc.fasb.org/1943274/2147478777/944-210-S99-1
Reference 5: http://www.xbrl.org/2003/role/disclosureRef
-Topic 210
-SubTopic 10
-Name Accounting Standards Codification
-Section S99
-Paragraph 1
-Subparagraph (SX 210.5-02(17))
-Publisher FASB
-URI https://asc.fasb.org/1943274/2147480566/210-10-S99-1
| Name: |
us-gaap_OtherAssets |
| Namespace Prefix: |
us-gaap_ |
| Data Type: |
xbrli:monetaryItemType |
| Balance Type: |
debit |
| Period Type: |
instant |
|
| X |
- DefinitionAmount of liabilities classified as other. Reference 1: http://fasb.org/us-gaap/role/ref/legacyRef
-Topic 942
-SubTopic 210
-Name Accounting Standards Codification
-Section S99
-Paragraph 1
-Subparagraph (SX 210.9-03(15))
-Publisher FASB
-URI https://asc.fasb.org/1943274/2147478546/942-210-S99-1
Reference 2: http://www.xbrl.org/2003/role/disclosureRef
-Topic 944
-SubTopic 210
-Name Accounting Standards Codification
-Section S99
-Paragraph 1
-Subparagraph (SX 210.7-03(a)(15))
-Publisher FASB
-URI https://asc.fasb.org/1943274/2147478777/944-210-S99-1
Reference 3: http://www.xbrl.org/2003/role/exampleRef
-Topic 946
-SubTopic 830
-Name Accounting Standards Codification
-Section 55
-Paragraph 12
-Publisher FASB
-URI https://asc.fasb.org/1943274/2147479168/946-830-55-12
Reference 4: http://www.xbrl.org/2003/role/disclosureRef
-Topic 946
-SubTopic 210
-Name Accounting Standards Codification
-Section S99
-Paragraph 1
-Subparagraph (SX 210.6-04(12)(b)(2))
-Publisher FASB
-URI https://asc.fasb.org/1943274/2147479170/946-210-S99-1
Reference 5: http://www.xbrl.org/2003/role/disclosureRef
-Topic 946
-SubTopic 210
-Name Accounting Standards Codification
-Section S99
-Paragraph 1
-Subparagraph (SX 210.6-04(12)(b)(3))
-Publisher FASB
-URI https://asc.fasb.org/1943274/2147479170/946-210-S99-1
Reference 6: http://www.xbrl.org/2009/role/commonPracticeRef
-Topic 946
-SubTopic 210
-Name Accounting Standards Codification
-Section S99
-Paragraph 1
-Subparagraph (SX 210.6-04(12)(b)(1))
-Publisher FASB
-URI https://asc.fasb.org/1943274/2147479170/946-210-S99-1
Reference 7: http://www.xbrl.org/2009/role/commonPracticeRef
-Topic 944
-SubTopic 210
-Name Accounting Standards Codification
-Section S99
-Paragraph 1
-Subparagraph (SX 210.7-03(a)(17))
-Publisher FASB
-URI https://asc.fasb.org/1943274/2147478777/944-210-S99-1
| Name: |
us-gaap_OtherLiabilities |
| Namespace Prefix: |
us-gaap_ |
| Data Type: |
xbrli:monetaryItemType |
| Balance Type: |
credit |
| Period Type: |
instant |
|
v3.24.2
Commitments and Contingencies - Additional Information (Details) - USD ($)
$ in Thousands |
Jun. 30, 2024 |
Dec. 31, 2023 |
| Lessee, Lease, Description [Line Items] |
|
|
| Remaining estimated maximum potential amount of monetary payments subject to guaranty |
$ 8,300
|
|
| Outstanding letters of credit |
1,000
|
$ 1,000
|
| Asset Pledged as Collateral |
|
|
| Lessee, Lease, Description [Line Items] |
|
|
| Restricted cash and cash equivalents |
1,000
|
1,000
|
| The San Francisco Venture |
|
|
| Lessee, Lease, Description [Line Items] |
|
|
| Guaranty of infrastructure obligations, maximum obligation |
198,300
|
198,300
|
| Surety Bond |
|
|
| Lessee, Lease, Description [Line Items] |
|
|
| Outstanding letters of credit |
$ 299,000
|
$ 306,900
|
| X |
- DefinitionMonetary Payments Subject to Guaranty, Remaining Estimated Amount, Maximum
| Name: |
fph_MonetaryPaymentsSubjecttoGuarantyRemainingEstimatedAmountMaximum |
| Namespace Prefix: |
fph_ |
| Data Type: |
xbrli:monetaryItemType |
| Balance Type: |
credit |
| Period Type: |
instant |
|
| X |
- DefinitionMaximum potential amount of future payments (undiscounted) the guarantor could be required to make under the guarantee or each group of similar guarantees before reduction for potential recoveries under recourse or collateralization provisions. Reference 1: http://www.xbrl.org/2003/role/disclosureRef
-Topic 460
-SubTopic 10
-Name Accounting Standards Codification
-Section 50
-Paragraph 4
-Subparagraph (b)(1)
-Publisher FASB
-URI https://asc.fasb.org/1943274/2147482425/460-10-50-4
| Name: |
us-gaap_GuaranteeObligationsMaximumExposure |
| Namespace Prefix: |
us-gaap_ |
| Data Type: |
xbrli:monetaryItemType |
| Balance Type: |
credit |
| Period Type: |
instant |
|
| X |
- DefinitionLine items represent financial concepts included in a table. These concepts are used to disclose reportable information associated with domain members defined in one or many axes to the table. Reference 1: http://www.xbrl.org/2003/role/disclosureRef
-Topic 842
-SubTopic 20
-Name Accounting Standards Codification
-Section 50
-Paragraph 7A
-Subparagraph (c)
-Publisher FASB
-URI https://asc.fasb.org/1943274/2147478964/842-20-50-7A
Reference 2: http://www.xbrl.org/2003/role/disclosureRef
-Topic 842
-SubTopic 20
-Name Accounting Standards Codification
-Section 50
-Paragraph 3
-Publisher FASB
-URI https://asc.fasb.org/1943274/2147478964/842-20-50-3
| Name: |
us-gaap_LesseeLeaseDescriptionLineItems |
| Namespace Prefix: |
us-gaap_ |
| Data Type: |
xbrli:stringItemType |
| Balance Type: |
na |
| Period Type: |
duration |
|
| X |
- DefinitionThe total amount of the contingent obligation under letters of credit outstanding as of the reporting date.
| Name: |
us-gaap_LettersOfCreditOutstandingAmount |
| Namespace Prefix: |
us-gaap_ |
| Data Type: |
xbrli:monetaryItemType |
| Balance Type: |
credit |
| Period Type: |
instant |
|
| X |
- DefinitionAmount of cash and cash equivalents restricted as to withdrawal or usage. Cash includes, but is not limited to, currency on hand, demand deposits with banks or financial institutions, and other accounts with general characteristics of demand deposits. Cash equivalents include, but are not limited to, short-term, highly liquid investments that are both readily convertible to known amounts of cash and so near their maturity that they present insignificant risk of changes in value because of changes in interest rates. Reference 1: http://www.xbrl.org/2003/role/disclosureRef
-Topic 210
-SubTopic 10
-Name Accounting Standards Codification
-Section S99
-Paragraph 1
-Subparagraph (SX 210.5-02(1))
-Publisher FASB
-URI https://asc.fasb.org/1943274/2147480566/210-10-S99-1
Reference 2: http://www.xbrl.org/2003/role/disclosureRef
-Topic 944
-SubTopic 210
-Name Accounting Standards Codification
-Section S99
-Paragraph 1
-Subparagraph (SX 210.7-03(a)(2))
-Publisher FASB
-URI https://asc.fasb.org/1943274/2147478777/944-210-S99-1
Reference 3: http://www.xbrl.org/2003/role/disclosureRef
-Topic 230
-SubTopic 10
-Name Accounting Standards Codification
-Section 50
-Paragraph 8
-Publisher FASB
-URI https://asc.fasb.org/1943274/2147482913/230-10-50-8
Reference 4: http://fasb.org/us-gaap/role/ref/legacyRef
-Topic 942
-SubTopic 210
-Name Accounting Standards Codification
-Section S99
-Paragraph 1
-Subparagraph (SX 210.9-03(1)(a))
-Publisher FASB
-URI https://asc.fasb.org/1943274/2147478546/942-210-S99-1
Reference 5: http://fasb.org/us-gaap/role/ref/legacyRef
-Name Accounting Standards Codification
-Topic 230
-SubTopic 10
-Section 45
-Paragraph 4
-Publisher FASB
-URI https://asc.fasb.org/1943274/2147482740/230-10-45-4
| Name: |
us-gaap_RestrictedCashAndCashEquivalents |
| Namespace Prefix: |
us-gaap_ |
| Data Type: |
xbrli:monetaryItemType |
| Balance Type: |
debit |
| Period Type: |
instant |
|
| X |
- Details
| Name: |
us-gaap_PledgedStatusAxis=us-gaap_AssetPledgedAsCollateralMember |
| Namespace Prefix: |
|
| Data Type: |
na |
| Balance Type: |
|
| Period Type: |
|
|
| X |
- Details
| Name: |
srt_CounterpartyNameAxis=fph_TheSanFranciscoVentureMember |
| Namespace Prefix: |
|
| Data Type: |
na |
| Balance Type: |
|
| Period Type: |
|
|
| X |
- Details
| Name: |
us-gaap_CreditFacilityAxis=us-gaap_SuretyBondMember |
| Namespace Prefix: |
|
| Data Type: |
na |
| Balance Type: |
|
| Period Type: |
|
|
v3.24.2
| X |
- DefinitionInterest Paid, Capitalized, Operating Activities
| Name: |
fph_InterestPaidCapitalizedOperatingActivities |
| Namespace Prefix: |
fph_ |
| Data Type: |
xbrli:monetaryItemType |
| Balance Type: |
debit |
| Period Type: |
duration |
|
| X |
- DefinitionNoncash Transaction, Senior Notes Exchanged For New Debt
| Name: |
fph_NoncashTransactionSeniorNotesExchangedForNewDebt |
| Namespace Prefix: |
fph_ |
| Data Type: |
xbrli:monetaryItemType |
| Balance Type: |
credit |
| Period Type: |
duration |
|
| X |
- DefinitionOperating Lease, Expense, Noncash
| Name: |
fph_OperatingLeaseExpenseNoncash |
| Namespace Prefix: |
fph_ |
| Data Type: |
xbrli:monetaryItemType |
| Balance Type: |
debit |
| Period Type: |
duration |
|
| X |
- DefinitionOperating Lease, Right-of-Use Asset, Adjustment From Lease Modification
| Name: |
fph_OperatingLeaseRightOfUseAssetAdjustmentFromLeaseModification |
| Namespace Prefix: |
fph_ |
| Data Type: |
xbrli:monetaryItemType |
| Balance Type: |
credit |
| Period Type: |
duration |
|
| X |
- DefinitionRecognition of Tax Receivable Agreement Liability
| Name: |
fph_RecognitionofTaxReceivableAgreementLiability |
| Namespace Prefix: |
fph_ |
| Data Type: |
xbrli:monetaryItemType |
| Balance Type: |
credit |
| Period Type: |
duration |
|
| X |
- References
+ Details
| Name: |
us-gaap_NoncashInvestingAndFinancingItemsAbstract |
| Namespace Prefix: |
us-gaap_ |
| Data Type: |
xbrli:stringItemType |
| Balance Type: |
na |
| Period Type: |
duration |
|
v3.24.2
Supplemental Cash Flow Information - Condensed Cash Flow Information (Details) - USD ($)
$ in Thousands |
Jun. 30, 2024 |
Dec. 31, 2023 |
Jun. 30, 2023 |
Dec. 31, 2022 |
| Supplemental Cash Flow Elements [Abstract] |
|
|
|
|
| Cash and cash equivalents |
$ 217,387
|
$ 353,801
|
$ 193,203
|
|
| Restricted cash and certificates of deposit |
992
|
992
|
992
|
|
| Total cash, cash equivalents, and restricted cash shown in the condensed consolidated statements of cash flows |
$ 218,379
|
$ 354,793
|
$ 194,195
|
$ 132,763
|
| X |
- DefinitionAmount of currency on hand as well as demand deposits with banks or financial institutions. Includes other kinds of accounts that have the general characteristics of demand deposits. Also includes short-term, highly liquid investments that are both readily convertible to known amounts of cash and so near their maturity that they present insignificant risk of changes in value because of changes in interest rates. Excludes cash and cash equivalents within disposal group and discontinued operation. Reference 1: http://www.xbrl.org/2003/role/disclosureRef
-Topic 210
-SubTopic 10
-Name Accounting Standards Codification
-Section S99
-Paragraph 1
-Subparagraph (SX 210.5-02(1))
-Publisher FASB
-URI https://asc.fasb.org/1943274/2147480566/210-10-S99-1
Reference 2: http://www.xbrl.org/2003/role/exampleRef
-Topic 210
-SubTopic 10
-Name Accounting Standards Codification
-Section 45
-Paragraph 1
-Subparagraph (a)
-Publisher FASB
-URI https://asc.fasb.org/1943274/2147483467/210-10-45-1
Reference 3: http://fasb.org/us-gaap/role/ref/legacyRef
-Name Accounting Standards Codification
-Topic 230
-SubTopic 10
-Section 45
-Paragraph 4
-Publisher FASB
-URI https://asc.fasb.org/1943274/2147482740/230-10-45-4
| Name: |
us-gaap_CashAndCashEquivalentsAtCarryingValue |
| Namespace Prefix: |
us-gaap_ |
| Data Type: |
xbrli:monetaryItemType |
| Balance Type: |
debit |
| Period Type: |
instant |
|
| X |
- DefinitionAmount of cash and cash equivalents, and cash and cash equivalents restricted to withdrawal or usage. Excludes amount for disposal group and discontinued operations. Cash includes, but is not limited to, currency on hand, demand deposits with banks or financial institutions, and other accounts with general characteristics of demand deposits. Cash equivalents include, but are not limited to, short-term, highly liquid investments that are both readily convertible to known amounts of cash and so near their maturity that they present insignificant risk of changes in value because of changes in interest rates. Reference 1: http://www.xbrl.org/2003/role/disclosureRef
-Topic 230
-SubTopic 10
-Name Accounting Standards Codification
-Section 50
-Paragraph 8
-Publisher FASB
-URI https://asc.fasb.org/1943274/2147482913/230-10-50-8
Reference 2: http://fasb.org/us-gaap/role/ref/legacyRef
-Topic 230
-SubTopic 10
-Name Accounting Standards Codification
-Section 45
-Paragraph 24
-Publisher FASB
-URI https://asc.fasb.org/1943274/2147482740/230-10-45-24
Reference 3: http://fasb.org/us-gaap/role/ref/legacyRef
-Name Accounting Standards Codification
-Topic 230
-SubTopic 10
-Section 45
-Paragraph 4
-Publisher FASB
-URI https://asc.fasb.org/1943274/2147482740/230-10-45-4
| Name: |
us-gaap_CashCashEquivalentsRestrictedCashAndRestrictedCashEquivalents |
| Namespace Prefix: |
us-gaap_ |
| Data Type: |
xbrli:monetaryItemType |
| Balance Type: |
debit |
| Period Type: |
instant |
|
| X |
- DefinitionCash and investments whose use in whole or in part is restricted for the long-term, generally by contractual agreements or regulatory requirements. For use in an unclassified balance sheet. Reference 1: http://www.xbrl.org/2003/role/disclosureRef
-Topic 954
-SubTopic 210
-Name Accounting Standards Codification
-Section 45
-Paragraph 4
-Publisher FASB
-URI https://asc.fasb.org/1943274/2147477220/954-210-45-4
Reference 2: http://www.xbrl.org/2003/role/disclosureRef
-Topic 954
-SubTopic 210
-Name Accounting Standards Codification
-Section 50
-Paragraph 2
-Publisher FASB
-URI https://asc.fasb.org/1943274/2147478600/954-210-50-2
| Name: |
us-gaap_RestrictedCashAndInvestments |
| Namespace Prefix: |
us-gaap_ |
| Data Type: |
xbrli:monetaryItemType |
| Balance Type: |
debit |
| Period Type: |
instant |
|
| X |
- References
+ Details
| Name: |
us-gaap_SupplementalCashFlowElementsAbstract |
| Namespace Prefix: |
us-gaap_ |
| Data Type: |
xbrli:stringItemType |
| Balance Type: |
na |
| Period Type: |
duration |
|
v3.24.2
| X |
- DefinitionThe percentage of ownership of common stock or equity participation in the investee accounted for under the equity method of accounting. Reference 1: http://www.xbrl.org/2003/role/disclosureRef
-Topic 323
-SubTopic 10
-Name Accounting Standards Codification
-Section 50
-Paragraph 3
-Subparagraph (a)(1)
-Publisher FASB
-URI https://asc.fasb.org/1943274/2147481687/323-10-50-3
| Name: |
us-gaap_EquityMethodInvestmentOwnershipPercentage |
| Namespace Prefix: |
us-gaap_ |
| Data Type: |
dtr-types:percentItemType |
| Balance Type: |
na |
| Period Type: |
instant |
|
| X |
- Details
| Name: |
dei_LegalEntityAxis=fph_GatewayCommercialVentureLLCAMember |
| Namespace Prefix: |
|
| Data Type: |
na |
| Balance Type: |
|
| Period Type: |
|
|
| X |
- Details
| Name: |
srt_ScheduleOfEquityMethodInvestmentEquityMethodInvesteeNameAxis=fph_GreatParkVentureMember |
| Namespace Prefix: |
|
| Data Type: |
na |
| Balance Type: |
|
| Period Type: |
|
|
| X |
- Details
| Name: |
srt_ScheduleOfEquityMethodInvestmentEquityMethodInvesteeNameAxis=fph_GatewayCommercialVentureLLCAMember |
| Namespace Prefix: |
|
| Data Type: |
na |
| Balance Type: |
|
| Period Type: |
|
|
v3.24.2
Segment Reporting - Revenues and Profit (loss) (Details) - USD ($)
$ in Thousands |
3 Months Ended |
6 Months Ended |
Jun. 30, 2024 |
Jun. 30, 2023 |
Jun. 30, 2024 |
Jun. 30, 2023 |
| Segment Reporting Information [Line Items] |
|
|
|
|
| Revenues |
$ 51,192
|
$ 21,349
|
$ 61,127
|
$ 27,050
|
| Profit (Loss) |
38,227
|
50,555
|
44,310
|
40,821
|
| Equity in earnings (losses) from unconsolidated entities |
15,498
|
52,128
|
33,084
|
53,176
|
| Operating Segments |
|
|
|
|
| Segment Reporting Information [Line Items] |
|
|
|
|
| Revenues |
192,788
|
383,966
|
297,981
|
400,421
|
| Profit (Loss) |
79,115
|
173,220
|
132,903
|
174,081
|
| Corporate and unallocated |
|
|
|
|
| Segment Reporting Information [Line Items] |
|
|
|
|
| Profit (Loss) |
(11,501)
|
(6,981)
|
(23,763)
|
(16,066)
|
| Valencia |
|
|
|
|
| Segment Reporting Information [Line Items] |
|
|
|
|
| Revenues |
745
|
413
|
1,786
|
1,716
|
| Valencia | Operating Segments |
|
|
|
|
| Segment Reporting Information [Line Items] |
|
|
|
|
| Revenues |
745
|
413
|
1,786
|
1,716
|
| Profit (Loss) |
(3,382)
|
(4,538)
|
(6,485)
|
(6,977)
|
| San Francisco |
|
|
|
|
| Segment Reporting Information [Line Items] |
|
|
|
|
| Revenues |
168
|
162
|
336
|
324
|
| San Francisco | Operating Segments |
|
|
|
|
| Segment Reporting Information [Line Items] |
|
|
|
|
| Revenues |
168
|
162
|
336
|
324
|
| Profit (Loss) |
(1,109)
|
(885)
|
(2,061)
|
(1,915)
|
| Great Park |
|
|
|
|
| Segment Reporting Information [Line Items] |
|
|
|
|
| Revenues |
50,151
|
20,670
|
58,764
|
24,799
|
| Equity in earnings (losses) from unconsolidated entities |
15,473
|
52,322
|
33,130
|
53,484
|
| Great Park | Operating Segments |
|
|
|
|
| Segment Reporting Information [Line Items] |
|
|
|
|
| Revenues |
189,523
|
381,266
|
290,845
|
393,995
|
| Profit (Loss) |
83,768
|
179,145
|
141,614
|
183,651
|
| Great Park | Segment Reconciling Items |
|
|
|
|
| Segment Reporting Information [Line Items] |
|
|
|
|
| Revenues |
(139,372)
|
(360,596)
|
(232,081)
|
(369,196)
|
| Profit (Loss) |
(44,932)
|
(168,157)
|
(98,061)
|
(170,900)
|
| Commercial |
|
|
|
|
| Segment Reporting Information [Line Items] |
|
|
|
|
| Equity in earnings (losses) from unconsolidated entities |
(218)
|
(455)
|
(305)
|
(667)
|
| Commercial | Operating Segments |
|
|
|
|
| Segment Reporting Information [Line Items] |
|
|
|
|
| Revenues |
2,352
|
2,125
|
5,014
|
4,386
|
| Profit (Loss) |
(162)
|
(502)
|
(165)
|
(678)
|
| Commercial | Segment Reconciling Items |
|
|
|
|
| Segment Reporting Information [Line Items] |
|
|
|
|
| Revenues |
(2,224)
|
(2,021)
|
(4,773)
|
(4,175)
|
| Profit (Loss) |
$ 290
|
$ 606
|
$ 406
|
$ 889
|
| X |
- DefinitionAmount of income (loss) for proportionate share of equity method investee's income (loss). Reference 1: http://fasb.org/us-gaap/role/ref/legacyRef
-Name Accounting Standards Codification
-Section 45
-Paragraph 28
-Subparagraph (b)
-SubTopic 10
-Topic 230
-Publisher FASB
-URI https://asc.fasb.org/1943274/2147482740/230-10-45-28
Reference 2: http://www.xbrl.org/2003/role/disclosureRef
-Topic 270
-SubTopic 10
-Name Accounting Standards Codification
-Section 50
-Paragraph 1
-Subparagraph (i)
-Publisher FASB
-URI https://asc.fasb.org/1943274/2147482964/270-10-50-1
Reference 3: http://www.xbrl.org/2003/role/disclosureRef
-Topic 280
-SubTopic 10
-Name Accounting Standards Codification
-Section 50
-Paragraph 32
-Subparagraph (ee)
-Publisher FASB
-URI https://asc.fasb.org/1943274/2147482810/280-10-50-32
Reference 4: http://www.xbrl.org/2003/role/disclosureRef
-Topic 944
-SubTopic 220
-Name Accounting Standards Codification
-Section S99
-Paragraph 1
-Subparagraph (SX 210.7-04(10))
-Publisher FASB
-URI https://asc.fasb.org/1943274/2147477250/944-220-S99-1
Reference 5: http://www.xbrl.org/2003/role/disclosureRef
-Topic 323
-SubTopic 10
-Name Accounting Standards Codification
-Section 45
-Paragraph 1
-Publisher FASB
-URI https://asc.fasb.org/1943274/2147481664/323-10-45-1
Reference 6: http://www.xbrl.org/2003/role/disclosureRef
-Topic 280
-SubTopic 10
-Name Accounting Standards Codification
-Section 50
-Paragraph 22
-Subparagraph (g)
-Publisher FASB
-URI https://asc.fasb.org/1943274/2147482810/280-10-50-22
Reference 7: http://fasb.org/us-gaap/role/ref/legacyRef
-Topic 220
-SubTopic 10
-Name Accounting Standards Codification
-Section S99
-Paragraph 2
-Subparagraph (SX 210.5-03(12))
-Publisher FASB
-URI https://asc.fasb.org/1943274/2147483621/220-10-S99-2
Reference 8: http://fasb.org/us-gaap/role/ref/legacyRef
-Topic 942
-SubTopic 220
-Name Accounting Standards Codification
-Section S99
-Paragraph 1
-Subparagraph (SX 210.9-04(13)(f))
-Publisher FASB
-URI https://asc.fasb.org/1943274/2147478524/942-220-S99-1
| Name: |
us-gaap_IncomeLossFromEquityMethodInvestments |
| Namespace Prefix: |
us-gaap_ |
| Data Type: |
xbrli:monetaryItemType |
| Balance Type: |
credit |
| Period Type: |
duration |
|
| X |
- DefinitionThe consolidated profit or loss for the period, net of income taxes, including the portion attributable to the noncontrolling interest. Reference 1: http://www.xbrl.org/2003/role/disclosureRef
-Topic 250
-SubTopic 10
-Name Accounting Standards Codification
-Section 50
-Paragraph 6
-Publisher FASB
-URI https://asc.fasb.org/1943274/2147483443/250-10-50-6
Reference 2: http://www.xbrl.org/2003/role/disclosureRef
-Topic 250
-SubTopic 10
-Name Accounting Standards Codification
-Section 50
-Paragraph 9
-Publisher FASB
-URI https://asc.fasb.org/1943274/2147483443/250-10-50-9
Reference 3: http://www.xbrl.org/2003/role/disclosureRef
-Topic 805
-SubTopic 60
-Name Accounting Standards Codification
-Section 65
-Paragraph 1
-Subparagraph (g)
-Publisher FASB
-URI https://asc.fasb.org/1943274/2147476176/805-60-65-1
Reference 4: http://www.xbrl.org/2003/role/disclosureRef
-Topic 740
-SubTopic 323
-Name Accounting Standards Codification
-Section 65
-Paragraph 2
-Subparagraph (g)(3)
-Publisher FASB
-URI https://asc.fasb.org/1943274/2147478666/740-323-65-2
Reference 5: http://www.xbrl.org/2003/role/disclosureRef
-Topic 235
-SubTopic 10
-Name Accounting Standards Codification
-Section S99
-Paragraph 1
-Subparagraph (SX 210.4-08(g)(1)(ii))
-Publisher FASB
-URI https://asc.fasb.org/1943274/2147480678/235-10-S99-1
Reference 6: http://www.xbrl.org/2003/role/disclosureRef
-Topic 323
-SubTopic 10
-Name Accounting Standards Codification
-Section 50
-Paragraph 3
-Subparagraph (c)
-Publisher FASB
-URI https://asc.fasb.org/1943274/2147481687/323-10-50-3
Reference 7: http://www.xbrl.org/2003/role/disclosureRef
-Topic 825
-SubTopic 10
-Name Accounting Standards Codification
-Section 50
-Paragraph 28
-Subparagraph (f)
-Publisher FASB
-URI https://asc.fasb.org/1943274/2147482907/825-10-50-28
Reference 8: http://www.xbrl.org/2003/role/disclosureRef
-Topic 250
-SubTopic 10
-Name Accounting Standards Codification
-Section 50
-Paragraph 1
-Subparagraph (b)(2)
-Publisher FASB
-URI https://asc.fasb.org/1943274/2147483443/250-10-50-1
Reference 9: http://www.xbrl.org/2003/role/disclosureRef
-Topic 815
-SubTopic 40
-Name Accounting Standards Codification
-Section 65
-Paragraph 1
-Subparagraph (f)
-Publisher FASB
-URI https://asc.fasb.org/1943274/2147480175/815-40-65-1
Reference 10: http://www.xbrl.org/2003/role/disclosureRef
-Topic 250
-SubTopic 10
-Name Accounting Standards Codification
-Section 50
-Paragraph 8
-Publisher FASB
-URI https://asc.fasb.org/1943274/2147483443/250-10-50-8
Reference 11: http://www.xbrl.org/2003/role/exampleRef
-Topic 946
-SubTopic 830
-Name Accounting Standards Codification
-Section 55
-Paragraph 11
-Publisher FASB
-URI https://asc.fasb.org/1943274/2147479168/946-830-55-11
Reference 12: http://www.xbrl.org/2003/role/disclosureRef
-Topic 946
-SubTopic 205
-Name Accounting Standards Codification
-Section 45
-Paragraph 3
-Subparagraph (a)
-Publisher FASB
-URI https://asc.fasb.org/1943274/2147478009/946-205-45-3
Reference 13: http://www.xbrl.org/2003/role/disclosureRef
-Topic 946
-SubTopic 220
-Name Accounting Standards Codification
-Section 45
-Paragraph 7
-Publisher FASB
-URI https://asc.fasb.org/1943274/2147479105/946-220-45-7
Reference 14: http://www.xbrl.org/2003/role/disclosureRef
-Topic 944
-SubTopic 220
-Name Accounting Standards Codification
-Section S99
-Paragraph 1
-Subparagraph (SX 210.7-04(16))
-Publisher FASB
-URI https://asc.fasb.org/1943274/2147477250/944-220-S99-1
Reference 15: http://www.xbrl.org/2003/role/disclosureRef
-Topic 946
-SubTopic 220
-Name Accounting Standards Codification
-Section S99
-Paragraph 1
-Subparagraph (SX 210.6-07(9))
-Publisher FASB
-URI https://asc.fasb.org/1943274/2147479134/946-220-S99-1
Reference 16: http://www.xbrl.org/2003/role/disclosureRef
-Topic 946
-SubTopic 220
-Name Accounting Standards Codification
-Section S99
-Paragraph 3
-Subparagraph (SX 210.6-09(1)(d))
-Publisher FASB
-URI https://asc.fasb.org/1943274/2147479134/946-220-S99-3
Reference 17: http://www.xbrl.org/2003/role/disclosureRef
-Topic 810
-SubTopic 10
-Name Accounting Standards Codification
-Section 45
-Paragraph 19
-Publisher FASB
-URI https://asc.fasb.org/1943274/2147481231/810-10-45-19
Reference 18: http://www.xbrl.org/2009/role/commonPracticeRef
-Topic 220
-SubTopic 10
-Name Accounting Standards Codification
-Section 50
-Paragraph 6
-Publisher FASB
-URI https://asc.fasb.org/1943274/2147482765/220-10-50-6
Reference 19: http://www.xbrl.org/2003/role/disclosureRef
-Topic 470
-SubTopic 10
-Name Accounting Standards Codification
-Section S99
-Paragraph 1A
-Subparagraph (SX 210.13-01(a)(4)(i))
-Publisher FASB
-URI https://asc.fasb.org/1943274/2147480097/470-10-S99-1A
Reference 20: http://www.xbrl.org/2009/role/commonPracticeRef
-Topic 470
-SubTopic 10
-Name Accounting Standards Codification
-Section S99
-Paragraph 1A
-Subparagraph (SX 210.13-01(a)(4)(ii))
-Publisher FASB
-URI https://asc.fasb.org/1943274/2147480097/470-10-S99-1A
Reference 21: http://www.xbrl.org/2003/role/disclosureRef
-Topic 470
-SubTopic 10
-Name Accounting Standards Codification
-Section S99
-Paragraph 1A
-Subparagraph (SX 210.13-01(a)(4)(iii)(A))
-Publisher FASB
-URI https://asc.fasb.org/1943274/2147480097/470-10-S99-1A
Reference 22: http://www.xbrl.org/2003/role/disclosureRef
-Topic 470
-SubTopic 10
-Name Accounting Standards Codification
-Section S99
-Paragraph 1A
-Subparagraph (SX 210.13-01(a)(4)(iv))
-Publisher FASB
-URI https://asc.fasb.org/1943274/2147480097/470-10-S99-1A
Reference 23: http://www.xbrl.org/2003/role/disclosureRef
-Topic 470
-SubTopic 10
-Name Accounting Standards Codification
-Section S99
-Paragraph 1A
-Subparagraph (SX 210.13-01(a)(5))
-Publisher FASB
-URI https://asc.fasb.org/1943274/2147480097/470-10-S99-1A
Reference 24: http://www.xbrl.org/2003/role/disclosureRef
-Topic 470
-SubTopic 10
-Name Accounting Standards Codification
-Section S99
-Paragraph 1B
-Subparagraph (SX 210.13-02(a)(4)(i))
-Publisher FASB
-URI https://asc.fasb.org/1943274/2147480097/470-10-S99-1B
Reference 25: http://www.xbrl.org/2003/role/disclosureRef
-Topic 470
-SubTopic 10
-Name Accounting Standards Codification
-Section S99
-Paragraph 1B
-Subparagraph (SX 210.13-02(a)(4)(iii)(A))
-Publisher FASB
-URI https://asc.fasb.org/1943274/2147480097/470-10-S99-1B
Reference 26: http://www.xbrl.org/2003/role/disclosureRef
-Topic 470
-SubTopic 10
-Name Accounting Standards Codification
-Section S99
-Paragraph 1B
-Subparagraph (SX 210.13-02(a)(4)(iii)(B))
-Publisher FASB
-URI https://asc.fasb.org/1943274/2147480097/470-10-S99-1B
Reference 27: http://www.xbrl.org/2003/role/disclosureRef
-Topic 470
-SubTopic 10
-Name Accounting Standards Codification
-Section S99
-Paragraph 1B
-Subparagraph (SX 210.13-02(a)(4)(iv))
-Publisher FASB
-URI https://asc.fasb.org/1943274/2147480097/470-10-S99-1B
Reference 28: http://www.xbrl.org/2003/role/disclosureRef
-Topic 470
-SubTopic 10
-Name Accounting Standards Codification
-Section S99
-Paragraph 1B
-Subparagraph (SX 210.13-02(a)(5))
-Publisher FASB
-URI https://asc.fasb.org/1943274/2147480097/470-10-S99-1B
Reference 29: http://www.xbrl.org/2003/role/disclosureRef
-Topic 942
-SubTopic 235
-Name Accounting Standards Codification
-Section S99
-Paragraph 1
-Subparagraph (SX 210.9-05(b)(2))
-Publisher FASB
-URI https://asc.fasb.org/1943274/2147477314/942-235-S99-1
Reference 30: http://www.xbrl.org/2003/role/disclosureRef
-Topic 205
-SubTopic 20
-Name Accounting Standards Codification
-Section 50
-Paragraph 7
-Publisher FASB
-URI https://asc.fasb.org/1943274/2147483499/205-20-50-7
Reference 31: http://www.xbrl.org/2003/role/exampleRef
-Topic 810
-SubTopic 10
-Name Accounting Standards Codification
-Section 55
-Paragraph 4J
-Publisher FASB
-URI https://asc.fasb.org/1943274/2147481175/810-10-55-4J
Reference 32: http://www.xbrl.org/2003/role/exampleRef
-Topic 810
-SubTopic 10
-Name Accounting Standards Codification
-Section 55
-Paragraph 4K
-Publisher FASB
-URI https://asc.fasb.org/1943274/2147481175/810-10-55-4K
Reference 33: http://www.xbrl.org/2003/role/disclosureRef
-Topic 220
-SubTopic 10
-Name Accounting Standards Codification
-Section 45
-Paragraph 1A
-Subparagraph (a)
-Publisher FASB
-URI https://asc.fasb.org/1943274/2147482790/220-10-45-1A
Reference 34: http://www.xbrl.org/2003/role/disclosureRef
-Topic 220
-SubTopic 10
-Name Accounting Standards Codification
-Section 45
-Paragraph 1B
-Subparagraph (a)
-Publisher FASB
-URI https://asc.fasb.org/1943274/2147482790/220-10-45-1B
Reference 35: http://www.xbrl.org/2003/role/disclosureRef
-Topic 230
-SubTopic 10
-Name Accounting Standards Codification
-Section 45
-Paragraph 2
-Publisher FASB
-URI https://asc.fasb.org/1943274/2147482740/230-10-45-2
Reference 36: http://www.xbrl.org/2003/role/disclosureRef
-Topic 810
-SubTopic 10
-Name Accounting Standards Codification
-Section 50
-Paragraph 1A
-Subparagraph (a)(1)
-Publisher FASB
-URI https://asc.fasb.org/1943274/2147481203/810-10-50-1A
Reference 37: http://www.xbrl.org/2003/role/disclosureRef
-Topic 810
-SubTopic 10
-Name Accounting Standards Codification
-Section 50
-Paragraph 1A
-Subparagraph (c)(1)
-Publisher FASB
-URI https://asc.fasb.org/1943274/2147481203/810-10-50-1A
| Name: |
us-gaap_ProfitLoss |
| Namespace Prefix: |
us-gaap_ |
| Data Type: |
xbrli:monetaryItemType |
| Balance Type: |
credit |
| Period Type: |
duration |
|
| X |
- DefinitionAmount of revenue recognized from goods sold, services rendered, insurance premiums, or other activities that constitute an earning process. Includes, but is not limited to, investment and interest income before deduction of interest expense when recognized as a component of revenue, and sales and trading gain (loss). Reference 1: http://www.xbrl.org/2003/role/exampleRef
-Topic 280
-SubTopic 10
-Name Accounting Standards Codification
-Section 55
-Paragraph 48
-Publisher FASB
-URI https://asc.fasb.org/1943274/2147482785/280-10-55-48
Reference 2: http://www.xbrl.org/2003/role/disclosureRef
-Topic 280
-SubTopic 10
-Name Accounting Standards Codification
-Section 50
-Paragraph 41
-Subparagraph (a)
-Publisher FASB
-URI https://asc.fasb.org/1943274/2147482810/280-10-50-41
Reference 3: http://www.xbrl.org/2003/role/disclosureRef
-Topic 270
-SubTopic 10
-Name Accounting Standards Codification
-Section 50
-Paragraph 1
-Subparagraph (i)
-Publisher FASB
-URI https://asc.fasb.org/1943274/2147482964/270-10-50-1
Reference 4: http://www.xbrl.org/2003/role/disclosureRef
-Topic 280
-SubTopic 10
-Name Accounting Standards Codification
-Section 50
-Paragraph 32
-Subparagraph (ee)
-Publisher FASB
-URI https://asc.fasb.org/1943274/2147482810/280-10-50-32
Reference 5: http://fasb.org/us-gaap/role/ref/otherTransitionRef
-Topic 280
-SubTopic 10
-Name Accounting Standards Codification
-Section 50
-Paragraph 32
-Subparagraph (b)
-Publisher FASB
-URI https://asc.fasb.org/1943274/2147482810/280-10-50-32
Reference 6: http://fasb.org/us-gaap/role/ref/otherTransitionRef
-Topic 280
-SubTopic 10
-Name Accounting Standards Codification
-Section 50
-Paragraph 32
-Subparagraph (a)
-Publisher FASB
-URI https://asc.fasb.org/1943274/2147482810/280-10-50-32
Reference 7: http://www.xbrl.org/2003/role/disclosureRef
-Topic 235
-SubTopic 10
-Name Accounting Standards Codification
-Section S99
-Paragraph 1
-Subparagraph (SX 210.4-08(g)(1)(ii))
-Publisher FASB
-URI https://asc.fasb.org/1943274/2147480678/235-10-S99-1
Reference 8: http://www.xbrl.org/2003/role/disclosureRef
-Topic 323
-SubTopic 10
-Name Accounting Standards Codification
-Section 50
-Paragraph 3
-Subparagraph (c)
-Publisher FASB
-URI https://asc.fasb.org/1943274/2147481687/323-10-50-3
Reference 9: http://www.xbrl.org/2003/role/disclosureRef
-Topic 825
-SubTopic 10
-Name Accounting Standards Codification
-Section 50
-Paragraph 28
-Subparagraph (f)
-Publisher FASB
-URI https://asc.fasb.org/1943274/2147482907/825-10-50-28
Reference 10: http://www.xbrl.org/2003/role/disclosureRef
-Topic 470
-SubTopic 10
-Name Accounting Standards Codification
-Section S99
-Paragraph 1A
-Subparagraph (SX 210.13-01(a)(4)(i))
-Publisher FASB
-URI https://asc.fasb.org/1943274/2147480097/470-10-S99-1A
Reference 11: http://www.xbrl.org/2009/role/commonPracticeRef
-Topic 470
-SubTopic 10
-Name Accounting Standards Codification
-Section S99
-Paragraph 1A
-Subparagraph (SX 210.13-01(a)(4)(ii))
-Publisher FASB
-URI https://asc.fasb.org/1943274/2147480097/470-10-S99-1A
Reference 12: http://www.xbrl.org/2003/role/disclosureRef
-Topic 470
-SubTopic 10
-Name Accounting Standards Codification
-Section S99
-Paragraph 1A
-Subparagraph (SX 210.13-01(a)(4)(iii)(A))
-Publisher FASB
-URI https://asc.fasb.org/1943274/2147480097/470-10-S99-1A
Reference 13: http://www.xbrl.org/2003/role/disclosureRef
-Topic 470
-SubTopic 10
-Name Accounting Standards Codification
-Section S99
-Paragraph 1A
-Subparagraph (SX 210.13-01(a)(4)(iv))
-Publisher FASB
-URI https://asc.fasb.org/1943274/2147480097/470-10-S99-1A
Reference 14: http://www.xbrl.org/2003/role/disclosureRef
-Topic 470
-SubTopic 10
-Name Accounting Standards Codification
-Section S99
-Paragraph 1A
-Subparagraph (SX 210.13-01(a)(5))
-Publisher FASB
-URI https://asc.fasb.org/1943274/2147480097/470-10-S99-1A
Reference 15: http://www.xbrl.org/2003/role/disclosureRef
-Topic 470
-SubTopic 10
-Name Accounting Standards Codification
-Section S99
-Paragraph 1B
-Subparagraph (SX 210.13-02(a)(4)(i))
-Publisher FASB
-URI https://asc.fasb.org/1943274/2147480097/470-10-S99-1B
Reference 16: http://www.xbrl.org/2003/role/disclosureRef
-Topic 470
-SubTopic 10
-Name Accounting Standards Codification
-Section S99
-Paragraph 1B
-Subparagraph (SX 210.13-02(a)(4)(iii)(A))
-Publisher FASB
-URI https://asc.fasb.org/1943274/2147480097/470-10-S99-1B
Reference 17: http://www.xbrl.org/2003/role/disclosureRef
-Topic 470
-SubTopic 10
-Name Accounting Standards Codification
-Section S99
-Paragraph 1B
-Subparagraph (SX 210.13-02(a)(4)(iii)(B))
-Publisher FASB
-URI https://asc.fasb.org/1943274/2147480097/470-10-S99-1B
Reference 18: http://www.xbrl.org/2003/role/disclosureRef
-Topic 470
-SubTopic 10
-Name Accounting Standards Codification
-Section S99
-Paragraph 1B
-Subparagraph (SX 210.13-02(a)(4)(iv))
-Publisher FASB
-URI https://asc.fasb.org/1943274/2147480097/470-10-S99-1B
Reference 19: http://www.xbrl.org/2003/role/disclosureRef
-Topic 470
-SubTopic 10
-Name Accounting Standards Codification
-Section S99
-Paragraph 1B
-Subparagraph (SX 210.13-02(a)(5))
-Publisher FASB
-URI https://asc.fasb.org/1943274/2147480097/470-10-S99-1B
Reference 20: http://www.xbrl.org/2003/role/disclosureRef
-Topic 280
-SubTopic 10
-Name Accounting Standards Codification
-Section 50
-Paragraph 30
-Subparagraph (a)
-Publisher FASB
-URI https://asc.fasb.org/1943274/2147482810/280-10-50-30
Reference 21: http://www.xbrl.org/2003/role/disclosureRef
-Topic 280
-SubTopic 10
-Name Accounting Standards Codification
-Section 50
-Paragraph 42
-Publisher FASB
-URI https://asc.fasb.org/1943274/2147482810/280-10-50-42
Reference 22: http://www.xbrl.org/2003/role/disclosureRef
-Topic 280
-SubTopic 10
-Name Accounting Standards Codification
-Section 50
-Paragraph 22
-Subparagraph (b)
-Publisher FASB
-URI https://asc.fasb.org/1943274/2147482810/280-10-50-22
Reference 23: http://www.xbrl.org/2003/role/disclosureRef
-Topic 280
-SubTopic 10
-Name Accounting Standards Codification
-Section 50
-Paragraph 40
-Publisher FASB
-URI https://asc.fasb.org/1943274/2147482810/280-10-50-40
Reference 24: http://www.xbrl.org/2003/role/disclosureRef
-Topic 280
-SubTopic 10
-Name Accounting Standards Codification
-Section 50
-Paragraph 22
-Subparagraph (a)
-Publisher FASB
-URI https://asc.fasb.org/1943274/2147482810/280-10-50-22
Reference 25: http://www.xbrl.org/2003/role/disclosureRef
-Topic 942
-SubTopic 235
-Name Accounting Standards Codification
-Section S99
-Paragraph 1
-Subparagraph (SX 210.9-05(b)(2))
-Publisher FASB
-URI https://asc.fasb.org/1943274/2147477314/942-235-S99-1
Reference 26: http://www.xbrl.org/2003/role/disclosureRef
-Topic 220
-SubTopic 10
-Name Accounting Standards Codification
-Section S99
-Paragraph 2
-Subparagraph (SX 210.5-03(1))
-Publisher FASB
-URI https://asc.fasb.org/1943274/2147483621/220-10-S99-2
| Name: |
us-gaap_Revenues |
| Namespace Prefix: |
us-gaap_ |
| Data Type: |
xbrli:monetaryItemType |
| Balance Type: |
credit |
| Period Type: |
duration |
|
| X |
- Details
| Name: |
srt_ConsolidationItemsAxis=us-gaap_OperatingSegmentsMember |
| Namespace Prefix: |
|
| Data Type: |
na |
| Balance Type: |
|
| Period Type: |
|
|
| X |
- Details
| Name: |
srt_ConsolidationItemsAxis=us-gaap_CorporateNonSegmentMember |
| Namespace Prefix: |
|
| Data Type: |
na |
| Balance Type: |
|
| Period Type: |
|
|
| X |
- Details
| Name: |
us-gaap_StatementBusinessSegmentsAxis=fph_ValenciaMember |
| Namespace Prefix: |
|
| Data Type: |
na |
| Balance Type: |
|
| Period Type: |
|
|
| X |
- Details
| Name: |
us-gaap_StatementBusinessSegmentsAxis=fph_SanFranciscoMember |
| Namespace Prefix: |
|
| Data Type: |
na |
| Balance Type: |
|
| Period Type: |
|
|
| X |
- Details
| Name: |
us-gaap_StatementBusinessSegmentsAxis=fph_GreatParkVentureMember |
| Namespace Prefix: |
|
| Data Type: |
na |
| Balance Type: |
|
| Period Type: |
|
|
| X |
- Details
| Name: |
srt_ConsolidationItemsAxis=us-gaap_MaterialReconcilingItemsMember |
| Namespace Prefix: |
|
| Data Type: |
na |
| Balance Type: |
|
| Period Type: |
|
|
| X |
- Details
| Name: |
us-gaap_StatementBusinessSegmentsAxis=fph_GatewayCommercialVentureLLCAMember |
| Namespace Prefix: |
|
| Data Type: |
na |
| Balance Type: |
|
| Period Type: |
|
|
v3.24.2
Segment Reporting - Assets (Details) - USD ($)
$ in Thousands |
Jun. 30, 2024 |
Dec. 31, 2023 |
| Segment Reporting Information [Line Items] |
|
|
| Assets |
$ 2,920,139
|
$ 2,969,288
|
| Operating Segments |
|
|
| Segment Reporting Information [Line Items] |
|
|
| Assets |
3,181,353
|
3,052,531
|
| Consolidation Eliminations, Great Park |
|
|
| Segment Reporting Information [Line Items] |
|
|
| Assets |
(645,415)
|
(619,199)
|
| Consolidation Eliminations, Gateway |
|
|
| Segment Reporting Information [Line Items] |
|
|
| Assets |
(85,000)
|
(85,847)
|
| Other eliminations |
|
|
| Segment Reporting Information [Line Items] |
|
|
| Assets |
(547)
|
(174)
|
| Corporate and unallocated |
|
|
| Segment Reporting Information [Line Items] |
|
|
| Assets |
232,662
|
370,410
|
| Valencia | Operating Segments |
|
|
| Segment Reporting Information [Line Items] |
|
|
| Assets |
942,548
|
895,983
|
| San Francisco | Operating Segments |
|
|
| Segment Reporting Information [Line Items] |
|
|
| Assets |
1,389,951
|
1,360,036
|
| Great Park | Operating Segments |
|
|
| Segment Reporting Information [Line Items] |
|
|
| Assets |
763,854
|
710,665
|
| Great Park | Segment Reconciling Items |
|
|
| Segment Reporting Information [Line Items] |
|
|
| Assets |
199,610
|
213,786
|
| Commercial | Operating Segments |
|
|
| Segment Reporting Information [Line Items] |
|
|
| Assets |
85,000
|
85,847
|
| Commercial | Segment Reconciling Items |
|
|
| Segment Reporting Information [Line Items] |
|
|
| Assets |
$ 37,476
|
$ 37,781
|
| X |
- DefinitionAmount of asset recognized for present right to economic benefit. Reference 1: http://www.xbrl.org/2003/role/exampleRef
-Topic 280
-SubTopic 10
-Name Accounting Standards Codification
-Section 55
-Paragraph 48
-Publisher FASB
-URI https://asc.fasb.org/1943274/2147482785/280-10-55-48
Reference 2: http://www.xbrl.org/2003/role/exampleRef
-Topic 280
-SubTopic 10
-Name Accounting Standards Codification
-Section 55
-Paragraph 49
-Publisher FASB
-URI https://asc.fasb.org/1943274/2147482785/280-10-55-49
Reference 3: http://www.xbrl.org/2003/role/disclosureRef
-Topic 270
-SubTopic 10
-Name Accounting Standards Codification
-Section 50
-Paragraph 1
-Subparagraph (i)
-Publisher FASB
-URI https://asc.fasb.org/1943274/2147482964/270-10-50-1
Reference 4: http://www.xbrl.org/2003/role/disclosureRef
-Topic 280
-SubTopic 10
-Name Accounting Standards Codification
-Section 50
-Paragraph 32
-Subparagraph (ee)
-Publisher FASB
-URI https://asc.fasb.org/1943274/2147482810/280-10-50-32
Reference 5: http://fasb.org/us-gaap/role/ref/otherTransitionRef
-Topic 280
-SubTopic 10
-Name Accounting Standards Codification
-Section 50
-Paragraph 32
-Subparagraph (d)
-Publisher FASB
-URI https://asc.fasb.org/1943274/2147482810/280-10-50-32
Reference 6: http://www.xbrl.org/2003/role/disclosureRef
-Topic 280
-SubTopic 10
-Name Accounting Standards Codification
-Section 50
-Paragraph 22
-Publisher FASB
-URI https://asc.fasb.org/1943274/2147482810/280-10-50-22
Reference 7: http://www.xbrl.org/2003/role/disclosureRef
-Topic 810
-SubTopic 10
-Name Accounting Standards Codification
-Section 50
-Paragraph 3
-Subparagraph (bb)
-Publisher FASB
-URI https://asc.fasb.org/1943274/2147481203/810-10-50-3
Reference 8: http://www.xbrl.org/2003/role/disclosureRef
-Topic 810
-SubTopic 10
-Name Accounting Standards Codification
-Section 45
-Paragraph 25
-Subparagraph (a)
-Publisher FASB
-URI https://asc.fasb.org/1943274/2147481231/810-10-45-25
Reference 9: http://www.xbrl.org/2003/role/disclosureRef
-Topic 235
-SubTopic 10
-Name Accounting Standards Codification
-Section S99
-Paragraph 1
-Subparagraph (SX 210.4-08(g)(1)(ii))
-Publisher FASB
-URI https://asc.fasb.org/1943274/2147480678/235-10-S99-1
Reference 10: http://www.xbrl.org/2003/role/disclosureRef
-Topic 323
-SubTopic 10
-Name Accounting Standards Codification
-Section 50
-Paragraph 3
-Subparagraph (c)
-Publisher FASB
-URI https://asc.fasb.org/1943274/2147481687/323-10-50-3
Reference 11: http://www.xbrl.org/2003/role/disclosureRef
-Topic 825
-SubTopic 10
-Name Accounting Standards Codification
-Section 50
-Paragraph 28
-Subparagraph (f)
-Publisher FASB
-URI https://asc.fasb.org/1943274/2147482907/825-10-50-28
Reference 12: http://www.xbrl.org/2003/role/exampleRef
-Topic 852
-SubTopic 10
-Name Accounting Standards Codification
-Section 55
-Paragraph 10
-Publisher FASB
-URI https://asc.fasb.org/1943274/2147481372/852-10-55-10
Reference 13: http://www.xbrl.org/2003/role/exampleRef
-Topic 946
-SubTopic 830
-Name Accounting Standards Codification
-Section 55
-Paragraph 12
-Publisher FASB
-URI https://asc.fasb.org/1943274/2147479168/946-830-55-12
Reference 14: http://www.xbrl.org/2003/role/disclosureRef
-Topic 944
-SubTopic 210
-Name Accounting Standards Codification
-Section S99
-Paragraph 1
-Subparagraph (SX 210.7-03(a)(12))
-Publisher FASB
-URI https://asc.fasb.org/1943274/2147478777/944-210-S99-1
Reference 15: http://www.xbrl.org/2003/role/disclosureRef
-Topic 946
-SubTopic 210
-Name Accounting Standards Codification
-Section S99
-Paragraph 1
-Subparagraph (SX 210.6-04(8))
-Publisher FASB
-URI https://asc.fasb.org/1943274/2147479170/946-210-S99-1
Reference 16: http://www.xbrl.org/2003/role/disclosureRef
-Topic 210
-SubTopic 10
-Name Accounting Standards Codification
-Section S99
-Paragraph 1
-Subparagraph (SX 210.5-02(18))
-Publisher FASB
-URI https://asc.fasb.org/1943274/2147480566/210-10-S99-1
Reference 17: http://www.xbrl.org/2003/role/disclosureRef
-Topic 470
-SubTopic 10
-Name Accounting Standards Codification
-Section S99
-Paragraph 1A
-Subparagraph (SX 210.13-01(a)(4)(i))
-Publisher FASB
-URI https://asc.fasb.org/1943274/2147480097/470-10-S99-1A
Reference 18: http://www.xbrl.org/2009/role/commonPracticeRef
-Topic 470
-SubTopic 10
-Name Accounting Standards Codification
-Section S99
-Paragraph 1A
-Subparagraph (SX 210.13-01(a)(4)(ii))
-Publisher FASB
-URI https://asc.fasb.org/1943274/2147480097/470-10-S99-1A
Reference 19: http://www.xbrl.org/2009/role/commonPracticeRef
-Topic 470
-SubTopic 10
-Name Accounting Standards Codification
-Section S99
-Paragraph 1A
-Subparagraph (SX 210.13-01(a)(4)(iii))
-Publisher FASB
-URI https://asc.fasb.org/1943274/2147480097/470-10-S99-1A
Reference 20: http://www.xbrl.org/2003/role/disclosureRef
-Topic 470
-SubTopic 10
-Name Accounting Standards Codification
-Section S99
-Paragraph 1A
-Subparagraph (SX 210.13-01(a)(4)(iii)(A))
-Publisher FASB
-URI https://asc.fasb.org/1943274/2147480097/470-10-S99-1A
Reference 21: http://www.xbrl.org/2003/role/disclosureRef
-Topic 470
-SubTopic 10
-Name Accounting Standards Codification
-Section S99
-Paragraph 1A
-Subparagraph (SX 210.13-01(a)(4)(iv))
-Publisher FASB
-URI https://asc.fasb.org/1943274/2147480097/470-10-S99-1A
Reference 22: http://www.xbrl.org/2003/role/disclosureRef
-Topic 470
-SubTopic 10
-Name Accounting Standards Codification
-Section S99
-Paragraph 1A
-Subparagraph (SX 210.13-01(a)(5))
-Publisher FASB
-URI https://asc.fasb.org/1943274/2147480097/470-10-S99-1A
Reference 23: http://www.xbrl.org/2003/role/disclosureRef
-Topic 470
-SubTopic 10
-Name Accounting Standards Codification
-Section S99
-Paragraph 1B
-Subparagraph (SX 210.13-02(a)(4)(i))
-Publisher FASB
-URI https://asc.fasb.org/1943274/2147480097/470-10-S99-1B
Reference 24: http://www.xbrl.org/2003/role/disclosureRef
-Topic 470
-SubTopic 10
-Name Accounting Standards Codification
-Section S99
-Paragraph 1B
-Subparagraph (SX 210.13-02(a)(4)(iii)(A))
-Publisher FASB
-URI https://asc.fasb.org/1943274/2147480097/470-10-S99-1B
Reference 25: http://www.xbrl.org/2003/role/disclosureRef
-Topic 470
-SubTopic 10
-Name Accounting Standards Codification
-Section S99
-Paragraph 1B
-Subparagraph (SX 210.13-02(a)(4)(iii)(B))
-Publisher FASB
-URI https://asc.fasb.org/1943274/2147480097/470-10-S99-1B
Reference 26: http://www.xbrl.org/2003/role/disclosureRef
-Topic 470
-SubTopic 10
-Name Accounting Standards Codification
-Section S99
-Paragraph 1B
-Subparagraph (SX 210.13-02(a)(4)(iv))
-Publisher FASB
-URI https://asc.fasb.org/1943274/2147480097/470-10-S99-1B
Reference 27: http://www.xbrl.org/2003/role/disclosureRef
-Topic 470
-SubTopic 10
-Name Accounting Standards Codification
-Section S99
-Paragraph 1B
-Subparagraph (SX 210.13-02(a)(5))
-Publisher FASB
-URI https://asc.fasb.org/1943274/2147480097/470-10-S99-1B
Reference 28: http://www.xbrl.org/2009/role/commonPracticeRef
-Topic 852
-SubTopic 10
-Name Accounting Standards Codification
-Section 50
-Paragraph 7
-Subparagraph (a)
-Publisher FASB
-URI https://asc.fasb.org/1943274/2147481404/852-10-50-7
Reference 29: http://www.xbrl.org/2003/role/disclosureRef
-Topic 280
-SubTopic 10
-Name Accounting Standards Codification
-Section 50
-Paragraph 30
-Subparagraph (c)
-Publisher FASB
-URI https://asc.fasb.org/1943274/2147482810/280-10-50-30
Reference 30: http://fasb.org/us-gaap/role/ref/legacyRef
-Topic 942
-SubTopic 210
-Name Accounting Standards Codification
-Section S99
-Paragraph 1
-Subparagraph (SX 210.9-03(11))
-Publisher FASB
-URI https://asc.fasb.org/1943274/2147478546/942-210-S99-1
| Name: |
us-gaap_Assets |
| Namespace Prefix: |
us-gaap_ |
| Data Type: |
xbrli:monetaryItemType |
| Balance Type: |
debit |
| Period Type: |
instant |
|
| X |
- Details
| Name: |
srt_ConsolidationItemsAxis=us-gaap_OperatingSegmentsMember |
| Namespace Prefix: |
|
| Data Type: |
na |
| Balance Type: |
|
| Period Type: |
|
|
| X |
- Details
| Name: |
srt_ConsolidationItemsAxis=fph_ConsolidationEliminationsGreatParkMember |
| Namespace Prefix: |
|
| Data Type: |
na |
| Balance Type: |
|
| Period Type: |
|
|
| X |
- Details
| Name: |
srt_ConsolidationItemsAxis=fph_ConsolidationEliminationsGatewayMember |
| Namespace Prefix: |
|
| Data Type: |
na |
| Balance Type: |
|
| Period Type: |
|
|
| X |
- Details
| Name: |
srt_ConsolidationItemsAxis=us-gaap_IntersegmentEliminationMember |
| Namespace Prefix: |
|
| Data Type: |
na |
| Balance Type: |
|
| Period Type: |
|
|
| X |
- Details
| Name: |
srt_ConsolidationItemsAxis=us-gaap_CorporateNonSegmentMember |
| Namespace Prefix: |
|
| Data Type: |
na |
| Balance Type: |
|
| Period Type: |
|
|
| X |
- Details
| Name: |
us-gaap_StatementBusinessSegmentsAxis=fph_ValenciaMember |
| Namespace Prefix: |
|
| Data Type: |
na |
| Balance Type: |
|
| Period Type: |
|
|
| X |
- Details
| Name: |
us-gaap_StatementBusinessSegmentsAxis=fph_SanFranciscoMember |
| Namespace Prefix: |
|
| Data Type: |
na |
| Balance Type: |
|
| Period Type: |
|
|
| X |
- Details
| Name: |
us-gaap_StatementBusinessSegmentsAxis=fph_GreatParkVentureMember |
| Namespace Prefix: |
|
| Data Type: |
na |
| Balance Type: |
|
| Period Type: |
|
|
| X |
- Details
| Name: |
srt_ConsolidationItemsAxis=us-gaap_MaterialReconcilingItemsMember |
| Namespace Prefix: |
|
| Data Type: |
na |
| Balance Type: |
|
| Period Type: |
|
|
| X |
- Details
| Name: |
us-gaap_StatementBusinessSegmentsAxis=fph_GatewayCommercialVentureLLCAMember |
| Namespace Prefix: |
|
| Data Type: |
na |
| Balance Type: |
|
| Period Type: |
|
|
v3.24.2
| X |
- DefinitionThe number of equity-based payment instruments, excluding stock (or unit) options, that were forfeited during the reporting period. Reference 1: http://www.xbrl.org/2003/role/disclosureRef
-Topic 718
-SubTopic 10
-Name Accounting Standards Codification
-Section 50
-Paragraph 2
-Subparagraph (c)(2)(iii)(03)
-Publisher FASB
-URI https://asc.fasb.org/1943274/2147480429/718-10-50-2
| Name: |
us-gaap_ShareBasedCompensationArrangementByShareBasedPaymentAwardEquityInstrumentsOtherThanOptionsForfeitedInPeriod |
| Namespace Prefix: |
us-gaap_ |
| Data Type: |
xbrli:sharesItemType |
| Balance Type: |
na |
| Period Type: |
duration |
|
| X |
- DefinitionWeighted average fair value as of the grant date of equity-based award plans other than stock (unit) option plans that were not exercised or put into effect as a result of the occurrence of a terminating event. Reference 1: http://www.xbrl.org/2003/role/disclosureRef
-Topic 718
-SubTopic 10
-Name Accounting Standards Codification
-Section 50
-Paragraph 2
-Subparagraph (c)(2)(iii)(03)
-Publisher FASB
-URI https://asc.fasb.org/1943274/2147480429/718-10-50-2
| Name: |
us-gaap_ShareBasedCompensationArrangementByShareBasedPaymentAwardEquityInstrumentsOtherThanOptionsForfeituresWeightedAverageGrantDateFairValue |
| Namespace Prefix: |
us-gaap_ |
| Data Type: |
dtr-types:perShareItemType |
| Balance Type: |
na |
| Period Type: |
duration |
|
| X |
- DefinitionThe number of grants made during the period on other than stock (or unit) option plans (for example, phantom stock or unit plan, stock or unit appreciation rights plan, performance target plan). Reference 1: http://www.xbrl.org/2003/role/disclosureRef
-Topic 718
-SubTopic 10
-Name Accounting Standards Codification
-Section 50
-Paragraph 2
-Subparagraph (c)(2)(iii)(01)
-Publisher FASB
-URI https://asc.fasb.org/1943274/2147480429/718-10-50-2
| Name: |
us-gaap_ShareBasedCompensationArrangementByShareBasedPaymentAwardEquityInstrumentsOtherThanOptionsGrantsInPeriod |
| Namespace Prefix: |
us-gaap_ |
| Data Type: |
xbrli:sharesItemType |
| Balance Type: |
na |
| Period Type: |
duration |
|
| X |
- DefinitionThe weighted average fair value at grant date for nonvested equity-based awards issued during the period on other than stock (or unit) option plans (for example, phantom stock or unit plan, stock or unit appreciation rights plan, performance target plan). Reference 1: http://www.xbrl.org/2003/role/disclosureRef
-Topic 718
-SubTopic 10
-Name Accounting Standards Codification
-Section 50
-Paragraph 2
-Subparagraph (c)(2)(iii)(01)
-Publisher FASB
-URI https://asc.fasb.org/1943274/2147480429/718-10-50-2
| Name: |
us-gaap_ShareBasedCompensationArrangementByShareBasedPaymentAwardEquityInstrumentsOtherThanOptionsGrantsInPeriodWeightedAverageGrantDateFairValue |
| Namespace Prefix: |
us-gaap_ |
| Data Type: |
dtr-types:perShareItemType |
| Balance Type: |
na |
| Period Type: |
duration |
|
| X |
- DefinitionThe number of non-vested equity-based payment instruments, excluding stock (or unit) options, that validly exist and are outstanding as of the balance sheet date. Reference 1: http://www.xbrl.org/2003/role/disclosureRef
-Topic 718
-SubTopic 10
-Name Accounting Standards Codification
-Section 50
-Paragraph 2
-Subparagraph (c)(2)(i)
-Publisher FASB
-URI https://asc.fasb.org/1943274/2147480429/718-10-50-2
Reference 2: http://www.xbrl.org/2003/role/disclosureRef
-Topic 718
-SubTopic 10
-Name Accounting Standards Codification
-Section 50
-Paragraph 2
-Subparagraph (c)(2)(ii)
-Publisher FASB
-URI https://asc.fasb.org/1943274/2147480429/718-10-50-2
| Name: |
us-gaap_ShareBasedCompensationArrangementByShareBasedPaymentAwardEquityInstrumentsOtherThanOptionsNonvestedNumber |
| Namespace Prefix: |
us-gaap_ |
| Data Type: |
xbrli:sharesItemType |
| Balance Type: |
na |
| Period Type: |
instant |
|
| X |
- DefinitionA roll forward is a reconciliation of a concept from the beginning of a period to the end of a period.
| Name: |
us-gaap_ShareBasedCompensationArrangementByShareBasedPaymentAwardEquityInstrumentsOtherThanOptionsNonvestedRollForward |
| Namespace Prefix: |
us-gaap_ |
| Data Type: |
xbrli:stringItemType |
| Balance Type: |
na |
| Period Type: |
duration |
|
| X |
- DefinitionPer share or unit weighted-average fair value of nonvested award under share-based payment arrangement. Excludes share and unit options. Reference 1: http://www.xbrl.org/2003/role/disclosureRef
-Topic 718
-SubTopic 10
-Name Accounting Standards Codification
-Section 50
-Paragraph 2
-Subparagraph (c)(2)(i)
-Publisher FASB
-URI https://asc.fasb.org/1943274/2147480429/718-10-50-2
Reference 2: http://www.xbrl.org/2003/role/disclosureRef
-Topic 718
-SubTopic 10
-Name Accounting Standards Codification
-Section 50
-Paragraph 2
-Subparagraph (c)(2)(ii)
-Publisher FASB
-URI https://asc.fasb.org/1943274/2147480429/718-10-50-2
| Name: |
us-gaap_ShareBasedCompensationArrangementByShareBasedPaymentAwardEquityInstrumentsOtherThanOptionsNonvestedWeightedAverageGrantDateFairValue |
| Namespace Prefix: |
us-gaap_ |
| Data Type: |
dtr-types:perShareItemType |
| Balance Type: |
na |
| Period Type: |
instant |
|
| X |
- References
+ Details
| Name: |
us-gaap_ShareBasedCompensationArrangementByShareBasedPaymentAwardEquityInstrumentsOtherThanOptionsNonvestedWeightedAverageGrantDateFairValueRollForward |
| Namespace Prefix: |
us-gaap_ |
| Data Type: |
xbrli:stringItemType |
| Balance Type: |
na |
| Period Type: |
duration |
|
| X |
- DefinitionThe number of equity-based payment instruments, excluding stock (or unit) options, that vested during the reporting period. Reference 1: http://www.xbrl.org/2003/role/disclosureRef
-Topic 718
-SubTopic 10
-Name Accounting Standards Codification
-Section 50
-Paragraph 2
-Subparagraph (c)(2)(iii)(02)
-Publisher FASB
-URI https://asc.fasb.org/1943274/2147480429/718-10-50-2
| Name: |
us-gaap_ShareBasedCompensationArrangementByShareBasedPaymentAwardEquityInstrumentsOtherThanOptionsVestedInPeriod |
| Namespace Prefix: |
us-gaap_ |
| Data Type: |
xbrli:sharesItemType |
| Balance Type: |
na |
| Period Type: |
duration |
|
| X |
- DefinitionThe weighted average fair value as of grant date pertaining to an equity-based award plan other than a stock (or unit) option plan for which the grantee gained the right during the reporting period, by satisfying service and performance requirements, to receive or retain shares or units, other instruments, or cash in accordance with the terms of the arrangement. Reference 1: http://www.xbrl.org/2003/role/disclosureRef
-Topic 718
-SubTopic 10
-Name Accounting Standards Codification
-Section 50
-Paragraph 2
-Subparagraph (c)(2)(iii)(02)
-Publisher FASB
-URI https://asc.fasb.org/1943274/2147480429/718-10-50-2
| Name: |
us-gaap_ShareBasedCompensationArrangementByShareBasedPaymentAwardEquityInstrumentsOtherThanOptionsVestedInPeriodWeightedAverageGrantDateFairValue |
| Namespace Prefix: |
us-gaap_ |
| Data Type: |
dtr-types:perShareItemType |
| Balance Type: |
na |
| Period Type: |
duration |
|
| X |
- Details
| Name: |
us-gaap_AwardTypeAxis=us-gaap_RestrictedStockMember |
| Namespace Prefix: |
|
| Data Type: |
na |
| Balance Type: |
|
| Period Type: |
|
|
v3.24.2
| X |
- DefinitionAmount of expense for award under share-based payment arrangement. Excludes amount capitalized. Reference 1: http://www.xbrl.org/2003/role/disclosureRef
-Topic 718
-SubTopic 10
-Name Accounting Standards Codification
-Section S99
-Paragraph 1
-Subparagraph (SAB Topic 14.F)
-Publisher FASB
-URI https://asc.fasb.org/1943274/2147479830/718-10-S99-1
Reference 2: http://www.xbrl.org/2003/role/disclosureRef
-Topic 718
-SubTopic 10
-Name Accounting Standards Codification
-Section 50
-Paragraph 2
-Subparagraph (h)(1)(i)
-Publisher FASB
-URI https://asc.fasb.org/1943274/2147480429/718-10-50-2
| Name: |
us-gaap_AllocatedShareBasedCompensationExpense |
| Namespace Prefix: |
us-gaap_ |
| Data Type: |
xbrli:monetaryItemType |
| Balance Type: |
debit |
| Period Type: |
duration |
|
| X |
- DefinitionLine items represent financial concepts included in a table. These concepts are used to disclose reportable information associated with domain members defined in one or many axes to the table. Reference 1: http://www.xbrl.org/2003/role/disclosureRef
-Topic 718
-SubTopic 10
-Name Accounting Standards Codification
-Section 35
-Paragraph 1D
-Publisher FASB
-URI https://asc.fasb.org/1943274/2147480483/718-10-35-1D
Reference 2: http://www.xbrl.org/2003/role/disclosureRef
-Topic 718
-SubTopic 10
-Name Accounting Standards Codification
-Section 35
-Paragraph 3
-Publisher FASB
-URI https://asc.fasb.org/1943274/2147480483/718-10-35-3
Reference 3: http://www.xbrl.org/2003/role/disclosureRef
-Topic 718
-SubTopic 10
-Name Accounting Standards Codification
-Section 50
-Paragraph 2
-Subparagraph (a)(1)
-Publisher FASB
-URI https://asc.fasb.org/1943274/2147480429/718-10-50-2
Reference 4: http://www.xbrl.org/2003/role/disclosureRef
-Topic 718
-SubTopic 10
-Name Accounting Standards Codification
-Section 50
-Paragraph 2
-Subparagraph (a)(2)
-Publisher FASB
-URI https://asc.fasb.org/1943274/2147480429/718-10-50-2
Reference 5: http://www.xbrl.org/2003/role/disclosureRef
-Topic 718
-SubTopic 10
-Name Accounting Standards Codification
-Section 50
-Paragraph 2
-Subparagraph (a)(3)
-Publisher FASB
-URI https://asc.fasb.org/1943274/2147480429/718-10-50-2
Reference 6: http://www.xbrl.org/2003/role/disclosureRef
-Topic 718
-SubTopic 10
-Name Accounting Standards Codification
-Section 50
-Paragraph 2
-Subparagraph (c)(1)(i)
-Publisher FASB
-URI https://asc.fasb.org/1943274/2147480429/718-10-50-2
Reference 7: http://www.xbrl.org/2003/role/disclosureRef
-Topic 718
-SubTopic 10
-Name Accounting Standards Codification
-Section 50
-Paragraph 2
-Subparagraph (c)(1)(ii)
-Publisher FASB
-URI https://asc.fasb.org/1943274/2147480429/718-10-50-2
Reference 8: http://www.xbrl.org/2003/role/disclosureRef
-Topic 718
-SubTopic 10
-Name Accounting Standards Codification
-Section 50
-Paragraph 2
-Subparagraph (c)(1)(iii)
-Publisher FASB
-URI https://asc.fasb.org/1943274/2147480429/718-10-50-2
Reference 9: http://www.xbrl.org/2003/role/disclosureRef
-Topic 718
-SubTopic 10
-Name Accounting Standards Codification
-Section 50
-Paragraph 2
-Subparagraph (c)(1)(iv)
-Publisher FASB
-URI https://asc.fasb.org/1943274/2147480429/718-10-50-2
Reference 10: http://www.xbrl.org/2003/role/disclosureRef
-Topic 718
-SubTopic 10
-Name Accounting Standards Codification
-Section 50
-Paragraph 2
-Subparagraph (c)(1)(iv)(01)
-Publisher FASB
-URI https://asc.fasb.org/1943274/2147480429/718-10-50-2
Reference 11: http://www.xbrl.org/2003/role/disclosureRef
-Topic 718
-SubTopic 10
-Name Accounting Standards Codification
-Section 50
-Paragraph 2
-Subparagraph (c)(1)(iv)(02)
-Publisher FASB
-URI https://asc.fasb.org/1943274/2147480429/718-10-50-2
Reference 12: http://www.xbrl.org/2003/role/disclosureRef
-Topic 718
-SubTopic 10
-Name Accounting Standards Codification
-Section 50
-Paragraph 2
-Subparagraph (c)(1)(iv)(03)
-Publisher FASB
-URI https://asc.fasb.org/1943274/2147480429/718-10-50-2
Reference 13: http://www.xbrl.org/2003/role/disclosureRef
-Topic 718
-SubTopic 10
-Name Accounting Standards Codification
-Section 50
-Paragraph 2
-Subparagraph (c)(1)(iv)(04)
-Publisher FASB
-URI https://asc.fasb.org/1943274/2147480429/718-10-50-2
Reference 14: http://www.xbrl.org/2003/role/disclosureRef
-Topic 718
-SubTopic 10
-Name Accounting Standards Codification
-Section 50
-Paragraph 2
-Subparagraph (c)(2)(i)
-Publisher FASB
-URI https://asc.fasb.org/1943274/2147480429/718-10-50-2
Reference 15: http://www.xbrl.org/2003/role/disclosureRef
-Topic 718
-SubTopic 10
-Name Accounting Standards Codification
-Section 50
-Paragraph 2
-Subparagraph (c)(2)(ii)
-Publisher FASB
-URI https://asc.fasb.org/1943274/2147480429/718-10-50-2
Reference 16: http://www.xbrl.org/2003/role/disclosureRef
-Topic 718
-SubTopic 10
-Name Accounting Standards Codification
-Section 50
-Paragraph 2
-Subparagraph (c)(2)(iii)
-Publisher FASB
-URI https://asc.fasb.org/1943274/2147480429/718-10-50-2
Reference 17: http://www.xbrl.org/2003/role/disclosureRef
-Topic 718
-SubTopic 10
-Name Accounting Standards Codification
-Section 50
-Paragraph 2
-Subparagraph (c)(2)(iii)(01)
-Publisher FASB
-URI https://asc.fasb.org/1943274/2147480429/718-10-50-2
Reference 18: http://www.xbrl.org/2003/role/disclosureRef
-Topic 718
-SubTopic 10
-Name Accounting Standards Codification
-Section 50
-Paragraph 2
-Subparagraph (c)(2)(iii)(02)
-Publisher FASB
-URI https://asc.fasb.org/1943274/2147480429/718-10-50-2
Reference 19: http://www.xbrl.org/2003/role/disclosureRef
-Topic 718
-SubTopic 10
-Name Accounting Standards Codification
-Section 50
-Paragraph 2
-Subparagraph (c)(2)(iii)(03)
-Publisher FASB
-URI https://asc.fasb.org/1943274/2147480429/718-10-50-2
Reference 20: http://www.xbrl.org/2003/role/disclosureRef
-Topic 718
-SubTopic 10
-Name Accounting Standards Codification
-Section 50
-Paragraph 2
-Subparagraph (d)(1)
-Publisher FASB
-URI https://asc.fasb.org/1943274/2147480429/718-10-50-2
Reference 21: http://www.xbrl.org/2003/role/disclosureRef
-Topic 718
-SubTopic 10
-Name Accounting Standards Codification
-Section 50
-Paragraph 2
-Subparagraph (d)(2)
-Publisher FASB
-URI https://asc.fasb.org/1943274/2147480429/718-10-50-2
Reference 22: http://www.xbrl.org/2003/role/disclosureRef
-Topic 718
-SubTopic 10
-Name Accounting Standards Codification
-Section 50
-Paragraph 2
-Subparagraph (e)(1)
-Publisher FASB
-URI https://asc.fasb.org/1943274/2147480429/718-10-50-2
Reference 23: http://www.xbrl.org/2003/role/disclosureRef
-Topic 718
-SubTopic 10
-Name Accounting Standards Codification
-Section 50
-Paragraph 2
-Subparagraph (e)(2)
-Publisher FASB
-URI https://asc.fasb.org/1943274/2147480429/718-10-50-2
Reference 24: http://www.xbrl.org/2003/role/disclosureRef
-Topic 718
-SubTopic 10
-Name Accounting Standards Codification
-Section 50
-Paragraph 2
-Subparagraph (f)(2)(i)
-Publisher FASB
-URI https://asc.fasb.org/1943274/2147480429/718-10-50-2
Reference 25: http://www.xbrl.org/2003/role/disclosureRef
-Topic 718
-SubTopic 10
-Name Accounting Standards Codification
-Section 50
-Paragraph 2
-Subparagraph (f)(2)(ii)
-Publisher FASB
-URI https://asc.fasb.org/1943274/2147480429/718-10-50-2
Reference 26: http://www.xbrl.org/2003/role/disclosureRef
-Topic 718
-SubTopic 10
-Name Accounting Standards Codification
-Section 50
-Paragraph 2
-Subparagraph (f)(2)(iii)
-Publisher FASB
-URI https://asc.fasb.org/1943274/2147480429/718-10-50-2
Reference 27: http://www.xbrl.org/2003/role/disclosureRef
-Topic 718
-SubTopic 10
-Name Accounting Standards Codification
-Section 50
-Paragraph 2
-Subparagraph (f)(2)(iv)
-Publisher FASB
-URI https://asc.fasb.org/1943274/2147480429/718-10-50-2
Reference 28: http://www.xbrl.org/2003/role/disclosureRef
-Topic 718
-SubTopic 10
-Name Accounting Standards Codification
-Section 50
-Paragraph 2
-Subparagraph (f)(2)(v)
-Publisher FASB
-URI https://asc.fasb.org/1943274/2147480429/718-10-50-2
| Name: |
us-gaap_ShareBasedCompensationArrangementByShareBasedPaymentAwardLineItems |
| Namespace Prefix: |
us-gaap_ |
| Data Type: |
xbrli:stringItemType |
| Balance Type: |
na |
| Period Type: |
duration |
|
| X |
- DefinitionFair value of options vested. Excludes equity instruments other than options, for example, but not limited to, share units, stock appreciation rights, restricted stock. Reference 1: http://www.xbrl.org/2003/role/disclosureRef
-Topic 718
-SubTopic 10
-Name Accounting Standards Codification
-Section 50
-Paragraph 2
-Subparagraph (d)(2)
-Publisher FASB
-URI https://asc.fasb.org/1943274/2147480429/718-10-50-2
| Name: |
us-gaap_SharebasedCompensationArrangementBySharebasedPaymentAwardOptionsVestedInPeriodFairValue1 |
| Namespace Prefix: |
us-gaap_ |
| Data Type: |
xbrli:monetaryItemType |
| Balance Type: |
credit |
| Period Type: |
duration |
|
| X |
- Details
| Name: |
us-gaap_AwardTypeAxis=us-gaap_RestrictedStockMember |
| Namespace Prefix: |
|
| Data Type: |
na |
| Balance Type: |
|
| Period Type: |
|
|
v3.24.2
| X |
- DefinitionAmount of gain (loss) recognized in net periodic benefit (cost) credit of defined benefit plan. Reference 1: http://www.xbrl.org/2003/role/exampleRef
-Topic 715
-SubTopic 20
-Name Accounting Standards Codification
-Section 55
-Paragraph 17
-Publisher FASB
-URI https://asc.fasb.org/1943274/2147480482/715-20-55-17
Reference 2: http://www.xbrl.org/2003/role/disclosureRef
-Topic 715
-SubTopic 20
-Name Accounting Standards Codification
-Section 45
-Paragraph 3A
-Subparagraph (b)
-Publisher FASB
-URI https://asc.fasb.org/1943274/2147480535/715-20-45-3A
Reference 3: http://www.xbrl.org/2003/role/exampleRef
-Topic 715
-SubTopic 20
-Name Accounting Standards Codification
-Section 55
-Paragraph 18
-Publisher FASB
-URI https://asc.fasb.org/1943274/2147480482/715-20-55-18
Reference 4: http://www.xbrl.org/2003/role/disclosureRef
-Topic 715
-SubTopic 20
-Name Accounting Standards Codification
-Section 50
-Paragraph 1
-Subparagraph (h)(4)
-Publisher FASB
-URI https://asc.fasb.org/1943274/2147480506/715-20-50-1
Reference 5: http://www.xbrl.org/2003/role/disclosureRef
-Topic 715
-SubTopic 20
-Name Accounting Standards Codification
-Section 50
-Paragraph 6
-Subparagraph (a)(4)
-Publisher FASB
-URI https://asc.fasb.org/1943274/2147480506/715-20-50-6
| Name: |
us-gaap_DefinedBenefitPlanAmortizationOfGainsLosses |
| Namespace Prefix: |
us-gaap_ |
| Data Type: |
xbrli:monetaryItemType |
| Balance Type: |
credit |
| Period Type: |
duration |
|
| X |
- DefinitionAmount of expected return (loss) recognized in net periodic benefit (cost) credit, calculated based on expected long-term rate of return and market-related value of plan assets of defined benefit plan. Reference 1: http://www.xbrl.org/2003/role/exampleRef
-Topic 715
-SubTopic 20
-Name Accounting Standards Codification
-Section 55
-Paragraph 17
-Publisher FASB
-URI https://asc.fasb.org/1943274/2147480482/715-20-55-17
Reference 2: http://www.xbrl.org/2003/role/disclosureRef
-Topic 715
-SubTopic 20
-Name Accounting Standards Codification
-Section 45
-Paragraph 3A
-Subparagraph (b)
-Publisher FASB
-URI https://asc.fasb.org/1943274/2147480535/715-20-45-3A
Reference 3: http://www.xbrl.org/2003/role/exampleRef
-Topic 715
-SubTopic 20
-Name Accounting Standards Codification
-Section 55
-Paragraph 18
-Publisher FASB
-URI https://asc.fasb.org/1943274/2147480482/715-20-55-18
Reference 4: http://www.xbrl.org/2003/role/disclosureRef
-Topic 715
-SubTopic 20
-Name Accounting Standards Codification
-Section 50
-Paragraph 1
-Subparagraph (h)(3)
-Publisher FASB
-URI https://asc.fasb.org/1943274/2147480506/715-20-50-1
Reference 5: http://www.xbrl.org/2003/role/disclosureRef
-Topic 715
-SubTopic 20
-Name Accounting Standards Codification
-Section 50
-Paragraph 6
-Subparagraph (a)(3)
-Publisher FASB
-URI https://asc.fasb.org/1943274/2147480506/715-20-50-6
| Name: |
us-gaap_DefinedBenefitPlanExpectedReturnOnPlanAssets |
| Namespace Prefix: |
us-gaap_ |
| Data Type: |
xbrli:monetaryItemType |
| Balance Type: |
credit |
| Period Type: |
duration |
|
| X |
- DefinitionAmount of cost recognized for passage of time related to defined benefit plan. Reference 1: http://www.xbrl.org/2003/role/exampleRef
-Topic 715
-SubTopic 20
-Name Accounting Standards Codification
-Section 55
-Paragraph 17
-Publisher FASB
-URI https://asc.fasb.org/1943274/2147480482/715-20-55-17
Reference 2: http://www.xbrl.org/2003/role/disclosureRef
-Topic 715
-SubTopic 20
-Name Accounting Standards Codification
-Section 45
-Paragraph 3A
-Subparagraph (b)
-Publisher FASB
-URI https://asc.fasb.org/1943274/2147480535/715-20-45-3A
Reference 3: http://www.xbrl.org/2003/role/exampleRef
-Topic 715
-SubTopic 20
-Name Accounting Standards Codification
-Section 55
-Paragraph 18
-Publisher FASB
-URI https://asc.fasb.org/1943274/2147480482/715-20-55-18
Reference 4: http://www.xbrl.org/2003/role/disclosureRef
-Topic 715
-SubTopic 20
-Name Accounting Standards Codification
-Section 50
-Paragraph 1
-Subparagraph (a)(2)
-Publisher FASB
-URI https://asc.fasb.org/1943274/2147480506/715-20-50-1
Reference 5: http://www.xbrl.org/2003/role/disclosureRef
-Topic 715
-SubTopic 20
-Name Accounting Standards Codification
-Section 50
-Paragraph 1
-Subparagraph (h)(2)
-Publisher FASB
-URI https://asc.fasb.org/1943274/2147480506/715-20-50-1
Reference 6: http://www.xbrl.org/2003/role/disclosureRef
-Topic 715
-SubTopic 20
-Name Accounting Standards Codification
-Section 50
-Paragraph 6
-Subparagraph (a)(2)
-Publisher FASB
-URI https://asc.fasb.org/1943274/2147480506/715-20-50-6
| Name: |
us-gaap_DefinedBenefitPlanInterestCost |
| Namespace Prefix: |
us-gaap_ |
| Data Type: |
xbrli:monetaryItemType |
| Balance Type: |
debit |
| Period Type: |
duration |
|
| X |
- DefinitionAmount of net periodic benefit cost (credit) for defined benefit plan. Reference 1: http://www.xbrl.org/2003/role/exampleRef
-Topic 715
-SubTopic 20
-Name Accounting Standards Codification
-Section 55
-Paragraph 17
-Publisher FASB
-URI https://asc.fasb.org/1943274/2147480482/715-20-55-17
Reference 2: http://www.xbrl.org/2003/role/exampleRef
-Topic 715
-SubTopic 20
-Name Accounting Standards Codification
-Section 55
-Paragraph 18
-Publisher FASB
-URI https://asc.fasb.org/1943274/2147480482/715-20-55-18
Reference 3: http://www.xbrl.org/2003/role/disclosureRef
-Topic 715
-SubTopic 20
-Name Accounting Standards Codification
-Section 50
-Paragraph 1
-Subparagraph (h)
-Publisher FASB
-URI https://asc.fasb.org/1943274/2147480506/715-20-50-1
Reference 4: http://www.xbrl.org/2003/role/disclosureRef
-Topic 715
-SubTopic 20
-Name Accounting Standards Codification
-Section 50
-Paragraph 6
-Subparagraph (a)
-Publisher FASB
-URI https://asc.fasb.org/1943274/2147480506/715-20-50-6
| Name: |
us-gaap_DefinedBenefitPlanNetPeriodicBenefitCost |
| Namespace Prefix: |
us-gaap_ |
| Data Type: |
xbrli:monetaryItemType |
| Balance Type: |
debit |
| Period Type: |
duration |
|
| X |
- References
+ Details
| Name: |
us-gaap_DefinedBenefitPlanNetPeriodicBenefitCostAbstract |
| Namespace Prefix: |
us-gaap_ |
| Data Type: |
xbrli:stringItemType |
| Balance Type: |
na |
| Period Type: |
duration |
|
v3.24.2
Income Taxes (Details) - USD ($)
|
3 Months Ended |
6 Months Ended |
Jun. 30, 2024 |
Jun. 30, 2023 |
Jun. 30, 2024 |
Jun. 30, 2023 |
| Income Tax Disclosure [Abstract] |
|
|
|
|
| Provision for income tax |
$ 5,865,000
|
$ 5,000
|
$ 6,819,000
|
$ 13,000
|
| Pre-tax income (loss) |
$ 44,092,000
|
50,560,000
|
$ 51,129,000
|
40,834,000
|
| Income tax expense (benefit), other than provision |
|
$ 0
|
|
$ 0
|
v3.24.2
| X |
- DefinitionNotes Payable, Carrying Value
| Name: |
fph_NotesPayableCarryingValue |
| Namespace Prefix: |
fph_ |
| Data Type: |
xbrli:monetaryItemType |
| Balance Type: |
credit |
| Period Type: |
instant |
|
| X |
- DefinitionLine items represent financial concepts included in a table. These concepts are used to disclose reportable information associated with domain members defined in one or many axes to the table.
| Name: |
us-gaap_FairValueBalanceSheetGroupingFinancialStatementCaptionsLineItems |
| Namespace Prefix: |
us-gaap_ |
| Data Type: |
xbrli:stringItemType |
| Balance Type: |
na |
| Period Type: |
duration |
|
| X |
- DefinitionFair value portion of notes payable. Reference 1: http://fasb.org/us-gaap/role/ref/legacyRef
-Name Accounting Standards Codification
-Section S99
-Paragraph 1
-Subparagraph (SX 210.5-02(22))
-SubTopic 10
-Topic 210
-Publisher FASB
-URI https://asc.fasb.org/1943274/2147480566/210-10-S99-1
Reference 2: http://fasb.org/us-gaap/role/ref/legacyRef
-Topic 210
-SubTopic 10
-Name Accounting Standards Codification
-Section S99
-Paragraph 1
-Subparagraph (SX 210.5-02(20))
-Publisher FASB
-URI https://asc.fasb.org/1943274/2147480566/210-10-S99-1
Reference 3: http://www.xbrl.org/2009/role/commonPracticeRef
-Topic 820
-SubTopic 10
-Name Accounting Standards Codification
-Section 50
-Paragraph 2E
-Publisher FASB
-URI https://asc.fasb.org/1943274/2147482106/820-10-50-2E
Reference 4: http://www.xbrl.org/2009/role/commonPracticeRef
-Topic 820
-SubTopic 10
-Name Accounting Standards Codification
-Section 50
-Paragraph 2
-Subparagraph (b)
-Publisher FASB
-URI https://asc.fasb.org/1943274/2147482106/820-10-50-2
Reference 5: http://fasb.org/us-gaap/role/ref/legacyRef
-Topic 210
-SubTopic 10
-Name Accounting Standards Codification
-Section S99
-Paragraph 1
-Subparagraph (SX 210.5-02(19))
-Publisher FASB
-URI https://asc.fasb.org/1943274/2147480566/210-10-S99-1
| Name: |
us-gaap_NotesPayableFairValueDisclosure |
| Namespace Prefix: |
us-gaap_ |
| Data Type: |
xbrli:monetaryItemType |
| Balance Type: |
credit |
| Period Type: |
instant |
|
| X |
- Details
| Name: |
us-gaap_FairValueByMeasurementBasisAxis=us-gaap_CarryingReportedAmountFairValueDisclosureMember |
| Namespace Prefix: |
|
| Data Type: |
na |
| Balance Type: |
|
| Period Type: |
|
|
| X |
- Details
| Name: |
us-gaap_FairValueByMeasurementBasisAxis=us-gaap_EstimateOfFairValueFairValueDisclosureMember |
| Namespace Prefix: |
|
| Data Type: |
na |
| Balance Type: |
|
| Period Type: |
|
|
v3.24.2
| X |
- DefinitionLine items represent financial concepts included in a table. These concepts are used to disclose reportable information associated with domain members defined in one or many axes to the table.
| Name: |
us-gaap_AntidilutiveSecuritiesExcludedFromComputationOfEarningsPerShareLineItems |
| Namespace Prefix: |
us-gaap_ |
| Data Type: |
xbrli:stringItemType |
| Balance Type: |
na |
| Period Type: |
duration |
|
| X |
- Details
| Name: |
us-gaap_StatementClassOfStockAxis=us-gaap_CommonClassBMember |
| Namespace Prefix: |
|
| Data Type: |
na |
| Balance Type: |
|
| Period Type: |
|
|
v3.24.2
Earnings Per Share - Basic and Diluted Earnings Per Share (Details) - USD ($)
$ / shares in Units, $ in Thousands |
3 Months Ended |
6 Months Ended |
Jun. 30, 2024 |
Jun. 30, 2023 |
Jun. 30, 2024 |
Jun. 30, 2023 |
| Numerator: |
|
|
|
|
| Net income attributable to the Company |
$ 14,722
|
$ 23,571
|
$ 17,048
|
$ 19,035
|
| Adjustments to net income attributable to the Company |
0
|
0
|
(9)
|
(13)
|
| Net income attributable to common shareholders |
14,722
|
23,571
|
17,039
|
19,022
|
| Numerator—basic common shares: |
|
|
|
|
| Less: net income allocated to participating securities |
25
|
132
|
26
|
100
|
| Allocation of basic net income among common shareholders |
14,697
|
23,439
|
17,013
|
18,922
|
| Numerator—diluted common shares: |
|
|
|
|
| Reallocation of income from dilutive potential securities |
15,992
|
25,878
|
18,512
|
20,917
|
| Less: net income allocated to participating securities |
25
|
132
|
26
|
100
|
| Numerator for diluted net income available to Class A/B common shareholders |
$ 30,689
|
$ 49,317
|
$ 35,525
|
$ 39,839
|
| Restricted Stock Units (RSUs) |
|
|
|
|
| Diluted earnings per share: |
|
|
|
|
| Anti-dilutive potential securities (in shares) |
0
|
0
|
0
|
0
|
| Performance Restricted Stock Units (RSUs) |
|
|
|
|
| Diluted earnings per share: |
|
|
|
|
| Anti-dilutive potential securities (in shares) |
4,509,646
|
3,123,408
|
4,509,646
|
3,123,408
|
| Restricted Shares |
|
|
|
|
| Diluted earnings per share: |
|
|
|
|
| Anti-dilutive potential securities (in shares) |
0
|
0
|
0
|
0
|
| Common Class A |
|
|
|
|
| Diluted earnings per share: |
|
|
|
|
| Anti-dilutive potential securities (in shares) |
3,137,134
|
3,137,134
|
3,137,134
|
3,137,134
|
| Common Class A |
|
|
|
|
| Numerator: |
|
|
|
|
| Net income attributable to common shareholders |
$ 14,692
|
$ 23,431
|
$ 17,007
|
$ 18,915
|
| Numerator—diluted common shares: |
|
|
|
|
| Numerator for diluted net income available to Class A/B common shareholders |
$ 30,684
|
$ 49,309
|
$ 35,519
|
$ 39,832
|
| Denominator: |
|
|
|
|
| Basic weighted average Class A/B common shares outstanding (in shares) |
69,239,296
|
68,811,975
|
69,148,940
|
68,758,894
|
| Diluted weighted average Class A/B common shares outstanding (in shares) |
145,936,206
|
145,040,689
|
145,906,521
|
144,939,450
|
| Basic earnings per share: |
|
|
|
|
| Class A/B common shares (in dollars per share) |
$ 0.21
|
$ 0.34
|
$ 0.25
|
$ 0.28
|
| Diluted earnings per share: |
|
|
|
|
| Class A/B common shares (in dollars per share) |
$ 0.21
|
$ 0.34
|
$ 0.24
|
$ 0.27
|
| Common Class B |
|
|
|
|
| Numerator: |
|
|
|
|
| Net income attributable to common shareholders |
$ 5
|
$ 8
|
$ 6
|
$ 7
|
| Numerator—diluted common shares: |
|
|
|
|
| Numerator for diluted net income available to Class A/B common shareholders |
$ 5
|
$ 8
|
$ 6
|
$ 7
|
| Denominator: |
|
|
|
|
| Basic weighted average Class A/B common shares outstanding (in shares) |
79,233,544
|
79,233,544
|
79,233,544
|
79,233,544
|
| Diluted weighted average Class A/B common shares outstanding (in shares) |
79,233,544
|
79,233,544
|
79,233,544
|
79,233,544
|
| Basic earnings per share: |
|
|
|
|
| Class A/B common shares (in dollars per share) |
$ 0.00
|
$ 0.00
|
$ 0.00
|
$ 0.00
|
| Diluted earnings per share: |
|
|
|
|
| Class A/B common shares (in dollars per share) |
$ 0.00
|
$ 0.00
|
$ 0.00
|
$ 0.00
|
| X |
- DefinitionAdjustments to Net Income (Loss) Attributable to Parent
| Name: |
fph_AdjustmentstoNetIncomeLossAttributabletoParent |
| Namespace Prefix: |
fph_ |
| Data Type: |
xbrli:monetaryItemType |
| Balance Type: |
debit |
| Period Type: |
duration |
|
| X |
- DefinitionAllocation of Net Income (Loss) to Common Stockholders, Basic
| Name: |
fph_AllocationOfNetIncomeLossToCommonStockholdersBasic |
| Namespace Prefix: |
fph_ |
| Data Type: |
xbrli:monetaryItemType |
| Balance Type: |
credit |
| Period Type: |
duration |
|
| X |
- DefinitionNumerator - Basic Common Shares
| Name: |
fph_NumeratorBasicCommonSharesAbstract |
| Namespace Prefix: |
fph_ |
| Data Type: |
xbrli:stringItemType |
| Balance Type: |
na |
| Period Type: |
duration |
|
| X |
- DefinitionNumerator - Diluted Common Shares
| Name: |
fph_NumeratorDilutedCommonSharesAbstract |
| Namespace Prefix: |
fph_ |
| Data Type: |
xbrli:stringItemType |
| Balance Type: |
na |
| Period Type: |
duration |
|
| X |
- DefinitionReallocation of Income (Loss) to Parent Upon Assumed Exchange of Common Units, Diluted
| Name: |
fph_ReallocationofIncomeLosstoParentUponAssumedExchangeofCommonUnitsDiluted |
| Namespace Prefix: |
fph_ |
| Data Type: |
xbrli:monetaryItemType |
| Balance Type: |
debit |
| Period Type: |
duration |
|
| X |
- DefinitionSecurities (including those issuable pursuant to contingent stock agreements) that could potentially dilute basic earnings per share (EPS) or earnings per unit (EPU) in the future that were not included in the computation of diluted EPS or EPU because to do so would increase EPS or EPU amounts or decrease loss per share or unit amounts for the period presented. Reference 1: http://www.xbrl.org/2003/role/disclosureRef
-Topic 260
-SubTopic 10
-Name Accounting Standards Codification
-Section 50
-Paragraph 1
-Subparagraph (c)
-Publisher FASB
-URI https://asc.fasb.org/1943274/2147482662/260-10-50-1
| Name: |
us-gaap_AntidilutiveSecuritiesExcludedFromComputationOfEarningsPerShareAmount |
| Namespace Prefix: |
us-gaap_ |
| Data Type: |
xbrli:sharesItemType |
| Balance Type: |
na |
| Period Type: |
duration |
|
| X |
- DefinitionThe amount of net income (loss) for the period per each share of common stock or unit outstanding during the reporting period. Reference 1: http://www.xbrl.org/2003/role/disclosureRef
-Topic 250
-SubTopic 10
-Name Accounting Standards Codification
-Section 50
-Paragraph 6
-Publisher FASB
-URI https://asc.fasb.org/1943274/2147483443/250-10-50-6
Reference 2: http://www.xbrl.org/2003/role/exampleRef
-Topic 260
-SubTopic 10
-Name Accounting Standards Codification
-Section 55
-Paragraph 52
-Publisher FASB
-URI https://asc.fasb.org/1943274/2147482635/260-10-55-52
Reference 3: http://www.xbrl.org/2003/role/disclosureRef
-Topic 805
-SubTopic 60
-Name Accounting Standards Codification
-Section 65
-Paragraph 1
-Subparagraph (g)
-Publisher FASB
-URI https://asc.fasb.org/1943274/2147476176/805-60-65-1
Reference 4: http://www.xbrl.org/2003/role/disclosureRef
-Topic 740
-SubTopic 323
-Name Accounting Standards Codification
-Section 65
-Paragraph 2
-Subparagraph (g)(3)
-Publisher FASB
-URI https://asc.fasb.org/1943274/2147478666/740-323-65-2
Reference 5: http://www.xbrl.org/2003/role/disclosureRef
-Topic 250
-SubTopic 10
-Name Accounting Standards Codification
-Section 50
-Paragraph 3
-Publisher FASB
-URI https://asc.fasb.org/1943274/2147483443/250-10-50-3
Reference 6: http://www.xbrl.org/2003/role/disclosureRef
-Topic 260
-SubTopic 10
-Name Accounting Standards Codification
-Section 55
-Paragraph 15
-Publisher FASB
-URI https://asc.fasb.org/1943274/2147482635/260-10-55-15
Reference 7: http://www.xbrl.org/2003/role/disclosureRef
-Topic 815
-SubTopic 40
-Name Accounting Standards Codification
-Section 65
-Paragraph 1
-Subparagraph (e)(4)
-Publisher FASB
-URI https://asc.fasb.org/1943274/2147480175/815-40-65-1
Reference 8: http://www.xbrl.org/2003/role/disclosureRef
-Topic 815
-SubTopic 40
-Name Accounting Standards Codification
-Section 65
-Paragraph 1
-Subparagraph (f)
-Publisher FASB
-URI https://asc.fasb.org/1943274/2147480175/815-40-65-1
Reference 9: http://www.xbrl.org/2003/role/disclosureRef
-Topic 250
-SubTopic 10
-Name Accounting Standards Codification
-Section 50
-Paragraph 11
-Subparagraph (a)
-Publisher FASB
-URI https://asc.fasb.org/1943274/2147483443/250-10-50-11
Reference 10: http://www.xbrl.org/2003/role/disclosureRef
-Topic 250
-SubTopic 10
-Name Accounting Standards Codification
-Section 50
-Paragraph 11
-Subparagraph (b)
-Publisher FASB
-URI https://asc.fasb.org/1943274/2147483443/250-10-50-11
Reference 11: http://www.xbrl.org/2003/role/disclosureRef
-Topic 250
-SubTopic 10
-Name Accounting Standards Codification
-Section 50
-Paragraph 7
-Subparagraph (a)
-Publisher FASB
-URI https://asc.fasb.org/1943274/2147483443/250-10-50-7
Reference 12: http://www.xbrl.org/2003/role/disclosureRef
-Topic 260
-SubTopic 10
-Name Accounting Standards Codification
-Section 45
-Paragraph 2
-Publisher FASB
-URI https://asc.fasb.org/1943274/2147482689/260-10-45-2
Reference 13: http://www.xbrl.org/2003/role/disclosureRef
-Topic 260
-SubTopic 10
-Name Accounting Standards Codification
-Section 45
-Paragraph 60B
-Subparagraph (d)
-Publisher FASB
-URI https://asc.fasb.org/1943274/2147482689/260-10-45-60B
Reference 14: http://www.xbrl.org/2003/role/disclosureRef
-Topic 250
-SubTopic 10
-Name Accounting Standards Codification
-Section 50
-Paragraph 4
-Publisher FASB
-URI https://asc.fasb.org/1943274/2147483443/250-10-50-4
Reference 15: http://www.xbrl.org/2003/role/disclosureRef
-Topic 260
-SubTopic 10
-Name Accounting Standards Codification
-Section 50
-Paragraph 1
-Subparagraph (a)
-Publisher FASB
-URI https://asc.fasb.org/1943274/2147482662/260-10-50-1
Reference 16: http://www.xbrl.org/2003/role/disclosureRef
-Topic 260
-SubTopic 10
-Name Accounting Standards Codification
-Section 45
-Paragraph 10
-Publisher FASB
-URI https://asc.fasb.org/1943274/2147482689/260-10-45-10
Reference 17: http://www.xbrl.org/2003/role/disclosureRef
-Topic 220
-SubTopic 10
-Name Accounting Standards Codification
-Section S99
-Paragraph 2
-Subparagraph (SX 210.5-03(25))
-Publisher FASB
-URI https://asc.fasb.org/1943274/2147483621/220-10-S99-2
Reference 18: http://www.xbrl.org/2003/role/disclosureRef
-Topic 942
-SubTopic 220
-Name Accounting Standards Codification
-Section S99
-Paragraph 1
-Subparagraph (SX 210.9-04(27))
-Publisher FASB
-URI https://asc.fasb.org/1943274/2147478524/942-220-S99-1
Reference 19: http://www.xbrl.org/2003/role/disclosureRef
-Topic 944
-SubTopic 220
-Name Accounting Standards Codification
-Section S99
-Paragraph 1
-Subparagraph (SX 210.7-04(23))
-Publisher FASB
-URI https://asc.fasb.org/1943274/2147477250/944-220-S99-1
Reference 20: http://www.xbrl.org/2003/role/disclosureRef
-Topic 260
-SubTopic 10
-Name Accounting Standards Codification
-Section 45
-Paragraph 7
-Publisher FASB
-URI https://asc.fasb.org/1943274/2147482689/260-10-45-7
| Name: |
us-gaap_EarningsPerShareBasic |
| Namespace Prefix: |
us-gaap_ |
| Data Type: |
dtr-types:perShareItemType |
| Balance Type: |
na |
| Period Type: |
duration |
|
| X |
- References
+ Details
| Name: |
us-gaap_EarningsPerShareBasicAbstract |
| Namespace Prefix: |
us-gaap_ |
| Data Type: |
xbrli:stringItemType |
| Balance Type: |
na |
| Period Type: |
duration |
|
| X |
- DefinitionThe amount of net income (loss) for the period available to each share of common stock or common unit outstanding during the reporting period and to each share or unit that would have been outstanding assuming the issuance of common shares or units for all dilutive potential common shares or units outstanding during the reporting period. Reference 1: http://www.xbrl.org/2003/role/disclosureRef
-Topic 250
-SubTopic 10
-Name Accounting Standards Codification
-Section 50
-Paragraph 6
-Publisher FASB
-URI https://asc.fasb.org/1943274/2147483443/250-10-50-6
Reference 2: http://www.xbrl.org/2003/role/exampleRef
-Topic 260
-SubTopic 10
-Name Accounting Standards Codification
-Section 55
-Paragraph 52
-Publisher FASB
-URI https://asc.fasb.org/1943274/2147482635/260-10-55-52
Reference 3: http://www.xbrl.org/2003/role/disclosureRef
-Topic 805
-SubTopic 60
-Name Accounting Standards Codification
-Section 65
-Paragraph 1
-Subparagraph (g)
-Publisher FASB
-URI https://asc.fasb.org/1943274/2147476176/805-60-65-1
Reference 4: http://www.xbrl.org/2003/role/disclosureRef
-Topic 740
-SubTopic 323
-Name Accounting Standards Codification
-Section 65
-Paragraph 2
-Subparagraph (g)(3)
-Publisher FASB
-URI https://asc.fasb.org/1943274/2147478666/740-323-65-2
Reference 5: http://www.xbrl.org/2003/role/disclosureRef
-Topic 250
-SubTopic 10
-Name Accounting Standards Codification
-Section 50
-Paragraph 3
-Publisher FASB
-URI https://asc.fasb.org/1943274/2147483443/250-10-50-3
Reference 6: http://www.xbrl.org/2003/role/disclosureRef
-Topic 260
-SubTopic 10
-Name Accounting Standards Codification
-Section 55
-Paragraph 15
-Publisher FASB
-URI https://asc.fasb.org/1943274/2147482635/260-10-55-15
Reference 7: http://www.xbrl.org/2003/role/disclosureRef
-Topic 815
-SubTopic 40
-Name Accounting Standards Codification
-Section 65
-Paragraph 1
-Subparagraph (e)(4)
-Publisher FASB
-URI https://asc.fasb.org/1943274/2147480175/815-40-65-1
Reference 8: http://www.xbrl.org/2003/role/disclosureRef
-Topic 815
-SubTopic 40
-Name Accounting Standards Codification
-Section 65
-Paragraph 1
-Subparagraph (f)
-Publisher FASB
-URI https://asc.fasb.org/1943274/2147480175/815-40-65-1
Reference 9: http://www.xbrl.org/2003/role/disclosureRef
-Topic 250
-SubTopic 10
-Name Accounting Standards Codification
-Section 50
-Paragraph 11
-Subparagraph (a)
-Publisher FASB
-URI https://asc.fasb.org/1943274/2147483443/250-10-50-11
Reference 10: http://www.xbrl.org/2003/role/disclosureRef
-Topic 250
-SubTopic 10
-Name Accounting Standards Codification
-Section 50
-Paragraph 11
-Subparagraph (b)
-Publisher FASB
-URI https://asc.fasb.org/1943274/2147483443/250-10-50-11
Reference 11: http://www.xbrl.org/2003/role/disclosureRef
-Topic 250
-SubTopic 10
-Name Accounting Standards Codification
-Section 50
-Paragraph 7
-Subparagraph (a)
-Publisher FASB
-URI https://asc.fasb.org/1943274/2147483443/250-10-50-7
Reference 12: http://www.xbrl.org/2003/role/disclosureRef
-Topic 260
-SubTopic 10
-Name Accounting Standards Codification
-Section 45
-Paragraph 2
-Publisher FASB
-URI https://asc.fasb.org/1943274/2147482689/260-10-45-2
Reference 13: http://www.xbrl.org/2003/role/disclosureRef
-Topic 260
-SubTopic 10
-Name Accounting Standards Codification
-Section 45
-Paragraph 60B
-Subparagraph (d)
-Publisher FASB
-URI https://asc.fasb.org/1943274/2147482689/260-10-45-60B
Reference 14: http://www.xbrl.org/2003/role/disclosureRef
-Topic 250
-SubTopic 10
-Name Accounting Standards Codification
-Section 50
-Paragraph 4
-Publisher FASB
-URI https://asc.fasb.org/1943274/2147483443/250-10-50-4
Reference 15: http://www.xbrl.org/2003/role/disclosureRef
-Topic 260
-SubTopic 10
-Name Accounting Standards Codification
-Section 50
-Paragraph 1
-Subparagraph (a)
-Publisher FASB
-URI https://asc.fasb.org/1943274/2147482662/260-10-50-1
Reference 16: http://www.xbrl.org/2003/role/disclosureRef
-Topic 220
-SubTopic 10
-Name Accounting Standards Codification
-Section S99
-Paragraph 2
-Subparagraph (SX 210.5-03(25))
-Publisher FASB
-URI https://asc.fasb.org/1943274/2147483621/220-10-S99-2
Reference 17: http://www.xbrl.org/2003/role/disclosureRef
-Topic 942
-SubTopic 220
-Name Accounting Standards Codification
-Section S99
-Paragraph 1
-Subparagraph (SX 210.9-04(27))
-Publisher FASB
-URI https://asc.fasb.org/1943274/2147478524/942-220-S99-1
Reference 18: http://www.xbrl.org/2003/role/disclosureRef
-Topic 944
-SubTopic 220
-Name Accounting Standards Codification
-Section S99
-Paragraph 1
-Subparagraph (SX 210.7-04(23))
-Publisher FASB
-URI https://asc.fasb.org/1943274/2147477250/944-220-S99-1
Reference 19: http://www.xbrl.org/2003/role/disclosureRef
-Topic 260
-SubTopic 10
-Name Accounting Standards Codification
-Section 45
-Paragraph 7
-Publisher FASB
-URI https://asc.fasb.org/1943274/2147482689/260-10-45-7
| Name: |
us-gaap_EarningsPerShareDiluted |
| Namespace Prefix: |
us-gaap_ |
| Data Type: |
dtr-types:perShareItemType |
| Balance Type: |
na |
| Period Type: |
duration |
|
| X |
- References
+ Details
| Name: |
us-gaap_EarningsPerShareDilutedAbstract |
| Namespace Prefix: |
us-gaap_ |
| Data Type: |
xbrli:stringItemType |
| Balance Type: |
na |
| Period Type: |
duration |
|
| X |
- References
+ Details
| Name: |
us-gaap_EarningsPerShareDilutedOtherDisclosuresAbstract |
| Namespace Prefix: |
us-gaap_ |
| Data Type: |
xbrli:stringItemType |
| Balance Type: |
na |
| Period Type: |
duration |
|
| X |
- DefinitionThe portion of profit or loss for the period, net of income taxes, which is attributable to the parent. Reference 1: http://www.xbrl.org/2003/role/disclosureRef
-Topic 250
-SubTopic 10
-Name Accounting Standards Codification
-Section 50
-Paragraph 6
-Publisher FASB
-URI https://asc.fasb.org/1943274/2147483443/250-10-50-6
Reference 2: http://www.xbrl.org/2003/role/disclosureRef
-Topic 250
-SubTopic 10
-Name Accounting Standards Codification
-Section 50
-Paragraph 9
-Publisher FASB
-URI https://asc.fasb.org/1943274/2147483443/250-10-50-9
Reference 3: http://www.xbrl.org/2003/role/disclosureRef
-Topic 805
-SubTopic 60
-Name Accounting Standards Codification
-Section 65
-Paragraph 1
-Subparagraph (g)
-Publisher FASB
-URI https://asc.fasb.org/1943274/2147476176/805-60-65-1
Reference 4: http://www.xbrl.org/2003/role/disclosureRef
-Topic 740
-SubTopic 323
-Name Accounting Standards Codification
-Section 65
-Paragraph 2
-Subparagraph (g)(3)
-Publisher FASB
-URI https://asc.fasb.org/1943274/2147478666/740-323-65-2
Reference 5: http://fasb.org/us-gaap/role/ref/legacyRef
-Topic 220
-SubTopic 10
-Name Accounting Standards Codification
-Section S99
-Paragraph 2
-Subparagraph (SX 210.5-03(20))
-Publisher FASB
-URI https://asc.fasb.org/1943274/2147483621/220-10-S99-2
Reference 6: http://www.xbrl.org/2003/role/disclosureRef
-Topic 235
-SubTopic 10
-Name Accounting Standards Codification
-Section S99
-Paragraph 1
-Subparagraph (SX 210.4-08(g)(1)(ii))
-Publisher FASB
-URI https://asc.fasb.org/1943274/2147480678/235-10-S99-1
Reference 7: http://www.xbrl.org/2003/role/disclosureRef
-Topic 323
-SubTopic 10
-Name Accounting Standards Codification
-Section 50
-Paragraph 3
-Subparagraph (c)
-Publisher FASB
-URI https://asc.fasb.org/1943274/2147481687/323-10-50-3
Reference 8: http://www.xbrl.org/2003/role/disclosureRef
-Topic 825
-SubTopic 10
-Name Accounting Standards Codification
-Section 50
-Paragraph 28
-Subparagraph (f)
-Publisher FASB
-URI https://asc.fasb.org/1943274/2147482907/825-10-50-28
Reference 9: http://www.xbrl.org/2003/role/disclosureRef
-Topic 220
-SubTopic 10
-Name Accounting Standards Codification
-Section 50
-Paragraph 6
-Publisher FASB
-URI https://asc.fasb.org/1943274/2147482765/220-10-50-6
Reference 10: http://www.xbrl.org/2003/role/disclosureRef
-Topic 250
-SubTopic 10
-Name Accounting Standards Codification
-Section 50
-Paragraph 3
-Publisher FASB
-URI https://asc.fasb.org/1943274/2147483443/250-10-50-3
Reference 11: http://www.xbrl.org/2003/role/disclosureRef
-Topic 250
-SubTopic 10
-Name Accounting Standards Codification
-Section 50
-Paragraph 1
-Subparagraph (b)(2)
-Publisher FASB
-URI https://asc.fasb.org/1943274/2147483443/250-10-50-1
Reference 12: http://www.xbrl.org/2003/role/disclosureRef
-Topic 815
-SubTopic 40
-Name Accounting Standards Codification
-Section 65
-Paragraph 1
-Subparagraph (f)
-Publisher FASB
-URI https://asc.fasb.org/1943274/2147480175/815-40-65-1
Reference 13: http://www.xbrl.org/2003/role/disclosureRef
-Topic 250
-SubTopic 10
-Name Accounting Standards Codification
-Section 50
-Paragraph 8
-Publisher FASB
-URI https://asc.fasb.org/1943274/2147483443/250-10-50-8
Reference 14: http://www.xbrl.org/2003/role/disclosureRef
-Topic 250
-SubTopic 10
-Name Accounting Standards Codification
-Section 50
-Paragraph 11
-Subparagraph (a)
-Publisher FASB
-URI https://asc.fasb.org/1943274/2147483443/250-10-50-11
Reference 15: http://www.xbrl.org/2003/role/disclosureRef
-Topic 250
-SubTopic 10
-Name Accounting Standards Codification
-Section 50
-Paragraph 11
-Subparagraph (b)
-Publisher FASB
-URI https://asc.fasb.org/1943274/2147483443/250-10-50-11
Reference 16: http://www.xbrl.org/2003/role/disclosureRef
-Topic 250
-SubTopic 10
-Name Accounting Standards Codification
-Section 50
-Paragraph 4
-Publisher FASB
-URI https://asc.fasb.org/1943274/2147483443/250-10-50-4
Reference 17: http://www.xbrl.org/2003/role/exampleRef
-Topic 946
-SubTopic 830
-Name Accounting Standards Codification
-Section 55
-Paragraph 10
-Publisher FASB
-URI https://asc.fasb.org/1943274/2147479168/946-830-55-10
Reference 18: http://www.xbrl.org/2003/role/disclosureRef
-Topic 946
-SubTopic 220
-Name Accounting Standards Codification
-Section 45
-Paragraph 7
-Publisher FASB
-URI https://asc.fasb.org/1943274/2147479105/946-220-45-7
Reference 19: http://www.xbrl.org/2003/role/disclosureRef
-Topic 944
-SubTopic 220
-Name Accounting Standards Codification
-Section S99
-Paragraph 1
-Subparagraph (SX 210.7-04(18))
-Publisher FASB
-URI https://asc.fasb.org/1943274/2147477250/944-220-S99-1
Reference 20: http://www.xbrl.org/2003/role/disclosureRef
-Topic 946
-SubTopic 220
-Name Accounting Standards Codification
-Section S99
-Paragraph 1
-Subparagraph (SX 210.6-07(9))
-Publisher FASB
-URI https://asc.fasb.org/1943274/2147479134/946-220-S99-1
Reference 21: http://www.xbrl.org/2003/role/disclosureRef
-Topic 946
-SubTopic 220
-Name Accounting Standards Codification
-Section S99
-Paragraph 3
-Subparagraph (SX 210.6-09(1)(d))
-Publisher FASB
-URI https://asc.fasb.org/1943274/2147479134/946-220-S99-3
Reference 22: http://www.xbrl.org/2003/role/disclosureRef
-Topic 470
-SubTopic 10
-Name Accounting Standards Codification
-Section S99
-Paragraph 1A
-Subparagraph (SX 210.13-01(a)(4)(i))
-Publisher FASB
-URI https://asc.fasb.org/1943274/2147480097/470-10-S99-1A
Reference 23: http://www.xbrl.org/2009/role/commonPracticeRef
-Topic 470
-SubTopic 10
-Name Accounting Standards Codification
-Section S99
-Paragraph 1A
-Subparagraph (SX 210.13-01(a)(4)(ii))
-Publisher FASB
-URI https://asc.fasb.org/1943274/2147480097/470-10-S99-1A
Reference 24: http://www.xbrl.org/2003/role/disclosureRef
-Topic 470
-SubTopic 10
-Name Accounting Standards Codification
-Section S99
-Paragraph 1A
-Subparagraph (SX 210.13-01(a)(4)(iii)(A))
-Publisher FASB
-URI https://asc.fasb.org/1943274/2147480097/470-10-S99-1A
Reference 25: http://www.xbrl.org/2003/role/disclosureRef
-Topic 470
-SubTopic 10
-Name Accounting Standards Codification
-Section S99
-Paragraph 1A
-Subparagraph (SX 210.13-01(a)(4)(iv))
-Publisher FASB
-URI https://asc.fasb.org/1943274/2147480097/470-10-S99-1A
Reference 26: http://www.xbrl.org/2003/role/disclosureRef
-Topic 470
-SubTopic 10
-Name Accounting Standards Codification
-Section S99
-Paragraph 1A
-Subparagraph (SX 210.13-01(a)(5))
-Publisher FASB
-URI https://asc.fasb.org/1943274/2147480097/470-10-S99-1A
Reference 27: http://www.xbrl.org/2003/role/disclosureRef
-Topic 470
-SubTopic 10
-Name Accounting Standards Codification
-Section S99
-Paragraph 1B
-Subparagraph (SX 210.13-02(a)(4)(i))
-Publisher FASB
-URI https://asc.fasb.org/1943274/2147480097/470-10-S99-1B
Reference 28: http://www.xbrl.org/2003/role/disclosureRef
-Topic 470
-SubTopic 10
-Name Accounting Standards Codification
-Section S99
-Paragraph 1B
-Subparagraph (SX 210.13-02(a)(4)(iii)(A))
-Publisher FASB
-URI https://asc.fasb.org/1943274/2147480097/470-10-S99-1B
Reference 29: http://www.xbrl.org/2003/role/disclosureRef
-Topic 470
-SubTopic 10
-Name Accounting Standards Codification
-Section S99
-Paragraph 1B
-Subparagraph (SX 210.13-02(a)(4)(iii)(B))
-Publisher FASB
-URI https://asc.fasb.org/1943274/2147480097/470-10-S99-1B
Reference 30: http://www.xbrl.org/2003/role/disclosureRef
-Topic 470
-SubTopic 10
-Name Accounting Standards Codification
-Section S99
-Paragraph 1B
-Subparagraph (SX 210.13-02(a)(4)(iv))
-Publisher FASB
-URI https://asc.fasb.org/1943274/2147480097/470-10-S99-1B
Reference 31: http://www.xbrl.org/2003/role/disclosureRef
-Topic 470
-SubTopic 10
-Name Accounting Standards Codification
-Section S99
-Paragraph 1B
-Subparagraph (SX 210.13-02(a)(5))
-Publisher FASB
-URI https://asc.fasb.org/1943274/2147480097/470-10-S99-1B
Reference 32: http://www.xbrl.org/2003/role/disclosureRef
-Topic 260
-SubTopic 10
-Name Accounting Standards Codification
-Section 45
-Paragraph 60B
-Subparagraph (a)
-Publisher FASB
-URI https://asc.fasb.org/1943274/2147482689/260-10-45-60B
Reference 33: http://www.xbrl.org/2003/role/disclosureRef
-Topic 205
-SubTopic 20
-Name Accounting Standards Codification
-Section 50
-Paragraph 7
-Publisher FASB
-URI https://asc.fasb.org/1943274/2147483499/205-20-50-7
Reference 34: http://fasb.org/us-gaap/role/ref/legacyRef
-Topic 230
-SubTopic 10
-Name Accounting Standards Codification
-Section 45
-Paragraph 28
-Publisher FASB
-URI https://asc.fasb.org/1943274/2147482740/230-10-45-28
Reference 35: http://www.xbrl.org/2003/role/disclosureRef
-Topic 220
-SubTopic 10
-Name Accounting Standards Codification
-Section 45
-Paragraph 1A
-Subparagraph (a)
-Publisher FASB
-URI https://asc.fasb.org/1943274/2147482790/220-10-45-1A
Reference 36: http://www.xbrl.org/2003/role/disclosureRef
-Topic 220
-SubTopic 10
-Name Accounting Standards Codification
-Section 45
-Paragraph 1B
-Subparagraph (a)
-Publisher FASB
-URI https://asc.fasb.org/1943274/2147482790/220-10-45-1B
Reference 37: http://fasb.org/us-gaap/role/ref/legacyRef
-Topic 942
-SubTopic 220
-Name Accounting Standards Codification
-Section S99
-Paragraph 1
-Subparagraph (SX 210.9-04(22))
-Publisher FASB
-URI https://asc.fasb.org/1943274/2147478524/942-220-S99-1
| Name: |
us-gaap_NetIncomeLoss |
| Namespace Prefix: |
us-gaap_ |
| Data Type: |
xbrli:monetaryItemType |
| Balance Type: |
credit |
| Period Type: |
duration |
|
| X |
- DefinitionAmount, after deduction of tax, noncontrolling interests, dividends on preferred stock and participating securities; of income (loss) available to common shareholders. Reference 1: http://www.xbrl.org/2003/role/disclosureRef
-Topic 805
-SubTopic 60
-Name Accounting Standards Codification
-Section 65
-Paragraph 1
-Subparagraph (g)
-Publisher FASB
-URI https://asc.fasb.org/1943274/2147476176/805-60-65-1
Reference 2: http://www.xbrl.org/2003/role/disclosureRef
-Topic 250
-SubTopic 10
-Name Accounting Standards Codification
-Section 50
-Paragraph 3
-Publisher FASB
-URI https://asc.fasb.org/1943274/2147483443/250-10-50-3
Reference 3: http://www.xbrl.org/2003/role/disclosureRef
-Topic 250
-SubTopic 10
-Name Accounting Standards Codification
-Section 50
-Paragraph 11
-Subparagraph (a)
-Publisher FASB
-URI https://asc.fasb.org/1943274/2147483443/250-10-50-11
Reference 4: http://www.xbrl.org/2003/role/disclosureRef
-Topic 250
-SubTopic 10
-Name Accounting Standards Codification
-Section 50
-Paragraph 11
-Subparagraph (b)
-Publisher FASB
-URI https://asc.fasb.org/1943274/2147483443/250-10-50-11
Reference 5: http://www.xbrl.org/2003/role/disclosureRef
-Topic 250
-SubTopic 10
-Name Accounting Standards Codification
-Section 50
-Paragraph 4
-Publisher FASB
-URI https://asc.fasb.org/1943274/2147483443/250-10-50-4
Reference 6: http://www.xbrl.org/2003/role/disclosureRef
-Topic 220
-SubTopic 10
-Name Accounting Standards Codification
-Section S99
-Paragraph 5
-Subparagraph (SAB Topic 6.B)
-Publisher FASB
-URI https://asc.fasb.org/1943274/2147483621/220-10-S99-5
Reference 7: http://www.xbrl.org/2003/role/disclosureRef
-Topic 260
-SubTopic 10
-Name Accounting Standards Codification
-Section 50
-Paragraph 1
-Subparagraph (a)
-Publisher FASB
-URI https://asc.fasb.org/1943274/2147482662/260-10-50-1
Reference 8: http://www.xbrl.org/2003/role/disclosureRef
-Topic 260
-SubTopic 10
-Name Accounting Standards Codification
-Section 45
-Paragraph 10
-Publisher FASB
-URI https://asc.fasb.org/1943274/2147482689/260-10-45-10
Reference 9: http://www.xbrl.org/2003/role/disclosureRef
-Topic 260
-SubTopic 10
-Name Accounting Standards Codification
-Section 45
-Paragraph 11
-Publisher FASB
-URI https://asc.fasb.org/1943274/2147482689/260-10-45-11
Reference 10: http://www.xbrl.org/2003/role/disclosureRef
-Topic 260
-SubTopic 10
-Name Accounting Standards Codification
-Section 45
-Paragraph 60B
-Subparagraph (c)
-Publisher FASB
-URI https://asc.fasb.org/1943274/2147482689/260-10-45-60B
| Name: |
us-gaap_NetIncomeLossAvailableToCommonStockholdersBasic |
| Namespace Prefix: |
us-gaap_ |
| Data Type: |
xbrli:monetaryItemType |
| Balance Type: |
credit |
| Period Type: |
duration |
|
| X |
- References
+ Details
| Name: |
us-gaap_NetIncomeLossAvailableToCommonStockholdersBasicAbstract |
| Namespace Prefix: |
us-gaap_ |
| Data Type: |
xbrli:stringItemType |
| Balance Type: |
na |
| Period Type: |
duration |
|
| X |
- DefinitionAmount, after deduction of tax, noncontrolling interests, dividends on preferred stock and participating securities, and addition from assumption of issuance of common shares for dilutive potential common shares; of income (loss) available to common shareholders. Reference 1: http://www.xbrl.org/2003/role/disclosureRef
-Topic 220
-SubTopic 10
-Name Accounting Standards Codification
-Section S99
-Paragraph 5
-Subparagraph (SAB Topic 6.B)
-Publisher FASB
-URI https://asc.fasb.org/1943274/2147483621/220-10-S99-5
Reference 2: http://www.xbrl.org/2003/role/disclosureRef
-Topic 260
-SubTopic 10
-Name Accounting Standards Codification
-Section 50
-Paragraph 1
-Subparagraph (a)
-Publisher FASB
-URI https://asc.fasb.org/1943274/2147482662/260-10-50-1
Reference 3: http://www.xbrl.org/2003/role/disclosureRef
-Topic 260
-SubTopic 10
-Name Accounting Standards Codification
-Section 45
-Paragraph 16
-Publisher FASB
-URI https://asc.fasb.org/1943274/2147482689/260-10-45-16
Reference 4: http://www.xbrl.org/2003/role/disclosureRef
-Topic 260
-SubTopic 10
-Name Accounting Standards Codification
-Section 45
-Paragraph 40
-Subparagraph (b)(1)
-Publisher FASB
-URI https://asc.fasb.org/1943274/2147482689/260-10-45-40
Reference 5: http://www.xbrl.org/2003/role/disclosureRef
-Topic 260
-SubTopic 10
-Name Accounting Standards Codification
-Section 45
-Paragraph 60B
-Subparagraph (c)
-Publisher FASB
-URI https://asc.fasb.org/1943274/2147482689/260-10-45-60B
Reference 6: http://www.xbrl.org/2003/role/disclosureRef
-Topic 260
-SubTopic 10
-Name Accounting Standards Codification
-Section 45
-Paragraph 40
-Subparagraph (a)
-Publisher FASB
-URI https://asc.fasb.org/1943274/2147482689/260-10-45-40
Reference 7: http://www.xbrl.org/2003/role/disclosureRef
-Topic 260
-SubTopic 10
-Name Accounting Standards Codification
-Section 45
-Paragraph 40
-Subparagraph (b)(2)
-Publisher FASB
-URI https://asc.fasb.org/1943274/2147482689/260-10-45-40
Reference 8: http://www.xbrl.org/2003/role/disclosureRef
-Topic 260
-SubTopic 10
-Name Accounting Standards Codification
-Section 45
-Paragraph 40
-Subparagraph (b)(3)
-Publisher FASB
-URI https://asc.fasb.org/1943274/2147482689/260-10-45-40
| Name: |
us-gaap_NetIncomeLossAvailableToCommonStockholdersDiluted |
| Namespace Prefix: |
us-gaap_ |
| Data Type: |
xbrli:monetaryItemType |
| Balance Type: |
credit |
| Period Type: |
duration |
|
| X |
- DefinitionAmount of undistributed earnings (loss) allocated to participating securities for the basic earnings (loss) per share or per unit calculation under the two-class method. Reference 1: http://www.xbrl.org/2003/role/disclosureRef
-Topic 260
-SubTopic 10
-Name Accounting Standards Codification
-Section 45
-Paragraph 65
-Publisher FASB
-URI https://asc.fasb.org/1943274/2147482689/260-10-45-65
Reference 2: http://www.xbrl.org/2003/role/disclosureRef
-Topic 260
-SubTopic 10
-Name Accounting Standards Codification
-Section 45
-Paragraph 66
-Publisher FASB
-URI https://asc.fasb.org/1943274/2147482689/260-10-45-66
Reference 3: http://www.xbrl.org/2003/role/disclosureRef
-Topic 260
-SubTopic 10
-Name Accounting Standards Codification
-Section 45
-Paragraph 60B
-Subparagraph (b)
-Publisher FASB
-URI https://asc.fasb.org/1943274/2147482689/260-10-45-60B
| Name: |
us-gaap_UndistributedEarningsLossAllocatedToParticipatingSecuritiesBasic |
| Namespace Prefix: |
us-gaap_ |
| Data Type: |
xbrli:monetaryItemType |
| Balance Type: |
debit |
| Period Type: |
duration |
|
| X |
- DefinitionAmount of undistributed earnings (loss) allocated to participating securities for the diluted earnings (loss) per share or per unit calculation under the two-class method. Reference 1: http://www.xbrl.org/2003/role/recommendedDisclosureRef
-Topic 260
-SubTopic 10
-Name Accounting Standards Codification
-Section 45
-Paragraph 60
-Publisher FASB
-URI https://asc.fasb.org/1943274/2147482689/260-10-45-60
Reference 2: http://www.xbrl.org/2003/role/disclosureRef
-Topic 260
-SubTopic 10
-Name Accounting Standards Codification
-Section 45
-Paragraph 65
-Publisher FASB
-URI https://asc.fasb.org/1943274/2147482689/260-10-45-65
Reference 3: http://www.xbrl.org/2003/role/disclosureRef
-Topic 260
-SubTopic 10
-Name Accounting Standards Codification
-Section 45
-Paragraph 66
-Publisher FASB
-URI https://asc.fasb.org/1943274/2147482689/260-10-45-66
Reference 4: http://www.xbrl.org/2003/role/disclosureRef
-Topic 260
-SubTopic 10
-Name Accounting Standards Codification
-Section 45
-Paragraph 60B
-Subparagraph (b)
-Publisher FASB
-URI https://asc.fasb.org/1943274/2147482689/260-10-45-60B
| Name: |
us-gaap_UndistributedEarningsLossAllocatedToParticipatingSecuritiesDiluted |
| Namespace Prefix: |
us-gaap_ |
| Data Type: |
xbrli:monetaryItemType |
| Balance Type: |
debit |
| Period Type: |
duration |
|
| X |
- DefinitionThe average number of shares or units issued and outstanding that are used in calculating diluted EPS or earnings per unit (EPU), determined based on the timing of issuance of shares or units in the period. Reference 1: http://www.xbrl.org/2003/role/disclosureRef
-Topic 260
-SubTopic 10
-Name Accounting Standards Codification
-Section 50
-Paragraph 1
-Subparagraph (a)
-Publisher FASB
-URI https://asc.fasb.org/1943274/2147482662/260-10-50-1
Reference 2: http://www.xbrl.org/2003/role/disclosureRef
-Topic 260
-SubTopic 10
-Name Accounting Standards Codification
-Section 45
-Paragraph 16
-Publisher FASB
-URI https://asc.fasb.org/1943274/2147482689/260-10-45-16
| Name: |
us-gaap_WeightedAverageNumberOfDilutedSharesOutstanding |
| Namespace Prefix: |
us-gaap_ |
| Data Type: |
xbrli:sharesItemType |
| Balance Type: |
na |
| Period Type: |
duration |
|
| X |
- DefinitionNumber of [basic] shares or units, after adjustment for contingently issuable shares or units and other shares or units not deemed outstanding, determined by relating the portion of time within a reporting period that common shares or units have been outstanding to the total time in that period. Reference 1: http://www.xbrl.org/2003/role/disclosureRef
-Topic 260
-SubTopic 10
-Name Accounting Standards Codification
-Section 50
-Paragraph 1
-Subparagraph (a)
-Publisher FASB
-URI https://asc.fasb.org/1943274/2147482662/260-10-50-1
Reference 2: http://www.xbrl.org/2003/role/disclosureRef
-Topic 260
-SubTopic 10
-Name Accounting Standards Codification
-Section 45
-Paragraph 10
-Publisher FASB
-URI https://asc.fasb.org/1943274/2147482689/260-10-45-10
| Name: |
us-gaap_WeightedAverageNumberOfSharesOutstandingBasic |
| Namespace Prefix: |
us-gaap_ |
| Data Type: |
xbrli:sharesItemType |
| Balance Type: |
na |
| Period Type: |
duration |
|
| X |
- Details
| Name: |
us-gaap_AntidilutiveSecuritiesExcludedFromComputationOfEarningsPerShareByAntidilutiveSecuritiesAxis=us-gaap_RestrictedStockUnitsRSUMember |
| Namespace Prefix: |
|
| Data Type: |
na |
| Balance Type: |
|
| Period Type: |
|
|
| X |
- Details
| Name: |
us-gaap_AntidilutiveSecuritiesExcludedFromComputationOfEarningsPerShareByAntidilutiveSecuritiesAxis=us-gaap_RestrictedStockMember |
| Namespace Prefix: |
|
| Data Type: |
na |
| Balance Type: |
|
| Period Type: |
|
|
| X |
- Details
| Name: |
us-gaap_AntidilutiveSecuritiesExcludedFromComputationOfEarningsPerShareByAntidilutiveSecuritiesAxis=us-gaap_CommonClassAMember |
| Namespace Prefix: |
|
| Data Type: |
na |
| Balance Type: |
|
| Period Type: |
|
|
| X |
- Details
| Name: |
us-gaap_StatementClassOfStockAxis=us-gaap_CommonClassAMember |
| Namespace Prefix: |
|
| Data Type: |
na |
| Balance Type: |
|
| Period Type: |
|
|
| X |
- Details
| Name: |
us-gaap_StatementClassOfStockAxis=us-gaap_CommonClassBMember |
| Namespace Prefix: |
|
| Data Type: |
na |
| Balance Type: |
|
| Period Type: |
|
|
v3.24.2
Accumulated Other Comprehensive Loss (Details) - USD ($)
$ in Thousands |
6 Months Ended |
|
|
|
|
Jun. 30, 2024 |
Jun. 30, 2023 |
Mar. 31, 2024 |
Dec. 31, 2023 |
Mar. 31, 2023 |
Dec. 31, 2022 |
| Accumulated Other Comprehensive Income (Loss) [Line Items] |
|
|
|
|
|
|
| Defined benefit pension plan, tax benefits |
$ 600
|
|
|
$ 600
|
|
|
| Accumulated other comprehensive loss included in noncontrolling interests |
(2,027,327)
|
$ (1,908,326)
|
$ (1,988,105)
|
(1,982,104)
|
$ (1,856,801)
|
$ (1,868,047)
|
| Total Members’ Capital |
|
|
|
|
|
|
| Accumulated Other Comprehensive Income (Loss) [Line Items] |
|
|
|
|
|
|
| Unamortized defined benefit pension plan net actuarial losses |
2,300
|
|
|
2,300
|
|
|
| Accumulated other comprehensive loss included in noncontrolling interests |
(696,718)
|
(639,116)
|
$ (681,006)
|
(678,054)
|
$ (614,590)
|
$ (618,131)
|
| AOCI Attributable to Noncontrolling Interest |
|
|
|
|
|
|
| Accumulated Other Comprehensive Income (Loss) [Line Items] |
|
|
|
|
|
|
| Accumulated other comprehensive loss included in noncontrolling interests |
1,500
|
|
|
$ 1,500
|
|
|
| Accumulated Defined Benefit Plans Adjustment, Net Gain (Loss) Attributable to Parent |
|
|
|
|
|
|
| Accumulated Other Comprehensive Income (Loss) [Line Items] |
|
|
|
|
|
|
| Reclassifications from accumulated other comprehensive loss |
$ 13
|
$ 51
|
|
|
|
|
| X |
- DefinitionLine items represent financial concepts included in a table. These concepts are used to disclose reportable information associated with domain members defined in one or many axes to the table. Reference 1: http://www.xbrl.org/2003/role/disclosureRef
-Topic 220
-SubTopic 10
-Name Accounting Standards Codification
-Section 50
-Paragraph 4
-Publisher FASB
-URI https://asc.fasb.org/1943274/2147482765/220-10-50-4
Reference 2: http://www.xbrl.org/2003/role/disclosureRef
-Topic 220
-SubTopic 10
-Name Accounting Standards Codification
-Section 50
-Paragraph 5
-Publisher FASB
-URI https://asc.fasb.org/1943274/2147482765/220-10-50-5
Reference 3: http://www.xbrl.org/2003/role/disclosureRef
-Topic 830
-SubTopic 30
-Name Accounting Standards Codification
-Section 50
-Paragraph 1
-Publisher FASB
-URI https://asc.fasb.org/1943274/2147481674/830-30-50-1
Reference 4: http://www.xbrl.org/2003/role/disclosureRef
-Topic 830
-SubTopic 30
-Name Accounting Standards Codification
-Section 45
-Paragraph 17
-Publisher FASB
-URI https://asc.fasb.org/1943274/2147481694/830-30-45-17
Reference 5: http://www.xbrl.org/2003/role/disclosureRef
-Topic 830
-SubTopic 30
-Name Accounting Standards Codification
-Section 45
-Paragraph 20
-Subparagraph (a)
-Publisher FASB
-URI https://asc.fasb.org/1943274/2147481694/830-30-45-20
Reference 6: http://www.xbrl.org/2003/role/disclosureRef
-Topic 830
-SubTopic 30
-Name Accounting Standards Codification
-Section 45
-Paragraph 20
-Subparagraph (b)
-Publisher FASB
-URI https://asc.fasb.org/1943274/2147481694/830-30-45-20
Reference 7: http://www.xbrl.org/2003/role/disclosureRef
-Topic 830
-SubTopic 30
-Name Accounting Standards Codification
-Section 45
-Paragraph 20
-Subparagraph (c)
-Publisher FASB
-URI https://asc.fasb.org/1943274/2147481694/830-30-45-20
Reference 8: http://www.xbrl.org/2003/role/disclosureRef
-Topic 830
-SubTopic 30
-Name Accounting Standards Codification
-Section 45
-Paragraph 20
-Subparagraph (d)
-Publisher FASB
-URI https://asc.fasb.org/1943274/2147481694/830-30-45-20
| Name: |
us-gaap_AccumulatedOtherComprehensiveIncomeLossLineItems |
| Namespace Prefix: |
us-gaap_ |
| Data Type: |
xbrli:stringItemType |
| Balance Type: |
na |
| Period Type: |
duration |
|
| X |
- DefinitionAmount of tax expense (benefit) allocated to accumulated other comprehensive income (loss) attributable to parent.
| Name: |
us-gaap_AociTaxAttributableToParent |
| Namespace Prefix: |
us-gaap_ |
| Data Type: |
xbrli:monetaryItemType |
| Balance Type: |
debit |
| Period Type: |
instant |
|
| X |
- DefinitionAmount, after tax, of accumulated other comprehensive income (loss) for gain (loss) of defined benefit plan, that has not been recognized in net periodic benefit (cost) credit. Reference 1: http://fasb.org/us-gaap/role/ref/legacyRef
-Name Accounting Standards Codification
-Topic 220
-SubTopic 10
-Section 45
-Paragraph 14A
-Publisher FASB
-URI https://asc.fasb.org/1943274/2147482790/220-10-45-14A
Reference 2: http://www.xbrl.org/2003/role/disclosureRef
-Topic 715
-SubTopic 20
-Name Accounting Standards Codification
-Section 50
-Paragraph 1
-Subparagraph (j)
-Publisher FASB
-URI https://asc.fasb.org/1943274/2147480506/715-20-50-1
| Name: |
us-gaap_DefinedBenefitPlanAccumulatedOtherComprehensiveIncomeNetGainsLossesAfterTax |
| Namespace Prefix: |
us-gaap_ |
| Data Type: |
xbrli:monetaryItemType |
| Balance Type: |
credit |
| Period Type: |
instant |
|
| X |
- DefinitionAmount after tax of reclassification adjustments of other comprehensive income (loss). Reference 1: http://fasb.org/us-gaap/role/ref/legacyRef
-Name Accounting Standards Codification
-Topic 220
-SubTopic 10
-Section 45
-Paragraph 14A
-Publisher FASB
-URI https://asc.fasb.org/1943274/2147482790/220-10-45-14A
Reference 2: http://www.xbrl.org/2003/role/disclosureRef
-Topic 220
-SubTopic 10
-Name Accounting Standards Codification
-Section 50
-Paragraph 5
-Publisher FASB
-URI https://asc.fasb.org/1943274/2147482765/220-10-50-5
Reference 3: http://www.xbrl.org/2003/role/disclosureRef
-Topic 830
-SubTopic 30
-Name Accounting Standards Codification
-Section 50
-Paragraph 1
-Publisher FASB
-URI https://asc.fasb.org/1943274/2147481674/830-30-50-1
Reference 4: http://www.xbrl.org/2003/role/disclosureRef
-Topic 830
-SubTopic 30
-Name Accounting Standards Codification
-Section 45
-Paragraph 17
-Publisher FASB
-URI https://asc.fasb.org/1943274/2147481694/830-30-45-17
Reference 5: http://www.xbrl.org/2003/role/disclosureRef
-Topic 830
-SubTopic 30
-Name Accounting Standards Codification
-Section 45
-Paragraph 20
-Subparagraph (d)
-Publisher FASB
-URI https://asc.fasb.org/1943274/2147481694/830-30-45-20
Reference 6: http://www.xbrl.org/2003/role/disclosureRef
-Topic 944
-SubTopic 220
-Name Accounting Standards Codification
-Section S99
-Paragraph 1
-Subparagraph (SX 210.7-04(19))
-Publisher FASB
-URI https://asc.fasb.org/1943274/2147477250/944-220-S99-1
Reference 7: http://www.xbrl.org/2009/role/commonPracticeRef
-Topic 220
-SubTopic 10
-Name Accounting Standards Codification
-Section 50
-Paragraph 4
-Publisher FASB
-URI https://asc.fasb.org/1943274/2147482765/220-10-50-4
Reference 8: http://fasb.org/us-gaap/role/ref/legacyRef
-Name Accounting Standards Codification
-Section 55
-Paragraph 15
-SubTopic 10
-Topic 220
-Publisher FASB
-URI https://asc.fasb.org/1943274/2147482739/220-10-55-15
| Name: |
us-gaap_ReclassificationFromAccumulatedOtherComprehensiveIncomeCurrentPeriodNetOfTax |
| Namespace Prefix: |
us-gaap_ |
| Data Type: |
xbrli:monetaryItemType |
| Balance Type: |
debit |
| Period Type: |
duration |
|
| X |
- DefinitionAmount of equity (deficit) attributable to parent and noncontrolling interest. Excludes temporary equity. Reference 1: http://www.xbrl.org/2003/role/disclosureRef
-Topic 250
-SubTopic 10
-Name Accounting Standards Codification
-Section 50
-Paragraph 6
-Publisher FASB
-URI https://asc.fasb.org/1943274/2147483443/250-10-50-6
Reference 2: http://www.xbrl.org/2003/role/disclosureRef
-Topic 805
-SubTopic 60
-Name Accounting Standards Codification
-Section 65
-Paragraph 1
-Subparagraph (g)
-Publisher FASB
-URI https://asc.fasb.org/1943274/2147476176/805-60-65-1
Reference 3: http://www.xbrl.org/2003/role/disclosureRef
-Topic 805
-SubTopic 60
-Name Accounting Standards Codification
-Section 65
-Paragraph 1
-Subparagraph (d)(1)
-Publisher FASB
-URI https://asc.fasb.org/1943274/2147476176/805-60-65-1
Reference 4: http://www.xbrl.org/2003/role/disclosureRef
-Topic 740
-SubTopic 323
-Name Accounting Standards Codification
-Section 65
-Paragraph 2
-Subparagraph (e)
-Publisher FASB
-URI https://asc.fasb.org/1943274/2147478666/740-323-65-2
Reference 5: http://www.xbrl.org/2003/role/disclosureRef
-Topic 740
-SubTopic 323
-Name Accounting Standards Codification
-Section 65
-Paragraph 2
-Subparagraph (g)(4)
-Publisher FASB
-URI https://asc.fasb.org/1943274/2147478666/740-323-65-2
Reference 6: http://www.xbrl.org/2003/role/disclosureRef
-Topic 740
-SubTopic 323
-Name Accounting Standards Codification
-Section 65
-Paragraph 2
-Subparagraph (d)(2)
-Publisher FASB
-URI https://asc.fasb.org/1943274/2147478666/740-323-65-2
Reference 7: http://www.xbrl.org/2003/role/disclosureRef
-Topic 740
-SubTopic 323
-Name Accounting Standards Codification
-Section 65
-Paragraph 2
-Subparagraph (d)(1)
-Publisher FASB
-URI https://asc.fasb.org/1943274/2147478666/740-323-65-2
Reference 8: http://www.xbrl.org/2003/role/disclosureRef
-Topic 848
-SubTopic 10
-Name Accounting Standards Codification
-Section 65
-Paragraph 2
-Subparagraph (a)(3)(iii)(03)
-Publisher FASB
-URI https://asc.fasb.org/1943274/2147483550/848-10-65-2
Reference 9: http://www.xbrl.org/2003/role/disclosureRef
-Topic 842
-SubTopic 10
-Name Accounting Standards Codification
-Section 65
-Paragraph 8
-Subparagraph (c)(3)
-Publisher FASB
-URI https://asc.fasb.org/1943274/2147479832/842-10-65-8
Reference 10: http://www.xbrl.org/2003/role/disclosureRef
-Topic 250
-SubTopic 10
-Name Accounting Standards Codification
-Section 45
-Paragraph 24
-Publisher FASB
-URI https://asc.fasb.org/1943274/2147483421/250-10-45-24
Reference 11: http://www.xbrl.org/2003/role/disclosureRef
-Topic 250
-SubTopic 10
-Name Accounting Standards Codification
-Section 45
-Paragraph 23
-Subparagraph (b)
-Publisher FASB
-URI https://asc.fasb.org/1943274/2147483421/250-10-45-23
Reference 12: http://www.xbrl.org/2003/role/disclosureRef
-Topic 250
-SubTopic 10
-Name Accounting Standards Codification
-Section 45
-Paragraph 5
-Subparagraph (b)
-Publisher FASB
-URI https://asc.fasb.org/1943274/2147483421/250-10-45-5
Reference 13: http://www.xbrl.org/2003/role/disclosureRef
-Topic 326
-SubTopic 10
-Name Accounting Standards Codification
-Section 65
-Paragraph 5
-Subparagraph (c)(2)
-Publisher FASB
-URI https://asc.fasb.org/1943274/2147479654/326-10-65-5
Reference 14: http://www.xbrl.org/2003/role/disclosureRef
-Topic 815
-SubTopic 20
-Name Accounting Standards Codification
-Section 65
-Paragraph 6
-Subparagraph (e)
-Publisher FASB
-URI https://asc.fasb.org/1943274/2147480528/815-20-65-6
Reference 15: http://www.xbrl.org/2003/role/disclosureRef
-Topic 815
-SubTopic 20
-Name Accounting Standards Codification
-Section 65
-Paragraph 6
-Subparagraph (h)(1)
-Publisher FASB
-URI https://asc.fasb.org/1943274/2147480528/815-20-65-6
Reference 16: http://www.xbrl.org/2003/role/disclosureRef
-Topic 815
-SubTopic 20
-Name Accounting Standards Codification
-Section 65
-Paragraph 6
-Subparagraph (h)(1)(i)
-Publisher FASB
-URI https://asc.fasb.org/1943274/2147480528/815-20-65-6
Reference 17: http://www.xbrl.org/2003/role/disclosureRef
-Topic 815
-SubTopic 20
-Name Accounting Standards Codification
-Section 65
-Paragraph 6
-Subparagraph (h)(1)(iii)
-Publisher FASB
-URI https://asc.fasb.org/1943274/2147480528/815-20-65-6
Reference 18: http://www.xbrl.org/2003/role/disclosureRef
-Topic 815
-SubTopic 20
-Name Accounting Standards Codification
-Section 65
-Paragraph 6
-Subparagraph (h)(1)(iv)
-Publisher FASB
-URI https://asc.fasb.org/1943274/2147480528/815-20-65-6
Reference 19: http://www.xbrl.org/2003/role/disclosureRef
-Topic 815
-SubTopic 20
-Name Accounting Standards Codification
-Section 65
-Paragraph 6
-Subparagraph (i)(3)
-Publisher FASB
-URI https://asc.fasb.org/1943274/2147480528/815-20-65-6
Reference 20: http://www.xbrl.org/2003/role/disclosureRef
-Topic 105
-SubTopic 10
-Name Accounting Standards Codification
-Section 65
-Paragraph 6
-Subparagraph (c)
-Publisher FASB
-URI https://asc.fasb.org/1943274/2147479343/105-10-65-6
Reference 21: http://www.xbrl.org/2003/role/disclosureRef
-Topic 105
-SubTopic 10
-Name Accounting Standards Codification
-Section 65
-Paragraph 6
-Subparagraph (d)
-Publisher FASB
-URI https://asc.fasb.org/1943274/2147479343/105-10-65-6
Reference 22: http://www.xbrl.org/2003/role/disclosureRef
-Topic 944
-SubTopic 40
-Name Accounting Standards Codification
-Section 65
-Paragraph 2
-Subparagraph (f)(1)
-Publisher FASB
-URI https://asc.fasb.org/1943274/2147480016/944-40-65-2
Reference 23: http://www.xbrl.org/2003/role/disclosureRef
-Topic 944
-SubTopic 40
-Name Accounting Standards Codification
-Section 65
-Paragraph 2
-Subparagraph (f)(2)
-Publisher FASB
-URI https://asc.fasb.org/1943274/2147480016/944-40-65-2
Reference 24: http://www.xbrl.org/2003/role/disclosureRef
-Topic 740
-SubTopic 10
-Name Accounting Standards Codification
-Section 65
-Paragraph 8
-Subparagraph (d)(2)
-Publisher FASB
-URI https://asc.fasb.org/1943274/2147482615/740-10-65-8
Reference 25: http://www.xbrl.org/2003/role/disclosureRef
-Topic 740
-SubTopic 10
-Name Accounting Standards Codification
-Section 65
-Paragraph 8
-Subparagraph (d)(3)
-Publisher FASB
-URI https://asc.fasb.org/1943274/2147482615/740-10-65-8
Reference 26: http://www.xbrl.org/2003/role/disclosureRef
-Topic 326
-SubTopic 10
-Name Accounting Standards Codification
-Section 65
-Paragraph 4
-Subparagraph (d)
-Publisher FASB
-URI https://asc.fasb.org/1943274/2147479654/326-10-65-4
Reference 27: http://www.xbrl.org/2003/role/disclosureRef
-Topic 250
-SubTopic 10
-Name Accounting Standards Codification
-Section 50
-Paragraph 1
-Subparagraph (b)(3)
-Publisher FASB
-URI https://asc.fasb.org/1943274/2147483443/250-10-50-1
Reference 28: http://www.xbrl.org/2003/role/disclosureRef
-Topic 815
-SubTopic 40
-Name Accounting Standards Codification
-Section 65
-Paragraph 1
-Subparagraph (e)(3)
-Publisher FASB
-URI https://asc.fasb.org/1943274/2147480175/815-40-65-1
Reference 29: http://www.xbrl.org/2003/role/disclosureRef
-Topic 250
-SubTopic 10
-Name Accounting Standards Codification
-Section 50
-Paragraph 7
-Subparagraph (b)
-Publisher FASB
-URI https://asc.fasb.org/1943274/2147483443/250-10-50-7
Reference 30: http://www.xbrl.org/2003/role/disclosureRef
-Topic 220
-SubTopic 10
-Name Accounting Standards Codification
-Section 50
-Paragraph 5
-Publisher FASB
-URI https://asc.fasb.org/1943274/2147482765/220-10-50-5
Reference 31: http://www.xbrl.org/2003/role/disclosureRef
-Topic 830
-SubTopic 30
-Name Accounting Standards Codification
-Section 50
-Paragraph 1
-Publisher FASB
-URI https://asc.fasb.org/1943274/2147481674/830-30-50-1
Reference 32: http://www.xbrl.org/2003/role/disclosureRef
-Topic 830
-SubTopic 30
-Name Accounting Standards Codification
-Section 45
-Paragraph 17
-Publisher FASB
-URI https://asc.fasb.org/1943274/2147481694/830-30-45-17
Reference 33: http://www.xbrl.org/2003/role/disclosureRef
-Topic 830
-SubTopic 30
-Name Accounting Standards Codification
-Section 45
-Paragraph 20
-Subparagraph (a)
-Publisher FASB
-URI https://asc.fasb.org/1943274/2147481694/830-30-45-20
Reference 34: http://www.xbrl.org/2003/role/exampleRef
-Topic 946
-SubTopic 830
-Name Accounting Standards Codification
-Section 55
-Paragraph 11
-Publisher FASB
-URI https://asc.fasb.org/1943274/2147479168/946-830-55-11
Reference 35: http://www.xbrl.org/2003/role/disclosureRef
-Topic 946
-SubTopic 205
-Name Accounting Standards Codification
-Section 45
-Paragraph 3
-Publisher FASB
-URI https://asc.fasb.org/1943274/2147478009/946-205-45-3
Reference 36: http://www.xbrl.org/2003/role/disclosureRef
-Topic 946
-SubTopic 505
-Name Accounting Standards Codification
-Section 50
-Paragraph 3
-Publisher FASB
-URI https://asc.fasb.org/1943274/2147478448/946-505-50-3
Reference 37: http://www.xbrl.org/2003/role/disclosureRef
-Topic 946
-SubTopic 210
-Name Accounting Standards Codification
-Section S99
-Paragraph 1
-Subparagraph (SX 210.6-04(19))
-Publisher FASB
-URI https://asc.fasb.org/1943274/2147479170/946-210-S99-1
Reference 38: http://www.xbrl.org/2003/role/disclosureRef
-Topic 946
-SubTopic 210
-Name Accounting Standards Codification
-Section S99
-Paragraph 2
-Subparagraph (SX 210.6-05(4))
-Publisher FASB
-URI https://asc.fasb.org/1943274/2147479170/946-210-S99-2
Reference 39: http://www.xbrl.org/2009/role/commonPracticeRef
-Topic 946
-SubTopic 220
-Name Accounting Standards Codification
-Section S99
-Paragraph 3
-Subparagraph (SX 210.6-09(4)(b))
-Publisher FASB
-URI https://asc.fasb.org/1943274/2147479134/946-220-S99-3
Reference 40: http://www.xbrl.org/2003/role/disclosureRef
-Topic 946
-SubTopic 220
-Name Accounting Standards Codification
-Section S99
-Paragraph 3
-Subparagraph (SX 210.6-09(6))
-Publisher FASB
-URI https://asc.fasb.org/1943274/2147479134/946-220-S99-3
Reference 41: http://www.xbrl.org/2003/role/disclosureRef
-Topic 946
-SubTopic 220
-Name Accounting Standards Codification
-Section S99
-Paragraph 3
-Subparagraph (SX 210.6-09(7))
-Publisher FASB
-URI https://asc.fasb.org/1943274/2147479134/946-220-S99-3
Reference 42: http://www.xbrl.org/2003/role/disclosureRef
-Topic 505
-SubTopic 10
-Name Accounting Standards Codification
-Section S99
-Paragraph 1
-Subparagraph (SX 210.3-04)
-Publisher FASB
-URI https://asc.fasb.org/1943274/2147480008/505-10-S99-1
Reference 43: http://www.xbrl.org/2009/role/commonPracticeRef
-Topic 235
-SubTopic 10
-Name Accounting Standards Codification
-Section S99
-Paragraph 1
-Subparagraph (SX 210.4-08(g)(1)(ii))
-Publisher FASB
-URI https://asc.fasb.org/1943274/2147480678/235-10-S99-1
Reference 44: http://www.xbrl.org/2009/role/commonPracticeRef
-Topic 323
-SubTopic 10
-Name Accounting Standards Codification
-Section 50
-Paragraph 3
-Subparagraph (c)
-Publisher FASB
-URI https://asc.fasb.org/1943274/2147481687/323-10-50-3
Reference 45: http://www.xbrl.org/2009/role/commonPracticeRef
-Topic 825
-SubTopic 10
-Name Accounting Standards Codification
-Section 50
-Paragraph 28
-Subparagraph (f)
-Publisher FASB
-URI https://asc.fasb.org/1943274/2147482907/825-10-50-28
Reference 46: http://fasb.org/us-gaap/role/ref/legacyRef
-Name Accounting Standards Codification
-Topic 810
-SubTopic 10
-Section 45
-Paragraph 15
-Publisher FASB
-URI https://asc.fasb.org/1943274/2147481231/810-10-45-15
Reference 47: http://fasb.org/us-gaap/role/ref/legacyRef
-Name Accounting Standards Codification
-Topic 810
-SubTopic 10
-Section 45
-Paragraph 16
-Publisher FASB
-URI https://asc.fasb.org/1943274/2147481231/810-10-45-16
Reference 48: http://fasb.org/us-gaap/role/ref/legacyRef
-Name Accounting Standards Codification
-Topic 810
-SubTopic 10
-Section 55
-Paragraph 4I
-Publisher FASB
-URI https://asc.fasb.org/1943274/2147481175/810-10-55-4I
Reference 49: http://www.xbrl.org/2003/role/disclosureRef
-Topic 350
-SubTopic 60
-Name Accounting Standards Codification
-Section 65
-Paragraph 1
-Subparagraph (b)
-Publisher FASB
-URI https://asc.fasb.org/1943274/2147476166/350-60-65-1
| Name: |
us-gaap_StockholdersEquityIncludingPortionAttributableToNoncontrollingInterest |
| Namespace Prefix: |
us-gaap_ |
| Data Type: |
xbrli:monetaryItemType |
| Balance Type: |
credit |
| Period Type: |
instant |
|
| X |
- Details
| Name: |
us-gaap_StatementEquityComponentsAxis=us-gaap_ParentMember |
| Namespace Prefix: |
|
| Data Type: |
na |
| Balance Type: |
|
| Period Type: |
|
|
| X |
- Details
| Name: |
us-gaap_StatementEquityComponentsAxis=us-gaap_AociAttributableToNoncontrollingInterestMember |
| Namespace Prefix: |
|
| Data Type: |
na |
| Balance Type: |
|
| Period Type: |
|
|
| X |
- Details
| Name: |
us-gaap_StatementEquityComponentsAxis=us-gaap_AccumulatedDefinedBenefitPlansAdjustmentNetUnamortizedGainLossMember |
| Namespace Prefix: |
|
| Data Type: |
na |
| Balance Type: |
|
| Period Type: |
|
|
Five Point (NYSE:FPH)
Historical Stock Chart
From Jun 2024 to Jul 2024

Five Point (NYSE:FPH)
Historical Stock Chart
From Jul 2023 to Jul 2024
