false
0001055160
0001055160
2024-11-06
2024-11-06
0001055160
us-gaap:CommonStockMember
2024-11-06
2024-11-06
0001055160
us-gaap:SeriesBPreferredStockMember
2024-11-06
2024-11-06
0001055160
us-gaap:SeriesCPreferredStockMember
2024-11-06
2024-11-06
0001055160
MFA:Senior8.875PercentNotesDue2029Member
2024-11-06
2024-11-06
0001055160
MFA:Senior9.000PercentNotesDue2029Member
2024-11-06
2024-11-06
iso4217:USD
xbrli:shares
iso4217:USD
xbrli:shares
UNITED STATES
SECURITIES AND EXCHANGE
COMMISSION
Washington, D.C.
20549
FORM 8-K
CURRENT REPORT
Pursuant to Section 13 or 15(d) of the
Securities Exchange Act of 1934
Date of Report (Date of earliest event reported):
November 6, 2024
MFA
FINANCIAL, INC.
(Exact name of registrant as specified in its
charter)
| Maryland |
|
1-13991 |
|
13-3974868 |
(State or
other jurisdiction
of incorporation
or organization) |
|
(Commission
File Number) |
|
(IRS Employer
Identification No.) |
| One
Vanderbilt Avenue, 48th Floor |
|
|
| New
York, New
York |
|
10017 |
| (Address of principal executive offices) |
|
(Zip Code) |
Registrant's
telephone number, including area code: (212)
207-6400
Not Applicable
(Former name or former address, if changed since
last report)
Check the appropriate box below if the Form 8-K
filing is intended to simultaneously satisfy the filing obligation of the registrant under any of the following provisions (see General
Instruction A.2. below):
| |
|
| ¨ |
Written communications pursuant to Rule
425 under the Securities Act (17 CFR 230.425) |
| |
|
| ¨ |
Soliciting material pursuant to Rule 14a-12
under the Exchange Act (17 CFR 240.14a-12) |
| |
|
| ¨ |
Pre-commencement communications pursuant
to Rule 14d-2(b) under the Exchange Act (17 CFR 240.14d-2(b)) |
| |
|
| ¨ |
Pre-commencement communications pursuant
to Rule 13e-4(c) under the Exchange Act (17 CFR 240.13e-4(c)) |
Securities registered pursuant to Section 12(b) of the
Act:
| Title
of each class: |
|
Trading
Symbols:
|
|
Name
of each
exchange on which
registered:
|
| Common
Stock, par value $0.01 per share |
|
MFA |
|
New
York Stock Exchange |
7.50%
Series B Cumulative Redeemable Preferred Stock, par value $0.01 per share
|
|
MFA/PB |
|
New
York Stock Exchange |
| 6.50%
Series C Fixed-to-Floating Rate Cumulative Redeemable Preferred Stock, par value $0.01 per share |
|
MFA/PC |
|
New
York Stock Exchange |
| 8.875%
Senior Notes due 2029 |
|
MFAN |
|
New
York Stock Exchange |
| 9.000%
Senior Notes due 2029 |
|
MFAO |
|
New
York Stock Exchange |
Indicate by check mark whether the registrant is
an emerging growth company as defined in Rule 405 of the Securities Act of 1933 (§230.405 of this chapter) or Rule 12b-2 of the
Securities Exchange Act of 1934 (§240.12b-2 of this chapter).
Emerging
growth company ¨
If
an emerging growth company, indicate by check mark if the registrant has elected not to use the extended transition period for complying
with any new or revised financial accounting standards provided pursuant to Section 13(a) of the Exchange Act. ¨
Item 2.02 Results of Operations and Financial Condition and
Item 7.01 Regulation FD Disclosure
MFA Financial, Inc. (“MFA”) issued a press release, dated
November 6, 2024, announcing its financial results for the quarter ended September 30, 2024, which is attached hereto as Exhibit 99.1
and is incorporated herein by reference. In addition, in conjunction with the announcement of its financial results, MFA issued additional
information relating to its 2024 third quarter financial results. Such additional information is attached to this report as Exhibit 99.2
and is incorporated herein by reference.
The information referenced in this Current Report on Form 8-K (including
Exhibits 99.1 and 99.2) is being “furnished” and, as such, shall not be deemed to be “filed” for the purposes
of Section 18 of the Securities Exchange Act of 1934, as amended (the “Exchange Act”), or otherwise subject to the liabilities
of that Section. The information set forth in this Current Report on Form 8-K (including Exhibits 99.1 and 99.2) is and will not be incorporated
by reference into any registration statement or other document filed by MFA pursuant to the Securities Act of 1933, as amended (the “Securities
Act”), except as may be expressly set forth by specific reference in such filing.
As discussed therein, the press release contains forward-looking statements
within the meaning of the Securities Act and the Exchange Act and, as such, may involve known and unknown risks, uncertainties and assumptions.
These forward-looking statements relate to MFA’s current expectations and are subject to the limitations and qualifications set
forth in the press release as well as in MFA’s other documents filed with the SEC, including, without limitation, that actual events
and/or results may differ materially from those projected in such forward-looking statements.
Exhibit
SIGNATURE
Pursuant to the requirements of the Securities
Exchange Act of 1934, the registrant has duly caused this report to be signed on its behalf by the undersigned hereunto duly authorized.
| |
MFA FINANCIAL, INC. |
| |
(REGISTRANT) |
| |
|
| |
By: |
/s/ Harold E. Schwartz |
| |
|
Name: |
Harold E. Schwartz |
| |
|
Title: |
Senior Vice President and General Counsel |
Date: November 6, 2024
EXHIBIT INDEX
Exhibit 99.1

| MFA |
|
|
| FINANCIAL, INC. |
|
|
| |
|
|
| One Vanderbilt Ave. |
|
|
| New York, New York 10017 |
|
|
| PRESS RELEASE |
|
FOR IMMEDIATE RELEASE |
| |
|
|
| November 6, 2024 |
|
NEW YORK METRO |
| |
|
|
| INVESTOR CONTACT: |
InvestorRelations@mfafinancial.com |
NYSE: MFA |
| |
212-207-6488 |
|
| |
www.mfafinancial.com |
|
| |
|
|
| MEDIA CONTACT: |
H/Advisors Abernathy |
|
| |
Tom Johnson |
|
| |
212-371-5999 |
|
MFA Financial, Inc. Announces Third Quarter
2024 Financial Results
NEW YORK - MFA Financial, Inc. (NYSE:MFA)
today provided its financial results for the third quarter ended September 30, 2024:
| • | MFA generated GAAP net income for
the third quarter of $40.0 million, or $0.38 per basic common share and $0.37 per diluted
common share. |
| • | Distributable earnings, a non-GAAP
financial measure, were $38.6 million, or $0.37 per basic common share. MFA paid a regular
cash dividend of $0.35 per common share on October 31, 2024. |
| • | GAAP book value at September 30,
2024 was $13.77 per common share. Economic book value, a non-GAAP financial measure, was
$14.46 per common share. |
| • | Total economic return was 3.3% for
the third quarter. |
| • | Net interest spread averaged 2.18%
and net interest margin was 3.00%. |
| • | MFA closed the quarter with unrestricted
cash of $305.6 million. |
“We are pleased to report strong results
for the third quarter,” stated Craig Knutson, MFA’s Chief Executive Officer. “We generated Distributable earnings of
$0.37 per share and our Economic book value rose approximately 1% to $14.46 per share from $14.34 at June 30. We purchased or originated
over $565.2 million of residential mortgage loans with an average coupon of 9.4%. We also added $294 million of Agency MBS at attractive
yields. We completed two loan securitizations during the quarter and two more subsequent to quarter-end.”
“With a 50 basis point rate cut at its
September meeting, the Federal Reserve began an easing cycle that should benefit mortgage REITs and other levered fixed income investors,”
Mr. Knutson added. “This is a welcome development after a challenging period of restrictive monetary policy and an inverted
yield curve. Although it remains to be seen how long this cycle lasts and how far the Fed ultimately cuts rates, a return to a more neutral
policy rate and the normalization of the yield curve should both serve as tailwinds for our business.”
“Finally, we were delighted to announce
in late August that Bryan Wulfsohn will serve as President of MFA and that Lori Samuels has been named Chief Loan Operations Officer.
Bryan and Lori are exceptionally talented leaders who have each been at MFA for nearly 15 years. We are proud to elevate them into new
roles,” concluded Mr. Knutson.
Q3
2024 Portfolio Activity
| • | Loan
acquisitions were $565.2 million, including $329.0 million of funded originations
of business purpose loans (including draws on Transitional loans) and $236.2 million
of Non-QM loan acquisitions, bringing MFA’s residential whole loan balance to $9.0
billion. |
| • | Lima One funded $196.0 million of
new business purpose loans with a maximum loan amount of $312.3 million. Further, $132.9
million of draws were funded on previously originated Transitional loans. Lima One generated
$8.9 million of mortgage banking income. |
| • | MFA added $293.9 million of Agency
MBS during the quarter, bringing its Agency MBS portfolio to $993.5 million. |
| • | Asset dispositions included $241.5
million of single-family rental (SFR) loans and $16.0 million of credit risk transfer (CRT)
securities. MFA also sold 58 REO properties in the third quarter for aggregate proceeds of
$18.3 million. |
| • | 60+ day delinquencies (measured as
a percentage of UPB) for MFA’s residential loan portfolio increased to 6.7% from 6.5%
in the second quarter. |
| • | MFA completed two loan securitizations
during the quarter, collateralized by $643.4 million UPB of Non-QM and Legacy RPL/NPL loans,
bringing its total securitized debt to approximately $5.3 billion. |
| • | MFA
increased its position in interest rate swaps to a notional amount of approximately $3.5
billion. At September 30, 2024, these swaps had a weighted average fixed pay interest
rate of 1.91% and a weighted average variable receive interest rate of 4.96%. |
| • | MFA
estimates the net effective duration of its investment portfolio at September 30, 2024
rose to 1.16 from 1.12 at June 30, 2024. |
| • | MFA’s
Debt/Net Equity Ratio was 4.8x and recourse leverage was 1.8x at September 30, 2024. |
Webcast
MFA Financial, Inc. plans to host a live
audio webcast of its investor conference call on Wednesday, November 6, 2024, at 11:00 a.m. (Eastern Time) to discuss its third
quarter 2024 financial results. The live audio webcast will be accessible to the general public over the internet at http://www.mfafinancial.com
through the “Webcasts & Presentations” link on MFA’s home page. Earnings presentation materials will be posted
on the MFA website prior to the conference call and an audio replay will be available on the website following the call.
About MFA Financial, Inc.
MFA Financial, Inc. (NYSE: MFA) is a leading
specialty finance company that invests in residential mortgage loans, residential mortgage-backed securities and other real estate assets.
Through its wholly-owned subsidiary, Lima One Capital, MFA also originates and services business purpose loans for real estate investors.
MFA has distributed $4.8 billion in dividends to stockholders since its initial public offering in 1998. MFA is an internally-managed,
publicly-traded real estate investment trust.
The following table presents MFA’s asset
allocation as of September 30, 2024, and the third quarter 2024 yield on average interest-earning assets, average cost of funds
and net interest rate spread for the various asset types.
Table 1 - Asset Allocation
| At September 30, 2024 | |
Business
purpose
loans (1) | | |
Non-QM
loans | | |
Legacy
RPL/NPL loans | | |
Securities,
at fair value | | |
Other,
net (2) | | |
Total | |
| (Dollars in Millions) | |
| | |
| | |
| | |
| | |
| | |
| |
| Asset
Amount | |
$ | 3,682 | | |
$ | 4,171 | | |
$ | 1,118 | | |
$ | 1,140 | | |
$ | 756 | | |
$ | 10,867 | |
| Receivable/(Payable)
for Unsettled Transactions | |
| — | | |
| — | | |
| — | | |
| (65 | ) | |
| — | | |
| (65 | ) |
| Financing Agreements
with Non-mark-to-market Collateral Provisions | |
| (678 | ) | |
| — | | |
| — | | |
| — | | |
| — | | |
| (678 | ) |
| Financing Agreements
with Mark-to-market Collateral Provisions | |
| (802 | ) | |
| (653 | ) | |
| (309 | ) | |
| (918 | ) | |
| (90 | ) | |
| (2,772 | ) |
| Securitized Debt | |
| (1,617 | ) | |
| (3,030 | ) | |
| (641 | ) | |
| — | | |
| (1 | ) | |
| (5,289 | ) |
| Senior
Notes | |
| — | | |
| — | | |
| — | | |
| — | | |
| (183 | ) | |
| (183 | ) |
| Net
Equity Allocated | |
$ | 585 | | |
$ | 488 | | |
$ | 168 | | |
$ | 157 | | |
$ | 482 | | |
$ | 1,880 | |
| Debt/Net
Equity Ratio (3) | |
| 5.3 | x | |
| 7.5 | x | |
| 5.7 | x | |
| 6.3 | x | |
| | | |
| 4.8 | x |
| | |
| | | |
| | | |
| | | |
| | | |
| | | |
| | |
| For the Quarter Ended
September 30, 2024 | |
| | | |
| | | |
| | | |
| | | |
| | | |
| | |
| Yield
on Average Interest Earning Assets (4) | |
| 7.91 | % | |
| 5.47 | % | |
| 7.75 | % | |
| 6.48 | % | |
| | | |
| 6.71 | % |
| Less
Average Cost of Funds (5) | |
| (5.65 | ) | |
| (3.47 | ) | |
| (4.08 | ) | |
| (3.94 | ) | |
| | | |
| (4.53 | ) |
| Net Interest
Rate Spread | |
| 2.26 | % | |
| 2.00 | % | |
| 3.67 | % | |
| 2.54 | % | |
| | | |
| 2.18 | % |
| (1) | Includes $1.2 billion of Single-family
transitional loans, $1.1 billion of Multifamily transitional loans and $1.5 billion of Single-family
rental loans. |
| (2) | Includes $305.6 million of cash
and cash equivalents, $197.3 million of restricted cash, $55.9 million of Other loans and
$16.8 million of capital contributions made to loan origination partners, as well as other
assets and other liabilities. |
| (3) | Total Debt/Net Equity ratio represents
the sum of borrowings under our financing agreements as a multiple of net equity allocated. |
| (4) | Yields reported on our interest
earning assets are calculated based on the interest income recorded and the average amortized
cost for the quarter of the respective asset. At September 30, 2024, the amortized cost
of our Securities, at fair value, was $1.1 billion. In addition, the yield for residential
whole loans was 6.73%, net of one basis point of servicing fee expense incurred during the
quarter. For GAAP reporting purposes, such expenses are included in Loan servicing and other
related operating expenses in our statement of operations. |
| (5) | Average cost of funds includes
interest on financing agreements, Convertible Senior Notes, 8.875% Senior Notes, 9.00% Senior
Notes, and securitized debt. Cost of funding also includes the impact of the net carry (the
difference between swap interest income received and swap interest expense paid) on our interest
rate swap agreements (or Swaps). While we have not elected hedge accounting treatment for
Swaps and accordingly net carry is not presented in interest expense in our consolidated
statement of operations, we believe it is appropriate to allocate net carry to the cost of
funding to reflect the economic impact of our Swaps on the funding costs shown in the table
above. For the quarter ended September 30, 2024, this decreased the overall funding
cost by 131 basis points for our overall portfolio, 131 basis points for our Residential
whole loans, 101 basis points for our Business purpose loans, 175 basis points for our Non-QM
loans, 56 basis points for our Legacy RPL/NPL loans and 171 basis points for our Securities,
at fair value. |
The following table presents the activity for
our residential mortgage asset portfolio for the three months ended September 30, 2024:
Table 2 - Investment Portfolio Activity Q3
2024
| (In Millions) | |
June 30,
2024 | | |
Runoff
(1) | | |
Acquisitions
(2) | | |
Other
(3) | | |
September 30,
2024 | | |
Change | |
| Residential whole loans and REO | |
$ | 9,294 | | |
$ | (611 | ) | |
$ | 565 | | |
$ | (94 | ) | |
$ | 9,154 | | |
$ | (140 | ) |
| Securities, at fair value | |
| 863 | | |
| (18 | ) | |
| 294 | | |
| 1 | | |
| 1,140 | | |
| 277 | |
| Totals | |
$ | 10,157 | | |
$ | (629 | ) | |
$ | 859 | | |
$ | (93 | ) | |
$ | 10,294 | | |
$ | 137 | |
| (1) | Primarily includes principal repayments
and sales of REO. |
| (2) | Includes draws on previously originated
Transitional loans. |
| (3) | Primarily includes sales, changes
in fair value and changes in the allowance for credit losses. |
The following tables present information on our
investments in residential whole loans:
Table 3 - Portfolio Composition/Residential Whole Loans
| | |
Held at
Carrying Value | | |
Held at
Fair Value | | |
Total | |
| (Dollars in Thousands) | |
September 30,
2024 | | |
December 31,
2023 | | |
September 30,
2024 | | |
December 31,
2023 | | |
September 30,
2024 | | |
December 31,
2023 | |
| Business purpose loans: | |
| | | |
| | | |
| | | |
| | | |
| | | |
| | |
| Single-family
transitional loans (1) | |
$ | 25,382 | | |
$ | 35,467 | | |
$ | 1,127,519 | | |
$ | 1,157,732 | | |
$ | 1,152,901 | | |
$ | 1,193,199 | |
| Multifamily transitional loans | |
| — | | |
| — | | |
| 1,058,079 | | |
| 1,168,297 | | |
| 1,058,079 | | |
| 1,168,297 | |
| Single-family
rental loans | |
| 119,153 | | |
| 172,213 | | |
| 1,353,909 | | |
| 1,462,583 | | |
| 1,473,062 | | |
| 1,634,796 | |
| Total Business purpose loans | |
$ | 144,535 | | |
$ | 207,680 | | |
$ | 3,539,507 | | |
$ | 3,788,612 | | |
$ | 3,684,042 | | |
$ | 3,996,292 | |
| Non-QM loans | |
| 751,550 | | |
| 843,884 | | |
| 3,421,247 | | |
| 2,961,693 | | |
| 4,172,797 | | |
| 3,805,577 | |
| Legacy RPL/NPL loans | |
| 467,202 | | |
| 498,671 | | |
| 658,078 | | |
| 705,424 | | |
| 1,125,280 | | |
| 1,204,095 | |
| Other loans | |
| — | | |
| — | | |
| 55,909 | | |
| 55,779 | | |
| 55,909 | | |
| 55,779 | |
| Allowance for Credit
Losses | |
| (10,657 | ) | |
| (20,451 | ) | |
| — | | |
| — | | |
| (10,657 | ) | |
| (20,451 | ) |
| Total Residential
whole loans | |
$ | 1,352,630 | | |
$ | 1,529,784 | | |
$ | 7,674,741 | | |
$ | 7,511,508 | | |
$ | 9,027,371 | | |
$ | 9,041,292 | |
| Number of loans | |
| 5,757 | | |
| 6,326 | | |
| 18,837 | | |
| 19,075 | | |
| 24,594 | | |
| 25,401 | |
| (1) | Includes
$446.5 million and $471.1 million of loans collateralized by new construction projects
at origination as of September 30, 2024 and December 31, 2023, respectively. |
Table 4 - Yields and Average Balances/Residential Whole Loans
| | |
For the
Three-Month Period Ended | |
| | |
September 30,
2024 | | |
June 30,
2024 | | |
September 30,
2023 | |
| (Dollars in Thousands) | |
Interest | | |
Average
Balance | | |
Average
Yield | | |
Interest | | |
Average
Balance | | |
Average
Yield | | |
Interest | | |
Average
Balance | | |
Average
Yield | |
| Business purpose loans: | |
| | | |
| | | |
| | | |
| | | |
| | | |
| | | |
| | | |
| | | |
| | |
| Single-family
transitional loans | |
$ | 28,486 | | |
$ | 1,196,227 | | |
| 9.53 | % | |
$ | 30,242 | | |
$ | 1,241,300 | | |
| 9.75 | % | |
$ | 22,259 | | |
$ | 1,003,031 | | |
| 8.88 | % |
| Multifamily transitional
loans | |
| 23,479 | | |
| 1,145,051 | | |
| 8.20 | % | |
| 25,291 | | |
| 1,213,450 | | |
| 8.34 | % | |
| 17,964 | | |
| 924,502 | | |
| 7.77 | % |
| Single-family
rental loans | |
| 26,333 | | |
| 1,616,723 | | |
| 6.52 | % | |
| 27,564 | | |
| 1,703,334 | | |
| 6.47 | % | |
| 24,087 | | |
| 1,639,626 | | |
| 5.88 | % |
| Total business purpose
loans | |
$ | 78,298 | | |
$ | 3,958,001 | | |
| 7.91 | % | |
$ | 83,097 | | |
$ | 4,158,084 | | |
| 7.99 | % | |
$ | 64,310 | | |
$ | 3,567,159 | | |
| 7.21 | % |
| Non-QM loans | |
| 58,467 | | |
| 4,279,297 | | |
| 5.47 | % | |
| 58,749 | | |
| 4,280,761 | | |
| 5.49 | % | |
| 51,724 | | |
| 4,053,924 | | |
| 5.10 | % |
| Legacy RPL/NPL loans | |
| 20,139 | | |
| 1,040,010 | | |
| 7.75 | % | |
| 23,346 | | |
| 1,070,629 | | |
| 8.72 | % | |
| 24,018 | | |
| 1,167,872 | | |
| 8.23 | % |
| Other
loans | |
| 502 | | |
| 67,070 | | |
| 2.99 | % | |
| 525 | | |
| 67,771 | | |
| 3.10 | % | |
| 486 | | |
| 71,306 | | |
| 2.73 | % |
| Total
Residential whole loans | |
$ | 157,406 | | |
$ | 9,344,378 | | |
| 6.74 | % | |
$ | 165,717 | | |
$ | 9,577,245 | | |
| 6.92 | % | |
$ | 140,538 | | |
$ | 8,860,261 | | |
| 6.34 | % |
Table 5 - Net Interest Spread/Residential Whole Loans
| | |
For the
Three-Month Period Ended | |
| | |
September 30,
2024 | | |
June 30,
2024 | | |
September 30,
2023 | |
| Business purpose loans | |
| | | |
| | | |
| | |
| Net
Yield (1) | |
| 7.91 | % | |
| 7.99 | % | |
| 7.21 | % |
| Cost of
Funding (2) | |
| 5.65 | % | |
| 5.80 | % | |
| 5.34 | % |
| Net Interest Spread | |
| 2.26 | % | |
| 2.19 | % | |
| 1.87 | % |
| | |
| | | |
| | | |
| | |
| Non-QM loans | |
| | | |
| | | |
| | |
| Net
Yield (1) | |
| 5.47 | % | |
| 5.49 | % | |
| 5.10 | % |
| Cost of
Funding (2) | |
| 3.47 | % | |
| 3.55 | % | |
| 3.22 | % |
| Net Interest Spread | |
| 2.00 | % | |
| 1.94 | % | |
| 1.88 | % |
| | |
| | | |
| | | |
| | |
| Legacy RPL/NPL loans | |
| | | |
| | | |
| | |
| Net
Yield (1) | |
| 7.75 | % | |
| 8.72 | % | |
| 8.23 | % |
| Cost of
Funding (2) | |
| 4.08 | % | |
| 3.70 | % | |
| 3.21 | % |
| Net Interest Spread | |
| 3.67 | % | |
| 5.02 | % | |
| 5.02 | % |
| | |
| | | |
| | | |
| | |
| Total Residential whole loans | |
| | | |
| | | |
| | |
| Net
Yield (1) | |
| 6.74 | % | |
| 6.92 | % | |
| 6.34 | % |
| Cost of
Funding (2) | |
| 4.45 | % | |
| 4.54 | % | |
| 4.10 | % |
| Net Interest Spread | |
| 2.29 | % | |
| 2.38 | % | |
| 2.24 | % |
| (1) | Reflects annualized interest
income on Residential whole loans divided by average amortized cost of Residential whole
loans. Excludes servicing costs. |
| (2) | Reflects annualized interest
expense divided by average balance of agreements with mark-to-market collateral provisions
(repurchase agreements), agreements with non-mark-to-market collateral provisions, and securitized
debt. Cost of funding shown in the table above includes the impact of the net carry (the
difference between swap interest income received and swap interest expense paid) on our Swaps.
While we have not elected hedge accounting treatment for Swaps, and, accordingly, net carry
is not presented in interest expense in our consolidated statement of operations, we believe
it is appropriate to allocate net carry to the cost of funding to reflect the economic impact
of our Swaps on the funding costs shown in the table above. For the quarter ended September 30,
2024, this decreased the overall funding cost by 131 basis points for our Residential whole
loans, 101 basis points for our Business purpose loans, 175 basis points for our Non-QM loans,
and 56 basis points for our Legacy RPL/NPL loans. For the quarter ended June 30, 2024,
this decreased the overall funding cost by 128 basis points for our Residential whole loans,
92 basis points for our Business purpose loans, 163 basis points for our Non-QM loans, and
107 basis points for our Legacy RPL/NPL loans. For the quarter ended September 30, 2023,
this decreased the overall funding cost by 143 basis points for our Residential whole loans,
240 basis points for our Business purpose loans, 176 basis points for our Non-QM loans, and
254 basis points for our Legacy RPL/NPL loans. |
Table 6 - Credit-related Metrics/Residential
Whole Loans
September 30, 2024
| |
|
|
|
|
|
|
|
Unpaid
Principal |
|
|
Weighted
Average |
|
|
Weighted
Average Term to |
|
|
Weighted
Average |
|
|
Weighted
Average |
|
|
Aging
by UPB |
|
|
60+ |
|
|
60+ |
|
| (Dollars |
|
Asset
|
|
|
Fair
|
|
|
Balance
|
|
|
Coupon
|
|
|
Maturity |
|
|
LTV
|
|
|
Original
|
|
|
|
|
|
Past
Due Days |
|
|
DQ |
|
|
LTV |
|
| In Thousands) |
|
Amount |
|
|
Value |
|
|
(“UPB”) |
|
|
(1) |
|
|
(Months) |
|
|
Ratio
(2) |
|
|
FICO
(3) |
|
|
Current |
|
|
30-59 |
|
|
60-89 |
|
|
90+ |
|
|
% |
|
|
(4) |
|
| Business
purpose loans: |
|
|
|
|
|
|
|
|
|
|
|
|
|
|
|
|
|
|
|
|
|
|
|
|
|
|
|
|
|
|
|
|
|
|
|
|
|
|
|
|
|
|
|
|
|
|
| Single-family
transitional (4) |
|
$ |
1,151,733 |
|
|
$ |
1,152,489 |
|
|
$ |
1,158,413 |
|
|
10.46 |
% |
|
6 |
|
|
67 |
% |
|
748 |
|
|
$ |
1,021,676 |
|
|
$ |
41,089 |
|
|
$ |
6,034 |
|
|
$ |
89,614 |
|
|
8.3 |
% |
|
84 |
% |
| Multifamily
transitional (4) |
|
|
1,058,079 |
|
|
|
1,058,079 |
|
|
|
1,102,732 |
|
|
9.06 |
% |
|
9 |
|
|
67 |
% |
|
748 |
|
|
|
994,102 |
|
|
|
47,898 |
|
|
|
10,800 |
|
|
|
49,932 |
|
|
5.5 |
% |
|
79 |
% |
| Single-family
rental |
|
|
1,472,687 |
|
|
|
1,474,723 |
|
|
|
1,505,242 |
|
|
6.43 |
% |
|
325 |
|
|
68 |
% |
|
738 |
|
|
|
1,436,384 |
|
|
|
16,896 |
|
|
|
5,180 |
|
|
|
46,782 |
|
|
3.5 |
% |
|
103 |
% |
| Total
Business purpose loans |
|
$ |
3,682,499 |
|
|
$ |
3,685,291 |
|
|
$ |
3,766,387 |
|
|
8.44 |
% |
|
|
|
|
68 |
% |
|
|
|
|
$ |
3,452,162 |
|
|
$ |
105,883 |
|
|
$ |
22,014 |
|
|
$ |
186,328 |
|
|
5.5 |
% |
|
|
|
| Non-QM
loans |
|
|
4,171,055 |
|
|
|
4,145,143 |
|
|
|
4,264,091 |
|
|
6.26 |
% |
|
339 |
|
|
64 |
% |
|
735 |
|
|
|
4,013,257 |
|
|
|
100,943 |
|
|
|
37,025 |
|
|
|
112,866 |
|
|
3.5 |
% |
|
65 |
% |
| Legacy
RPL/NPL loans |
|
|
1,117,908 |
|
|
|
1,147,684 |
|
|
|
1,250,859 |
|
|
5.15 |
% |
|
255 |
|
|
55 |
% |
|
647 |
|
|
|
854,721 |
|
|
|
128,022 |
|
|
|
48,794 |
|
|
|
219,322 |
|
|
21.4 |
% |
|
63 |
% |
| Other
loans |
|
|
55,909 |
|
|
|
55,909 |
|
|
|
64,875 |
|
|
3.44 |
% |
|
323 |
|
|
65 |
% |
|
757 |
|
|
|
64,875 |
|
|
|
— |
|
|
|
— |
|
|
|
— |
|
|
— |
% |
|
— |
% |
| Residential
whole loans, total or weighted average |
|
$ |
9,027,371 |
|
|
$ |
9,034,027 |
|
|
$ |
9,346,212 |
|
|
6.99 |
% |
|
|
|
|
64 |
% |
|
|
|
|
$ |
8,385,015 |
|
|
$ |
334,848 |
|
|
$ |
107,833 |
|
|
$ |
518,516 |
|
|
6.7 |
% |
|
|
|
| (1) | Weighted average is calculated
based on the interest bearing principal balance of each loan within the related category.
For loans acquired with servicing rights released by the seller, interest rates included
in the calculation do not reflect loan servicing fees. For loans acquired with servicing
rights retained by the seller, interest rates included in the calculation are net of servicing
fees. |
| (2) | LTV represents the ratio of the
total unpaid principal balance of the loan to the estimated value of the collateral securing
the related loan as of the most recent date available, which may be the origination date.
Excluded from the calculation of weighted average LTV are certain low value loans secured
by vacant lots, for which the LTV ratio is not meaningful. 60+ LTV has been calculated on
a consistent basis. |
| (3) | Excludes loans for which no Fair
Isaac Corporation (“FICO”) score is available. |
| (4) | For Single-family and Multifamily
transitional loans, the LTV presented is the ratio of the maximum unpaid principal balance
of the loan, including unfunded commitments, to the estimated “after repaired”
value of the collateral securing the related loan, where available. At September 30,
2024, for certain Single-family and Multifamily Transitional loans totaling $459.2 million
and $568.3 million, respectively, an after repaired valuation was not available. For these
loans, the weighted average LTV is calculated based on the current unpaid principal balance
and the as-is value of the collateral securing the related loan. |
Table 7 - Shock Table
The information presented in the following “Shock
Table” projects the potential impact of sudden parallel changes in interest rates on the value of our portfolio, including the
impact of Swaps and securitized debt, based on the assets in our investment portfolio at September 30, 2024. Changes in portfolio
value are measured as the percentage change when comparing the projected portfolio value to the base interest rate scenario at September 30,
2024.
| Change in Interest Rates | |
Percentage
Change in
Portfolio Value | | |
Percentage
Change in
Total
Stockholders’ Equity | |
| +100 Basis Point Increase | |
| (1.44 | )% | |
| (8.50 | )% |
| + 50 Basis Point Increase | |
| (0.65 | )% | |
| (3.85 | )% |
| Actual at September 30, 2024 | |
| — | % | |
| — | % |
| - 50 Basis Point Decrease | |
| 0.51 | % | |
| 3.04 | % |
| -100 Basis Point Decrease | |
| 0.89 | % | |
| 5.28 | % |
MFA FINANCIAL, INC.
CONSOLIDATED BALANCE SHEETS
| (In Thousands, Except Per Share Amounts) | |
September 30,
2024 | | |
December 31,
2023 | |
| | |
(unaudited) | | |
| |
| Assets: | |
| | | |
| | |
| Residential
whole loans, net ($7,674,741 and $7,511,508 held at fair value, respectively) (1) | |
$ | 9,027,371 | | |
$ | 9,041,292 | |
| Securities, at fair value | |
| 1,140,036 | | |
| 746,090 | |
| Cash and cash equivalents | |
| 305,560 | | |
| 318,000 | |
| Restricted cash | |
| 197,348 | | |
| 170,211 | |
| Other assets | |
| 489,531 | | |
| 497,097 | |
| Total Assets | |
$ | 11,159,846 | | |
$ | 10,772,690 | |
| | |
| | | |
| | |
| Liabilities: | |
| | | |
| | |
| Financing agreements ($5,097,002 and $4,633,660 held at fair
value, respectively) | |
$ | 8,922,502 | | |
$ | 8,536,745 | |
| Other liabilities | |
| 356,876 | | |
| 336,030 | |
| Total Liabilities | |
$ | 9,279,378 | | |
$ | 8,872,775 | |
| | |
| | | |
| | |
| Stockholders’ Equity: | |
| | | |
| | |
| Preferred stock,
$0.01 par value; 7.5% Series B cumulative redeemable; 8,050 shares authorized; 8,000 shares issued and outstanding ($200,000
aggregate liquidation preference) | |
$ | 80 | | |
$ | 80 | |
| Preferred stock,
$0.01 par value; 6.5% Series C fixed-to-floating rate cumulative redeemable; 12,650 shares authorized; 11,000 shares issued
and outstanding ($275,000 aggregate liquidation preference) | |
| 110 | | |
| 110 | |
| Common stock,
$0.01 par value; 874,300 and 874,300 shares authorized; 102,083 and 101,916 shares issued and outstanding, respectively | |
| 1,021 | | |
| 1,019 | |
| Additional paid-in capital, in excess of par | |
| 3,709,534 | | |
| 3,698,767 | |
| Accumulated deficit | |
| (1,840,399 | ) | |
| (1,817,759 | ) |
| Accumulated other comprehensive income | |
| 10,122 | | |
| 17,698 | |
| Total Stockholders’
Equity | |
$ | 1,880,468 | | |
$ | 1,899,915 | |
| Total Liabilities
and Stockholders’ Equity | |
$ | 11,159,846 | | |
$ | 10,772,690 | |
| (1) | Includes approximately $6.3 billion
and $5.7 billion of Residential whole loans transferred to consolidated variable interest
entities (“VIEs”) at September 30, 2024 and December 31, 2023, respectively.
Such assets can be used only to settle the obligations of each respective VIE. |
MFA FINANCIAL, INC.
CONSOLIDATED STATEMENTS OF OPERATIONS
| | |
Three
Months Ended September 30, | | |
Nine
Months Ended September 30, | |
| (In Thousands, Except Per Share Amounts) | |
2024 | | |
2023 | | |
2024 | | |
2023 | |
| | |
(Unaudited) | | |
(Unaudited) | | |
(Unaudited) | | |
(Unaudited) | |
| Interest Income: | |
| | | |
| | | |
| | | |
| | |
| Residential whole loans | |
$ | 157,406 | | |
$ | 140,538 | | |
$ | 480,788 | | |
$ | 388,096 | |
| Securities, at fair value | |
| 14,742 | | |
| 11,945 | | |
| 41,363 | | |
| 29,201 | |
| Other interest-earning assets | |
| 4,001 | | |
| 2,587 | | |
| 6,341 | | |
| 7,560 | |
| Cash and cash equivalent investments | |
| 5,825 | | |
| 4,095 | | |
| 17,144 | | |
| 10,863 | |
| Interest
Income | |
$ | 181,974 | | |
$ | 159,165 | | |
$ | 545,636 | | |
$ | 435,720 | |
| | |
| | | |
| | | |
| | | |
| | |
| Interest Expense: | |
| | | |
| | | |
| | | |
| | |
| Asset-backed and other collateralized financing arrangements | |
$ | 126,833 | | |
$ | 109,088 | | |
$ | 377,030 | | |
$ | 293,852 | |
| Other interest expense | |
| 4,516 | | |
| 3,936 | | |
| 16,678 | | |
| 11,853 | |
| Interest
Expense | |
$ | 131,349 | | |
$ | 113,024 | | |
$ | 393,708 | | |
$ | 305,705 | |
| | |
| | | |
| | | |
| | | |
| | |
| Net Interest
Income | |
$ | 50,625 | | |
$ | 46,141 | | |
$ | 151,928 | | |
$ | 130,015 | |
| | |
| | | |
| | | |
| | | |
| | |
| Reversal/(Provision) for Credit Losses on Residential
Whole Loans | |
$ | 1,942 | | |
$ | 1,258 | | |
$ | 3,481 | | |
$ | 977 | |
| Reversal/(Provision) for Credit
Losses on Other Assets | |
| — | | |
| — | | |
| (1,135 | ) | |
| — | |
| Net Interest Income after Reversal/(Provision) for Credit
Losses | |
$ | 52,567 | | |
$ | 47,399 | | |
$ | 154,274 | | |
$ | 130,992 | |
| | |
| | | |
| | | |
| | | |
| | |
| Other Income/(Loss), net: | |
| | | |
| | | |
| | | |
| | |
| Net gain/(loss)
on residential whole loans measured at fair value through earnings | |
$ | 143,416 | | |
$ | (132,894 | ) | |
$ | 148,333 | | |
$ | (134,423 | ) |
| Impairment and
other net gain/(loss) on securities and other portfolio investments | |
| 22,928 | | |
| (14,161 | ) | |
| 15,310 | | |
| (15,799 | ) |
| Net gain/(loss)
on real estate owned | |
| 241 | | |
| 2,409 | | |
| 3,112 | | |
| 8,504 | |
| Net gain/(loss)
on derivatives used for risk management purposes | |
| (56,818 | ) | |
| 34,860 | | |
| 9,210 | | |
| 74,103 | |
| Net gain/(loss)
on securitized debt measured at fair value through earnings | |
| (75,273 | ) | |
| 36,431 | | |
| (108,377 | ) | |
| 12,100 | |
| Lima One mortgage
banking income | |
| 8,921 | | |
| 12,109 | | |
| 24,468 | | |
| 32,562 | |
| Net realized
gain/(loss) on residential whole loans held at carrying value | |
| — | | |
| — | | |
| 418 | | |
| — | |
| Other,
net | |
| (3,131 | ) | |
| 1,418 | | |
| 61 | | |
| 9,924 | |
| Other Income/(Loss),
net | |
$ | 40,284 | | |
$ | (59,828 | ) | |
$ | 92,535 | | |
$ | (13,029 | ) |
| | |
| | | |
| | | |
| | | |
| | |
| Operating and Other Expense: | |
| | | |
| | | |
| | | |
| | |
| Compensation and benefits | |
$ | 22,417 | | |
$ | 24,051 | | |
$ | 69,632 | | |
$ | 66,452 | |
| Other general and administrative expense | |
| 11,430 | | |
| 10,075 | | |
| 34,260 | | |
| 31,272 | |
| Loan servicing, financing and other related costs | |
| 8,503 | | |
| 8,989 | | |
| 24,262 | | |
| 26,126 | |
| Amortization of intangible assets | |
| 800 | | |
| 800 | | |
| 2,400 | | |
| 3,400 | |
| Operating
and Other Expense | |
$ | 43,150 | | |
$ | 43,915 | | |
$ | 130,554 | | |
$ | 127,250 | |
| | |
| | | |
| | | |
| | | |
| | |
| Income/(loss) before income taxes | |
$ | 49,701 | | |
$ | (56,344 | ) | |
$ | 116,255 | | |
$ | (9,287 | ) |
| Provision for/(benefit from) income taxes | |
$ | 1,518 | | |
$ | 94 | | |
$ | 2,913 | | |
$ | 295 | |
| Net Income/(Loss) | |
$ | 48,183 | | |
$ | (56,438 | ) | |
$ | 113,342 | | |
$ | (9,582 | ) |
| Less Preferred Stock Dividend Requirement | |
$ | 8,219 | | |
$ | 8,219 | | |
$ | 24,656 | | |
$ | 24,656 | |
| Net
Income/(Loss) Available to Common Stock and Participating Securities | |
$ | 39,964 | | |
$ | (64,657 | ) | |
$ | 88,686 | | |
$ | (34,238 | ) |
| | |
| | | |
| | | |
| | | |
| | |
| Basic Earnings/(Loss) per Common Share | |
$ | 0.38 | | |
$ | (0.64 | ) | |
$ | 0.85 | | |
$ | (0.34 | ) |
| Diluted Earnings/(Loss) per Common Share | |
$ | 0.37 | | |
$ | (0.64 | ) | |
$ | 0.83 | | |
$ | (0.34 | ) |
Segment Reporting
At September 30, 2024, the Company’s
reportable segments include (i) mortgage-related assets and (ii) Lima One. The Corporate column in the table below primarily
consists of corporate cash and related interest income, investments in loan originators and related economics, general and administrative
expenses not directly attributable to Lima One, interest expense on unsecured convertible senior notes, securitization issuance costs,
and preferred stock dividends.
The following tables summarize segment financial
information, which in total reconciles to the same data for the Company as a whole:
| (In
Thousands) | |
Mortgage-Related
Assets | | |
Lima One | | |
Corporate | | |
Total | |
| Three months ended September 30,
2024 | |
| | | |
| | | |
| | | |
| | |
| Interest
Income | |
$ | 101,374 | | |
$ | 77,234 | | |
$ | 3,366 | | |
$ | 181,974 | |
| Interest
Expense | |
| 72,373 | | |
| 54,460 | | |
| 4,516 | | |
| 131,349 | |
| Net
Interest Income/(Expense) | |
$ | 29,001 | | |
$ | 22,774 | | |
$ | (1,150 | ) | |
$ | 50,625 | |
| Reversal/(Provision)
for Credit Losses on Residential Whole Loans | |
| 1,942 | | |
| — | | |
| — | | |
| 1,942 | |
| Reversal/(Provision)
for Credit Losses on Other Assets | |
| — | | |
| — | | |
| — | | |
| — | |
| Net
Interest Income/(Expense) after Reversal/(Provision) for Credit Losses | |
$ | 30,943 | | |
$ | 22,774 | | |
$ | (1,150 | ) | |
$ | 52,567 | |
| | |
| | | |
| | | |
| | | |
| | |
| Net gain/(loss)
on residential whole loans measured at fair value through earnings | |
$ | 117,957 | | |
$ | 25,459 | | |
$ | — | | |
$ | 143,416 | |
| Impairment and
other net gain/(loss) on securities and other portfolio investments | |
| 24,431 | | |
| — | | |
| (1,503 | ) | |
| 22,928 | |
| Net gain on
real estate owned | |
| 656 | | |
| (415 | ) | |
| — | | |
| 241 | |
| Net gain/(loss)
on derivatives used for risk management purposes | |
| (42,823 | ) | |
| (13,995 | ) | |
| — | | |
| (56,818 | ) |
| Net gain/(loss)
on securitized debt measured at fair value through earnings | |
| (53,766 | ) | |
| (21,507 | ) | |
| — | | |
| (75,273 | ) |
| Lima One mortgage
banking income | |
| — | | |
| 8,921 | | |
| — | | |
| 8,921 | |
| Net realized
gain/(loss) on residential whole loans held at carrying value | |
| — | | |
| — | | |
| — | | |
| — | |
| Other,
net | |
| 163 | | |
| (3,757 | ) | |
| 463 | | |
| (3,131 | ) |
| Other
Income/(Loss), net | |
$ | 46,618 | | |
$ | (5,294 | ) | |
$ | (1,040 | ) | |
$ | 40,284 | |
| | |
| | | |
| | | |
| | | |
| | |
| Compensation
and benefits | |
$ | — | | |
$ | 10,757 | | |
$ | 11,660 | | |
$ | 22,417 | |
| Other general
and administrative expense | |
| 70 | | |
| 5,068 | | |
| 6,292 | | |
| 11,430 | |
| Loan servicing,
financing and other related costs | |
| 4,297 | | |
| 595 | | |
| 3,611 | | |
| 8,503 | |
| Amortization
of intangible assets | |
| — | | |
| 800 | | |
| — | | |
| 800 | |
| Income/(loss)
before income taxes | |
$ | 73,194 | | |
$ | 260 | | |
$ | (23,753 | ) | |
$ | 49,701 | |
| Provision
for/(benefit from) income taxes | |
$ | — | | |
$ | — | | |
$ | 1,518 | | |
$ | 1,518 | |
| Net
Income/(Loss) | |
$ | 73,194 | | |
$ | 260 | | |
$ | (25,271 | ) | |
$ | 48,183 | |
| | |
| | | |
| | | |
| | | |
| | |
| Less
Preferred Stock Dividend Requirement | |
$ | — | | |
$ | — | | |
$ | 8,219 | | |
$ | 8,219 | |
| Net
Income/(Loss) Available to Common Stock and Participating Securities | |
$ | 73,194 | | |
$ | 260 | | |
$ | (33,490 | ) | |
$ | 39,964 | |
| (Dollars in Thousands) | |
Mortgage-Related
Assets | | |
Lima One | | |
Corporate | | |
Total | |
| September 30, 2024 | |
| | | |
| | | |
| | | |
| | |
| Total Assets | |
$ | 6,968,000 | | |
$ | 3,831,181 | | |
$ | 360,665 | | |
$ | 11,159,846 | |
| | |
| | | |
| | | |
| | | |
| | |
| December 31, 2023 | |
| | | |
| | | |
| | | |
| | |
| Total Assets | |
$ | 6,370,237 | | |
$ | 4,000,932 | | |
$ | 401,521 | | |
$ | 10,772,690 | |
Reconciliation of GAAP Net Income to non-GAAP Distributable Earnings
“Distributable earnings”
is a non-GAAP financial measure of our operating performance, within the meaning of Regulation G and Item 10(e) of Regulation S-K,
as promulgated by the Securities and Exchange Commission. Distributable earnings is determined by adjusting GAAP net income/(loss) by
removing certain unrealized gains and losses, primarily on residential mortgage investments, associated debt, and hedges that are, in
each case, accounted for at fair value through earnings, certain realized gains and losses, as well as certain non-cash expenses and
securitization-related transaction costs. Realized gains and losses arising from loans sold to third-parties by Lima One shortly after
the origination of such loans are included in Distributable earnings. The transaction costs are primarily comprised of costs only incurred
at the time of execution of our securitizations and include costs such as underwriting fees, legal fees, diligence fees, bank fees and
other similar transaction related expenses. These costs are all incurred prior to or at the execution of our securitizations and do not
recur. Recurring expenses, such as servicing fees, custodial fees, trustee fees and other similar ongoing fees are not excluded from
distributable earnings. During the third quarter of 2024, the Company changed the determination of Distributable earnings to exclude
depreciation, for consistency with the reporting of similar non-cash expenses; this change has been reflected in all periods presented.
Management believes that the adjustments made to GAAP earnings result in the removal of (i) income or expenses that are not reflective
of the longer term performance of our investment portfolio, (ii) certain non-cash expenses, and (iii) expense items required
to be recognized solely due to the election of the fair value option on certain related residential mortgage assets and associated liabilities.
Distributable earnings is one of the factors that our Board of Directors considers when evaluating distributions to our shareholders.
Accordingly, we believe that the adjustments to compute Distributable earnings specified below provide investors and analysts with additional
information to evaluate our financial results.
Distributable earnings should
be used in conjunction with results presented in accordance with GAAP. Distributable earnings does not represent and should not be considered
as a substitute for net income or cash flows from operating activities, each as determined in accordance with GAAP, and our calculation
of this measure may not be comparable to similarly titled measures reported by other companies.
The following table provides
a reconciliation of our GAAP net income/(loss) used in the calculation of basic EPS to our non-GAAP Distributable earnings for the quarterly
periods below:
| | |
Quarter
Ended | |
| (In Thousands, Except Per Share Amounts) | |
September 30,
2024 | | |
June 30,
2024 | | |
March 31,
2024 | | |
December 31,
2023 | | |
September 30,
2023 | |
| GAAP
Net income/(loss) used in the calculation of basic EPS | |
$ | 39,870 | | |
$ | 33,614 | | |
$ | 14,827 | | |
$ | 81,527 | | |
$ | (64,657 | ) |
| Adjustments: | |
| | | |
| | | |
| | | |
| | | |
| | |
| Unrealized and realized gains and losses
on: | |
| | | |
| | | |
| | | |
| | | |
| | |
| Residential whole loans held at fair
value | |
| (143,416 | ) | |
| (16,430 | ) | |
| 11,513 | | |
| (224,272 | ) | |
| 132,894 | |
| Securities held at fair value | |
| (17,107 | ) | |
| 4,026 | | |
| 4,776 | | |
| (21,371 | ) | |
| 13,439 | |
| Residential whole
loans and securities at carrying value | |
| (7,324 | ) | |
| (2,668 | ) | |
| (418 | ) | |
| 332 | | |
| — | |
| Interest rate swaps | |
| 84,629 | | |
| 10,237 | | |
| (23,182 | ) | |
| 97,400 | | |
| (9,433 | ) |
| Securitized debt held at fair value | |
| 71,475 | | |
| 7,597 | | |
| 20,169 | | |
| 108,693 | | |
| (40,229 | ) |
| Investments in loan origination partners | |
| 1,503 | | |
| 1,484 | | |
| — | | |
| 254 | | |
| 722 | |
| Expense items: | |
| | | |
| | | |
| | | |
| | | |
| | |
| Amortization of intangible assets | |
| 800 | | |
| 800 | | |
| 800 | | |
| 800 | | |
| 800 | |
| Equity based compensation | |
| 2,104 | | |
| 3,899 | | |
| 6,243 | | |
| 3,635 | | |
| 4,447 | |
| Securitization-related transaction costs | |
| 3,485 | | |
| 3,009 | | |
| 1,340 | | |
| 2,702 | | |
| 3,217 | |
| Depreciation | |
| 2,604 | | |
| 822 | | |
| 889 | | |
| 869 | | |
| 841 | |
| Total adjustments | |
| (1,247 | ) | |
| 12,776 | | |
| 22,130 | | |
| (30,958 | ) | |
| 106,698 | |
| Distributable
earnings | |
$ | 38,623 | | |
$ | 46,390 | | |
$ | 36,957 | | |
$ | 50,569 | | |
$ | 42,041 | |
| | |
| | | |
| | | |
| | | |
| | | |
| | |
| GAAP
earnings/(loss) per basic common share | |
$ | 0.38 | | |
$ | 0.32 | | |
$ | 0.14 | | |
$ | 0.80 | | |
$ | (0.64 | ) |
| Distributable
earnings per basic common share | |
$ | 0.37 | | |
$ | 0.45 | | |
$ | 0.36 | | |
$ | 0.49 | | |
$ | 0.41 | |
| Weighted average
common shares for basic earnings per share | |
| 103,647 | | |
| 103,446 | | |
| 103,175 | | |
| 102,266 | | |
| 102,255 | |
Reconciliation of GAAP Book Value per Common Share to non-GAAP
Economic Book Value per Common Share
“Economic book value”
is a non-GAAP financial measure of our financial position. To calculate our Economic book value, our portfolios of Residential whole
loans and securitized debt held at carrying value are adjusted to their fair value, rather than the carrying value that is required to
be reported under the GAAP accounting model applied to these financial instruments. These adjustments are also reflected in the table
below in our end of period stockholders’ equity. Management considers that Economic book value provides investors with a useful
supplemental measure to evaluate our financial position as it reflects the impact of fair value changes for all of our investment activities,
irrespective of the accounting model applied for GAAP reporting purposes. Economic book value does not represent and should not be considered
as a substitute for Stockholders’ Equity, as determined in accordance with GAAP, and our calculation of this measure may not be
comparable to similarly titled measures reported by other companies.
The following table provides
a reconciliation of our GAAP book value per common share to our non-GAAP Economic book value per common share as of the quarterly periods
below:
| | |
Quarter
Ended: | |
| (In Millions, Except Per Share Amounts) | |
September 30,
2024 | | |
June 30,
2024 | | |
March 31,
2024 | | |
December 31,
2023 | | |
September 30,
2023 | |
| GAAP
Total Stockholders’ Equity | |
$ | 1,880.5 | | |
$ | 1,883.2 | | |
$ | 1,884.2 | | |
$ | 1,899.9 | | |
$ | 1,848.5 | |
| Preferred
Stock, liquidation preference | |
| (475.0 | ) | |
| (475.0 | ) | |
| (475.0 | ) | |
| (475.0 | ) | |
| (475.0 | ) |
| GAAP Stockholders’
Equity for book value per common share | |
| 1,405.5 | | |
| 1,408.2 | | |
| 1,409.2 | | |
| 1,424.9 | | |
| 1,373.5 | |
| Adjustments: | |
| | | |
| | | |
| | | |
| | | |
| | |
| Fair value adjustment
to Residential whole loans, at carrying value | |
| 6.7 | | |
| (26.8 | ) | |
| (35.4 | ) | |
| (35.6 | ) | |
| (85.3 | ) |
| Fair
value adjustment to Securitized debt, at carrying value | |
| 64.3 | | |
| 82.3 | | |
| 88.4 | | |
| 95.6 | | |
| 122.5 | |
| Stockholders’
Equity including fair value adjustments to Residential whole loans and Securitized debt held at carrying value (Economic book value) | |
$ | 1,476.5 | | |
$ | 1,463.7 | | |
$ | 1,462.2 | | |
$ | 1,484.9 | | |
$ | 1,410.7 | |
| GAAP book value
per common share | |
$ | 13.77 | | |
$ | 13.80 | | |
$ | 13.80 | | |
$ | 13.98 | | |
$ | 13.48 | |
| Economic book
value per common share | |
$ | 14.46 | | |
$ | 14.34 | | |
$ | 14.32 | | |
$ | 14.57 | | |
$ | 13.84 | |
| Number of shares of common stock outstanding | |
| 102.1 | | |
| 102.1 | | |
| 102.1 | | |
| 101.9 | | |
| 101.9 | |
Cautionary Note Regarding Forward-Looking
Statements
When used in this press release or other written
or oral communications, statements that are not historical in nature, including those containing words such as “will,” “believe,”
“expect,” “anticipate,” “estimate,” “plan,” “continue,” “intend,”
“should,” “could,” “would,” “may,” the negative of these words or similar expressions,
are intended to identify “forward-looking statements” within the meaning of Section 27A of the Securities Act of 1933,
as amended, and Section 21E of the Securities Exchange Act of 1934, as amended, and, as such, may involve known and unknown risks,
uncertainties and assumptions. These forward-looking statements include information about possible or assumed future results with respect
to MFA’s business, financial condition, liquidity, results of operations, plans and objectives. Among the important factors that
could cause our actual results to differ materially from those projected in any forward-looking statements that we make are: general
economic developments and trends and the performance of the housing, real estate, mortgage finance, broader financial markets; inflation,
increases in interest rates and changes in the market (i.e., fair) value of MFA’s residential whole loans, MBS, securitized debt
and other assets, as well as changes in the value of MFA’s liabilities accounted for at fair value through earnings; the effectiveness
of hedging transactions; changes in the prepayment rates on residential mortgage assets, an increase of which could result in a reduction
of the yield on certain investments in its portfolio and could require MFA to reinvest the proceeds received by it as a result of such
prepayments in investments with lower coupons, while a decrease in which could result in an increase in the interest rate duration of
certain investments in MFA’s portfolio making their valuation more sensitive to changes in interest rates and could result in lower
forecasted cash flows; credit risks underlying MFA’s assets, including changes in the default rates and management’s assumptions
regarding default rates and loss severities on the mortgage loans in MFA’s residential whole loan portfolio; MFA’s ability
to borrow to finance its assets and the terms, including the cost, maturity and other terms, of any such borrowings; implementation of
or changes in government regulations or programs affecting MFA’s business; MFA’s estimates regarding taxable income, the
actual amount of which is dependent on a number of factors, including, but not limited to, changes in the amount of interest income and
financing costs, the method elected by MFA to accrete the market discount on residential whole loans and the extent of prepayments, realized
losses and changes in the composition of MFA’s residential whole loan portfolios that may occur during the applicable tax period,
including gain or loss on any MBS disposals or whole loan modifications, foreclosures and liquidations; the timing and amount of distributions
to stockholders, which are declared and paid at the discretion of MFA’s Board of Directors and will depend on, among other things,
MFA’s taxable income, its financial results and overall financial condition and liquidity, maintenance of its REIT qualification
and such other factors as MFA’s Board of Directors deems relevant; MFA’s ability to maintain its qualification as a REIT
for federal income tax purposes; MFA’s ability to maintain its exemption from registration under the Investment Company Act of
1940, as amended (or the “Investment Company Act”), including statements regarding the concept release issued by the Securities
and Exchange Commission (“SEC”) relating to interpretive issues under the Investment Company Act with respect to the status
under the Investment Company Act of certain companies that are engaged in the business of acquiring mortgages and mortgage-related interests;
MFA’s ability to continue growing its residential whole loan portfolio, which is dependent on, among other things, the supply of
loans offered for sale in the market; targeted or expected returns on our investments in recently-originated mortgage loans, the performance
of which is, similar to our other mortgage loan investments, subject to, among other things, differences in prepayment risk, credit risk
and financing costs associated with such investments; risks associated with the ongoing operation of Lima One Holdings, LLC (including,
without limitation, industry competition, unanticipated expenditures relating to or liabilities arising from its operation (including,
among other things, a failure to realize management’s assumptions regarding expected growth in business purpose loan (BPL) origination
volumes and credit risks underlying BPLs, including changes in the default rates and management’s assumptions regarding default
rates and loss severities on the BPLs originated by Lima One)); expected returns on MFA’s investments in nonperforming residential
whole loans (“NPLs”), which are affected by, among other things, the length of time required to foreclose upon, sell, liquidate
or otherwise reach a resolution of the property underlying the NPL, home price values, amounts advanced to carry the asset (e.g., taxes,
insurance, maintenance expenses, etc. on the underlying property) and the amount ultimately realized upon resolution of the asset;
risks associated with our investments in MSR-related assets, including servicing, regulatory and economic risks; risks associated with
our investments in loan originators; risks associated with investing in real estate assets generally, including changes in business conditions
and the general economy; and other risks, uncertainties and factors, including those described in the annual, quarterly and current reports
that we file with the SEC. These forward-looking statements are based on beliefs, assumptions and expectations of MFA’s future
performance, taking into account information currently available. Readers and listeners are cautioned not to place undue reliance on
these forward-looking statements, which speak only as of the date on which they are made. New risks and uncertainties arise over time
and it is not possible to predict those events or how they may affect MFA. Except as required by law, MFA is not obligated to, and does
not intend to, update or revise any forward-looking statements, whether as a result of new information, future events or otherwise.
Exhibit 99.2
Company Update THIRD QUARTER 2024

2 Q3 202 2 Financial Snapshot Forward - looking statements When used in this presentation or other written or oral communications, statements that are not historical in nature, including those containing words such as “will,” “believe,” “expect,” “anticipate,” “estimate,” “plan,” “continue,” “intend,” “should,” “could,” “would,” “may,” the negative of these words or similar expressions, are intended to identify “forward - looking statements” within the meaning of Section 27 A of the Securities Act of 1933 , as amended, and Section 21 E of the Securities Exchange Act of 1934 , as amended, and, as such, may involve known and unknown risks, uncertainties and assumptions . These forward - looking statements include information about possible or assumed future results with respect to MFA’s business, financial condition, liquidity, results of operations, plans and objectives . Among the important factors that could cause our actual results to differ materially from those projected in any forward - looking statements that we make are : general economic developments and trends and the performance of the housing, real estate, mortgage finance, broader financial markets ; inflation, increases in interest rates and changes in the market (i . e . , fair) value of MFA’s residential whole loans, MBS, securitized debt and other assets, as well as changes in the value of MFA’s liabilities accounted for at fair value through earnings ; the effectiveness of hedging transactions ; changes in the prepayment rates on residential mortgage assets, an increase of which could result in a reduction of the yield on certain investments in its portfolio and could require MFA to reinvest the proceeds received by it as a result of such prepayments in investments with lower coupons, while a decrease in which could result in an increase in the interest rate duration of certain investments in MFA’s portfolio making their valuation more sensitive to changes in interest rates and could result in lower forecasted cash flows ; credit risks underlying MFA’s assets, including changes in the default rates and management’s assumptions regarding default rates and loss severities on the mortgage loans in MFA’s residential whole loan portfolio ; MFA’s ability to borrow to finance its assets and the terms, including the cost, maturity and other terms, of any such borrowings ; implementation of or changes in government regulations or programs affecting MFA’s business ; MFA’s estimates regarding taxable income, the actual amount of which is dependent on a number of factors, including, but not limited to, changes in the amount of interest income and financing costs, the method elected by MFA to accrete the market discount on residential whole loans and the extent of prepayments, realized losses and changes in the composition of MFA’s residential whole loan portfolios that may occur during the applicable tax period, including gain or loss on any MBS disposals or whole loan modifications, foreclosures and liquidations ; the timing and amount of distributions to stockholders, which are declared and paid at the discretion of MFA’s Board of Directors and will depend on, among other things, MFA’s taxable income, its financial results and overall financial condition and liquidity, maintenance of its REIT qualification and such other factors as MFA’s Board of Directors deems relevant ; MFA’s ability to maintain its qualification as a REIT for federal income tax purposes ; MFA’s ability to maintain its exemption from registration under the Investment Company Act of 1940 , as amended (or the “Investment Company Act”), including statements regarding the concept release issued by the Securities and Exchange Commission (“SEC”) relating to interpretive issues under the Investment Company Act with respect to the status under the Investment Company Act of certain companies that are engaged in the business of acquiring mortgages and mortgage - related interests ; MFA’s ability to continue growing its residential whole loan portfolio, which is dependent on, among other things, the supply of loans offered for sale in the market ; targeted or expected returns on our investments in recently - originated mortgage loans, the performance of which is, similar to our other mortgage loan investments, subject to, among other things, differences in prepayment risk, credit risk and financing costs associated with such investments ; risks associated with the ongoing operation of Lima One Holdings, LLC (including, without limitation, industry competition, unanticipated expenditures relating to or liabilities arising from its operation (including, among other things, a failure to realize management’s assumptions regarding expected growth in business purpose loan (BPL) origination volumes and credit risks underlying BPLs, including changes in the default rates and management’s assumptions regarding default rates and loss severities on the BPLs originated by Lima One) ; expected returns on MFA’s investments in nonperforming residential whole loans (“NPLs”), which are affected by, among other things, the length of time required to foreclose upon, sell, liquidate or otherwise reach a resolution of the property underlying the NPL, home price values, amounts advanced to carry the asset (e . g . , taxes, insurance, maintenance expenses, etc . on the underlying property) and the amount ultimately realized upon resolution of the asset ; risks associated with our investments in MSR - related assets, including servicing, regulatory and economic risks ; risks associated with our investments in loan originators ; risks associated with investing in real estate assets generally, including changes in business conditions and the general economy ; and other risks, uncertainties and factors, including those described in the annual, quarterly and current reports that we file with the SEC . These forward - looking statements are based on beliefs, assumptions and expectations of MFA’s future performance, taking into account information currently available . Readers and listeners are cautioned not to place undue reliance on these forward - looking statements, which speak only as of the date on which they are made . New risks and uncertainties arise over time and it is not possible to predict those events or how they may affect MFA . Except as required by law, MFA is not obligated to, and does not intend to, update or revise any forward - looking statements, whether as a result of new information, future events or otherwise .
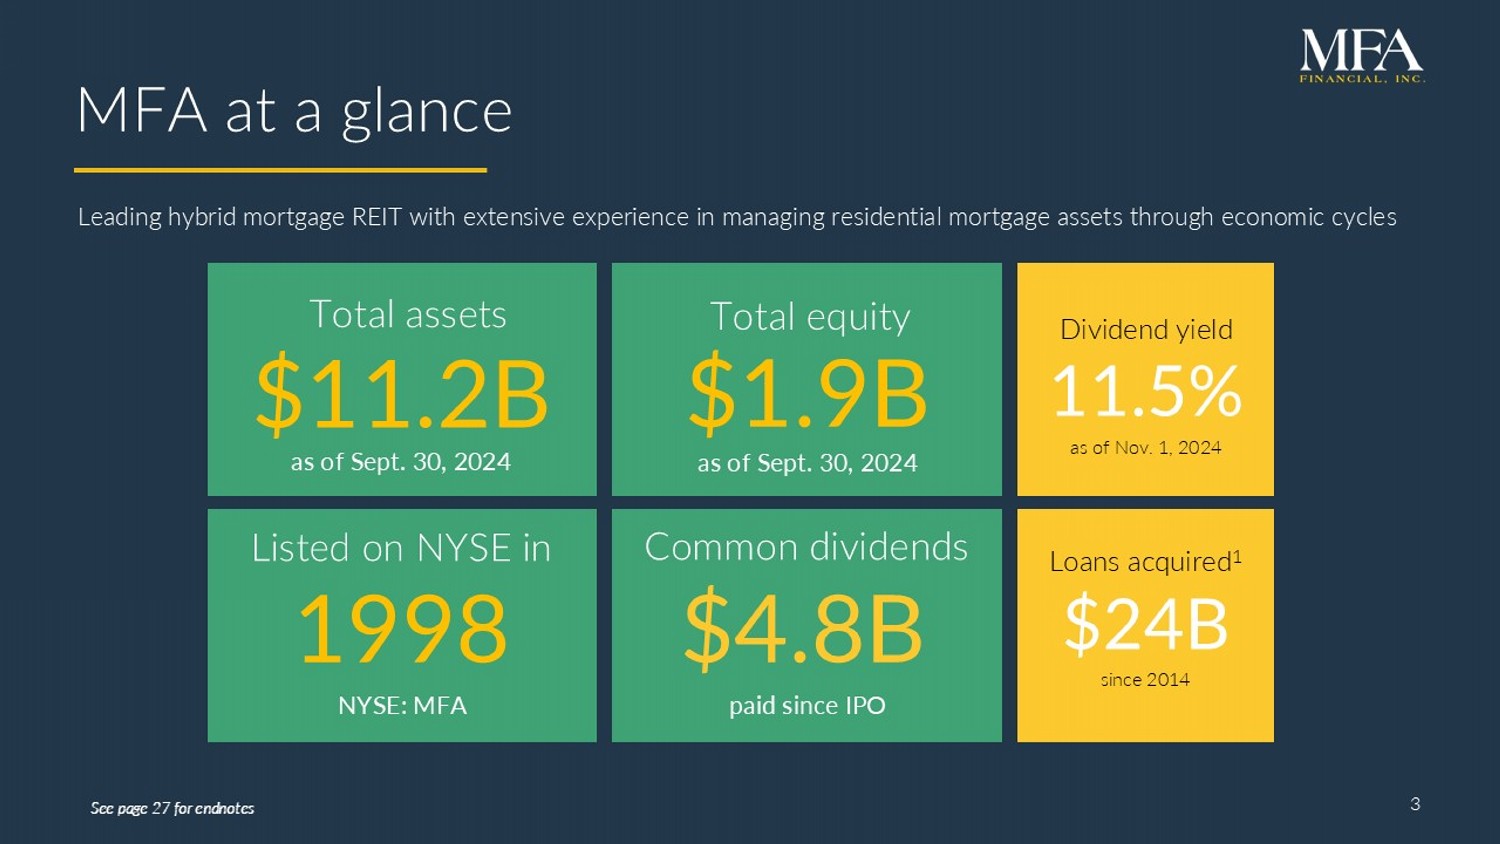
3 v MFA at a glance 3 $1.9B Total equity 1998 Listed on NYSE in Leading hybrid mortgage REIT with extensive experience in managing residential mortgage assets through economic cycles $11.2B Total assets NYSE: MFA $4.8B Common dividends as of Sept. 30, 2024 as of Sept. 30, 2024 paid since IPO See page 27 for endnotes Dividend yield 11.5% as of Nov. 1, 2024 Loans acquired 1 $24B since 2014
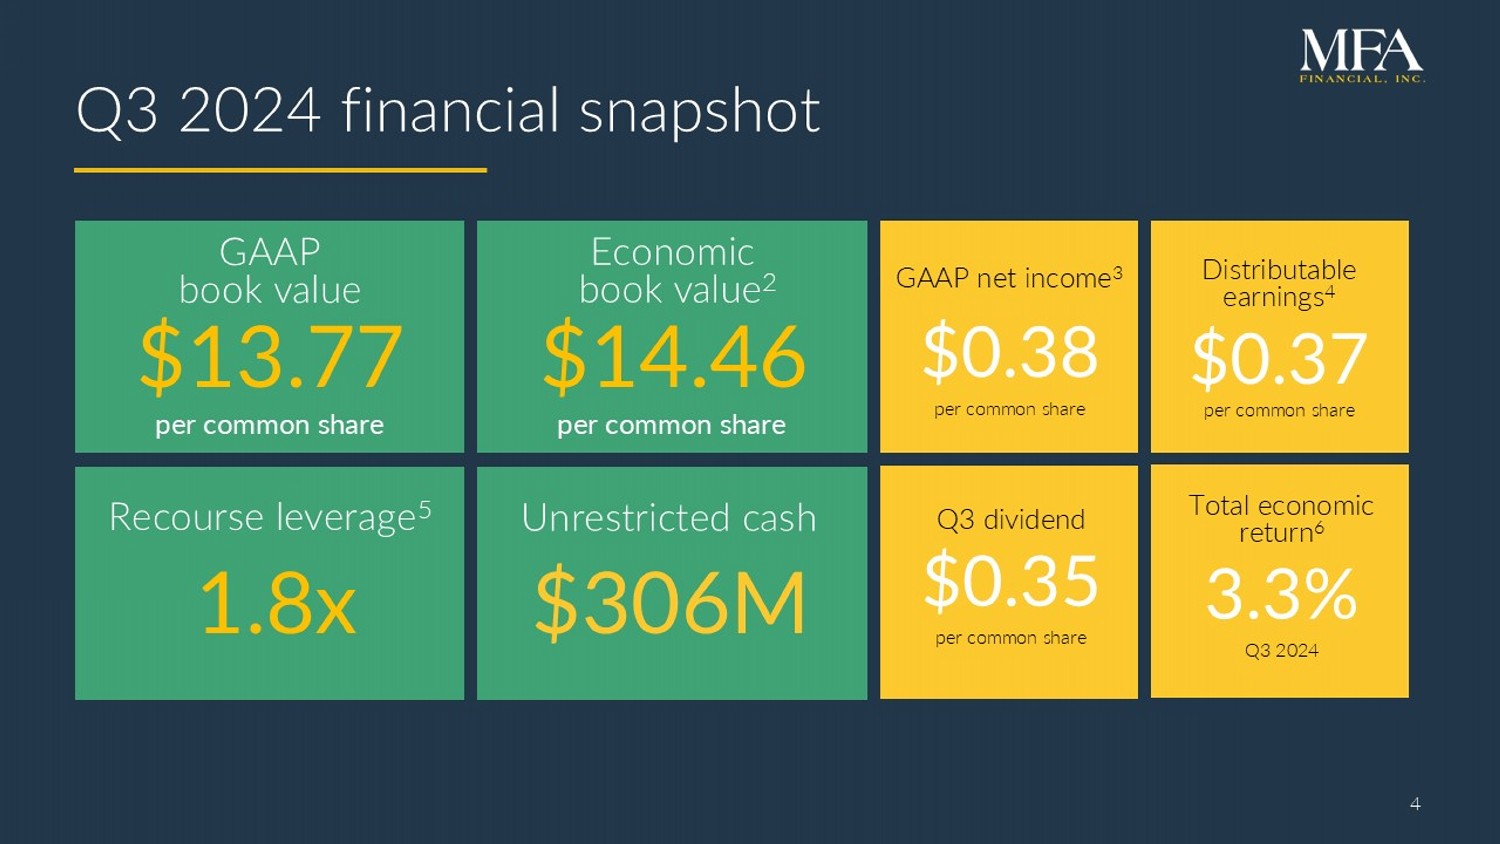
4 Q 3 202 4 financial snapshot $13.77 $14.46 GAAP net income 3 $0.38 per common share Distributable earnings 4 $0.37 per common share GAAP book value Economic book value 2 per common share per common share $306M Unrestricted cash 1.8x Recourse leverage 5 4 Q3 dividend $0.35 per common share Total economic return 6 3.3% Q3 2024

5 Q3 2024 Company Highlights □ Strengthened leadership team at MFA and Lima One ▪ Named Bryan Wulfsohn President and Chief Investment Officer ▪ Named Lori Samuels Chief Loan Operations Officer ▪ Appointed Josh Woodward CEO of Lima One following retirement of Jeff Tennyson □ Delivered strong earnings and total economic return of 3.3% ▪ Distributable earnings of $0.37 per share ▪ Economic book value rose by approximately 1% to $14.46 per share ▪ Declared and paid $0.35 dividend □ Acquired or originated $565M of high - yielding residential mortgage loans ▪ Lima One originated loans with a maximum UPB of $312M 7 at average coupon of 10% □ Issued two securitizations collateralized by $643M UPB of loans □ Added $294M of Agency MBS, growing portfolio to nearly $1B □ Ended Q3 with $306M of unrestricted cash
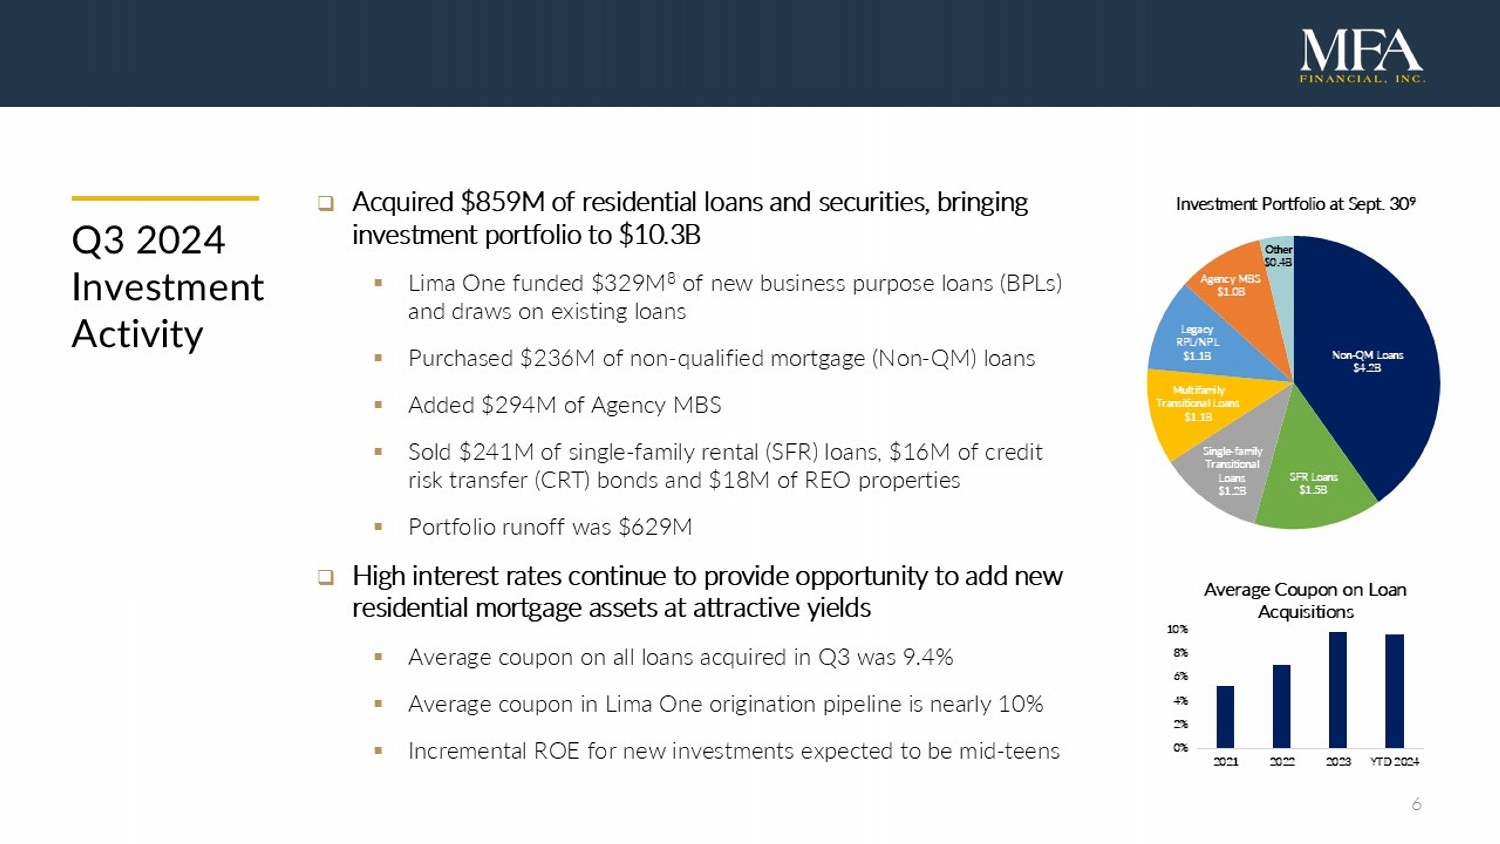
6 □ Acquired $859M of residential loans and securities, bringing investment portfolio to $10.3B ▪ Lima One funded $329M 8 of new business purpose loans (BPLs) and draws on existing loans ▪ Purchased $236M of non - qualified mortgage (Non - QM) loans ▪ Added $294M of Agency MBS ▪ Sold $241M of single - family rental (SFR) loans, $16M of credit risk transfer (CRT) bonds and $18M of REO properties ▪ Portfolio runoff was $629M □ High interest rates continue to provide opportunity to add new residential mortgage assets at attractive yields ▪ Average coupon on all loans acquired in Q3 was 9.4% ▪ Average coupon in Lima One origination pipeline is nearly 10% ▪ Incremental ROE for new investments expected to be mid - teens Q3 2024 Investment Activity 0% 2% 4% 6% 8% 10% 2021 2022 2023 YTD 2024 Average Coupon on Loan Acquisitions Non - QM Loans $4.2B SFR Loans $1.5B Single - family Transitional Loans $1.2B Multifamily Transitional Loans $1.1B Legacy RPL/NPL $1.1B Agency MBS $1.0B Other $0.4B Investment Portfolio at Sept. 30 9
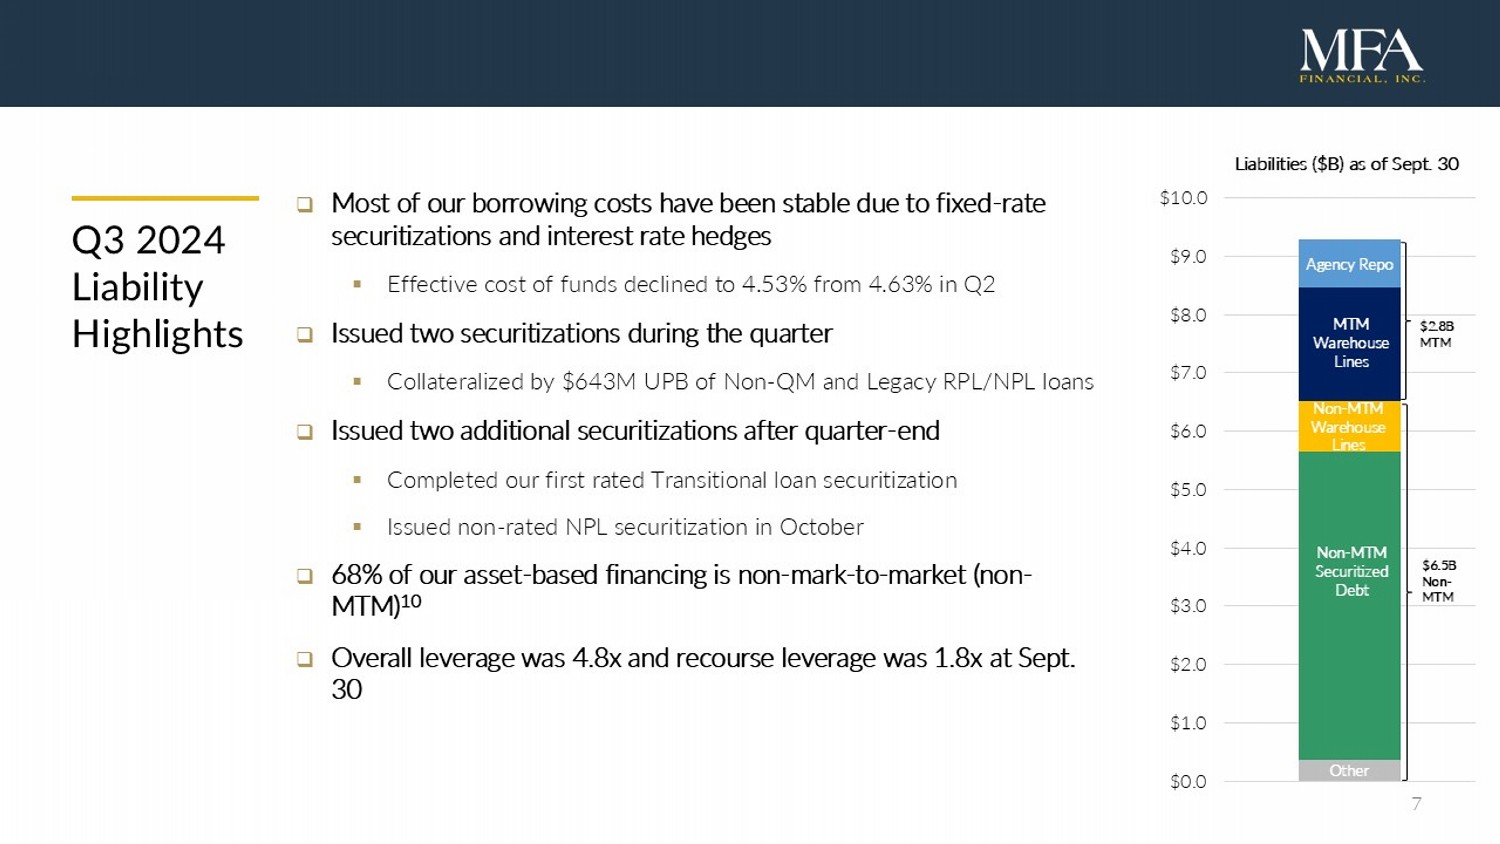
7 Q3 2024 Liability Highlights □ Most of our borrowing costs have been stable due to fixed - rate securitizations and interest rate hedges ▪ Effective cost of funds declined to 4.53% from 4.63% in Q2 □ Issued two securitizations during the quarter ▪ Collateralized by $643M UPB of Non - QM and Legacy RPL/NPL loans □ Issued two additional securitizations after quarter - end ▪ Completed our first rated Transitional loan securitization ▪ Issued non - rated NPL securitization in October □ 68% of our asset - based financing is non - mark - to - market (non - MTM) 10 □ Overall leverage was 4.8x and recourse leverage was 1.8x at Sept. 30 MTM Warehouse Line Non - MTM Warehouse Line Non - MTM Securitized Debt Other $2.8B MTM $6.5B Non - MTM $0.0 $1.0 $2.0 $3.0 $4.0 $5.0 $6.0 $7.0 $8.0 $9.0 $10.0 Liabilities ($B) as of Sept. 30 Agency Repo MTM Warehouse Lines Non - MTM Warehouse Lines Non - MTM Securitized Debt Other
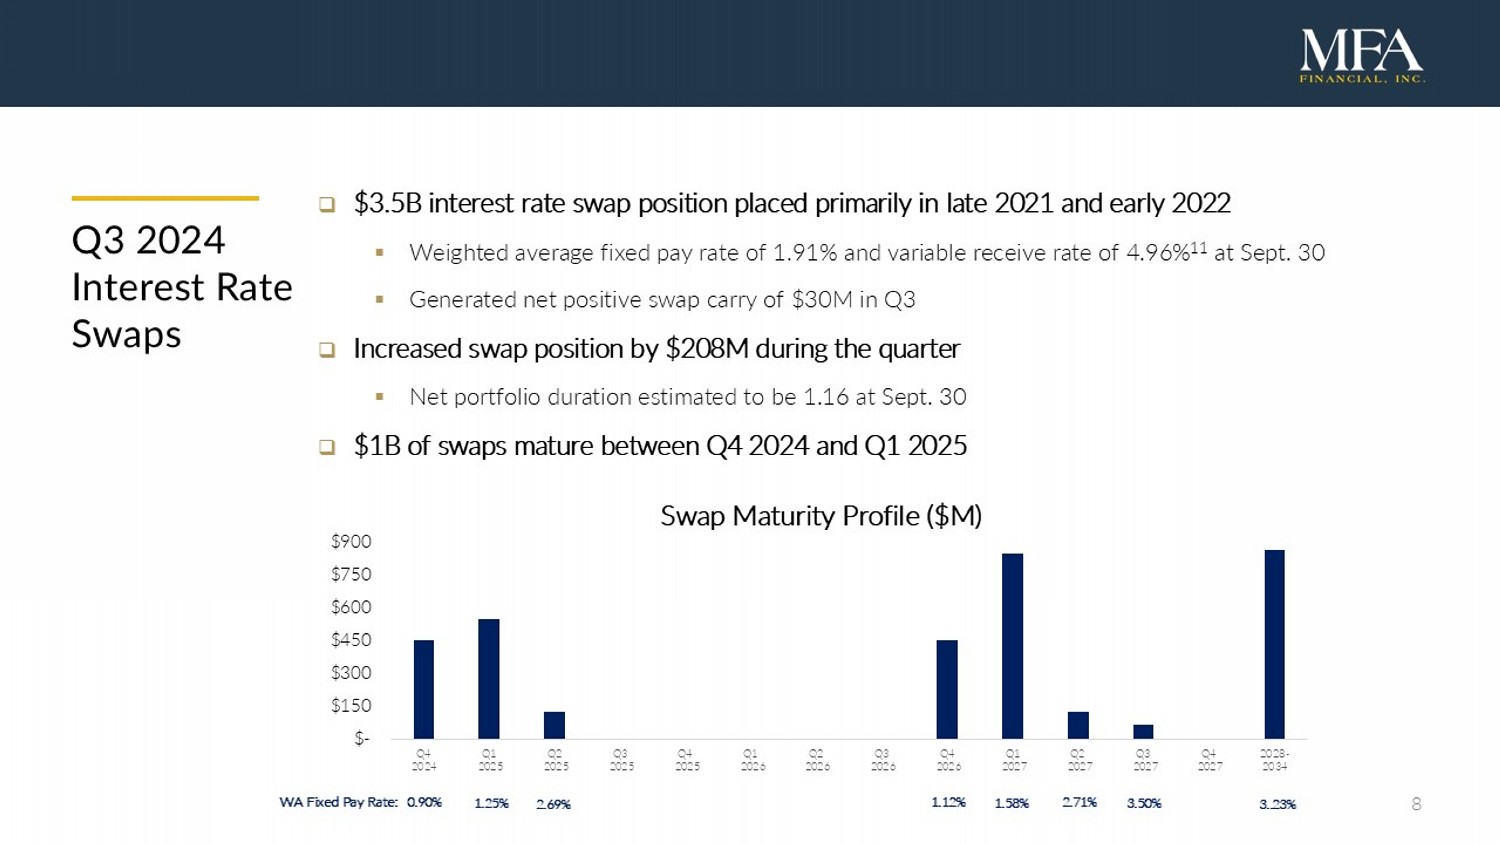
8 Q3 2024 Interest Rate Swaps □ $3.5B interest rate swap position placed primarily in late 2021 and early 2022 ▪ Weighted average fixed pay rate of 1.91% and variable receive rate of 4.96% 11 at Sept. 30 ▪ Generated net positive swap carry of $30M in Q3 □ Increased swap position by $208M during the quarter ▪ Net portfolio duration estimated to be 1.16 at Sept. 30 □ $1B of swaps mature between Q4 2024 and Q1 2025 0.90% 1.25% WA Fixed Pay Rate: 2.69% 1.12% 1.58% 2.71% 3..23% 3.50% $- $150 $300 $450 $600 $750 $900 Q4 2024 Q1 2025 Q2 2025 Q3 2025 Q4 2025 Q1 2026 Q2 2026 Q3 2026 Q4 2026 Q1 2027 Q2 2027 Q3 2027 Q4 2027 2028- 2034 Swap Maturity Profile ($M)
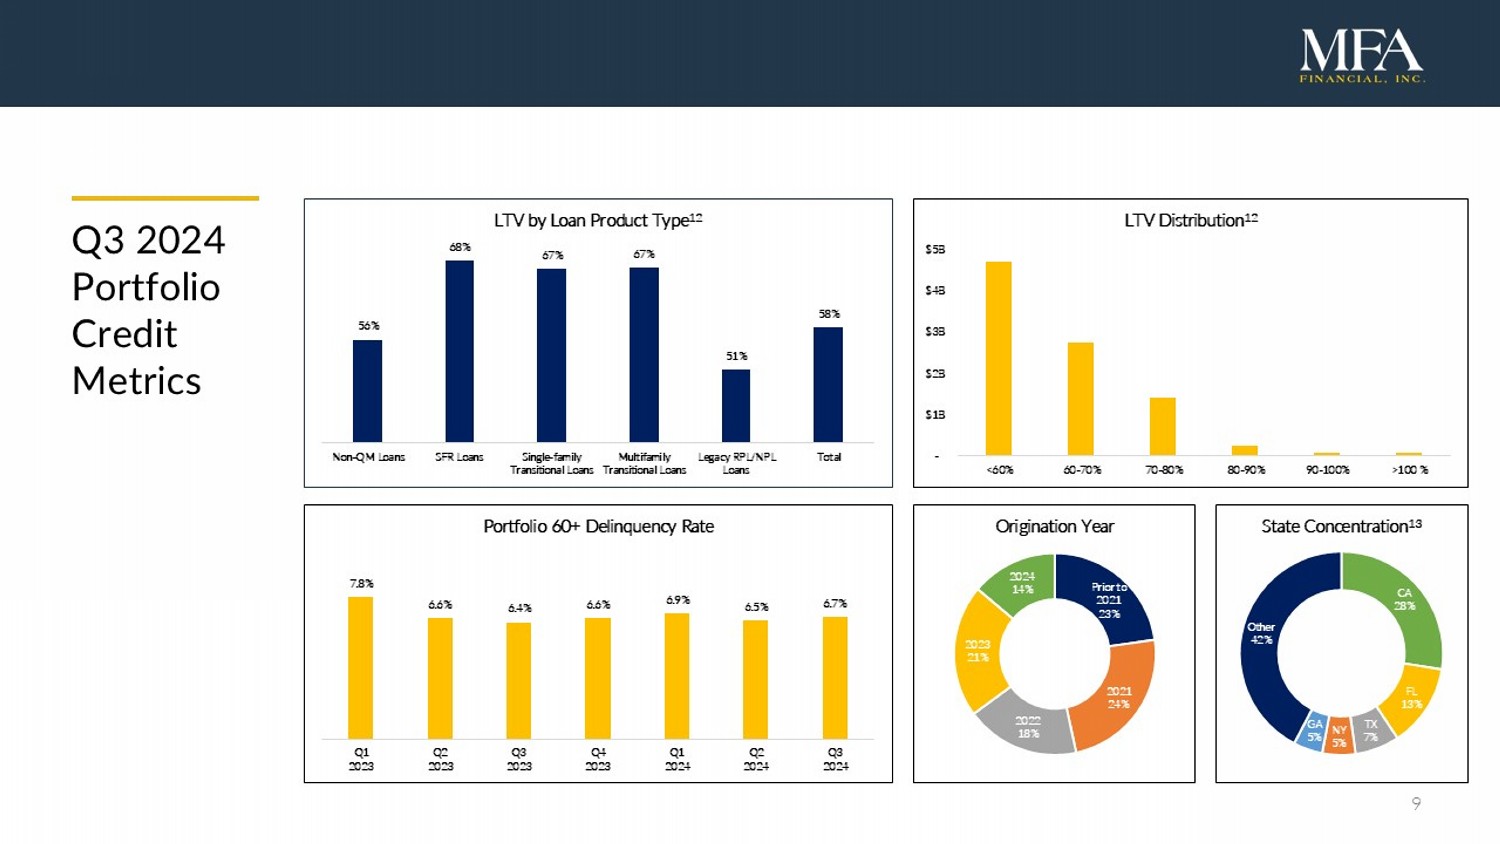
9 Q3 2024 Portfolio Credit Metrics CA 28% FL 13% TX 7% NY 5% GA 5% Other 42% State Concentration 13 56% 68% 67% 67% 51% 58% Non-QM Loans SFR Loans Single-family Transitional Loans Multifamily Transitional Loans Legacy RPL/NPL Loans Total LTV by Loan Product Type 12 - $1B $2B $3B $4B $5B <60% 60-70% 70-80% 80-90% 90-100% >100 % LTV Distribution 12 7.8% 6.6% 6.4% 6.6% 6.9% 6.5% 6.7% Q1 2023 Q2 2023 Q3 2023 Q4 2023 Q1 2024 Q2 2024 Q3 2024 Portfolio 60+ Delinquency Rate Prior to 2021 23% 2021 24% 2022 18% 2023 21% 2024 14% Origination Year
10 □ Origination volume declined to $312M in Q3 □ Single - family Transitional loan originations totaled $236M ▪ $51M of bridge loans ▪ $83M of rehab (“fix/flip”) loans ▪ $102M of ground - up construction loans □ SFR loan originations were $76M □ Initiated programmatic sales of new origination to 3 rd party investors □ Regular loan sales strengthen Lima One’s franchise value and enhance MFA’s returns □ Sold $77M of newly - originated SFR loans, generating over $3M of gain - on - sale income □ Mortgage banking income totaled $8.9M for the quarter Q3 2024 Lima One Highlights
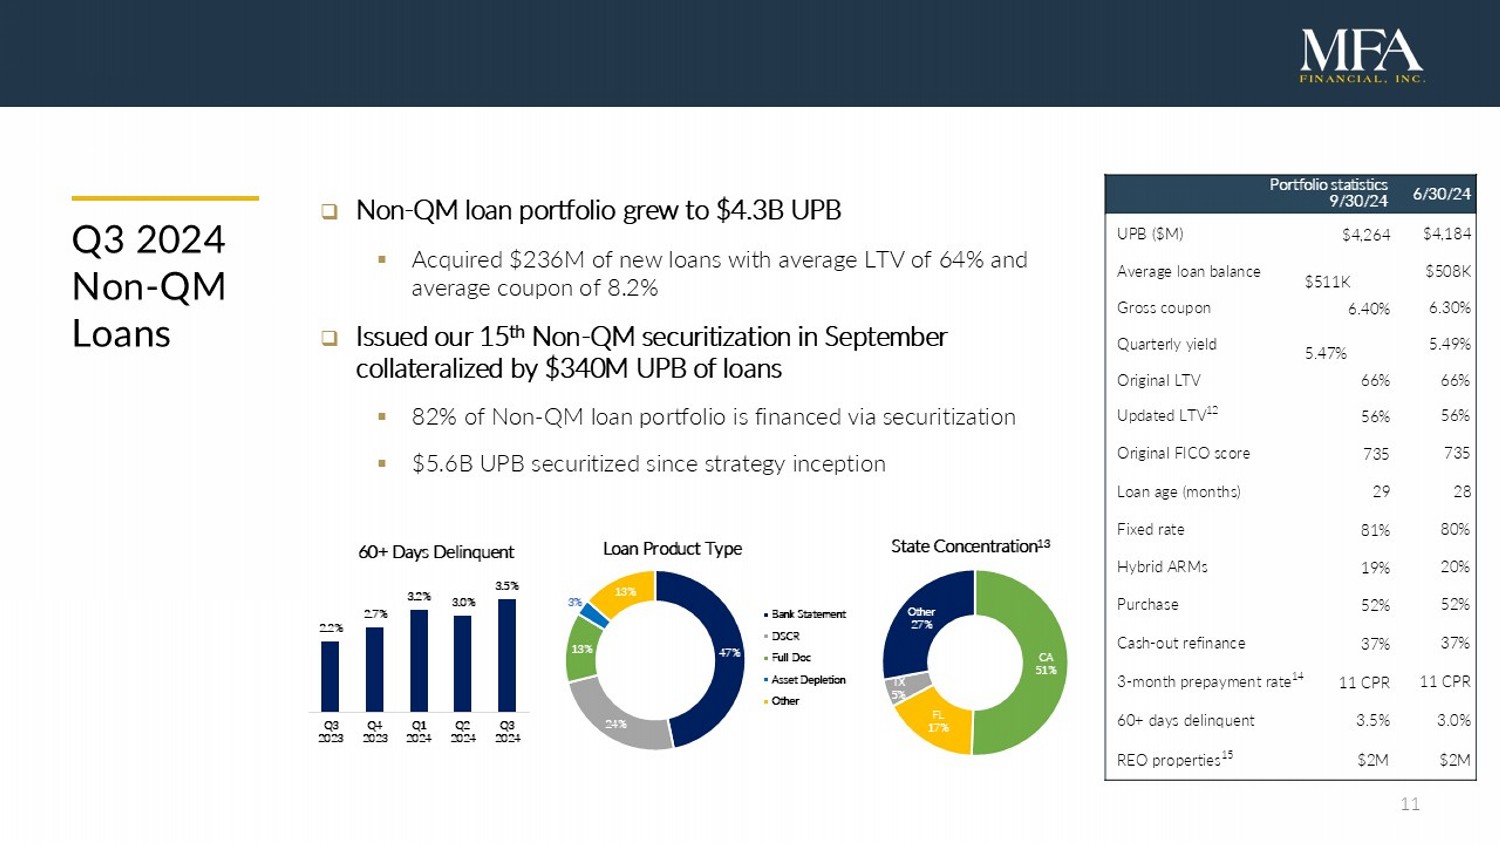
11 Q3 2024 Non - QM Loans □ Non - QM loan portfolio grew to $4.3B UPB ▪ Acquired $236M of new loans with average LTV of 64% and average coupon of 8.2% □ Issued our 15 th Non - QM securitization in September collateralized by $340M UPB of loans ▪ 82% of Non - QM loan portfolio is financed via securitization ▪ $5.6B UPB securitized since strategy inception 6/30/24 P ortfolio s tatistics 9/30/24 $4,184 1 $4,264 UPB ($M) $508K 1 $511K Average loan balance 6.30% 1 6.40% Gross coupon 5.49% 1 5.47% Quarterly yield 66% 1 66% Original LTV 56% 1 56% Updated LTV 12 735 1 735 Original FICO score 28 1 29 Loan age (months) 80% 1 81% Fixed rate 20% 1 19% Hybrid ARMs 52% 1 52% Purchase 37% 1 37% Cash - out refinance 11 CPR 1 11 CPR 3 - month prepayment rate 14 3.0% 1 3.5% 60+ days delinquent $2M 1 $2M REO properties 15 CA 51% FL 17% TX 5% Other 27% State Concentration 13 2.2% 2.7% 3.2% 3.0% 3.5% Q3 2023 Q4 2023 Q1 2024 Q2 2024 Q3 2024 60+ Days Delinquent 47% 24% 13% 3% 13% Loan Product Type Bank Statement DSCR Full Doc Asset Depletion Other
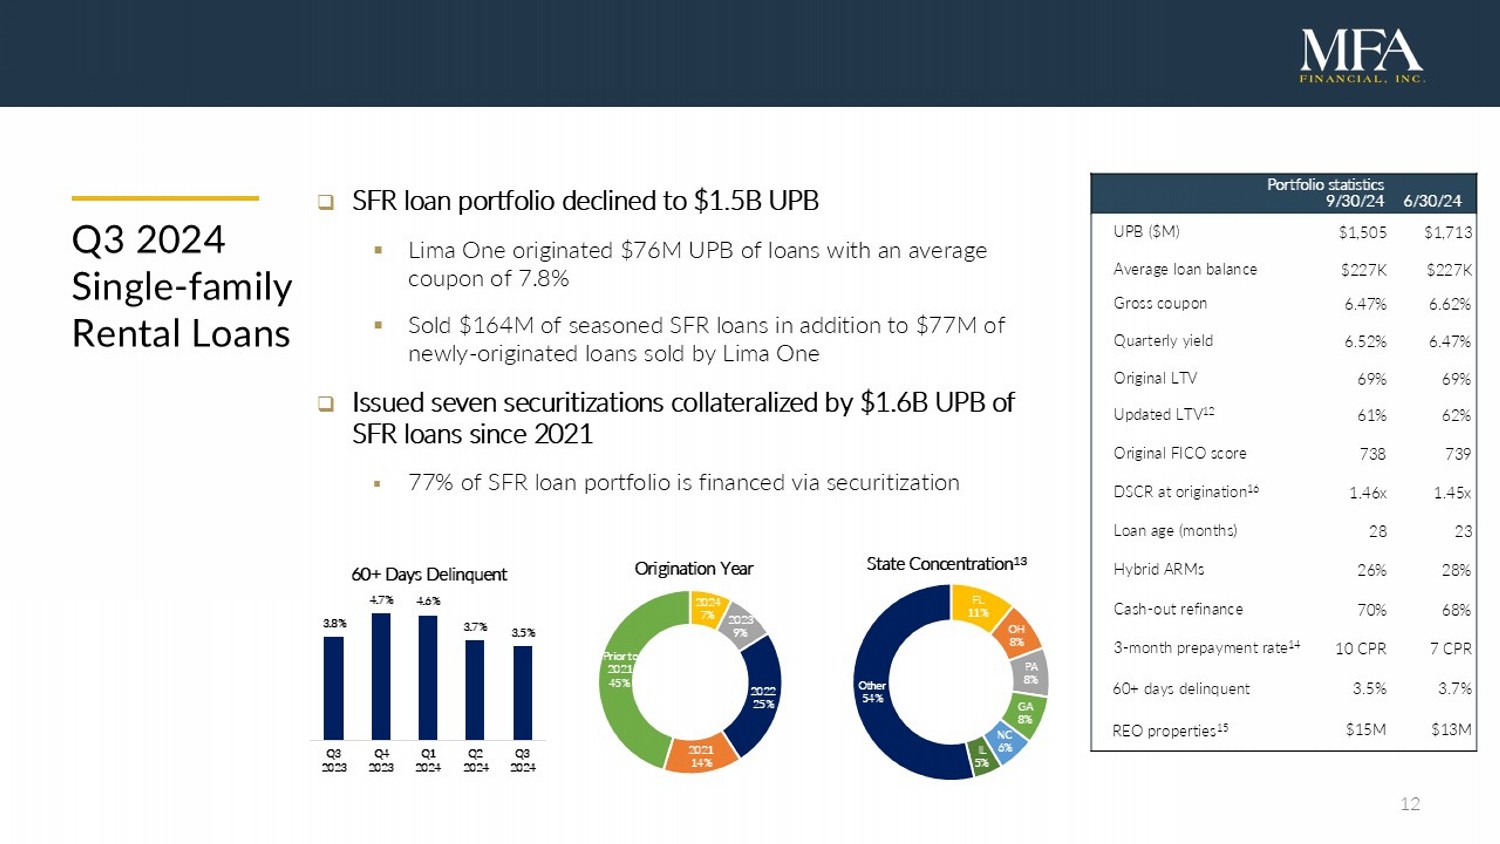
12 6/30/24 P ortfolio s tatistics 9/30/24 $1,713 d $1,505 UPB ($M) $227K d $227K Average loan balance 6.62% d 6.47% Gross coupon 6.47% d 6.52% Quarterly yield 69% d 69% Original LTV 62% d 61% Updated LTV 12 739 d 738 Original FICO score 1.45x d 1.46x DSCR at origination 16 23 d 28 Loan age (months) 28% d 26% Hybrid ARMs 68% d 70% Cash - out refinance 7 CPR d 10 CPR 3 - month prepayment rate 14 3.7% d 3.5% 60+ days delinquent $13M d $15M REO properties 15 Q3 2024 Single - family Rental Loans □ SFR loan portfolio declined to $1.5B UPB ▪ Lima One originated $76M UPB of loans with an average coupon of 7.8% ▪ Sold $164M of seasoned SFR loans in addition to $77M of newly - originated loans sold by Lima One □ Issued seven securitizations collateralized by $1.6B UPB of SFR loans since 2021 ▪ 77% of SFR loan portfolio is financed via securitization FL 11% OH 8% PA 8% GA 8% NC 6% IL 5% Other 54% State Concentration 13 3.8% 4.7% 4.6% 3.7% 3.5% Q3 2023 Q4 2023 Q1 2024 Q2 2024 Q3 2024 60+ Days Delinquent 2024 7% 2023 9% 2022 25% 2021 14% Prior to 2021 45% Origination Year
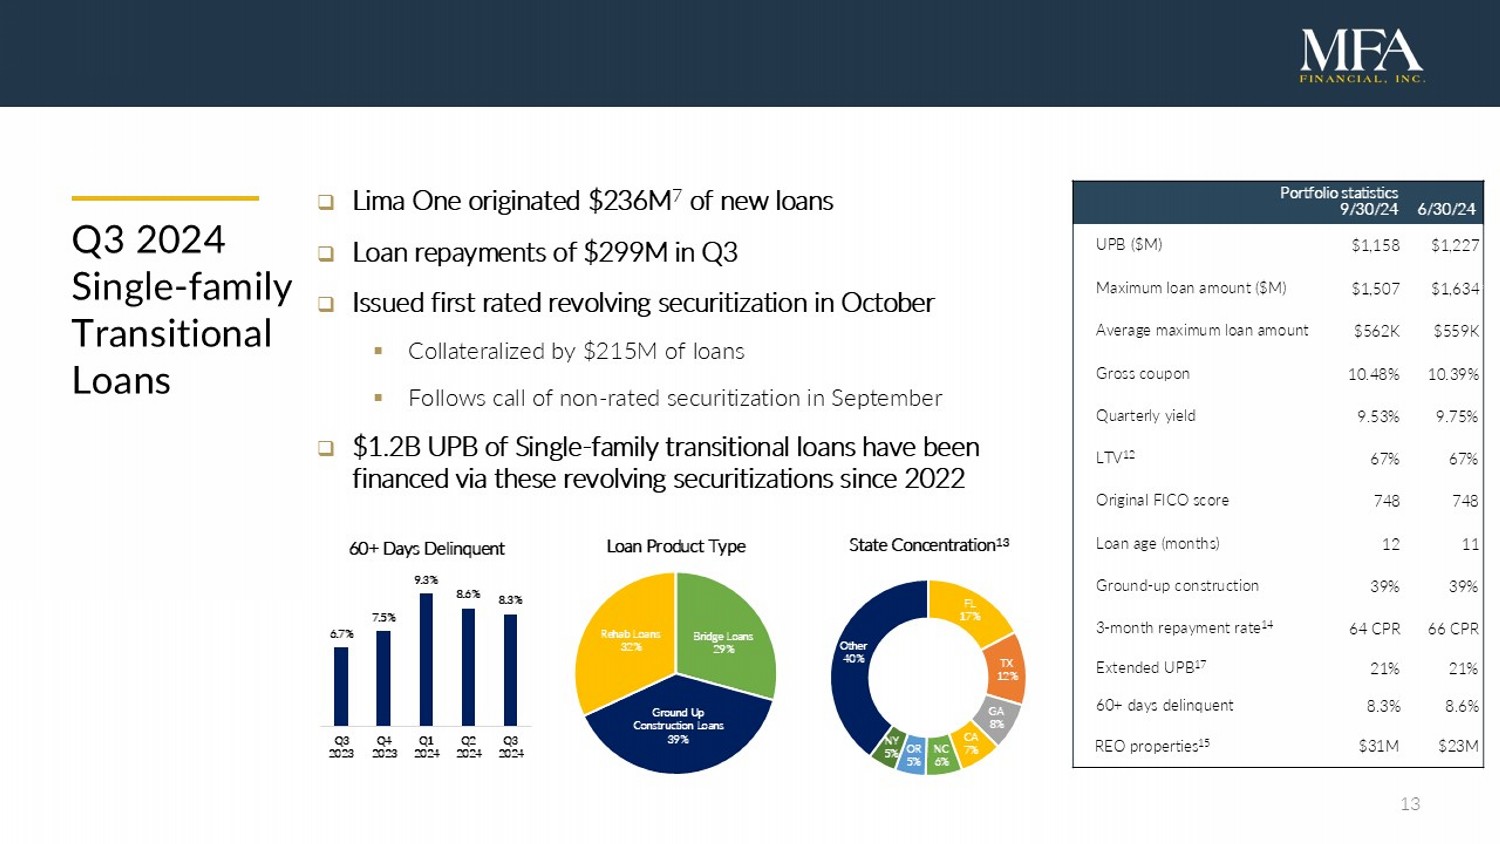
13 6/30/24 Portfolio s tatistics 9/30/24 $1,227 d $1,158 UPB ($M) $1,634 f $1,507 Maximum loan amount ($M) $559K d $562K Average maximum loan amount 10.39% d 10.48% Gross coupon 9.75% d 9.53% Quarterly yield 67% d 67% LTV 12 748 d 748 Original FICO score 11 d 12 Loan age (months) 39% d 39% Ground - up construction 66 CPR d 64 CPR 3 - month repayment rate 14 21% d 21% Extended UPB 17 8.6% d 8.3% 60+ days delinquent $23M d $31M REO properties 15 Q3 2024 Single - family Transitional Loans □ Lima One originated $236M 7 of new loans □ Loan repayments of $299M in Q3 □ Issued first rated revolving securitization in October ▪ Collateralized by $215M of loans ▪ Follows call of non - rated securitization in September □ $1.2B UPB of Single - family transitional loans have been financed via these revolving securitizations since 2022 Bridge Loans 29% Ground Up Construction Loans 39% Rehab Loans 32% Loan Product Type FL 17% TX 12% GA 8% CA 7% NC 6% OR 5% NY 5% Other 40% State Concentration 13 6.7% 7.5% 9.3% 8.6% 8.3% Q3 2023 Q4 2023 Q1 2024 Q2 2024 Q3 2024 60+ Days Delinquent
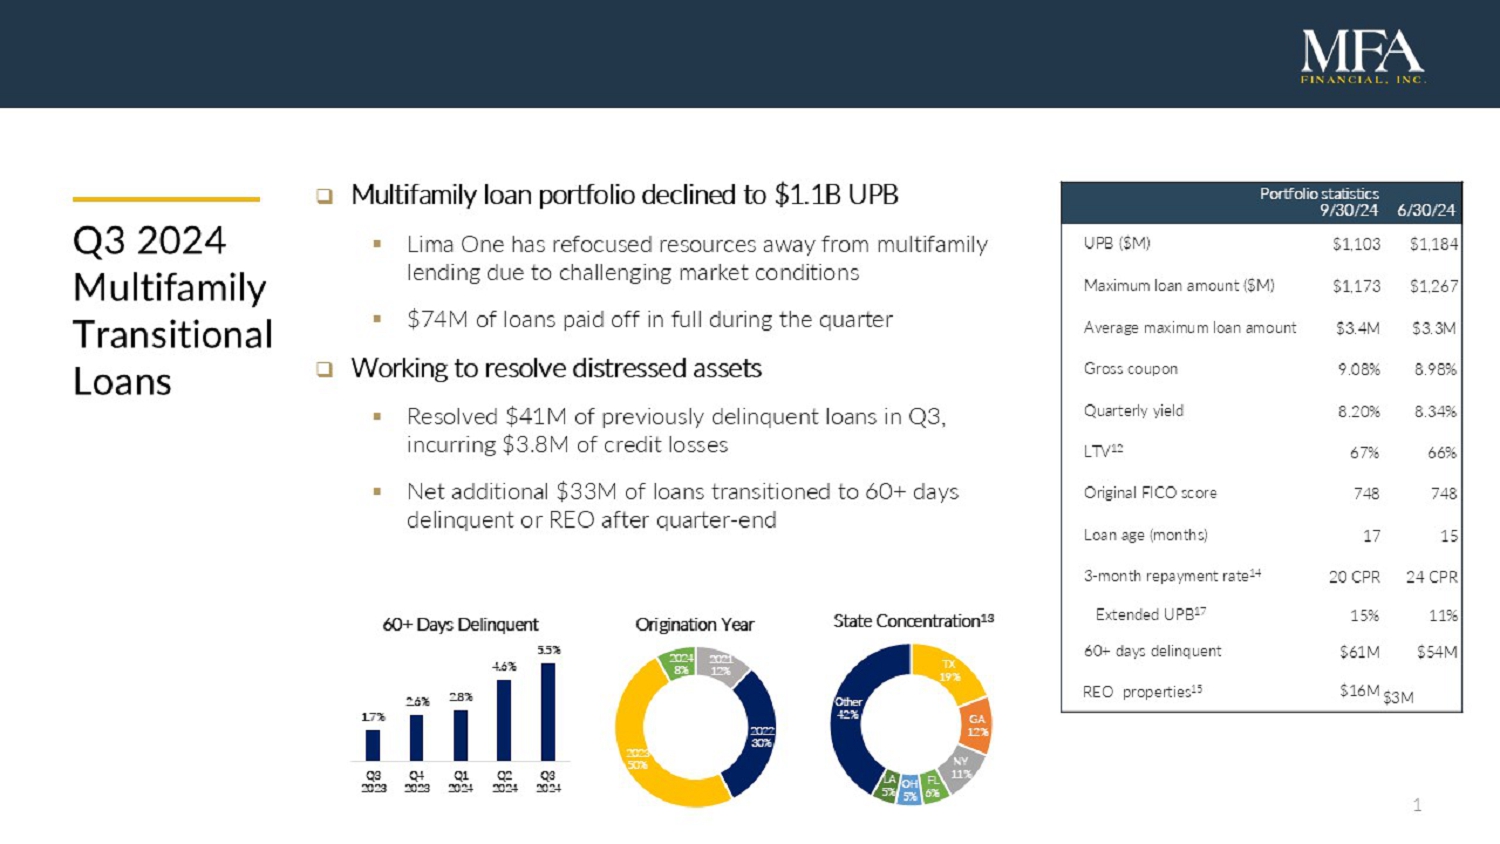
14 6/30/24 Portfolio s tatistics 9/30/24 $1,184 d $1,103 UPB ($M) $1,267 d $1,173 Maximum loan amount ($M) $3.3M d $3.4M Average maximum loan amount 8.98% d 9.08% Gross coupon 8.34% d 8.20% Quarterly yield 66% d 67% LTV 12 748 d 748 Original FICO score 15 d 17 Loan age (months) 24 CPR d 20 CPR 3 - month repayment rate 14 11% s 15% Extended UPB 17 $54M d $61M 60+ days delinquent $ 3 M $16M REO properties 15 Q3 2024 Multifamily Transitional Loans □ Multifamily loan portfolio declined to $1.1B UPB ▪ Lima One has refocused resources away from multifamily lending due to challenging market conditions ▪ $74M of loans paid off in full during the quarter □ Working to resolve distressed assets ▪ Resolved $41M of previously delinquent loans in Q3, incurring $3.8M of credit losses ▪ Additional $32M of loans transitioned to 60+ days delinquent after quarter - end TX 19% GA 12% NY 11% FL 6% OH 5% LA 5% Other 42% State Concentration 13 2021 12% 2022 30% 2023 50% 2024 8% Origination Year 1.7% 2.6% 2.8% 4.6% 5.5% Q3 2023 Q4 2023 Q1 2024 Q2 2024 Q3 2024 60+ Days Delinquent
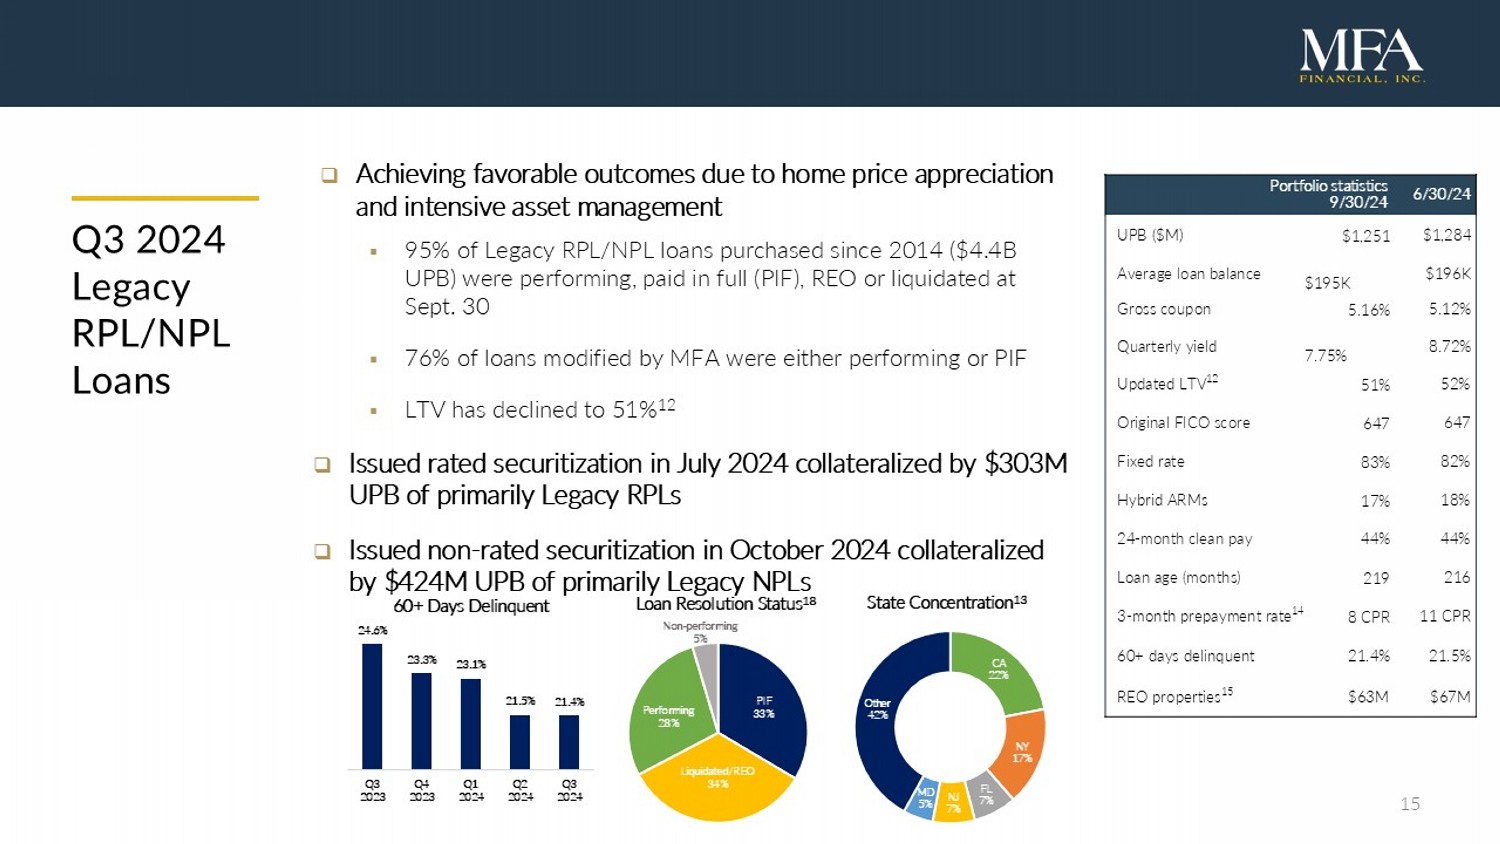
15 Q3 2024 Legacy RPL/NPL Loans □ Achieving favorable outcomes due to home price appreciation and intensive asset management ▪ 95% of Legacy RPL/NPL loans purchased since 2014 ($4.4B UPB) were performing, paid in full (PIF), REO or liquidated at Sept. 30 ▪ 76% of loans modified by MFA were either performing or PIF ▪ LTV has declined to 51% 12 □ Issued rated securitization in July 2024 collateralized by $303M UPB of primarily Legacy RPLs □ Issued non - rated securitization in October 2024 collateralized by $424M UPB of primarily Legacy NPLs 6/30/24 P ortfolio s tatistics 9/30/24 $1,284 1 $1,251 UPB ($M) $196K 1 $195K Average loan balance 5.12% 1 5.16% Gross coupon 8.72% 1 7.75% Quarterly yield 52% 1 51% Updated LTV 12 647 1 647 Original FICO score 82% 1 83% Fixed rate 18% 1 17% Hybrid ARMs 44% 1 44% 24 - month clean pay 216 1 219 Loan age (months) 11 CPR 1 8 CPR 3 - month prepayment rate 14 21.5% 1 21.4% 60+ days delinquent $67M 1 $63M REO properties 15 CA 22% NY 17% FL 7% NJ 7% MD 5% Other 42% State Concentration 13 PIF 33% Liquidated/REO 34% Performing 28% Non - performing 5% Loan Resolution Status 18 24.6% 23.3% 23.1% 21.5% 21.4% Q3 2023 Q4 2023 Q1 2024 Q2 2024 Q3 2024 60+ Days Delinquent
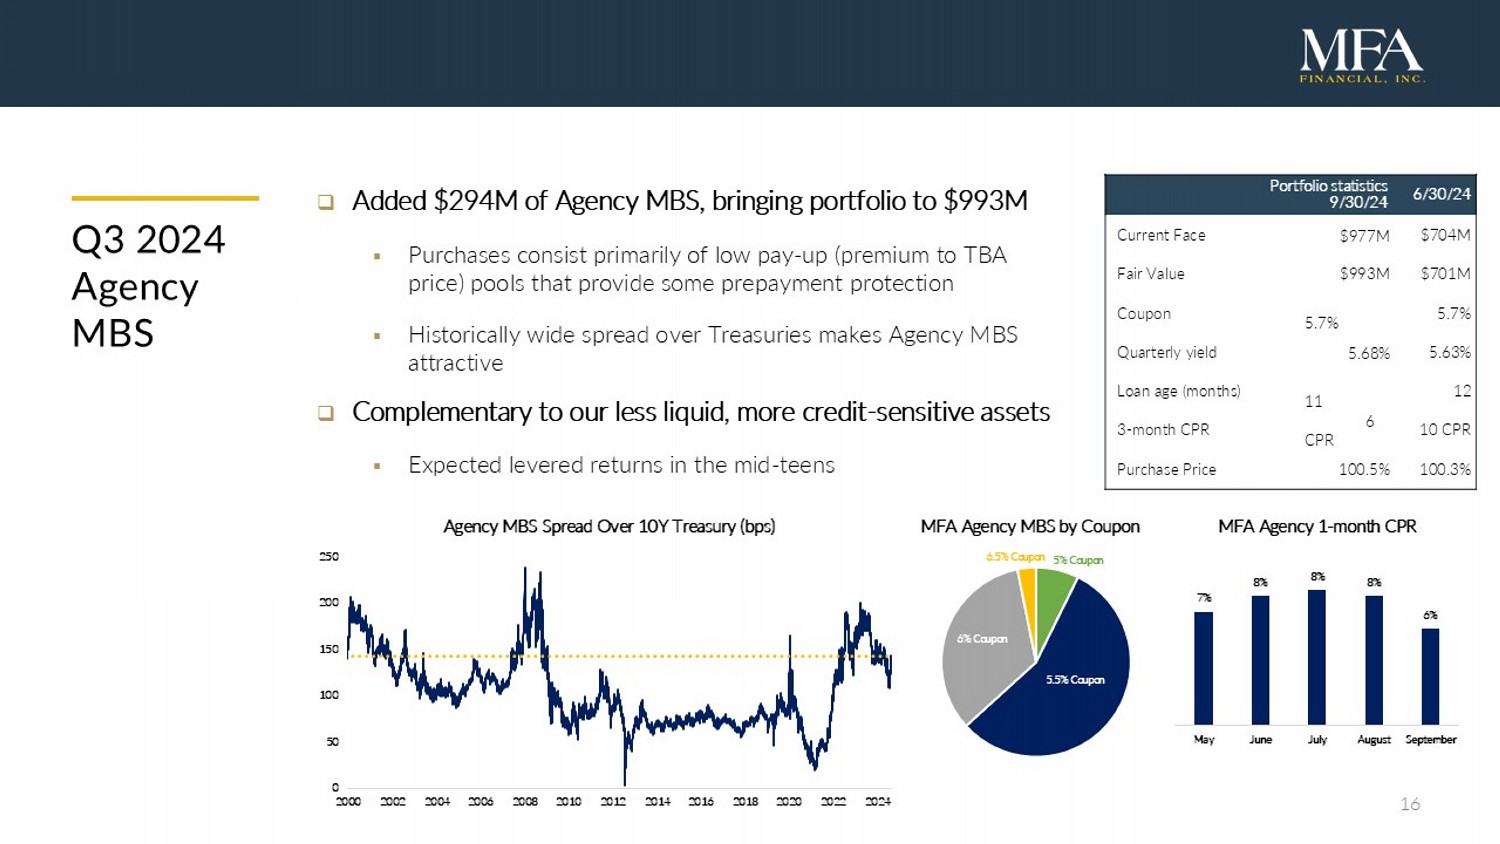
16 Q3 2024 Agency MBS □ Added $294M of Agency MBS, bringing portfolio to $993M ▪ Purchases consist primarily of low pay - up (premium to TBA price) pools that provide some prepayment protection ▪ Historically wide spread over Treasuries makes Agency MBS attractive □ Complementary to our less liquid, more credit - sensitive assets ▪ Expected levered returns in the mid - teens 5% Coupon 5.5% Coupon 6% Coupon 6.5% Coupon MFA Agency MBS by Coupon 6/30/24 P ortfolio s tatistics 9/30/24 $704M 1 $977M Current Face $701M 1 $993M Fair Value 5.7% 1 5.7% Coupon 5.63% 1 5.68% Quarterly yield 12 1 11 Loan age (months) 10 CPR 1 6 CPR 3 - month CPR 100.3% 1 100.5% Purchase Price 7% 8% 8% 8% 6% May June July August September MFA Agency 1 - month CPR 0 50 100 150 200 250 2000 2002 2004 2006 2008 2010 2012 2014 2016 2018 2020 2022 2024 Agency MBS Spread Over 10Y Treasury (bps)

17 Appendix James Casebere , Landscape with Houses ( Dutchess County, NY) #2, 2010 (detail)
18 MFA Financial Overview □ MFA Financial, Inc. (NYSE: MFA) is an internally managed real estate investment trust (REIT) that invests in U.S. residential mortgage loans and mortgage - backed securities □ MFA focuses primarily on mortgage subsectors in which it tries to avoid direct competition with banks and government - sponsored enterprises □ MFA owns a diversified portfolio of business purpose loans (BPLs), non - qualified mortgage (Non - QM) loans, re - performing/non - performing loans (Legacy RPL/NPLs) and residential mortgage - backed securities □ In 2021, MFA acquired Lima One Capital, a leading nationwide BPL originator and servicer with over $10B 7 in originations since its formation in 2010 □ MFA originates BPLs directly through Lima One and acquires Non - QM loans through flow and mini - bulk arrangements with a select group of originators with which it holds strong relationships □ MFA operates a leading residential credit securitization platform with $9.8B of issuance since inception □ MFA has deep expertise in residential credit as well as a long history of investing in new asset classes when compelling opportunities arise □ Since its IPO in 1998, MFA has distributed $4.8 billion of dividends to its stockholders
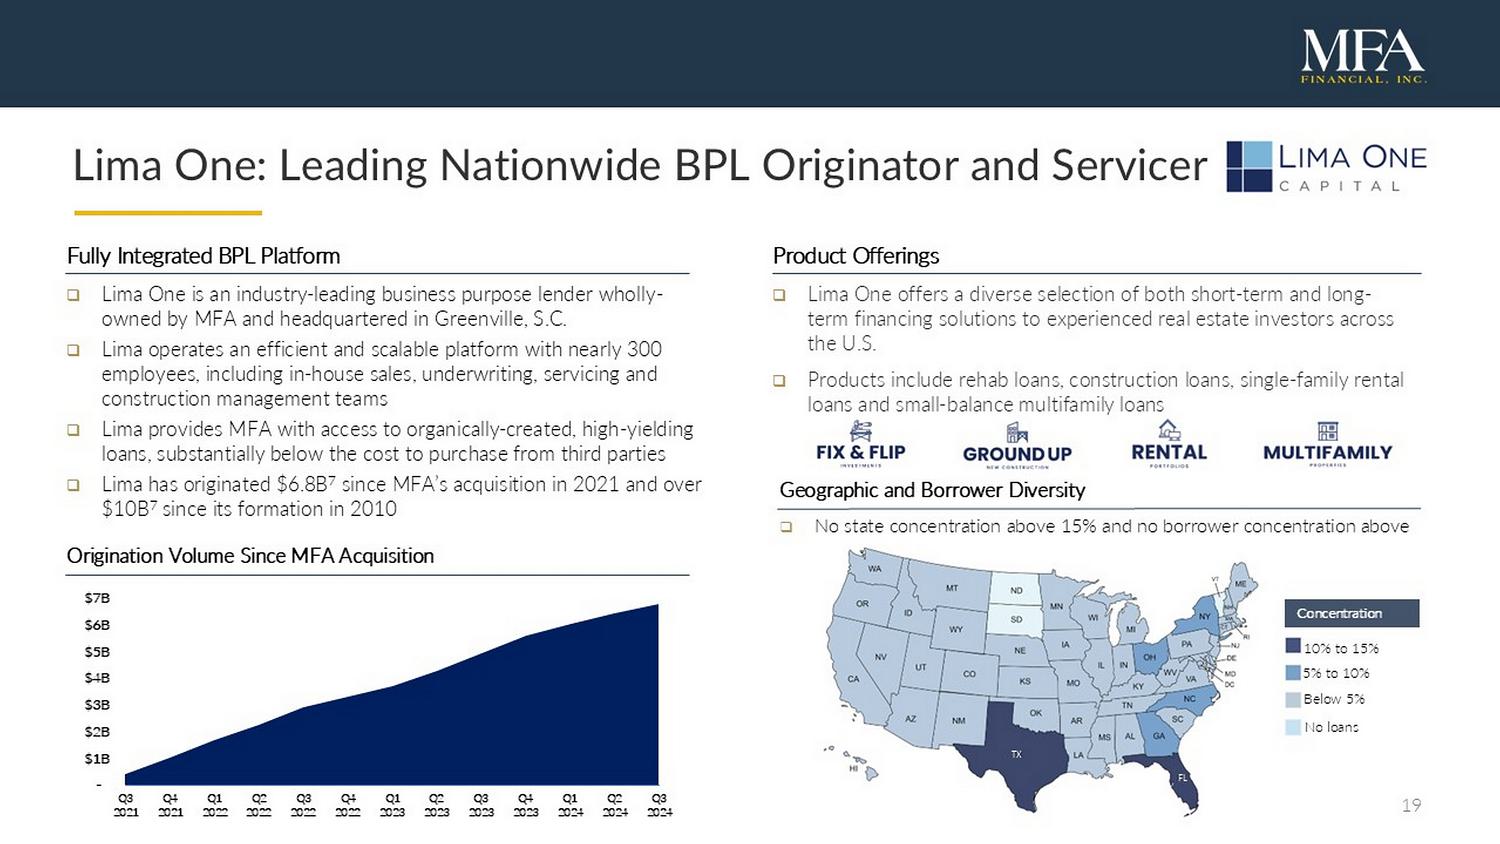
19 Lima One: Leading Nationwide BPL Originator and Servicer Product Offerings □ Lima One offers a diverse selection of both short - term and long - term financing solutions to experienced real estate investors across the U.S. □ Products include rehab loans, construction loans, single - family rental loans and small - balance multifamily loans Fully Integrated BPL Platform □ Lima One is an industry - leading business purpose lender wholly - owned by MFA and headquartered in Greenville, S.C. □ Lima operates an efficient and scalable platform with nearly 300 employees, including in - house sales, underwriting, servicing and construction management teams □ Lima provides MFA with access to organically - created, high - yielding loans, substantially below the cost to purchase from third parties □ Lima has originated $6.8 B 7 since MFA’s acquisition in 2021 and over $10B 7 since its formation in 2010 Geographic and Borrower Diversity □ No state concentration above 15% and no borrower concentration above 2% Concentration 10% to 15% 5% to 10% Below 5% No loans TX FL TX FL Origination Volume Since MFA Acquisition - $1B $2B $3B $4B $5B $6B $7B Q3 2021 Q4 2021 Q1 2022 Q2 2022 Q3 2022 Q4 2022 Q1 2023 Q2 2023 Q3 2023 Q4 2023 Q1 2024 Q2 2024 Q3 2024
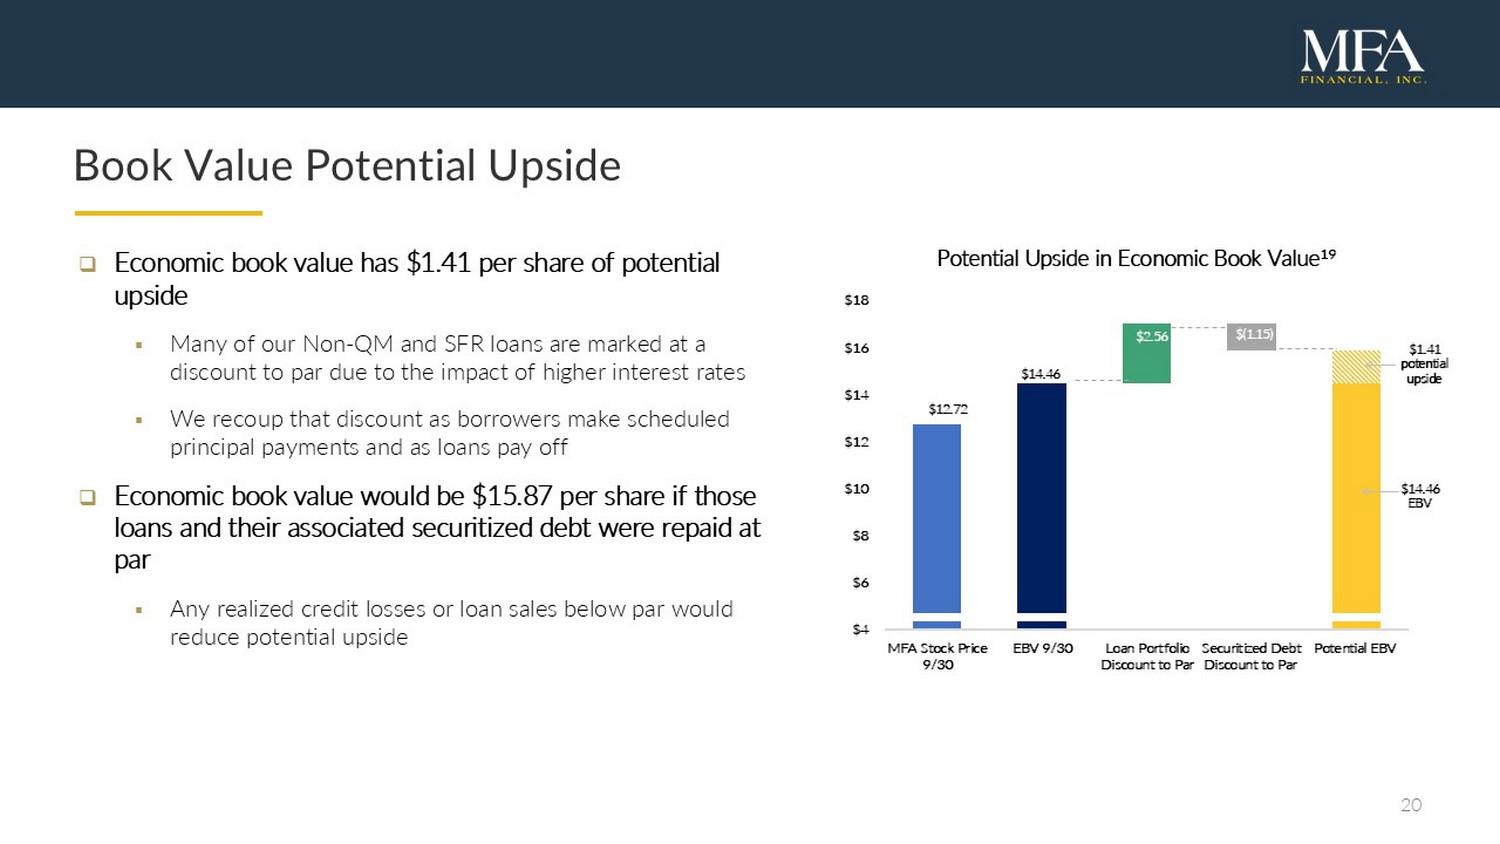
20 Book Value Potential Upside □ Economic book value has $1.41 per share of potential upside ▪ Many of our Non - QM and SFR loans are marked at a discount to par due to the impact of higher interest rates ▪ We recoup that discount as borrowers make scheduled principal payments and as loans pay off □ Economic book value would be $15.87 per share if those loans and their associated securitized debt were repaid at par ▪ Any realized credit losses or loan sales below par would reduce potential upside $4.84 $1.41 potential upside $14.46 EBV $4 $6 $8 $10 $12 $14 $16 $18 MFA Stock Price 9/30 EBV 9/30 Loan Portfolio Discount to Par Securitized Debt Discount to Par Potential EBV Potential Upside in Economic Book Value 19 $14.46 $12.72 $2.56 $(1.15)
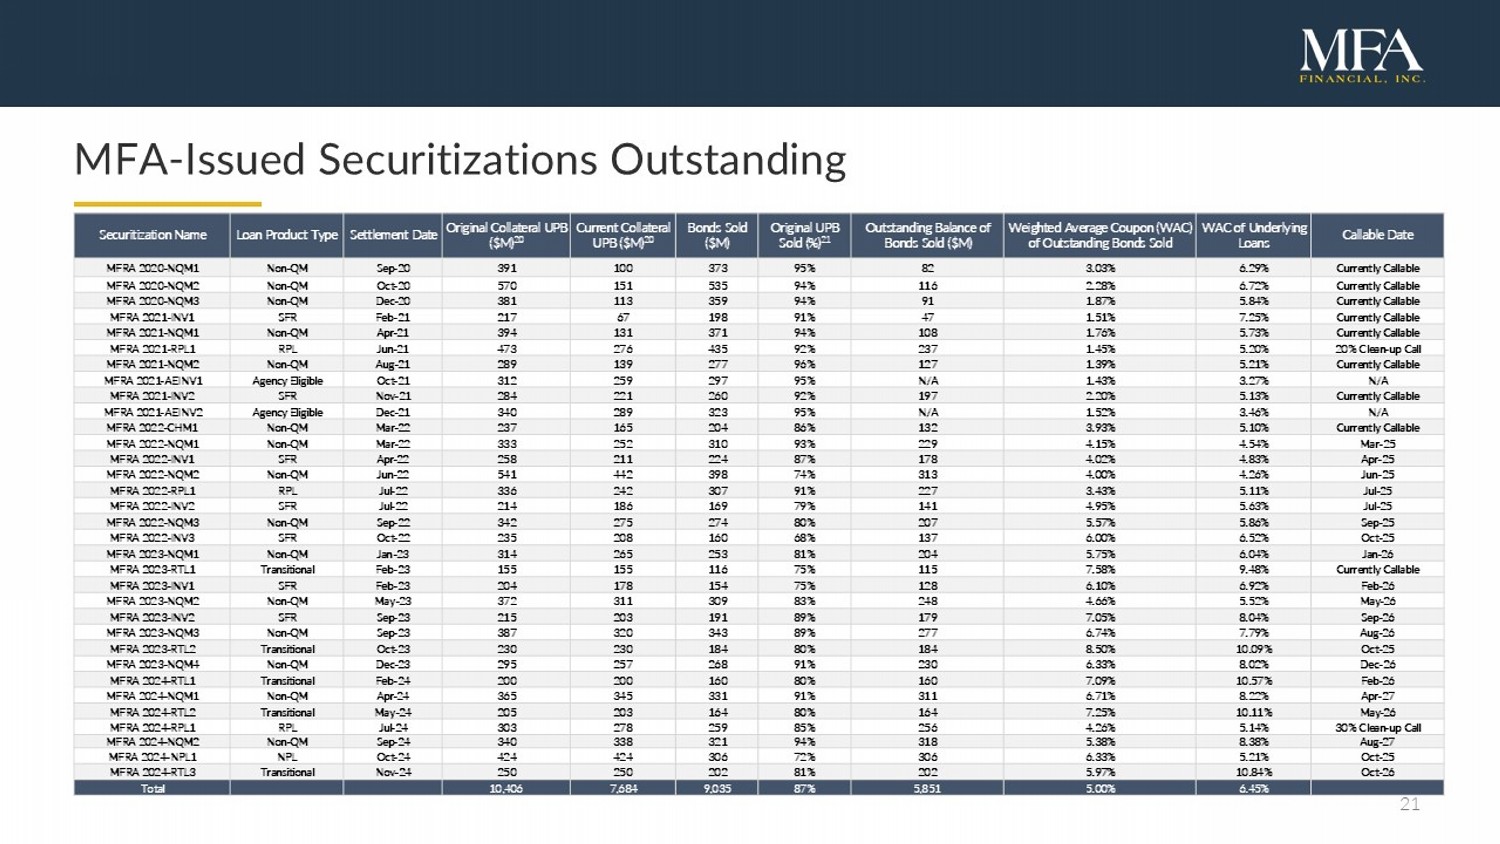
21 MFA - Issued Securitizations Outstanding Callable Date WAC of Underlying Loans Weighted Average Coupon (WAC) of Outstanding Bonds Sold Outstanding Balance of Bonds Sold ($M) Original UPB Sold (%) 21 Bonds Sold ($M) Current Collateral UPB ($M) 20 Original Collateral UPB ($M) 20 Settlement Date Loan Product Type Securitization Name Currently Callable 6.29% 3.03% 82 95% 373 100 391 Sep - 20 Non - QM MFRA 2020 - NQM1 Currently Callable 6.72% 2.28% 116 94% 535 151 570 Oct - 20 Non - QM MFRA 2020 - NQM2 Currently Callable 5.84% 1.87% 91 94% 359 113 381 Dec - 20 Non - QM MFRA 2020 - NQM3 Currently Callable 7.25% 1.51% 47 91% 198 67 217 Feb - 21 SFR MFRA 2021 - INV1 Currently Callable 5.73% 1.76% 108 94% 371 131 394 Apr - 21 Non - QM MFRA 2021 - NQM1 20% Clean - up Call 5.20% 1.45% 237 92% 435 276 473 Jun - 21 RPL MFRA 2021 - RPL1 Currently Callable 5.21% 1.39% 127 96% 277 139 289 Aug - 21 Non - QM MFRA 2021 - NQM2 N/A 3.27% 1.43% N/A 95% 297 259 312 Oct - 21 Agency Eligible MFRA 2021 - AEINV1 Currently Callable 5.13% 2.20% 197 92% 260 221 284 Nov - 21 SFR MFRA 2021 - INV2 N/A 3.46% 1.52% N/A 95% 323 289 340 Dec - 21 Agency Eligible MFRA 2021 - AEINV2 Currently Callable 5.10% 3.93% 132 86% 204 165 237 Mar - 22 Non - QM MFRA 2022 - CHM1 Mar - 25 4.54% 4.15% 229 93% 310 252 333 Mar - 22 Non - QM MFRA 2022 - NQM1 Apr - 25 4.83% 4.02% 178 87% 224 211 258 Apr - 22 SFR MFRA 2022 - INV1 Jun - 25 4.26% 4.00% 313 74% 398 442 541 Jun - 22 Non - QM MFRA 2022 - NQM2 Jul - 25 5.11% 3.43% 227 91% 307 242 336 Jul - 22 RPL MFRA 2022 - RPL1 Jul - 25 5.63% 4.95% 141 79% 169 186 214 Jul - 22 SFR MFRA 2022 - INV2 Sep - 25 5.86% 5.57% 207 80% 274 275 342 Sep - 22 Non - QM MFRA 2022 - NQM3 Oct - 25 6.52% 6.00% 137 68% 160 208 235 Oct - 22 SFR MFRA 2022 - INV3 Jan - 26 6.04% 5.75% 204 81% 253 265 314 Jan - 23 Non - QM MFRA 2023 - NQM1 Currently Callable 9.48% 7.58% 115 75% 116 155 155 Feb - 23 Transitional MFRA 2023 - RTL1 Feb - 26 6.92% 6.10% 128 75% 154 178 204 Feb - 23 SFR MFRA 2023 - INV1 May - 26 5.52% 4.66% 248 83% 309 311 372 May - 23 Non - QM MFRA 2023 - NQM2 Sep - 26 8.04% 7.05% 179 89% 191 203 215 Sep - 23 SFR MFRA 2023 - INV2 Aug - 26 7.79% 6.74% 277 89% 343 320 387 Sep - 23 Non - QM MFRA 2023 - NQM3 Oct - 25 10.09% 8.50% 184 80% 184 230 230 Oct - 23 Transitional MFRA 2023 - RTL2 Dec - 26 8.02% 6.33% 230 91% 268 257 295 Dec - 23 Non - QM MFRA 2023 - NQM4 Feb - 26 10.57% 7.09% 160 80% 160 200 200 Feb - 24 Transitional MFRA 2024 - RTL1 Apr - 27 8.22% 6.71% 311 91% 331 345 365 Apr - 24 Non - QM MFRA 2024 - NQM1 May - 26 10.11% 7.25% 164 80% 164 203 205 May - 24 Transitional MFRA 2024 - RTL2 30% Clean - up Call 5.14% 4.26% 256 85% 259 278 303 Jul - 24 RPL MFRA 2024 - RPL1 Aug - 27 8.38% 5.38% 318 94% 321 338 340 Sep - 24 Non - QM MFRA 2024 - NQM2 Oct - 25 5.21% 6.33% 306 72% 306 424 424 Oct - 24 NPL MFRA 2024 - NPL1 Oct - 26 10.84% 5.97% 202 81% 202 250 250 Nov - 24 Transitional MFRA 2024 - RTL3 6.45% 5.00% 5,851 87% 9,035 7,684 10,406 Total
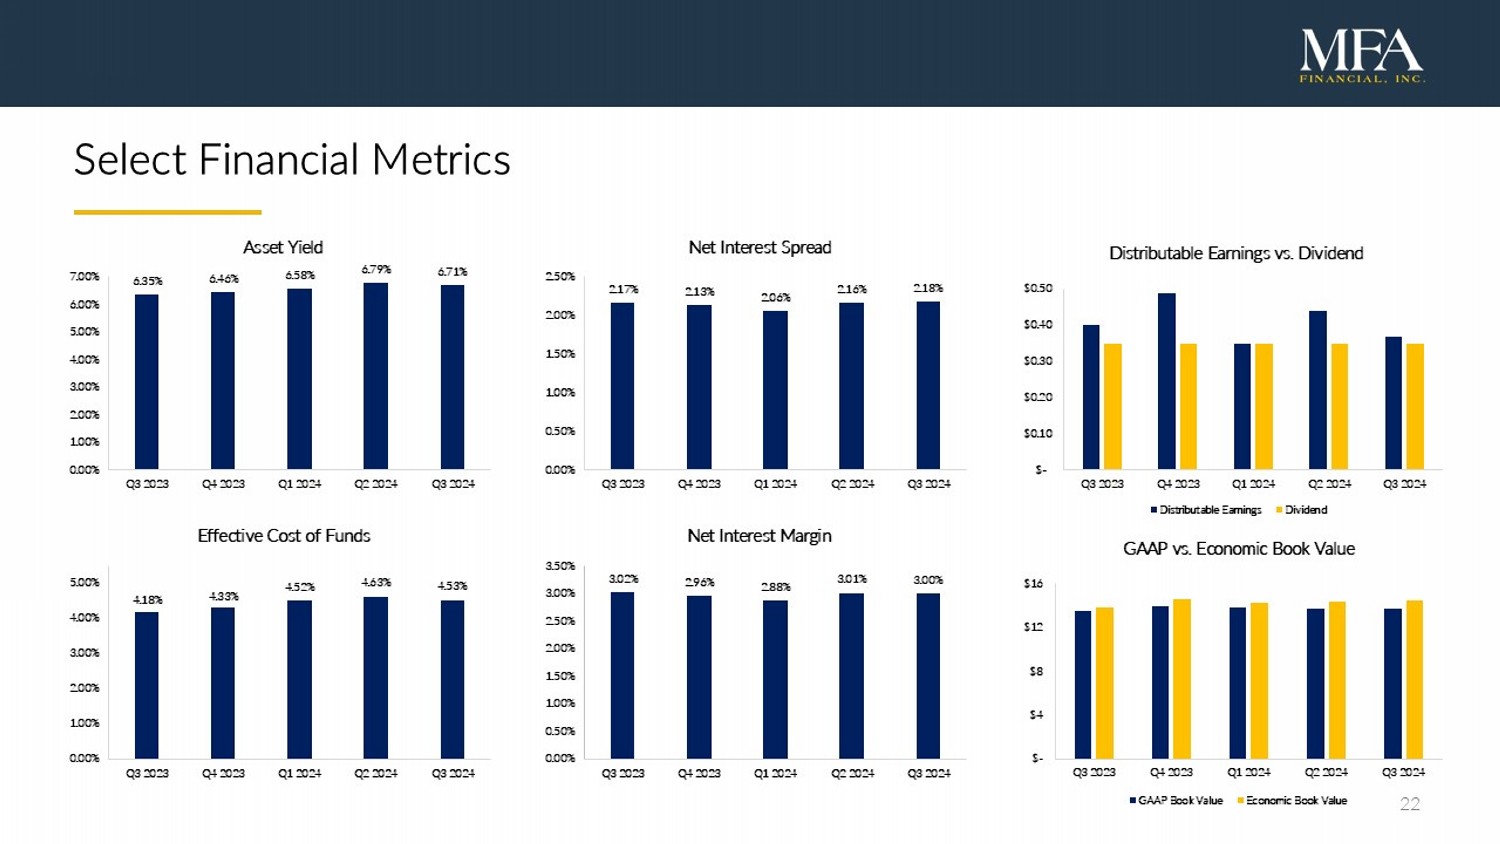
22 Select Financial Metrics 6.35% 6.46% 6.58% 6.79% 6.71% 0.00% 1.00% 2.00% 3.00% 4.00% 5.00% 6.00% 7.00% Q3 2023 Q4 2023 Q1 2024 Q2 2024 Q3 2024 Asset Yield 2.17% 2.13% 2.06% 2.16% 2.18% 0.00% 0.50% 1.00% 1.50% 2.00% 2.50% Q3 2023 Q4 2023 Q1 2024 Q2 2024 Q3 2024 Net Interest Spread 3.02% 2.96% 2.88% 3.01% 3.00% 0.00% 0.50% 1.00% 1.50% 2.00% 2.50% 3.00% 3.50% Q3 2023 Q4 2023 Q1 2024 Q2 2024 Q3 2024 Net Interest Margin 4.18% 4.33% 4.52% 4.63% 4.53% 0.00% 1.00% 2.00% 3.00% 4.00% 5.00% Q3 2023 Q4 2023 Q1 2024 Q2 2024 Q3 2024 Effective Cost of Funds $- $0.10 $0.20 $0.30 $0.40 $0.50 Q3 2023 Q4 2023 Q1 2024 Q2 2024 Q3 2024 Distributable Earnings vs. Dividend Distributable Earnings Dividend $- $4 $8 $12 $16 Q3 2023 Q4 2023 Q1 2024 Q2 2024 Q3 2024 GAAP vs. Economic Book Value GAAP Book Value Economic Book Value
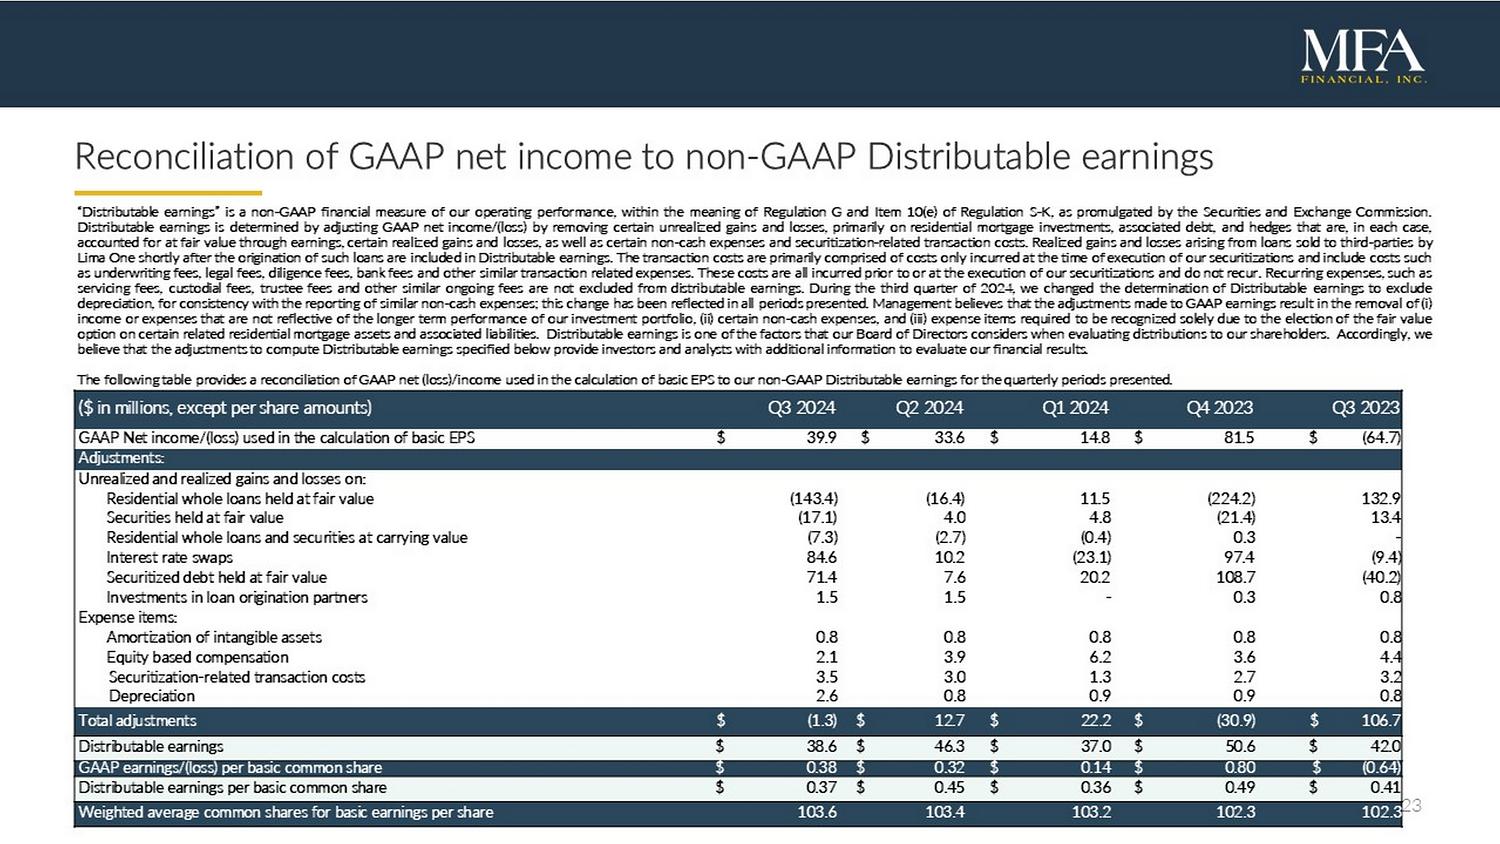
23 Reconciliation of GAAP net income to non - GAAP Distributable earnings “Distributable earnings” is a non - GAAP financial measure of our operating performance, within the meaning of Regulation G and Item 10 (e) of Regulation S - K, as promulgated by the Securities and Exchange Commission . Distributable earnings is determined by adjusting GAAP net income/(loss) by removing certain unrealized gains and losses, primarily on residential mortgage investments, associated debt, and hedges that are, in each case, accounted for at fair value through earnings, certain realized gains and losses, as well as certain non - cash expenses and securitization - related transaction costs . Realized gains and losses arising from loans sold to third - parties by Lima One shortly after the origination of such loans are included in Distributable earnings . The transaction costs are primarily comprised of costs only incurred at the time of execution of our securitizations and include costs such as underwriting fees, legal fees, diligence fees, bank fees and other similar transaction related expenses . These costs are all incurred prior to or at the execution of our securitizations and do not recur . Recurring expenses, such as servicing fees, custodial fees, trustee fees and other similar ongoing fees are not excluded from distributable earnings . During the third quarter of 2024 , we changed the determination of Distributable earnings to exclude depreciation, for consistency with the reporting of similar non - cash expenses ; this change has been reflected in all periods presented . Management believes that the adjustments made to GAAP earnings result in the removal of ( i ) income or expenses that are not reflective of the longer term performance of our investment portfolio, (ii) certain non - cash expenses, and (iii) expense items required to be recognized solely due to the election of the fair value option on certain related residential mortgage assets and associated liabilities . Distributable earnings is one of the factors that our Board of Directors considers when evaluating distributions to our shareholders . Accordingly, we believe that the adjustments to compute Distributable earnings specified below provide investors and analysts with additional information to evaluate our financial results . The following table provides a reconciliation of GAAP net (loss)/income used in the calculation of basic EPS to our non - GAAP Distributable earnings for the quarterly periods presented . Q3 202 3 Q4 202 3 Q1 202 4 Q2 202 4 Q3 202 4 ( $ i n m illions, e xcept p er s hare a mounts) $ (64.7) $ 81.5 $ 14.8 $ 33.6 $ 39.9 GAAP Net income/(loss) used in the calculation of basic EPS Adjustments: Unrealized and realized gains and losses on: 132.9 (224.2) 11.5 (16.4) (143.4) Residential whole loans held at fair value 13.4 (21.4) 4.8 4.0 (17.1) Securities held at fair value - 0.3 (0.4) (2.7) (7.3) Residential whole loans and securities at carrying value (9.4) 97.4 (23.1) 10.2 84.6 Interest rate swaps (40.2) 108.7 20.2 7.6 71.4 Securitized debt held at fair value 0.8 0.3 - 1.5 1.5 Investments in loan origination partners Expense items: 0.8 0.8 0.8 0.8 0.8 Amortization of intangible assets 4.4 3.6 6.2 3.9 2.1 Equity based compensation 3.2 2.7 1.3 3.0 3.5 Securitization - related transaction costs 0.8 0.9 0.9 0.8 2.6 Depreciation $ 106.7 $ (30.9) $ 22.2 $ 12.7 $ (1.3) Total adjustments $ 42.0 $ 50.6 $ 37.0 $ 46.3 $ 38.6 Distributable earnings $ (0.64) $ 0.80 $ 0.14 $ 0.32 $ 0.38 GAAP earnings/(loss) per basic common share $ 0.41 $ 0.49 $ 0.36 $ 0.45 $ 0.37 Distributable earnings per basic common share 10 2.3 102.3 103.2 103.4 103.6 Weighted average common shares for basic earnings per share
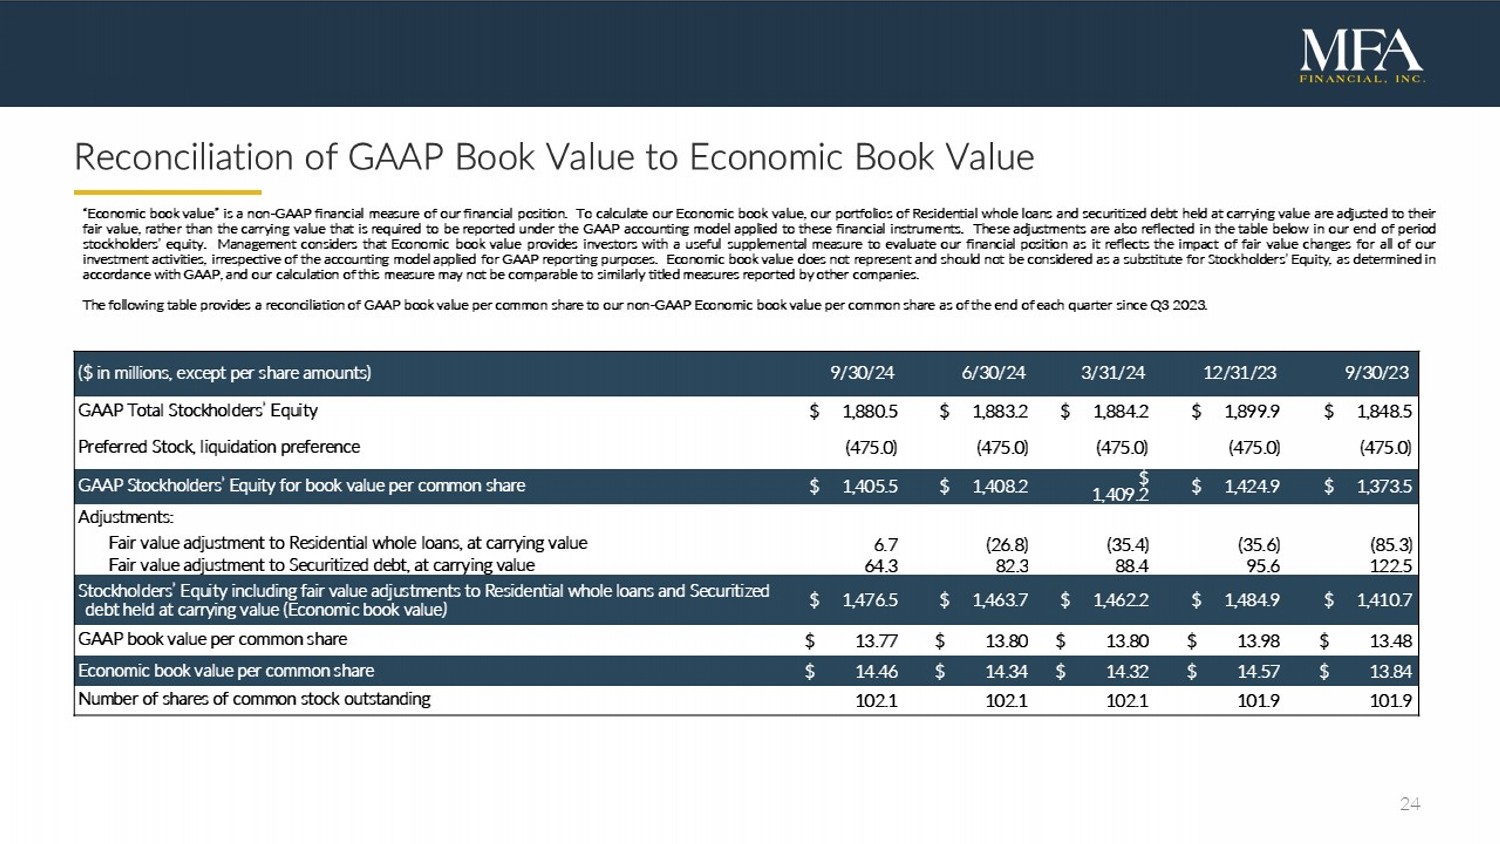
24 Reconciliation of GAAP Book Value to Economic Book Value “Economic book value” is a non - GAAP financial measure of our financial position . To calculate our Economic book value, our portfolios of Residential whole loans and securitized debt held at carrying value are adjusted to their fair value, rather than the carrying value that is required to be reported under the GAAP accounting model applied to these financial instruments . These adjustments are also reflected in the table below in our end of period stockholders’ equity . Management considers that Economic book value provides investors with a useful supplemental measure to evaluate our financial position as it reflects the impact of fair value changes for all of our investment activities, irrespective of the accounting model applied for GAAP reporting purposes . Economic book value does not represent and should not be considered as a substitute for Stockholders’ Equity, as determined in accordance with GAAP, and our calculation of this measure may not be comparable to similarly titled measures reported by other companies . The following table provides a reconciliation of GAAP book value per common share to our non - GAAP Economic book value per common share as of the end of each quarter since Q 3 2023 . 9/30 /2 3 12/31 /2 3 3/31/24 6/30/24 9/30/24 ($ i n millions, except per share amounts) $ 1,848.5 $ 1,899.9 $ 1,884.2 $ 1,883.2 $ 1,880.5 GAAP Total Stockholders’ Equity (475.0) (475.0) (475.0) (475.0) (475.0) Preferred Stock, liquidation preference $ 1,373.5 $ 1,424.9 $ 1,409.2 $ 1,408.2 $ 1,405.5 GAAP Stockholders’ Equity for book value per common share Adjustments: (85.3) (35.6) (35.4) (26.8) 6.7 Fair value adjustment to Residential whole loans, at carrying value 122.5 95.6 88.4 82.3 64.3 Fair value adjustment to Securitized debt, at carrying value $ 1,410.7 $ 1,484.9 $ 1,462.2 $ 1,463.7 $ 1,476.5 Stockholders’ Equity including fair value adjustments to Residential whole loans and Securitized debt held at carrying value (Economic book value ) $ 13.48 $ 13.98 $ 13.80 $ 13.80 $ 13.77 GAAP book value per common share $ 13.84 $ 14.57 $ 14.32 $ 14.34 $ 14.46 Economic book value per common share 101.9 101.9 102.1 102.1 102.1 Number of shares of common stock outstanding
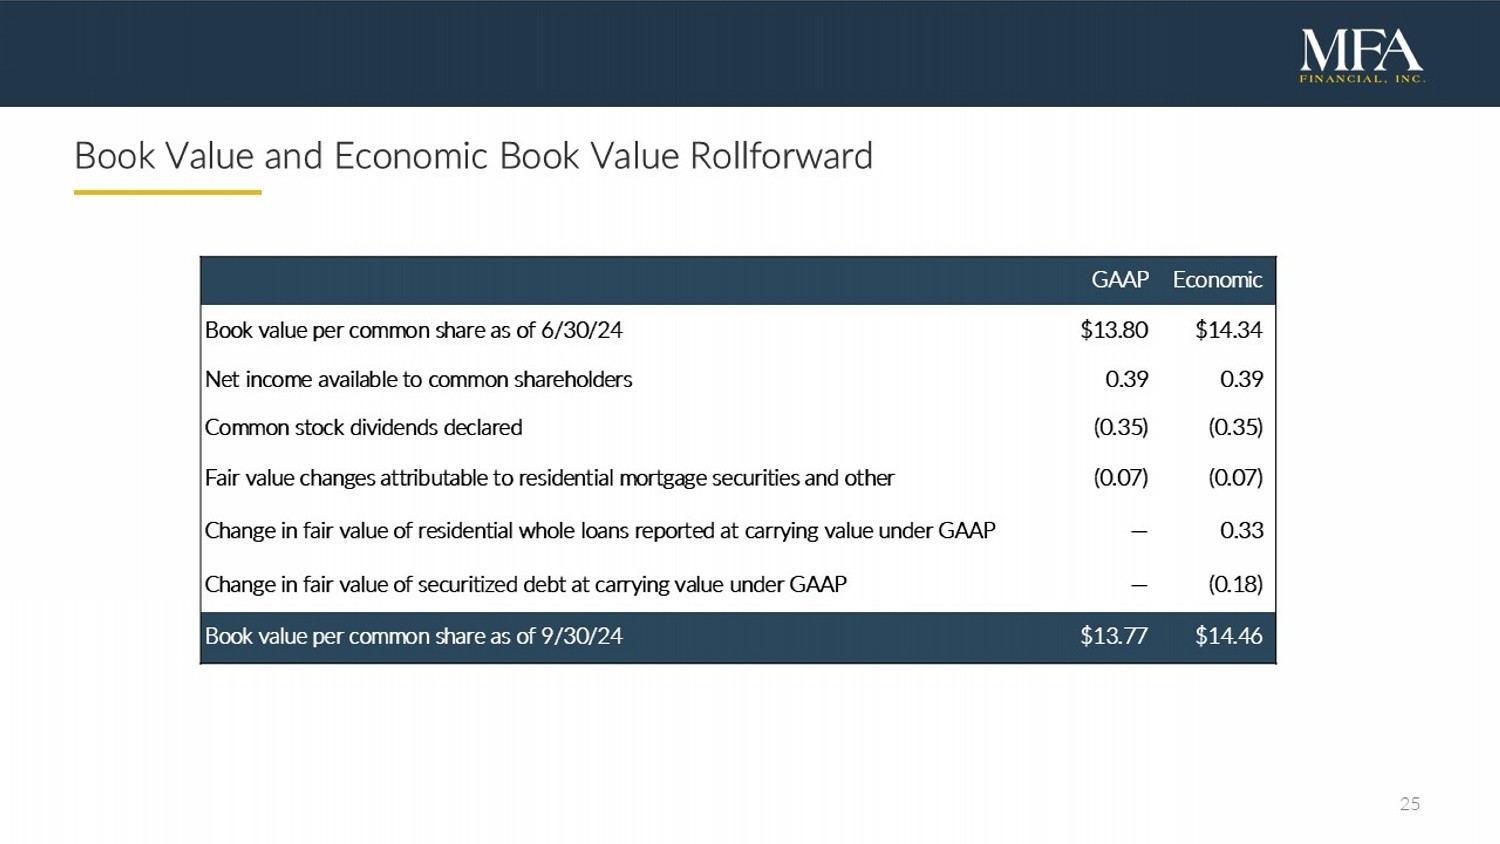
25 Book Value and Economic Book Value Rollforward Economic GAAP $14.34 $13.80 Book value per common share as of 6/30/24 0.39 0.39 Net income available to common shareholders (0. 35 ) (0. 35 ) Common stock dividends declared (0.07) (0.07) Fair value changes attributable to residential mortgage securities and other 0.33 — Change in fair value of residential whole loans reported at carrying value under GAAP (0.18) — Change in fair value of securitized debt at carrying value under GAAP $ 14.46 $ 13.77 Book value per common share as of 9/30/24
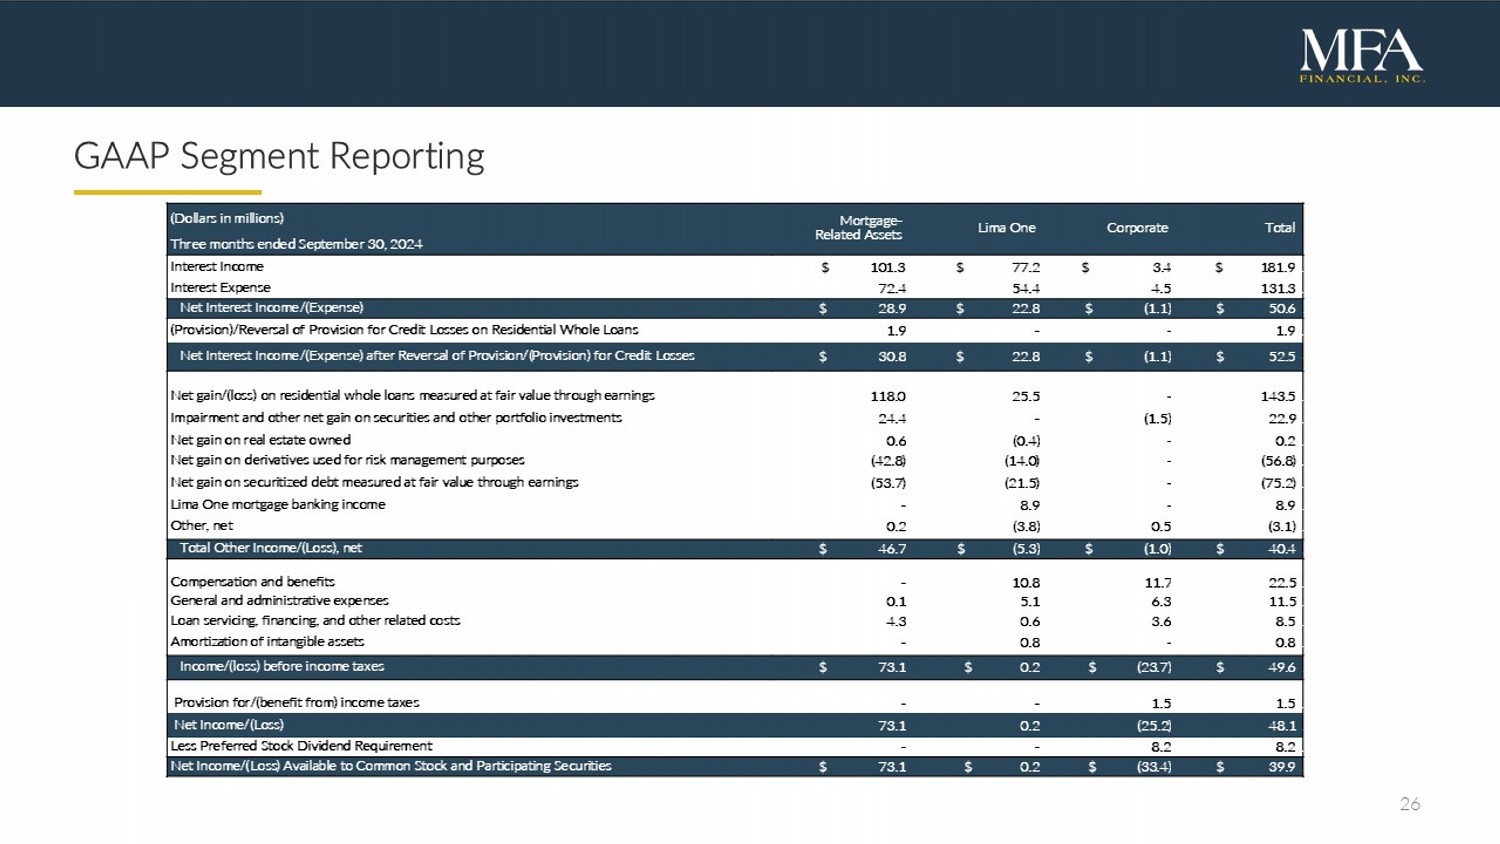
26 GAAP Segment Reporting Total d Corporate Lima One Mortgage - Related Assets (Dollars in m illions) Three months ended September 30, 2024 $ 181.9 1 $ 3.4 $ 77.2 $ 101.3 Interest Income 131.3 1 4.5 54.4 72.4 Interest Expense $ 50.6 1 $ (1.1) $ 22.8 $ 28.9 Net Interest Income /(Expense) 1.9 1 - - 1.9 (Provision)/Reversal of Provision for Credit Losses on Residential Whole Loans $ 52.5 4 $ (1.1) $ 22.8 $ 30.8 Net Interest Income /(Expense) after Reversal of Provision/( Provision ) for Credit Losses 143.5 1 - 25.5 118.0 Net gain/(loss) on residential whole loans measured at fair value through earnings 22.9 1 (1.5) - 24.4 Impairment and other net gain on securities and other portfolio investments 0.2 1 - (0.4) 0.6 Net gain on real estate owned (56.8) 1 - (14.0) (42.8) Net gain on derivatives used for risk management purposes (75.2) 1 - (21.5) (53.7) Net gain on securitized debt measured at fair value through earnings 8.9 1 - 8.9 - Lima One mortgage banking income (3.1) 1 0.5 (3.8) 0.2 Other, net $ 40.4 1 $ (1.0) $ (5.3) $ 46.7 Total Other Income/(Loss) , net 22.5 1 11.7 10.8 - Compensation and benefits 11.5 1 6.3 5.1 0.1 General and administrative expenses 8.5 1 3.6 0.6 4.3 Loan servicing, financing, and other related costs 0.8 1 - 0.8 - Amortization of intangible assets $ 49.6 1 $ (23.7) $ 0.2 $ 73.1 Income/(loss) before income taxes 1.5 1 1.5 - - Provision for/(benefit from) income taxes 48.1 1 (25.2) 0.2 73.1 Net Income/(Loss) 8.2 1 8.2 - - Less Preferred Stock Dividend Requirement $ 39.9 1 $ (33.4) $ 0.2 $ 73.1 Net Income/( Loss ) Available to Common Stock and Participating Securities
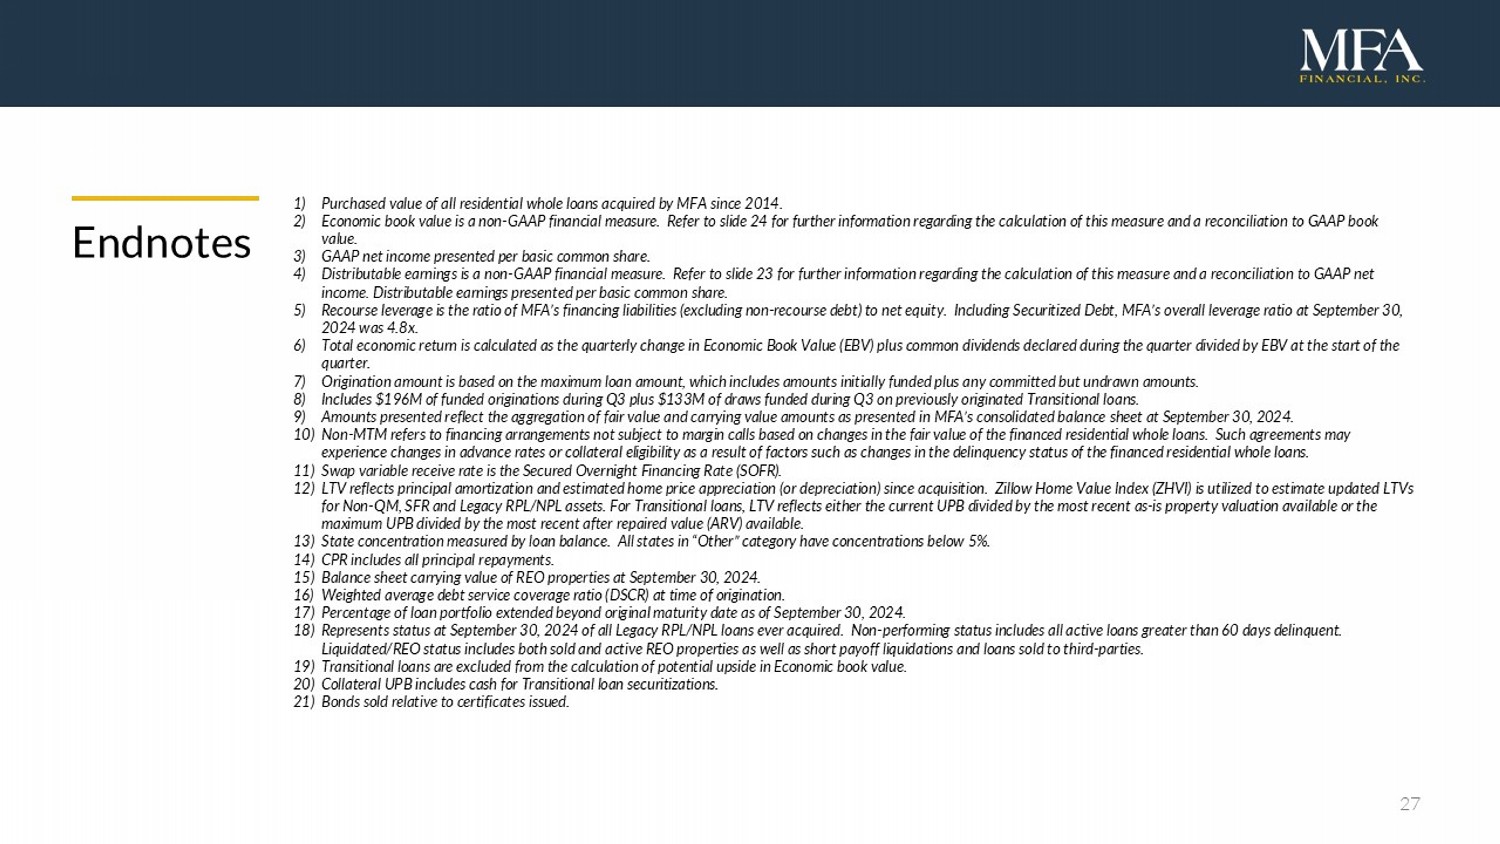
27 Endnotes 1) Purchased value of all residential whole loans acquired by MFA since 2014. 2) Economic book value is a non - GAAP financial measure. Refer to slide 24 for further information regarding the calculation of thi s measure and a reconciliation to GAAP book value. 3) GAAP net income presented per basic common share. 4) Distributable earnings is a non - GAAP financial measure. Refer to slide 23 for further information regarding the calculation of this measure and a reconciliation to GAAP net income. Distributable earnings presented per basic common share. 5) Recourse leverage is the ratio of MFA’s financing liabilities (excluding non - recourse debt) to net equity. Including Securitize d Debt, MFA’s overall leverage ratio at September 30, 2024 was 4.8x. 6) Total economic return is calculated as the quarterly change in Economic Book Value (EBV) plus common dividends declared durin g t he quarter divided by EBV at the start of the quarter. 7) Origination amount is based on the maximum loan amount, which includes amounts initially funded plus any committed but undraw n a mounts. 8) Includes $196M of funded originations during Q3 plus $133M of draws funded during Q3 on previously originated Transitional lo ans . 9) Amounts presented reflect the aggregation of fair value and carrying value amounts as presented in MFA’s consolidated balance sh eet at September 30, 2024. 10) Non - MTM refers to financing arrangements not subject to margin calls based on changes in the fair value of the financed resident ial whole loans. Such agreements may experience changes in advance rates or collateral eligibility as a result of factors such as changes in the delinquency statu s o f the financed residential whole loans. 11) Swap variable receive rate is the Secured Overnight Financing Rate (SOFR). 12) LTV reflects principal amortization and estimated home price appreciation (or depreciation) since acquisition. Zillow Home V alu e Index (ZHVI) is utilized to estimate updated LTVs for Non - QM, SFR and Legacy RPL/NPL assets. For Transitional loans, LTV reflects either the current UPB divided by the most recen t as - is property valuation available or the maximum UPB divided by the most recent after repaired value (ARV) available. 13) State concentration measured by loan balance. All states in “Other” category have concentrations below 5%. 14) CPR includes all principal repayments. 15) Balance sheet carrying value of REO properties at September 30, 2024. 16) Weighted average debt service coverage ratio (DSCR) at time of origination. 17) Percentage of loan portfolio extended beyond original maturity date as of September 30, 2024. 18) Represents status at September 30, 2024 of all Legacy RPL/NPL loans ever acquired. Non - performing status includes all active lo ans greater than 60 days delinquent. Liquidated/REO status includes both sold and active REO properties as well as short payoff liquidations and loans sold to thi rd - parties. 19) Transitional loans are excluded from the calculation of potential upside in Economic book value. 20) Collateral UPB includes cash for Transitional loan securitizations. 21) Bonds sold relative to certificates issued.
v3.24.3
Cover
|
Nov. 06, 2024 |
| Document Information [Line Items] |
|
| Document Type |
8-K
|
| Amendment Flag |
false
|
| Document Period End Date |
Nov. 06, 2024
|
| Entity File Number |
1-13991
|
| Entity Registrant Name |
MFA
FINANCIAL, INC.
|
| Entity Central Index Key |
0001055160
|
| Entity Tax Identification Number |
13-3974868
|
| Entity Incorporation, State or Country Code |
MD
|
| Entity Address, Address Line One |
One
Vanderbilt Avenue
|
| Entity Address, Address Line Two |
48th Floor
|
| Entity Address, City or Town |
New
York
|
| Entity Address, State or Province |
NY
|
| Entity Address, Postal Zip Code |
10017
|
| City Area Code |
212
|
| Local Phone Number |
207-6400
|
| Written Communications |
false
|
| Soliciting Material |
false
|
| Pre-commencement Tender Offer |
false
|
| Pre-commencement Issuer Tender Offer |
false
|
| Entity Emerging Growth Company |
false
|
| Common Stock [Member] |
|
| Document Information [Line Items] |
|
| Title of 12(b) Security |
Common
Stock, par value $0.01 per share
|
| Trading Symbol |
MFA
|
| Security Exchange Name |
NYSE
|
| Series B Preferred Stock [Member] |
|
| Document Information [Line Items] |
|
| Title of 12(b) Security |
7.50%
Series B Cumulative Redeemable Preferred Stock, par value $0.01 per share
|
| Trading Symbol |
MFA/PB
|
| Security Exchange Name |
NYSE
|
| Series C Preferred Stock [Member] |
|
| Document Information [Line Items] |
|
| Title of 12(b) Security |
6.50%
Series C Fixed-to-Floating Rate Cumulative Redeemable Preferred Stock, par value $0.01 per share
|
| Trading Symbol |
MFA/PC
|
| Security Exchange Name |
NYSE
|
| 8.875% Senior Notes due 2029 |
|
| Document Information [Line Items] |
|
| Title of 12(b) Security |
8.875%
Senior Notes due 2029
|
| Trading Symbol |
MFAN
|
| Security Exchange Name |
NYSE
|
| 9.000% Senior Notes due 2029 |
|
| Document Information [Line Items] |
|
| Title of 12(b) Security |
9.000%
Senior Notes due 2029
|
| Trading Symbol |
MFAO
|
| Security Exchange Name |
NYSE
|
| X |
- DefinitionBoolean flag that is true when the XBRL content amends previously-filed or accepted submission.
| Name: |
dei_AmendmentFlag |
| Namespace Prefix: |
dei_ |
| Data Type: |
xbrli:booleanItemType |
| Balance Type: |
na |
| Period Type: |
duration |
|
| X |
- DefinitionFor the EDGAR submission types of Form 8-K: the date of the report, the date of the earliest event reported; for the EDGAR submission types of Form N-1A: the filing date; for all other submission types: the end of the reporting or transition period. The format of the date is YYYY-MM-DD.
| Name: |
dei_DocumentPeriodEndDate |
| Namespace Prefix: |
dei_ |
| Data Type: |
xbrli:dateItemType |
| Balance Type: |
na |
| Period Type: |
duration |
|
| X |
- DefinitionThe type of document being provided (such as 10-K, 10-Q, 485BPOS, etc). The document type is limited to the same value as the supporting SEC submission type, or the word 'Other'.
| Name: |
dei_DocumentType |
| Namespace Prefix: |
dei_ |
| Data Type: |
dei:submissionTypeItemType |
| Balance Type: |
na |
| Period Type: |
duration |
|
| X |
- DefinitionAddress Line 1 such as Attn, Building Name, Street Name
| Name: |
dei_EntityAddressAddressLine1 |
| Namespace Prefix: |
dei_ |
| Data Type: |
xbrli:normalizedStringItemType |
| Balance Type: |
na |
| Period Type: |
duration |
|
| X |
- DefinitionAddress Line 2 such as Street or Suite number
| Name: |
dei_EntityAddressAddressLine2 |
| Namespace Prefix: |
dei_ |
| Data Type: |
xbrli:normalizedStringItemType |
| Balance Type: |
na |
| Period Type: |
duration |
|
| X |
- Definition
+ References
+ Details
| Name: |
dei_EntityAddressCityOrTown |
| Namespace Prefix: |
dei_ |
| Data Type: |
xbrli:normalizedStringItemType |
| Balance Type: |
na |
| Period Type: |
duration |
|
| X |
- DefinitionCode for the postal or zip code
| Name: |
dei_EntityAddressPostalZipCode |
| Namespace Prefix: |
dei_ |
| Data Type: |
xbrli:normalizedStringItemType |
| Balance Type: |
na |
| Period Type: |
duration |
|
| X |
- DefinitionName of the state or province.
| Name: |
dei_EntityAddressStateOrProvince |
| Namespace Prefix: |
dei_ |
| Data Type: |
dei:stateOrProvinceItemType |
| Balance Type: |
na |
| Period Type: |
duration |
|
| X |
- DefinitionA unique 10-digit SEC-issued value to identify entities that have filed disclosures with the SEC. It is commonly abbreviated as CIK. Reference 1: http://www.xbrl.org/2003/role/presentationRef
-Publisher SEC
-Name Exchange Act
-Number 240
-Section 12
-Subsection b-2
| Name: |
dei_EntityCentralIndexKey |
| Namespace Prefix: |
dei_ |
| Data Type: |
dei:centralIndexKeyItemType |
| Balance Type: |
na |
| Period Type: |
duration |
|
| X |
- DefinitionIndicate if registrant meets the emerging growth company criteria. Reference 1: http://www.xbrl.org/2003/role/presentationRef
-Publisher SEC
-Name Exchange Act
-Number 240
-Section 12
-Subsection b-2
| Name: |
dei_EntityEmergingGrowthCompany |
| Namespace Prefix: |
dei_ |
| Data Type: |
xbrli:booleanItemType |
| Balance Type: |
na |
| Period Type: |
duration |
|
| X |
- DefinitionCommission file number. The field allows up to 17 characters. The prefix may contain 1-3 digits, the sequence number may contain 1-8 digits, the optional suffix may contain 1-4 characters, and the fields are separated with a hyphen.
| Name: |
dei_EntityFileNumber |
| Namespace Prefix: |
dei_ |
| Data Type: |
dei:fileNumberItemType |
| Balance Type: |
na |
| Period Type: |
duration |
|
| X |
- DefinitionTwo-character EDGAR code representing the state or country of incorporation.
| Name: |
dei_EntityIncorporationStateCountryCode |
| Namespace Prefix: |
dei_ |
| Data Type: |
dei:edgarStateCountryItemType |
| Balance Type: |
na |
| Period Type: |
duration |
|
| X |
- DefinitionThe exact name of the entity filing the report as specified in its charter, which is required by forms filed with the SEC. Reference 1: http://www.xbrl.org/2003/role/presentationRef
-Publisher SEC
-Name Exchange Act
-Number 240
-Section 12
-Subsection b-2
| Name: |
dei_EntityRegistrantName |
| Namespace Prefix: |
dei_ |
| Data Type: |
xbrli:normalizedStringItemType |
| Balance Type: |
na |
| Period Type: |
duration |
|
| X |
- DefinitionThe Tax Identification Number (TIN), also known as an Employer Identification Number (EIN), is a unique 9-digit value assigned by the IRS. Reference 1: http://www.xbrl.org/2003/role/presentationRef
-Publisher SEC
-Name Exchange Act
-Number 240
-Section 12
-Subsection b-2
| Name: |
dei_EntityTaxIdentificationNumber |
| Namespace Prefix: |
dei_ |
| Data Type: |
dei:employerIdItemType |
| Balance Type: |
na |
| Period Type: |
duration |
|
| X |
- DefinitionLocal phone number for entity.
| Name: |
dei_LocalPhoneNumber |
| Namespace Prefix: |
dei_ |
| Data Type: |
xbrli:normalizedStringItemType |
| Balance Type: |
na |
| Period Type: |
duration |
|
| X |
- DefinitionBoolean flag that is true when the Form 8-K filing is intended to satisfy the filing obligation of the registrant as pre-commencement communications pursuant to Rule 13e-4(c) under the Exchange Act. Reference 1: http://www.xbrl.org/2003/role/presentationRef
-Publisher SEC
-Name Exchange Act
-Number 240
-Section 13e
-Subsection 4c
| Name: |
dei_PreCommencementIssuerTenderOffer |
| Namespace Prefix: |
dei_ |
| Data Type: |
xbrli:booleanItemType |
| Balance Type: |
na |
| Period Type: |
duration |
|
| X |
- DefinitionBoolean flag that is true when the Form 8-K filing is intended to satisfy the filing obligation of the registrant as pre-commencement communications pursuant to Rule 14d-2(b) under the Exchange Act. Reference 1: http://www.xbrl.org/2003/role/presentationRef
-Publisher SEC
-Name Exchange Act
-Number 240
-Section 14d
-Subsection 2b
| Name: |
dei_PreCommencementTenderOffer |
| Namespace Prefix: |
dei_ |
| Data Type: |
xbrli:booleanItemType |
| Balance Type: |
na |
| Period Type: |
duration |
|
| X |
- DefinitionTitle of a 12(b) registered security. Reference 1: http://www.xbrl.org/2003/role/presentationRef
-Publisher SEC
-Name Exchange Act
-Number 240
-Section 12
-Subsection b
| Name: |
dei_Security12bTitle |
| Namespace Prefix: |
dei_ |
| Data Type: |
dei:securityTitleItemType |
| Balance Type: |
na |
| Period Type: |
duration |
|
| X |
- DefinitionName of the Exchange on which a security is registered. Reference 1: http://www.xbrl.org/2003/role/presentationRef
-Publisher SEC
-Name Exchange Act
-Number 240
-Section 12
-Subsection d1-1
| Name: |
dei_SecurityExchangeName |
| Namespace Prefix: |
dei_ |
| Data Type: |
dei:edgarExchangeCodeItemType |
| Balance Type: |
na |
| Period Type: |
duration |
|
| X |
- DefinitionBoolean flag that is true when the Form 8-K filing is intended to satisfy the filing obligation of the registrant as soliciting material pursuant to Rule 14a-12 under the Exchange Act. Reference 1: http://www.xbrl.org/2003/role/presentationRef
-Publisher SEC
-Name Exchange Act
-Section 14a
-Number 240
-Subsection 12
| Name: |
dei_SolicitingMaterial |
| Namespace Prefix: |
dei_ |
| Data Type: |
xbrli:booleanItemType |
| Balance Type: |
na |
| Period Type: |
duration |
|
| X |
- DefinitionTrading symbol of an instrument as listed on an exchange.
| Name: |
dei_TradingSymbol |
| Namespace Prefix: |
dei_ |
| Data Type: |
dei:tradingSymbolItemType |
| Balance Type: |
na |
| Period Type: |
duration |
|
| X |
- DefinitionBoolean flag that is true when the Form 8-K filing is intended to satisfy the filing obligation of the registrant as written communications pursuant to Rule 425 under the Securities Act. Reference 1: http://www.xbrl.org/2003/role/presentationRef
-Publisher SEC
-Name Securities Act
-Number 230
-Section 425
| Name: |
dei_WrittenCommunications |
| Namespace Prefix: |
dei_ |
| Data Type: |
xbrli:booleanItemType |
| Balance Type: |
na |
| Period Type: |
duration |
|
| X |
- Details
| Name: |
us-gaap_StatementClassOfStockAxis=us-gaap_CommonStockMember |
| Namespace Prefix: |
|
| Data Type: |
na |
| Balance Type: |
|
| Period Type: |
|
|
| X |
- Details
| Name: |
us-gaap_StatementClassOfStockAxis=us-gaap_SeriesBPreferredStockMember |
| Namespace Prefix: |
|
| Data Type: |
na |
| Balance Type: |
|
| Period Type: |
|
|
| X |
- Details
| Name: |
us-gaap_StatementClassOfStockAxis=us-gaap_SeriesCPreferredStockMember |
| Namespace Prefix: |
|
| Data Type: |
na |
| Balance Type: |
|
| Period Type: |
|
|
| X |
- Details
| Name: |
us-gaap_StatementClassOfStockAxis=MFA_Senior8.875PercentNotesDue2029Member |
| Namespace Prefix: |
|
| Data Type: |
na |
| Balance Type: |
|
| Period Type: |
|
|
| X |
- Details
| Name: |
us-gaap_StatementClassOfStockAxis=MFA_Senior9.000PercentNotesDue2029Member |
| Namespace Prefix: |
|
| Data Type: |
na |
| Balance Type: |
|
| Period Type: |
|
|
MFA Financial (NYSE:MFAO)
Historical Stock Chart
From Feb 2025 to Mar 2025

MFA Financial (NYSE:MFAO)
Historical Stock Chart
From Mar 2024 to Mar 2025

