UNITED STATES
SECURITIES AND EXCHANGE COMMISSION
Washington, D.C. 20549
FORM 6-K
REPORT OF FOREIGN PRIVATE ISSUER
PURSUANT TO RULE 13a-16 OR 15d-16
UNDER THE SECURITIES EXCHANGE ACT of 1934
August 16, 2023
Pan American
Silver Corp.
(Exact name of registrant as specified in its charter)
1500-625 HOWE STREET
VANCOUVER BC CANADA V6C 2T6
(Address of principal executive offices)
001-41683
(Commission File Number)
Indicate by check mark whether the registrant files or will file annual
reports under cover Form 20-F or Form 40-F.
Indicate by check mark if the registrant is submitting the Form 6-K
in paper as permitted by Regulation S-T Rule 101(b)(1). ¨
Indicate by check mark if the registrant is submitting the Form 6-K
in paper as permitted by Regulation S-T Rule 101(b)(7): ¨
EXHIBIT LIST
Cautionary Note to U.S. Investors Concerning
Estimates of
Measured, Indicated and Inferred Resources
The Technical Report for the Jacobina Gold Mine,
Bahia State, Brazil, with an effective date of December 31, 2019, included as Exhibit 99.1 hereto (the “Technical Report”),
has been prepared and disclosed in accordance with Canadian National Instrument 43-101 — Standards of Disclosure for Mineral
Projects (“NI 43-101”) and the Canadian Institute of Mining, Metallurgy and Petroleum classification system. NI 43-101
is a rule developed by the Canadian Securities Administrators that establishes standards for all public disclosure an issuer makes of
scientific and technical information concerning mineral projects.
Canadian public disclosure standards, including
NI 43-101, differ significantly from the requirements of the United States Securities and Exchange Commission (the “SEC”),
and mineral reserve and mineral resource information included in the Technical Report may not be comparable to similar information disclosed
by U.S. companies. In particular, and without limiting the generality of the foregoing, the Technical Report uses the terms “measured
mineral resources,” “indicated mineral resources” and “inferred mineral resources” as defined under Canadian
regulations. The requirements of NI 43-101 for the identification of “mineral reserves” are also not the same as those of
the SEC, and reserves reported by the Registrant in compliance with NI 43-101 may not qualify as “reserves” under SEC standards.
While the SEC has adopted amendments to its disclosure rules to modernize the mineral property disclosure requirements for issuers whose
securities are registered with the SEC under the U.S. Securities Exchange Act of 1934, as amended, including amendments to certain definitions
to be substantially similar to the corresponding standards under NI 43-101, there are still differences in these standards and definitions.
U.S. investors are cautioned not to assume that any part of a “measured mineral resource” or “indicated mineral resource”
will ever be converted into a “mineral reserve”. U.S. investors should also understand that “inferred mineral resources”
have a great amount of uncertainty as to their existence and as to their economic and legal feasibility. It cannot be assumed that all
or any part of “inferred mineral resources” exist, are economically or legally mineable or will ever be upgraded to a higher
category. Under Canadian rules, estimated “inferred mineral resources” may not form the basis of feasibility or pre-feasibility
studies except in rare cases. In addition, disclosure of “contained ounces” in a mineral resource is permitted disclosure
under Canadian regulations. However, the SEC normally only permits issuers to report mineralization that does not constitute “reserves”
by SEC standards as in place tonnage and grade, without reference to unit measures. Accordingly, information concerning mineral deposits
set forth in the Technical Report may not be comparable with information made public by companies that report in accordance with U.S.
standards.
Signatures
Pursuant to the requirements of the Securities Exchange Act of 1934,
the registrant has duly caused this report to be signed on its behalf by the undersigned, thereunto duly authorized.
| |
Pan American Silver Corp. |
| |
(Registrant) |
| |
|
|
| Date: August 16, 2023 |
By: |
/s/ ”Delaney Fisher” |
| |
|
Delaney Fisher |
| |
|
SVP Associate General Counsel & Corporate Secretary |
Exhibit 99.1

NI 43-101 TECHNICAL REPORT
JACOBINA GOLD MINE
BAHIA STATE, BRAZIL

Qualified Persons:
Eduardo de Souza Soares, MAusIMM
CP (Min)
Renan Garcia Lopes, MAusIMM CP (Geo)
Henry Marsden, P.Geo.
Luis Vasquez, P.Eng.
Carlos Iturralde, P.Eng.
Royal Bank Plaza, North Tower
200 Bay Street, Suite 2200
Toronto, Ontario M5J 2J3 |
Effective Date: December 31, 2019
Signature Date: May 29, 2020 |
Yamana Gold Inc.
Royal Bank Plaza, North Tower
200 Bay Street, Suite 2200
Toronto, ON, Canada
M5J 2J3 |
NI 43-101 TECHNICAL REPORT
JACOBINA GOLD MINE
BAHIA STATE, BRAZIL |
| Effective Date: |
December 31, 2019 |
|
|
| |
|
|
|
| Signature Date: |
May 29, 2020 |
|
|
| Authors: |
|
[Signed] |
|
|
|
[Signed] |
| |
|
Eduardo de Souza Soares
MAusIMM CP (Min)
Coordinator Technical Services,
Jacobina, Yamana Gold Inc. |
|
|
|
Renan Garcia Lopes
MAusIMM CP (Geo)
Senior Geologist, Jacobina
Yamana Gold Inc. |
| |
|
|
|
|
|
|
| |
|
[Signed] |
|
|
|
[Signed] |
| |
|
Henry Marsden, P.Geo.
Senior Vice President, Exploration
Yamana Gold Inc. |
|
|
|
Luis Vasquez, P.Eng.
Senior Environmental Consultant
and Hydrotechnical Engineer
SLR Consulting (Canada) Ltd. |
| |
|
|
|
|
|
|
| |
|
[Signed] |
|
|
|
[Signed] |
| |
|
Carlos Iturralde, P.Eng.
Director, Tailings, Health, Safety & Sustainable Development
Yamana Gold Inc. |
|
Reviewer: |
|
Sébastien Bernier, P.Geo.
Senior Director
Geology & Mineral Resources
Yamana Gold Inc. |
TABLE OF CONTENTS
| LIST OF ABBREVIATIONS |
4 |
| |
|
|
|
| 1 |
SUMMARY |
1 |
| |
|
|
|
| |
1.1 |
PROPERTY DESCRIPTION |
1 |
| |
1.2 |
GEOLOGY AND MINERALIZATION |
2 |
| |
1.3 |
EXPLORATION STATUS |
2 |
| |
1.4 |
MINERAL RESOURCE AND MINERAL RESERVE ESTIMATES |
3 |
| |
1.5 |
MINING AND PROCESSING METHODS |
5 |
| |
1.6 |
ENVIRONMENTAL STUDIES, PERMITTING, AND SOCIAL OR COMMUNITY IMPACT |
7 |
| |
1.7 |
PHASE 2 EXPANSION PRE-FEASIBILITY STUDY |
8 |
| |
1.8 |
CONCLUSIONS AND RECOMMENDATIONS |
9 |
| |
|
|
| 2 |
INTRODUCTION |
14 |
| |
|
|
|
| |
2.1 |
SOURCES OF INFORMATION |
15 |
| |
|
|
| 3 |
RELIANCE ON OTHER EXPERTS |
16 |
| |
|
|
| 4 |
PROPERTY DESCRIPTION AND LOCATION |
17 |
| |
|
|
|
| |
4.1 |
LOCATION |
17 |
| |
4.2 |
PROPERTY DESCRIPTION |
18 |
| |
4.3 |
LAND TENURE |
18 |
| |
|
4.3.1 |
Surface Rights |
18 |
| |
|
4.3.2 |
Mineral Rights |
20 |
| |
4.4 |
ENVIRONMENTAL CONSIDERATIONS |
22 |
| |
|
|
| 5 |
ACCESSIBILITY, CLIMATE, LOCAL RESOURCES, INFRASTRUCTURE, AND PHYSIOGRAPHY |
23 |
| |
|
|
|
| |
5.1 |
ACCESSIBILITY |
23 |
| |
5.2 |
CLIMATE |
23 |
| |
5.3 |
LOCAL RESOURCES |
23 |
| |
5.4 |
INFRASTRUCTURE |
23 |
| |
5.5 |
PHYSIOGRAPHY |
24 |
| |
5.6 |
VEGETATION |
24 |
| |
5.7 |
AVIAN FAUNA |
25 |
| |
|
|
| 6 |
HISTORY |
27 |
| |
|
|
|
| |
6.1 |
PRIOR OWNERSHIP |
27 |
| |
6.2 |
HISTORICAL MINERAL RESOURCE AND MINERAL RESERVE ESTIMATES |
28 |
| |
6.3 |
PAST PRODUCTION |
28 |
| |
|
|
| 7 |
GEOLOGICAL SETTING AND MINERALIZATION |
30 |
| |
|
|
|
| |
7.1 |
REGIONAL GEOLOGY |
30 |
| |
7.2 |
LOCAL AND PROPERTY GEOLOGY |
31 |
i
| |
|
7.2.1 |
Jacobina Group |
32 |
| |
|
7.2.2 |
Ultramafic Sills and Dykes |
37 |
| |
7.3 |
STRUCTURAL GEOLOGY |
37 |
| |
7.4 |
MINERALIZATION |
38 |
| |
|
7.4.1 |
Conglomerate-Hosted Placer Gold Mineralization |
39 |
| |
|
7.4.2 |
Post-Depositional Gold-Bearing Stockwork, Shear Zones and Extensional Quartz Veins |
43 |
| |
7.5 |
ALTERATION |
43 |
| |
|
|
| 8 |
DEPOSIT TYPES |
44 |
| |
|
|
| 9 |
EXPLORATION |
45 |
| |
|
|
|
| |
9.1 |
EXPLORATION POTENTIAL |
47 |
| |
|
|
| 10 |
DRILLING |
49 |
| |
|
|
| 11 |
SAMPLE PREPARATION, ANALYSES, AND SECURITY |
54 |
| |
|
|
|
| |
11.1 |
SAMPLE PREPARATION AND ANALYSIS |
54 |
| |
11.2 |
QUALITY ASSURANCE/ QUALITY CONTROL MEASURES |
57 |
| |
|
11.2.1 |
Standards |
57 |
| |
|
11.2.2 |
Blank Samples |
57 |
| |
|
11.2.3 |
Coarse Crush Duplicates |
58 |
| |
|
11.2.4 |
Field Duplicates |
58 |
| |
|
11.2.5 |
Inter-Laboratory Pulp Duplicates |
58 |
| |
11.3 |
SAMPLE SECURITY |
58 |
| |
|
|
| 12 |
DATA VERIFICATION |
60 |
| |
|
|
|
| |
12.1 |
DATABASE VERIFICATION |
60 |
| |
12.2 |
QUALITY ASSURANCE/QUALITY CONTROL RESULTS |
60 |
| |
|
12.2.1 |
Standards |
61 |
| |
|
12.2.2 |
Blanks |
66 |
| |
|
12.2.3 |
Coarse Crush Duplicates |
68 |
| |
|
12.2.4 |
Field Duplicates |
68 |
| |
|
12.2.5 |
Inter-Laboratory Pulp Duplicates |
69 |
| |
|
|
| 13 |
MINERAL PROCESSING AND METALLURGICAL TESTING |
71 |
| |
|
|
|
| |
13.1 |
PROCESSING PLANT |
71 |
| |
13.2 |
METALLURGICAL TESTING |
71 |
| |
|
13.2.1 |
Historical Test Work |
71 |
| |
|
|
| 14 |
MINERAL RESOURCE ESTIMATES |
74 |
| |
|
|
|
| |
14.1 |
MINERAL RESOURCE SUMMARY |
74 |
| |
14.2 |
RESOURCE DATABASE AND VALIDATION |
75 |
| |
14.3 |
INTERPRETATION OF THE GEOLOGICAL STRUCTURES, LITHOLOGY, AND MINERALIZATION |
76 |
| |
14.4 |
TOPOGRAPHY AND EXCAVATION MODELS |
77 |
ii
| |
14.5 |
COMPOSITING METHODS |
79 |
| |
14.6 |
SAMPLE STATISTICS AND GRADE CAPPING |
80 |
| |
14.7 |
BULK DENSITY |
83 |
| |
14.8 |
VARIOGRAPHY |
84 |
| |
14.9 |
BLOCK MODEL CONSTRUCTION |
86 |
| |
14.10 |
BLOCK MODEL VALIDATION |
87 |
| |
14.11 |
CLASSIFICATION OF MINERAL RESOURCES |
89 |
| |
14.12 |
MINERAL RESOURCE STATEMENT |
93 |
| |
|
|
| 15 |
MINERAL RESERVE ESTIMATES |
96 |
| |
|
|
|
| |
15.1 |
MINERAL RESERVE SUMMARY |
96 |
| |
15.2 |
CONVERSION METHODOLOGY |
96 |
| |
15.3 |
DILUTION AND EXTRACTION |
98 |
| |
15.4 |
CUT-OFF GRADE |
98 |
| |
15.5 |
RECONCILIATION |
99 |
| |
|
|
| 16 |
MINING METHODS |
100 |
| |
|
|
|
| |
16.1 |
MINE DESIGN AND MINING METHOD |
100 |
| |
16.2 |
GEOMECHANICS |
105 |
| |
16.3 |
LIFE OF MINE PLAN |
107 |
| |
16.4 |
MINE EQUIPMENT |
109 |
| |
16.5 |
VENTILATION |
109 |
| |
16.6 |
COMPRESSED AIR |
111 |
| |
16.7 |
DEWATERING |
111 |
| |
16.8 |
POWER |
113 |
| |
16.9 |
COMMUNICATIONS |
113 |
| |
|
|
| 17 |
RECOVERY METHODS |
114 |
| |
|
|
|
| |
17.1 |
PROCESSING PLANT |
114 |
| |
|
17.1.1 |
Crushing Circuit |
114 |
| |
|
17.1.2 |
Grinding Circuit |
114 |
| |
|
17.1.3 |
Thickening, Leaching, and Adsorption |
114 |
| |
|
17.1.4 |
Elution Circuit |
115 |
| |
|
17.1.5 |
Electrowinning Circuit |
115 |
| |
|
17.1.6 |
Processing Plant Optimization and Expansion |
115 |
| |
|
|
| 18 |
PROJECT INFRASTRUCTURE |
118 |
| |
|
|
|
| |
18.1 |
POWER |
120 |
| |
18.2 |
TAILINGS DAM DESIGN AND CONSTRUCTION |
120 |
| |
|
18.2.1 |
Tailings Deposition and Reclaim Water System |
122 |
| |
|
|
| 19 |
MARKET STUDIES AND CONTRACTS |
123 |
| |
|
|
|
| |
19.1 |
MARKETS |
123 |
| |
19.2 |
CONTRACTS |
123 |
iii
| 20 |
ENVIRONMENTAL STUDIES, PERMITTING, AND SOCIAL OR COMMUNITY IMPACT |
124 |
| |
|
|
|
| |
20.1 |
PROJECT PERMITTING AND AUTHORIZATIONS |
124 |
| |
20.2 |
ENVIRONMENTAL MANAGEMENT |
126 |
| |
|
20.2.1 |
Environmental Management System |
126 |
| |
|
20.2.2 |
Tailings Management, Monitoring, and Water Management |
127 |
| |
|
20.2.3 |
Water Management |
129 |
| |
20.3 |
ENVIRONMENTAL MONITORING |
131 |
| |
20.4 |
ENVIRONMENTAL STATUS |
133 |
| |
20.5 |
COMMUNITY RELATIONS |
134 |
| |
|
20.5.1 |
General Context |
134 |
| |
|
20.5.2 |
PS1: Social and Environmental Assessment and Management Systems |
136 |
| |
|
20.5.3 |
PS2: Labour and Working Conditions |
138 |
| |
|
20.5.4 |
PS4: Community Health and Safety |
139 |
| |
|
20.5.5 |
PS5: Land Acquisition and Involuntary Resettlement |
140 |
| |
|
20.5.6 |
PS7: Indigenous Peoples |
140 |
| |
|
20.5.7 |
PS8: Cultural Heritage |
140 |
| |
20.6 |
MINE CLOSURE |
141 |
| |
20.7 |
SLR COMMENTS |
144 |
| |
|
|
| 21 |
CAPITAL AND OPERATING COSTS |
147 |
| |
|
|
|
| |
21.1 |
CAPITAL COSTS |
147 |
| |
21.2 |
OPERATING COSTS |
148 |
| |
|
|
| 22 |
ECONOMIC ANALYSIS |
150 |
| |
|
|
| 23 |
ADJACENT PROPERTIES |
151 |
| |
|
|
| 24 |
OTHER RELEVANT DATA AND INFORMATION |
152 |
| |
|
|
|
| |
24.1 |
PHASE 2 EXPANSION — UNDERGROUND MINING EQUIPMENT AND INFRASTRUCTURE |
153 |
| |
24.2 |
PHASE 2 EXPANSION — PROCESSING PLANT |
156 |
| |
|
24.2.1 |
Crushing Circuit |
156 |
| |
|
24.2.2 |
Grinding Circuit |
157 |
| |
|
24.2.3 |
Thickening of Grinding Product |
157 |
| |
|
24.2.4 |
Leaching Circuit |
157 |
| |
|
24.2.5 |
CIP Adsorption Circuit |
157 |
| |
|
24.2.6 |
Elution Circuit |
157 |
| |
|
24.2.7 |
Electrowinning Circuit |
157 |
| |
|
24.2.8 |
Tailings Disposal |
158 |
| |
|
24.2.9 |
Automation, Instrumentation, and Control |
158 |
| |
|
24.2.10 |
Architecture and Construction |
158 |
| |
24.3 |
PHASE 2 EXPANSION — POWER SUPPLY |
158 |
| |
24.4 |
PHASE 2 EXPANSION — LIFE OF MINE PLAN |
158 |
| |
24.5 |
PHASE 2 EXPANSION — PERMITTING |
162 |
iv
| |
24.6 |
PHASE 2 EXPANSION — CAPITAL COST ESTIMATE |
163 |
| |
|
24.6.1 |
Processing Plant Expansion Capital Cost |
163 |
| |
24.7 |
PHASE 2 EXPANSION — OPERATING COST ESTIMATE |
166 |
| |
24.8 |
PHASE 2 EXPANSION — ECONOMIC ANALYSIS |
166 |
| |
24.9 |
PHASE 2 EXPANSION — IMPLEMENTATION SCHEDULE |
169 |
| |
|
|
| 25 |
INTERPRETATION AND CONCLUSIONS |
171 |
| |
|
|
| 26 |
RECOMMENDATIONS |
174 |
| |
|
|
| 27 |
REFERENCES |
177 |
| |
|
|
| 28 |
CERTIFICATES OF QUALIFIED PERSONS |
181 |
| |
|
|
| APPENDIX A — MINERAL TITLE |
A |
| |
|
|
|
|
v
LIST OF FIGURES
| Figure 4-1: |
General location map |
17 |
| Figure 4-2: |
Mining and exploration concessions |
21 |
| Figure 5-1: |
Infrastructure and typical landscape |
26 |
| Figure 7-1: |
Tectonic assemblage map |
31 |
| Figure 7-2: |
Geology of project area |
32 |
| Figure 7-3: |
Geology of the Jacobina Mine Complex |
35 |
| Figure 7-4: |
Stratigraphic correlation between mining blocks |
36 |
| Figure 7-5: |
Examples of post-mineralization faults and shear zones |
38 |
| Figure 7-6: |
Generalized cross-section through the Morro do Vento Mine |
40 |
| Figure 7-7: |
Photographs of conglomerate-hosted gold mineralization |
42 |
| Figure 9-1: |
Location of geological mapping and sampling programs |
46 |
| Figure 9-2: |
Jacobina longitudinal section showing down-plunge exploration potential |
48 |
| Figure 10-1: |
Distribution of drilling, by mine, as of December 31, 2019 (top); Drilling by year (2010—2019) (bottom) |
50 |
| Figure 10-2: |
Location of drill holes |
51 |
| Figure 12-1: |
Assay results of standards analyzed at ALS and Jacobina laboratories |
66 |
| Figure 12-2: |
Assay results of inserted blank samples at ALS and Jacobina laboratories |
67 |
| Figure 12-3: |
Bias charts for coarse crushed duplicates analyzed at ALS and Jacobina laboratories |
68 |
| Figure 12-4: |
Bias charts for field duplicates analyzed at ALS and Jacobina laboratories |
69 |
| Figure 12-5: |
Bias charts of inter-laboratory check assay results |
70 |
| Figure 14-1: |
Plan (top) and longitudinal view (bottom) of the mine infrastructure |
78 |
| Figure 14-2: |
Example of excavation and depletion models |
79 |
| Figure 14-3: |
Box and whisker plot of João Belo composite samples |
80 |
| Figure 14-4: |
Graphical guides used for selection of capping values, João Belo Mine (lvlc reef) |
81 |
| Figure 14-5: |
Summary of the density values for the João Belo Mine as of December 31, 2019 |
83 |
| Figure 14-6: |
Swath plots for lvlc Reef, João Belo Mine |
89 |
| Figure 14-7: |
Long section of classified block models at Morro do Cuscuz (top) and Canavieiras South (bottom) |
90 |
| Figure 14-8: |
Long section of classified block models at Serra do Córrego (top) and Canavieiras Central (bottom) |
91 |
| Figure 14-9: |
Long section of classified block models at João Belo (top) and Morro do Vento (bottom) |
92 |
| Figure 16-1: |
Schematic cross-section of sublevel stoping |
101 |
| Figure 16-2: |
Mineral reserves — South Complex |
102 |
| Figure 16-3: |
Mineral reserves — Central Complex |
103 |
| Figure 16-4: |
Mineral reserves — North Complex |
104 |
| Figure 16-5: |
Stability chart with dilution curves |
106 |
| Figure 16-6: |
Phase 1 LOM gold production profile |
107 |
| Figure 16-7: |
Schematic sectional view of ventilation circuit — Canavieiras South Mine |
110 |
| Figure 16-8: |
Schematic drawing of dewatering system at João Belo Mine |
112 |
| Figure 17-1: |
Current process flow sheet |
116 |
| Figure 17-2: |
Phase 1 Optimization process flow sheet |
117 |
| Figure 18-1: |
Site layout of mine infrastructure |
119 |
vi
| Figure 18-2: |
Cross-section of TSF B2 dam at final elevation |
121 |
| Figure 24-1: |
Phase 2 Expansion process flow sheet |
155 |
| Figure 24-2: |
LOM production profile — Phase 2 Expansion PFS case |
161 |
| Figure 24-3: |
LOM production profile — Phase 2 Extended Case |
161 |
| Figure 24-4: |
Cumulative discounted cash flow at 5% discount rate |
167 |
vii
LIST OF TABLES
| Table 1-1: |
Jacobina Mineral Resource Statement, December 31, 2019 |
3 |
| Table 1-2: |
Jacobina Mineral Reserve Statement, December 31, 2019 |
5 |
| Table 4-1: |
Jacobina — Rights of possession |
19 |
| Table 4-2: |
Jacobina — Rights of ownership |
20 |
| Table 6-1: |
Summary of gold production at the Jacobina mine, 1983 to 2019 |
29 |
| Table 7-1: |
Characteristics of gold mineralization at Jacobina |
41 |
| Table 10-1: |
Summary of drilling history between 1970 and December 31, 2019 |
49 |
| Table 10-2: |
Historical distribution of drilling by mine as of December 31, 2019 |
49 |
| Table 10-3: |
Drilling procedures |
53 |
| Table 11-1: |
List of sample preparation and analytical standard operating procedures |
54 |
| Table 12-1: |
Summary of QA/QC results, January 1 to December 31, 2019 |
60 |
| Table 12-2: |
Performance of standards, ALS laboratory — exploration drilling |
61 |
| Table 12-3: |
Performance of standards, ALS laboratory — infill drilling |
62 |
| Table 12-4: |
Performance of standards, Jacobina laboratory — exploration drilling |
63 |
| Table 12-5: |
Performance of standards, Jacobina laboratory — infill drilling |
64 |
| Table 12-6: |
Performance of standards, Jacobina laboratory — underground channel samples |
65 |
| Table 13-1: |
2018 Jacobina mineral processing plant production |
72 |
| Table 13-2: |
2019 Jacobina mineral processing plant production |
73 |
| Table 14-1: |
Jacobina Mineral Resource Statement, December 31, 2019 |
75 |
| Table 14-2: |
Summary of drilling and channel databases used for resource estimation |
75 |
| Table 14-3: |
Summary of modelling extents |
76 |
| Table 14-4: |
Number of mineralized wireframes (reefs) by model area |
77 |
| Table 14-5: |
Summary of capping values by mineralized wireframe model |
82 |
| Table 14-6: |
Block model bulk density values |
84 |
| Table 14-7: |
Variogram parameters for the main reef of each mine |
85 |
| Table 14-8: |
Generalized block model parameters |
86 |
| Table 14-9: |
Summary of the general estimation search parameters |
87 |
| Table 14-10: |
Statistical validation of the estimated block model (João Belo — mspc reef) |
88 |
| Table 14-11: |
Summary of Jacobina mineral resources by mining block as of December 31, 2019 |
94 |
| Table 15-1: |
Jacobina Mineral Reserve Statement, December 31, 2019 |
96 |
| Table 15-2: |
Stope design parameters |
98 |
| Table 15-3: |
Cut-off grades |
98 |
| Table 15-4: |
2019 Reconciliation |
99 |
| Table 16-1: |
Jacobina ground support standards |
106 |
| Table 16-2: |
Life of mine plan — Phase 1 Optimization |
108 |
| Table 16-3: |
List of current mobile mining equipment |
109 |
| Table 16-4: |
Ventilation fans — Number of units |
109 |
| Table 16-5: |
Compressed air |
111 |
| Table 20-1: |
Summary of environmental operational licences |
125 |
| Table 20-2: |
Summary of water permits |
126 |
| Table 20-3: |
Social risk management element of Yamana’s 2016 HSEC Framework |
136 |
| Table 20-4: |
Health and safety management element of Yamana’s 2016 HSEC Framework |
138 |
viii
| Table 20-5: |
Summary of main closure activities |
142 |
| Table 20-6 |
Total estimated costs for mining reclamation and closure (from 2018 mine closure plan) |
144 |
| Table 21-1: |
Life of mine capital costs |
147 |
| Table 21-2: |
LOM Average unit operating costs |
149 |
| Table 24-1: |
Mining equipment requirements |
153 |
| Table 24-2: |
LOM plan — Phase 2 Expansion PFS Case |
160 |
| Table 24-3: |
Phase 2 Expansion LOM Capital costs |
163 |
| Table 24-4: |
Capital cost estimate by discipline |
165 |
| Table 24-5: |
LOM average unit operating costs |
166 |
| Table 24-6: |
Phase 2 LOM Summary |
157 |
| Table 24-7: |
Phase 2 Expansion — Gold price sensitivity at BRL:USD exchange rate of 4.0:1 |
168 |
| Table 24-8: |
Phase 2 Expansion — Gold price sensitivity at BRL:USD exchange rate of 5.0:1 |
168 |
| Table 24-9: |
Project implementation schedule |
170 |
ix
CAUTIONARY NOTE REGARDING FORWARD-LOOKING STATEMENTS
This report contains
or incorporates by reference “forward-looking statements” and “forward-looking information” under applicable Canadian
securities legislation within the meaning of the United States Private Securities Litigation Reform Act of 1995. Forward-looking information
includes, but is not limited to: cash flow forecasts, projected capital, operating and exploration expenditures, targeted cost reductions,
mine life and production rates, grades, infrastructure, capital, operating and sustaining costs, the future price of gold, potential mineralization
and metal or mineral recoveries, estimates of mineral resources and mineral reserves and the realization of such mineral resources and
mineral reserves, information pertaining to potential improvements to financial and operating performance and mine life at Jacobina (as
defined herein) that may result from expansion projects or other initiatives, the timing and expected outcomes of the Phase 1 Optimization
and the Phase 2 Expansion projects, maintenance and renewal of permits or mineral tenure, estimates of mine closure obligations, leverage
ratios and information with respect to the Company’s (as defined herein) strategy, plans or future financial or operating performance.
Forward-looking statements are characterized by words such as “plan,” “expect”, “budget”, “target”,
“project”, “intend”, “believe”, “anticipate”, “estimate” and other similar words, or
statements that certain events or conditions “may” or “will” occur, including the negative connotations of such terms.
Forward-looking statements are statements that are not historical facts and are based on the opinions, assumptions and estimates of Qualified
Persons considered reasonable at the date the statements are made, and are inherently subject to a variety of risks and uncertainties
and other known and unknown factors that could cause actual events or results to differ materially from those projected in the forward-looking
statements. These factors include, but are not limited to: the impact of general domestic and foreign business; economic and political
conditions; global liquidity and credit availability on the timing of cash flows and the values of assets and liabilities based on projected
future conditions; fluctuating metal and commodity prices (such as gold, silver, diesel fuel, natural gas and electricity); currency exchange
rates (such as the Brazilian real and the Canadian dollar versus the United States dollar); changes in interest rates; possible
variations in ore grade or recovery rates; the speculative nature of mineral exploration and development; changes in mineral production
performance, exploitation and exploration successes; diminishing quantities or grades of reserves; increased costs, delays, suspensions,
and technical challenges associated with the construction of capital projects; operating or technical difficulties in connection with
mining or development activities, including disruptions in the maintenance or provision of required infrastructure and information technology
systems; damage to the Company’s or Jacobina’s reputation due to the actual or perceived occurrence of any number of events,
including negative publicity with respect to the handling of environmental matters or dealings with community groups, whether true or
not; risk of loss due to acts of war, terrorism, sabotage and civil disturbances; risks associated with infectious diseases, including
COVID-19; risks associated with nature and climatic conditions; uncertainty regarding whether Jacobina will meet the Company’s capital
allocation objectives; the impact of global liquidity and credit availability on the
i
timing of cash flows
and the values of assets and liabilities based on projected future cash flows; the impact of inflation; fluctuations in the currency markets;
changes in national and local government legislation, taxation, controls or regulations and/or changes in the administration of laws,
policies and practices, expropriation or nationalization of property and political or economic developments in Brazil; failure to comply
with environmental and health and safety laws and regulations; timing of receipt of, or failure to comply with, necessary permits and
approvals; changes in project parameters as plans continue to be refined; changes in project development, construction, production and
commissioning time frames; contests over title to properties or over access to water, power, and other required infrastructure; increased
costs and physical risks including extreme weather events and resource shortages related to climate change; availability and increased
costs associated with mining inputs and labor; the possibility of project cost overruns or unanticipated costs and expenses, potential
impairment charges, higher prices for fuel, steel, power, labour, and other consumables contributing to higher costs; unexpected changes
in mine life; final pricing for concentrate sales; unanticipated results of future studies; seasonality and unanticipated weather changes;
costs and timing of the development of new deposits; success of exploration activities; risks related to relying on local advisors and
consultants in foreign jurisdictions; unanticipated reclamation expenses; limitations on insurance coverage; timing and possible
outcome of pending and outstanding litigation and labour disputes; risks related to enforcing legal rights in foreign jurisdictions, vulnerability
of information systems and risks related to global financial conditions. In addition, there are risks and hazards associated with the
business of mineral exploration, development, and mining, including environmental hazards, industrial accidents, unusual or unexpected
formations, pressures, cave-ins, flooding, failure of plant, equipment, or processes to operate as anticipated (and the risk of inadequate
insurance, or inability to obtain insurance, to cover these risks), as well as those risk factors discussed or referred to herein and
in the Company’s Annual Information Form filed with the securities regulatory authorities in all of the provinces and territories
of Canada and available under the Company’s profile at www.sedar.com, and the Company’s Annual Report on Form 40-F filed
with the United States Securities and Exchange Commission. Although the Company has attempted to identify important factors that could
cause actual actions, events, or results to differ materially from those described in forward-looking statements, there may be other factors
that cause actions, events, or results not to be anticipated, estimated or intended. There can be no assurance that forward-looking
statements will prove to be accurate, as actual results and future events could differ materially from those anticipated in such statements.
The Company undertakes no obligation to update forward-looking statements if circumstances or management’s estimates, assumptions,
or opinions should change, except as required by applicable law. The reader is cautioned not to place undue reliance on forward-looking
statements. The forward-looking information contained herein is presented for the purpose of assisting investors in understanding the
Company’s expected financial and operational performance and results as at and for the periods ended on the dates presented in the
Company’s plans and objectives and may not be appropriate for other purposes.
ii
Cautionary Note to United States Investors Concerning Estimates
of Mineral Reserves and Mineral Resources
This report has been prepared in accordance with the requirements of
the securities laws in effect in Canada, which differ in certain material respects from the disclosure requirements promulgated by the
Securities and Exchange Commission (the “SEC”). For example, the terms “Mineral Reserve”, “Proven Mineral Reserve”,
“Probable Mineral Reserve”, “Mineral Resource”, “Measured Mineral Resource”, “Indicated Mineral Resource”
and “Inferred Mineral Resource” are Canadian mining terms as defined in accordance with Canadian National Instrument 43-101
Standards of Disclosure for Mineral Projects and the Canadian Institute of Mining, Metallurgy and Petroleum (the “CIM”) - CIM
Definition Standards on Mineral Resources and Mineral Reserves, adopted by the CIM Council, as amended. These definitions differ from
the definitions in the disclosure requirements promulgated by the SEC. Accordingly, information contained in this report may not be comparable
to similar information made public by U.S. companies reporting pursuant to SEC disclosure requirements.
Non-GAAP Measures
The Company has included certain non-GAAP financial measures and additional
line items or subtotals, which the Company believes that, together with measures determined in accordance with IFRS, provide investors
with an improved ability to evaluate the underlying performance of the Company. Non-GAAP financial measures do not have any standardized
meaning prescribed under IFRS, and therefore they may not be comparable to similar measures employed by other companies. The data is intended
to provide additional information and should not be considered in isolation or as a substitute for measures of performance prepared in
accordance with IFRS. The non-GAAP financial measures included in this report include: free cash flow, cash costs per gold-equivalent
ounce sold, and all-in sustaining costs per gold-equivalent ounce sold. Please refer to section 11 of the Company’s current annual
Management’s Discussion and Analysis, which is filed under the Company’s profile on SEDAR at www.sedar.com and which includes
a detailed discussion of the usefulness of the non-GAAP measures. The Company believes that in addition to conventional measures prepared
in accordance with IFRS, the Company and certain investors and analysts use this information to evaluate the Company’s performance.
In particular, management uses these measures for internal valuation for the period and to assist with planning and forecasting of future
operations.
iii
LIST OF ABBREVIATIONS
Units of measurement used in this report conform to the
metric system. All currency in this report is listed in US dollars (US$) unless noted otherwise.
| ° |
degrees |
|
SMU |
selective mining units |
| > |
greater than |
|
SOP |
standard operating procedure |
| < |
less than |
|
t |
metric tonne |
| % |
percent |
|
tpy |
metric tonnes per year |
| a |
annum |
|
tpd |
metric tonnes per calendar day |
| A |
ampere |
|
TSF |
tailings storage facility |
| Ag |
silver |
|
USD, US$ |
United States dollar |
| ANM |
National Mining Agency |
|
V |
volt |
| ARD |
acid rock drainage |
|
VSO |
Vulcan Stope Optimizer |
| Au |
gold |
|
W |
watt |
| BRL, R$ |
Brazilian real |
|
yd3 |
cubic yard |
| °C |
degree Celsius |
|
y |
year |
| cfm |
cubic feet per minute |
|
|
|
| CIP |
carbon-in-pulp |
|
Jacobina Mining Blocks |
| cm |
centimetre |
|
|
|
| d |
day |
|
JBN |
João Belo |
| DCF |
discounted cash flow |
|
MCZ |
Morro do Cuscuz |
| EPCM |
engineering, procurement, construction management |
|
MVT |
Morro do Vento |
| g |
gram |
|
SCO |
Serra do Córrego |
| g |
peak ground acceleration |
|
CAS |
Canavieiras South |
| G |
giga (billion) |
|
CAC |
Canavieiras Central |
| Ga |
billion years ago |
|
CAN |
Canavieiras North |
| g/t |
grams per tonne |
|
|
|
| ha |
hectare |
|
|
|
| hp |
horsepower |
|
|
|
| h |
hour |
|
|
|
| HSEC |
Health, safety, environment and community |
|
|
|
| Hz |
hertz |
|
|
|
| IFRS |
international financial reporting standards |
|
|
| JMC |
Jacobina Mineração e Comércio S. A. |
|
|
| k |
kilo (thousand) |
|
|
| kg |
kilogram |
|
|
| km |
kilometre |
|
|
| km2 |
square kilometre |
|
|
| km/h |
kilometres per hour |
|
|
| kVA |
kilovolt-amperes |
|
|
| kW |
kilowatt |
|
|
| kWh |
kilowatt-hour |
|
|
| IFC |
International Finance Corporation |
|
|
| LOM |
life of mine |
|
|
| L |
litre |
|
|
| LOM |
life of mine |
|
|
| m |
metre |
|
|
| M |
Mega, million |
|
|
| m2 |
square metre |
|
|
| m3 |
cubic metre |
|
|
| masl |
metres above sea level |
|
|
| μg |
microgram |
|
|
| Ma |
million years ago |
|
|
| m3/h |
cubic metres per hour |
|
|
| ML |
metal leaching |
|
|
| μm |
micrometre, micron |
|
|
| mm |
millimetre |
|
|
| MW |
megawatt |
|
|
| MWh |
megawatt-hour |
|
|
| NSR |
net smelter return |
|
|
| NPV |
net present value |
|
|
| oz |
Troy ounce (31.1035g) |
|
|
| PFS |
pre-feasibility study |
|
|
| PS |
performance standards |
|
|
| ppb |
parts per billion |
|
|
| ppm |
parts per million |
|
|
| QA/QC |
quality assurance/quality control |
|
|
| RC |
reverse circulation |
|
|
| ROM |
run-of-mine |
|
|
| s |
second |
|
|
| SD |
standard deviation |
|
|
| SLS |
sublevel longhole stoping |
|
|
iv
1
SUMMARY
This report documents the Jacobina Mine (Jacobina), an
underground gold mine located in the state of Bahia of northeastern Brazil. Yamana Gold Inc. (Yamana) holds a 100% interest in the property
through its subsidiary, Jacobina Mineração e Comércio S. A. (JMC).
Yamana is a Canadian-based precious metals producer with
significant gold and silver production- and development-stage properties, exploration properties, and land positions throughout the Americas,
including Canada, Brazil, Chile, and Argentina. Yamana plans to continue to build on this base through expansion and optimization initiatives
at existing operating mines, development of new mines, advancement of its exploration properties and, at times, by targeting other consolidation
opportunities, with a primary focus on the Americas.
This NI 43-101 technical report prepared in accordance
with National Instrument 43-101 — Standards of Disclosure for Mineral Projects (NI 43-101) documents the mineral resource and mineral
reserve estimate of Jacobina as of December 31, 2019; it also summarizes the current mining operation at the Jacobina Gold Mine as
of December 31, 2019; it summarizes the LOM plan and cost estimates for the Phase 1 Optimization scenario with a plant throughput
of 6,500 tpd; and it summarizes the results of a pre-feasibility study (PFS), conducted by Ausenco Limited (Ausenco) with a signature
date of March 31, 2020, that evaluated a mill expansion, referred to as the Phase 2 Expansion, that would increase throughput to
8,500 tpd, a 30% increase in annual gold production.
1.1
PROPERTY DESCRIPTION
The Jacobina Mine Complex is located approximately 340
km by road northwest of the city of Salvador. The Jacobina project area forms a long rectangle measuring 155 km in a north-south direction
and 5 to 25 km in an east-west direction. The shape of the claim package reflects the underlying geology as the stratigraphy favourable
for hosting gold mineralization trends north-south.
The core mine area measures roughly eight kilometers in
length, extending from João Belo (JBN) in the south through Morro do Cuscuz (MCZ), Morro do Vento (MVT) and the Canavieiras Sector
(CAV) (that comprises Canavieiras South (Sul) (CAS), Canavieiras Central (CAC), and Canavieiras North (Norte) (CAN)), at the north end.
All sectors of the mine are connected by roads and underground development. The core mine and the extension to the south are covered by
mining leases whereas the exploration potential to the north are covered by exploration concessions.
Yamana acquired Jacobina when it completed the purchase
of Desert Sun Mining Corp. (Desert Sun) in April 2006. The mineral rights of the Jacobina property consist of approximately 5,954
ha of mining concessions, 71,045 ha of exploration permits, and one 650 ha mining claim; all of
1
which are held by JMC. JMC has all required permits to
continue carrying out the proposed mining operations on the Jacobina property.
JMC does not pay royalties, however, it does pay taxes
to the federal mineral sector agency; these taxes, called Compensação Financeira pela Exploração de Recursos Minerais
(CFEM) and also known as the Brazilian mining royalty, are set at a rate of 1.5%. JMC does not have any obligations in respect to back-in
rights, payments, or other agreements or encumbrances.
1.2
GEOLOGY AND MINERALIZATION
The Serra de Jacobina Mountains have been mined for gold
since the late 17th century. Numerous old workings from artisanal miners (garimpeiros) can be seen along a 15-km strike length, following
the ridges of the Serra Do Ouro mountain chain. Since mining commenced at Jacobina in 1983, over 33 Mt of tonnes have been processed at
an average grade of 2.19 g/t gold for a production of over 2.2 Moz of gold.
The gold mineralization at Jacobina is hosted almost entirely
within quartz pebble conglomerates of the Serra do Córrego Formation, the lowermost sequence of the Proterozoic-age Jacobina Group.
The gold-bearing reefs range from less than 1.5 m to 25 m in thickness and can be followed along strike for hundreds of metres, and in
some cases for kilometres. Although they are quite homogeneous along their strike and dip extensions, the gold-bearing conglomerates differ
from one another in stratigraphic position and pattern of gold distribution. The differences are likely due to variations in the sedimentary
source regions, erosion and transportation mechanisms, and the nature of the depositional environments. Not all conglomerates of the Serra
do Córrego Formation are gold-bearing.
1.3
EXPLORATION STATUS
Since acquiring Jacobina in 2006, Yamana has carried out
regional mapping and sampling with the goal of identifying additional surface occurrences of mineralized conglomerates along the strike
length of the Jacobina belt. The favourable gold-bearing stratigraphy at Jacobina has been traced along a strike length for approximately
150 km.
The significant exploration results at Jacobina were obtained
by underground core drilling. Drilling activities since 2017 have been successful in defining the plunge of the higher-grade portions
of mineralized zones and have led to the discovery of new mineralized zones. On the basis of these exploration successes and the production
history at Jacobina, good potential exists in the proximity of the current mine infrastructure for the discovery of new mineralized zones
and of the strike and dip extents of known mineralized horizons.
Analytical samples include both drill core and channel
samples. The drill core samples are generated from exploration and infill drilling programs that are conducted on surface and underground;
they are used for target generation and estimation of mineral resources and
2
reserves. The sample preparation, sample security, and
analytical procedures at Jacobina are adequate and consistent with industry standards. The verification of the sampling data by Yamana
and external consultants, including the analytical quality control data produced by Yamana for samples submitted to various laboratories,
suggests that the analytical results delivered by the laboratories are sufficiently reliable for the purpose of mineral resource and mineral
reserve estimation.
1.4
MINERAL RESOURCE AND MINERAL RESERVE ESTIMATES
Preparation of the mineralized wireframe models used to
estimate the block grades began with the preparation of a structural model that reflected the current understanding of the location and
offsets of the many post-mineralization faults present in the mining areas. A series of lithological wireframe models was subsequently
prepared to depict the overall location and distribution of the quartz-pebble conglomerate reefs and the interbedded massive quartzite
beds. These lithological models were subsequently used to prepare wireframe models of the mineralized intervals. No minimum thickness
was applied to the mineralized wireframes used to generate the grade estimation domains. The mineralized wireframes were created using
a cut-off grade of 0.5 g/t gold. However, minimum thickness-reporting criteria for mineral resources was applied during the generation
of conceptual mining shapes.
Jacobina mineral resources have been estimated in conformity
with generally accepted standards set out in CIM Mineral Resource and Mineral Reserves Estimation Best Practices Guidelines (November 2019)
and were classified according to CIM Definition Standards for Mineral Resources and Mineral Reserves (May 2014). Mineral resources
are not mineral reserves and have not demonstrated economic viability. Underground mineral resources are estimated within conceptual underground
mining shapes at a cut-off grade of 1.00 g/t gold, which corresponds to 75% of the break-even cut-off used to estimate the mineral reserves.
A minimum mining width of 1.5 m is used to construct the conceptual mining shapes. Mineral resources are reported considering internal
waste and dilution.
The Mineral
Resource Statement of Jacobina as of December 31, 2019, exclusive of mineral reserves, is presented in Table 1-1.
Table
1-1: Jacobina Mineral Resource Statement, December 31, 2019
| Category |
|
Tonnage
(kt) |
|
Gold Grade
(Au g/t) |
|
Contained
Gold (koz) |
|
| Measured |
|
27,705 |
|
2.26 |
|
2,014 |
|
| Indicated |
|
14,765 |
|
2.27 |
|
1,076 |
|
| Total Measured + Indicated |
|
42,470 |
|
2.26 |
|
3,090 |
|
| Inferred |
|
18,528 |
|
2.36 |
|
1,406 |
|
1.
Mineral resources have been estimated by the Jacobina Resources Geology Team under the supervision of Renan Garcia Lopes, Senior
Geologist, Registered Chartered Professional Member of Australasian Institute of Mining and Metallurgy, MAusIMM CP(Geo) Number 328085,
3
a full-time employee of JMC, and a qualified person as
defined by National Instrument 43-101. The mineral resource estimate conforms to the CIM (2014) Standards.
2.
Mineral resources are reported exclusive of mineral reserves.
3.
Mineral resources are not mineral reserves and do not have demonstrated economic viability.
4.
Underground cut-off grade is 1.00 g/t Au, which corresponds to 75% of the cut-off used to estimate the mineral reserves.
5.
Minimum mining width of 1.5 m, considering internal waste and dilution
6.
All figures are rounded to reflect the relative accuracy of the estimate. Numbers may not add up due to rounding.
The methodology used at Jacobina to convert mineral resources
to mineral reserves is summarized as follows:
·
Verify geometries for the block model and resource wireframes.
·
Confirm accurate block model depletion with current excavated development and stope solids up to the effective reporting date.
·
Discard any resources within 30 m of the surface topography.
·
Create automated stope shapes using MSO in Datamine using variable break-even cut-off grades by zone and stope dimensions of 10
× 10 m.
·
Design stope polygons in Maptek Vulcan based on MSO stope shapes at section spacing of 5 to 10 m, depending on continuity of mineralization.
·
Design the stope shapes in Maptek Vulcan based on the stope polygons and the stope design parameters, considering orebody geometry,
mine layout, historical information, and geotechnical analysis.
·
Design development shapes and cut development shapes from stope shapes.
·
Evaluate all shapes against the block model and report ore tonnes and grade by classification. Exclude stope shapes and associated
development below the cut-off grades.
·
Exclude all stopes that contain mostly inferred mineral resources.
·
Design capital and auxiliary development, including ramps, ventilation, materials handling, access, and infrastructure.
·
Complete an economic analysis of each stope shape and exclude all stope shapes that are not cash-flow positive when considering
associated development and infrastructure.
4
·
Complete a geotechnical analysis of each sector and make adjustments to the design where required.
·
List stopes as “approved” or “not approved” based on cut-off grade, economic and geotechnical analyses prior
to conversion to mineral reserves. Apply the mining extraction factor.
The Mineral
Reserve Statement of Jacobina as of December 31, 2019, is presented in Table 1-2.
Table
1-2: Jacobina Mineral Reserve Statement, December 31, 2019
| |
|
|
Proven |
|
|
Probable |
|
|
Total Reserves |
|
| |
|
|
Tonnes |
|
Gold
Grade |
|
Contained
Gold |
|
|
Tonnes |
|
Gold
Grade |
|
Contained
Gold |
|
|
Tonnes |
|
Gold
Grade |
|
Contained
Gold |
|
| Zone |
|
|
kt |
|
g/t Au |
|
koz |
|
|
kt |
|
g/t Au |
|
koz |
|
|
kt |
|
g/t Au |
|
koz |
|
| JBN |
|
|
6,591 |
|
1.93 |
|
408 |
|
|
3,388 |
|
1.87 |
|
203 |
|
|
9,979 |
|
1.91 |
|
612 |
|
| MVT |
|
|
2,268 |
|
2.11 |
|
154 |
|
|
5,674 |
|
2.44 |
|
445 |
|
|
7,942 |
|
2.35 |
|
599 |
|
| MCZ |
|
|
1,449 |
|
1.93 |
|
90 |
|
|
87 |
|
1.96 |
|
5 |
|
|
1,536 |
|
1.93 |
|
95 |
|
| SCO |
|
|
673 |
|
1.93 |
|
42 |
|
|
1,356 |
|
2.1 |
|
92 |
|
|
2,030 |
|
2.04 |
|
133 |
|
| CAS |
|
|
5,761 |
|
2.33 |
|
432 |
|
|
1,117 |
|
2.12 |
|
76 |
|
|
6,878 |
|
2.3 |
|
508 |
|
| CAC |
|
|
2,640 |
|
3.39 |
|
288 |
|
|
1,372 |
|
2.56 |
|
113 |
|
|
4,012 |
|
3.1 |
|
400 |
|
| CAN |
|
|
1,338 |
|
2.59 |
|
111 |
|
|
461 |
|
2.29 |
|
34 |
|
|
1,799 |
|
2.51 |
|
145 |
|
| Total |
|
|
20,720 |
|
2.29 |
|
1,525 |
|
|
13,456 |
|
2.24 |
|
968 |
|
|
34,176 |
|
2.27 |
|
2,493 |
|
1.
Mineral reserves have been estimated by the Jacobina long-term mine planning team under the supervision of Eduardo de Souza
Soares, Registered Chartered Professional Member of Australasian Institute of Mining and Metallurgy, MAusIMM CP(Min) Number 330431, a
full-time employee of JMC, and a qualified person as defined by National Instrument 43-101. The mineral reserve estimate conforms to the
CIM (2014) Standards.
2.
Mineral reserves are reported by zone at variable cut-off grades ranging from of 1.12 g/t to 1.30 g/t gold. Lower-grade
stopes were subsequently excluded from the life of mine plan and mineral reserves inventory to optimize the cash flow model. The cut-off
grade is based on metal price assumptions of US$1,250/oz for gold, a gold processing recovery assumption of 96%, and operating cost assumptions
ranging from US$42.60 to 49.52/t processed.
3.
Mineral reserves are stated at a mill feed reference point and account for minimum mining widths, diluting material, and mining
losses.
4.
All stope shapes contain a majority of measured and indicated mineral resources and may include minority portions of inferred
resources and unclassified material with modelled gold grades.
5.
Numbers may not add up due to rounding.
1.5
MINING AND PROCESSING METHODS
Jacobina utilizes the sublevel longhole stoping (SLS) method
without backfill to achieve an average production rate of approximately 6,500 tpd from the ramp-accessed underground
5
mines; these include João Belo, Canavieiras, Serra
do Córrego, Morro do Cuscuz, and Morro do Vento.
Yamana is currently reviewing alternative mining methods
and testing the suitability of the Jacobina tailings for paste fill or hydraulic fill applications. The results will be considered in
a conceptual study that will evaluate the potential for constructing a fill plant at Jacobina. The use of cemented rock fill is also being
evaluated. Alternative mining methods and the use of backfill is likely to increase mining extraction and has the potential to increase
conversion of measured and indicated mineral resources to mineral reserves.
The major assets and facilities associated with Jacobina
are: the mining and processing infrastructure, including office buildings, shops, and equipment; a conventional processing plant which
produces gold doré and is equipped with crushers, ball mills, leach tanks and carbon-in-pulp (CIP) tanks; and a TSF with a final
design capacity for the life of mine (LOM).
Jacobina Mine is connected to the National Electric Grid
through a 138 kV transmission line connected to the Jacobina II electric substation in the City of Jacobina.
The tailings produced at the Jacobina mill are presently
stored in a fully lined tailings storage facility, TSF B2, located 2.5 km north of the mineral processing plant. TSF B2 consists of a
cyclone sand dam built following a downstream construction method. TSF B1 is a legacy tailings facility that has not been in operation
since 2012.
The Jacobina mineral processing plant uses conventional
gold processing methodologies to treat run-of-mine (ROM) material from the underground mines. Comminution comprises three stages of crushing
followed by wet grinding. Within the grinding circuit, gravity concentration of gold is performed on a bleed stream of classification
cyclone underflow. Rejects from the gravity circuit are returned to the grinding circuit. The cyclone overflow is sent to leaching in
a conventional cyanide leaching process, and gold extraction from the leach solution is performed by carbon adsorption in the CIP tanks.
Gold is stripped in an elution circuit and final gold recovery is performed in an electrowinning circuit. The sludge and solids from electrowinning
are dried and smelted in an induction furnace to produce doré bars. The overall gold recovery in 2019 was 96.7%.
The Phase 1 life of mine (LOM) plan, including optimization
of the processing plant to stabilize throughput at a sustainable 6,500 tpd (Phase 1 Optimization) due for completion in mid-2020, has
been developed based on the mineral reserves inventory of Jacobina as of December 31, 2019, resulting in a mine life of 14.5 years.
6
1.6
ENVIRONMENTAL STUDIES, PERMITTING, AND SOCIAL OR COMMUNITY IMPACT
No environmental issues were identified from the documentation
available for review that could materially impact the ability to extract the mineral resources and mineral reserves. Jacobina has the
operational licences required for operation according to the national legislation. The approved licences address the authority’s
requirements for mining extraction and operation activities. For expired licences in the process of being renewed, they remain valid until
the revalidation process is completed by Instituto do Meio Ambiente e Recursos Hídricos (INEMA), the environmental agency for the
state of Bahia. In compliance with conditions established in the operating licences, annual environmental assurance technical reports
are submitted to the authorities.
An environmental monitoring program is in place at Jacobina
for weather, surface water quality, groundwater quality, air quality and emissions, and ambient noise. Monitoring of flora and fauna was
initiated in the first quarter of 2020.
Acid rock drainage (ARD) and metal leaching (ML) associated
with TSF B1 and the João Belo stockpile (both inactive facilities), are managed through ponds and groundwater interceptor wells located
downstream of the facilities. Water quality is monitored by Yamana at various locations downstream. Yamana is planning to install additional
groundwater monitoring wells in the TSF areas. TSF B1 is being rehabilitated.
The water management system implemented at Jacobina appears
to be sound and follows common practices applicable for the protection of the environment.
The ore processing system was designed to maximize the
recirculation of process water and minimize the requirement for freshwater. The mine water is pumped back to the underground operations.
The water collected in the active TSF B2 is recirculated to the process plant. Freshwater required for ore processing is supplied from
a reservoir built in the Cuia River. There is no discharge of industrial water to the environment. The site wide water balance mitigates
the risk to water supply due to drought as well as the risk of excess water to the operation.
Yamana has implemented an integrated management system
covering health, safety, environment, and community through internationally accredited systems.
A conceptual mine closure plan was developed in 2018 for
the mine components that includes a closure cost estimate. The latest version was completed in December 2018. With the potential
for impacts to water from ARD/ML, and an existing sulphate/metals plume collection system, there could be long-term water management and
treatment requirements post-closure. Long- term closure costs could potentially extend several years beyond closure.
No known social issues were identified from the documentation
available for review. At present, Yamana’s operations at Jacobina are a positive contribution to sustainability and community
7
well-being. Jacobina has demonstrated a commitment to employee
health, safety, and well-being; community programs; and ongoing outreach and data collection to support issues management and mitigation.
Yamana has established and continues to implement its various policies, procedures, and practices in a manner broadly consistent with
relevant IFC Performance Standards.
1.7
PHASE 2 EXPANSION PRE-FEASIBILITY STUDY
Yamana commissioned Ausenco to conduct a pre-feasibility
study (PFS) of the proposed Phase 2 Expansion. This study, dated March 31, 2020, considered an expansion scenario that would increase
the processing plant’s throughput capacity from 6,500 tpd to 8,500 tpd.
In 2019, Jacobina began optimizing the processing plant
to stabilize throughput at a target rate of 6,500 tpd. Yamana refers to this optimization as Phase 1 Optimization. The first step of the
optimization was the installation of an Advanced Process Control system in early 2019 to increase the level of plant automation. Other
components of the optimization include additional gravity concentrators, a new induction kiln, replacement of screens, and new carbon-in-pulp
(CIP) tanks. The Phase 1 Optimization project is on track for completion in mid-2020.
Jacobina achieved the Phase 1 Optimization throughput objective
of 6,500 tpd in the first quarter of 2020, a full quarter ahead of schedule and without the benefits expected from the installation of
all the plant modifications. Yamana continues to evaluate the actual Phase 1 performance and pursue further debottlenecking initiatives
to determine the sustainable throughput level in excess of 6,500 tpd that the mill can achieve without additional investment. JMC is already
permitted for throughput of up to 7,500 tpd.
Following up on Phase 1 Optimization, Yamana is studying
the increase in throughput to 8,500 tpd; this is referred to as the Phase 2 Expansion. The throughput increase is expected to be achieved
through the installation of an additional grinding line and incremental upgrades to the crushing and gravity circuits. If implemented,
the Phase 2 Expansion is expected to increase annual gold production by 31%, reduce costs, and generate significant cash flow and attractive
returns. The total capital cost of the Phase 2 Expansion is estimated at US$57 M, of which US$35 M is assigned for the processing plant,
US$14 M for underground mining, and US$8 M for infrastructure.
The Phase 2 Expansion LOM (or PFS case) is based on the
mineral reserves with an effective date of December 31, 2019. The PFS case LOM plan considers a mine life of 11.5 years, starting
with a plant feed rate of 6,500 tpd for 2020 and 2021, ramping up production in 2022, to reach the average plant feed rate of 8,500 tpd
by 2023. Plant throughput will be maintained at 8,500 tpd until 2030 and will decrease in 2031. The LOM gold production profile of the
PFS case increases from a target Phase 1 Optimization running rate of 175 koz per year to approximately 230 koz per year.
8
For internal planning purposes, an extended mine plan (Extended
Case) has been developed that considers the addition of 9.5 Mt of plant feed with an average grade of 2.40 g/t gold, assuming the successful
conversion of mineral resources into reserves. This would increase the mine life of the Phase 2 Expansion scenario from 11.5 years to
14.5 years.
Detailed engineering for the Phase 2 Expansion is currently
scheduled to commence soon after commissioning of the Phase 1 Optimization in mid-2020. This would allow engineering and construction
to be completed by early 2023.
Capital costs associated with the Phase 2 Expansion would
not commence until 2021. These timelines are dependent on completion of the Phase 2 Expansion feasibility study by mid-2021. The feasibility
study will look to further refine and optimize operating costs and also take into account the actual realized potential under the Phase
1 Optimization to determine the true potential of the Phase 2 Expansion. Yamana may choose to normalize operations under the Phase 1 Optimization
for a period of time in order to determine the true realizable throughput for this phase before proceeding with the Phase 2 Expansion.
JMC has applied for permitting and expects the permits
to be issued by late 2021, within the timeframes currently assumed for implementation of the Phase 2 Expansion. The permit application
is for higher throughput than what is contemplated in the Phase 2 Expansion; this to ensure future flexibility.
1.8
CONCLUSIONS AND RECOMMENDATIONS
More than 2.2 Moz of gold have been produced from Jacobina
since modern mining commenced in 1983. Annual gold production has increased year-after-year from 74 koz in 2013 to more than 159 koz in
2019, through increases in plant throughput, gold feed grade, and metallurgical recovery.
Drilling activities in previous years have been successful
in defining the plunge of the higher-grade portions of the mineralized zones and have led to the discovery of new mineralized zones, such
as João Belo Sul and the extension of mineralization in the East Block. On the basis of these exploration successes and the production
history at Jacobina, good potential exists in the proximity of the current mine infrastructure for discovering new mineralized zones and/or
the strike and dip extents of the known mineralized horizons.
In terms of the regional exploration potential, the favourable
stratigraphy hosting the gold mineralization at Jacobina has been traced along a strike length of approximately 150 km. Exploration programs
have discovered many gold occurrences along this favourable stratigraphy, including the Jacobina Norte project where gold mineralization
has been discovered along a continuous 15 km-long trend. As of the end of December 2019, 7,067 drill holes were drilled in the Jacobina
project area, for a total of 868,000 metres. Almost all of this
9
drilling has been within the 11 km-long mining district,
with the majority of the 88,000 hectares of exploration concessions still yet to be drilled.
Jacobina mineral resources and mineral reserves have been
estimated in conformity with generally accepted CIM Estimation of Mineral Resources and Mineral Reserves Best Practice Guidelines (November 2019)
and are reported in accordance with CIM (2014) Standards. The total proven and probable mineral reserve at Jacobina as of December 31,
2019, is 34.2 Mt averaging 2.27 g/t gold, for approximately 2.5 Moz of contained gold. In addition, measured and indicated mineral resources
total 42.5 Mt grading 2.26 g/t gold (3.1 Moz gold) and inferred mineral resources of 18.5 Mt grading 2.36 g/t gold (1.4 Moz gold).
In 2019, Jacobina began optimizing the processing plant
to stabilize throughput at a target rate of 6,500 tpd, referred to as the Phase 1 Optimization, which is on track for completion in mid-2020.
Jacobina achieved the Phase 1 Optimization objective of 6,500 tpd in the first quarter of 2020, a full quarter ahead of schedule and without
the benefits expected from the installation of all the plant modifications. Yamana continues to evaluate the actual performance of the
Phase 1 Optimization and pursue further debottlenecking initiatives to determine the sustainable throughput level in excess of 6,500 tpd
that the mill can achieve without additional investment.
Following up on the Phase 1 Optimization, Jacobina is studying
the increase in throughput to 8,500 tpd, referred to as the Phase 2 Expansion. Yamana completed a pre-feasibility study for the Phase
2 Expansion in the first quarter of 2020 and will continue with a feasibility study, scheduled for completion in mid-2021.
Three LOM plan scenarios have been developed. In all scenarios,
mining and processing of lower-grade supplementary mineral reserves is deferred until late in the mine life where possible, allowing feed
grades of approximately 2.4 g/t gold to be maintained. The Phase 1 Optimization LOM plan assumes a plant throughput rate of 6,500 tpd
and is based on mineral reserves as of December 31, 2019. In this scenario, the mine life is 14.5 years, with gold production of
175,000 oz per year at a gold feed grade of 2.4 g/t, and a gold metallurgical recovery of 96.5%.
The second scenario, the Phase 2 Expansion PFS case, is
based on the same mineral reserves as the Phase 1 case, but includes the Phase 2 Expansion with plant throughput ramping up to 8,500 tpd
by 2023. With the higher throughput rate, mine life is reduced to 11.5 years and gold production increases to 230,000 oz per year. The
third scenario, referred to as the Phase 2 Expansion Extended Case and that Yamana uses as a base case for internal planning purposes,
is the same as the Phase 2 PFS case, but considers an additional 9.5 Mt of plant feed at an average grade of 2.4 g/t gold based on the
expected conversion of current mineral resources to mineral reserves through infill drilling. Gold production remains at 230,000 oz per
year and mine life is extended to 14.5 years. Based on the impressive track record of discovery and successful conversion of mineral resources
to mineral reserves at Jacobina, Yamana is confident that, based on required infill drilling, the future conversion of mineral resources
to
10
mineral reserves will continue to show positive results.
Furthermore, the favourable geological environment, both near mine and regionally, provides exceptional mineral potential that may eventually
result in extending the mine life beyond the Extended Case
The capital and operating cost estimates for the Phase
1 Optimization LOM plan are based on mine budget data and operating experience, and are appropriate for the known mining methods and production
schedule. Capital cost estimates include appropriate sustaining estimates. Under the assumptions in this technical report, Jacobina has
positive project economics until the end of mine life, which supports the mineral reserve estimate. Capital and operating cost estimates
for the Phase 2 Expansion scenarios were revised as part of the Phase 2 Expansion pre-feasibility study. Total Phase 2 Expansion project
capital costs are estimated at US$57 M, of which $35 M is dedicated to the processing plant, $14M to underground mining, and $8 M to infrastructure.
The project’s capital cost is expected to be invested incrementally and would allow the project to be funded by Jacobina’s cash
flow. LOM average unit operating costs are estimated to decrease from US$41.04/t in the Phase 1 Optimization case to $37.50/t in the Phase
2 Expansion PFS case, due to improved efficiency and the distribution of fixed costs over a greater quantity of tonnes per year.
No environmental issues were identified from the documentation
available for review that could materially impact the ability to extract the mineral resources and mineral reserves. Jacobina has all
the operational licences required for operation according to the national legislation. The approved licences address the authority’s
requirements for mining extraction and operation activities. For the Phase 2 Expansion, Yamana has applied for permitting and expects
the permits to be issued by late 2021, within the timeframes currently assumed for implementation of Phase 2. The permit application is
for higher throughput than what is contemplated in Phase 2 to ensure future flexibility. JMC is already permitted for throughput of up
to 7,500 tpd.
No social issues were identified from the documentation
available for review. At present, Yamana’s operations at Jacobina are a positive contribution to sustainability and community well-being.
Jacobina has demonstrated a commitment to employee health, safety, and well-being; community programs; and ongoing outreach and data collection
to support issues management and mitigation. Yamana has established and continues to implement its various policies, procedures, and practices
in a manner broadly consistent with relevant IFC Performance Standards.
The results of this technical report are subject to variations
in operational conditions including, but not limited to the following:
·
Assumptions related to commodity and foreign exchange (in particular, the relative movement of gold and the Brazilian real/US dollar
exchange rate)
·
Unanticipated inflation of capital or operating costs
·
Significant changes in equipment productivities
·
Geological continuity of the mineralized structures
11
·
Geotechnical assumptions in pit and underground designs
·
Ore dilution or loss
·
Throughput and recovery rate assumptions
·
Changes in political and regulatory requirements that may affect the operation or future closure plans
·
Changes in closure plan costs
·
Availability of financing and changes in modelled taxes
In the opinion of the qualified persons, there are no reasonably
foreseen inputs from risks and uncertainties identified in the technical report that could affect the project’s continued economic
viability.
Based on success in extending known mineral resources,
Yamana should continue exploration at the mining operations. Due to the quantity of material in the mineral reserve category and its impact
on mine life, Yamana’s focus is to continue infill drilling programs in support of converting mineral resources to mineral reserves.
An additional focus will be to carry out exploration programs in the vicinities of the current mines to search for the strike and depth
extensions of known mineralization.
Based on processing plant performance in the first quarter
of 2020, in which the processing plant throughput exceeded the Phase 1 Optimization target of 6,500 tpd, without the inclusion of the
benefits expected from the installation of all the plant modifications, Yamana should continue to evaluate the Phase 1 Optimization actual
performance and pursue further debottlenecking initiatives to determine the sustainable throughput level in excess of 6,500 tpd that the
mill can achieve without additional investment.
Based on the positive results of the Phase 2 Expansion
pre-feasibility study, Yamana should continue to advance the level of engineering for the Phase 2 Expansion and proceed to feasibility
study. The feasibility study should look to further improve operating costs and also take into account the actual realized potential under
the Phase 1 Optimization to determine the true potential of Phase 2 Expansion. In parallel to the Phase 2 Expansion feasibility study,
Yamana should continue the application of permits for the increased throughput capacity.
Yamana should continue to evaluate the suitability of alternative
mining methods and tailings as paste or hydraulic backfill, in addition to the use of multiple backfill types to optimize mining extraction.
Yamana has initiated a separate study outside the Phase 2 Expansion PFS to evaluate the installation of a backfill plant to allow up to
2,000 tpd of tailings to be deposited in underground voids. Preliminary results indicate that the project has the potential to reduce
the environmental footprint, extend the life of the existing tailing storage facility, and improve mining recovery, resulting in an increased
conversion of mineral resources to mineral reserves.
Regarding environmental and social management, SLR recommends
the following:
12
·
Conduct geochemical sampling and characterization of waste rock before developing a new waste rock stockpile.
·
Maintain a robust water quality monitoring program to verify compliance with applicable environmental standards and evaluate the
appropriateness of the water management strategies that are in place.
·
Continue to implement the environmental monitoring program, which monitors and manages potential environmental impacts resulting
from the mine operations, to inform future permit applications and mine closure plan updates.
·
Consider the implementation of a noise- and vibrations-monitoring program, consistent with the integrated 2016 HSEC Framework.
·
Consider establishing an energy and emissions strategy/plan to determine, on a defined frequency, sources of energy consumption
and associated greenhouse gas (GHG) emissions, consistent with the integrated 2016 HSEC Framework.
·
The existing sulphate/metals plume originating from the decommissioned TSF B1 may potentially cause ongoing effects on water. This
could result in long-term closure costs extending beyond the five-year post-closure treatment period that is currently outlined in the
conceptual 2018 mine closure plan. It is recommended that the closure cost estimate be reviewed as the closure plan and designs for both
TSF facilities are developed in more detail. Costs for long-term monitoring and maintenance of dams should also be reviewed.
·
Considering that, historically, mine site closures have the potential to result in significant economic impacts to a community,
a detailed social management plan should be developed to mitigate the economic and social effects of mine closure; this plan would include
ongoing consultation, training, and planning.
·
Incorporate a strategy for closure of the inactive open pit into the mine closure plan.
13
2
INTRODUCTION
The Jacobina Mine (Jacobina) is an underground gold mine
located in the state of Bahia of northeastern Brazil, approximately 340 km by road northwest of the city of Salvador. Yamana Gold Inc.
(Yamana) holds a 100% interest in the property through its subsidiary, Jacobina Mineração e Comércio S. A. (JMC).
Yamana is a Canadian-based precious metals producer with
significant gold and silver production- and development-stage properties, exploration properties, and land positions throughout the Americas,
including Canada, Brazil, Chile, and Argentina. Yamana plans to continue to build on this base through expansion and optimization initiatives
at existing operating mines, development of new mines, advancement of its exploration properties and, at times, by targeting other consolidation
opportunities, with a primary focus on the Americas.
Yamana acquired Jacobina when it completed the purchase
of Desert Sun Mining Corp. (Desert Sun) in April 2006.
Yamana’s other operations include:
·
100% ownership of the El Peñón underground and open-pit gold-silver mine near Antofagasta in northern Chile
·
50% ownership in the Canadian Malartic open-pit gold mine located in Malartic, Québec, Canada
·
100% ownership in the Cerro Moro underground and open-pit gold-silver mine located in Santa Cruz province, Argentina
·
100% ownership of the Minera Florida underground gold-silver mine located south of Santiago, Chile
This technical report was prepared in accordance with National
Instrument 43-101 — Standards of Disclosure for Mineral Projects (NI 43-101); it documents the mineral resource and mineral
reserve estimates for Jacobina as of December 31, 2019; it also summarizes the current mining operation at the Jacobina Gold Mine
as of December 31, 2019; it summarizes the LOM plan and cost estimates for the Phase 1 Optimization scenario with a plant throughput
of 6,500 tpd; and it summarizes the results of a pre-feasibility study (PFS), conducted by Ausenco Limited (Ausenco) with a signature
date of March 31, 2020, that evaluated a mill expansion, referred to as the Phase 2 Expansion, that would increase throughput to
8,500 tpd, a 30% increase in annual gold production. Results of the Phase 2 expansion study are described in Section 24 of this technical
report.
This technical report was prepared by Yamana following
the guidelines of NI 43-101 and Form 43-101F1. The mineral resource and mineral reserve estimates reported herein were prepared
14
in conformity with generally accepted standards set out
in the Canadian Institute of Mining, Metallurgy and Petroleum (CIM) Mineral Resource and Mineral Reserves Estimation Best Practices Guidelines
(November 2019) and were classified according to CIM Definition Standards for Mineral Resources and Mineral Reserves (CIM (2014)
Standards).
2.1
SOURCES OF INFORMATION
The qualified persons for this technical report are Eduardo
de Souza Soares, MAusIMM CP (Min); Renan Garcia Lopes, MAusIMM CP (Geo); Henry Marsden, P.Geo.; Carlos Iturralde, P.Eng. (all full-time
employees of Yamana); and Luis Vasquez, P.Eng., of SLR Consulting (Canada) Ltd. (SLR).
Mr. de Souza Soares is the Coordinator Technical Services
of the Jacobina mine. He was last at the mine between May 10 and 21, 2020. Mr. Garcia Lopes is a senior geologist for Yamana,
also assigned to the Jacobina mine. He was last at the mine on March 18, 2020. Mr. Marsden, Senior Vice President, Exploration,
for Yamana visited the project on six occasions including most recently on September 12 to 14, 2019. Mr. Iturralde, Director,
Tailings, Health, Safety & Sustainable Development at Yamana, and Mr. Vazquez, Senior Environmental Consultant and Hydrotechnical
Engineer at SLR, have not visited the project due to travel restrictions related to the global COVID-19 pandemic.
Eduardo de Souza Soares is responsible for Sections 13,
15 to 19 (excluding sub-section 18.2), 21 to 22, and 24; he also shares responsibility for related disclosure in Sections 1, 25, 26, and
27 of the technical report. Renan Garcia Lopes is responsible for Section 11, 12, and 14, and shares responsibility for related disclosure
in Sections 1, 25, 26, and 27 of the technical report. Henry Marsden is responsible for Sections 2 to 10, 23, and shares responsibility
for related disclosure in Sections 1, 25, 26, and 27 of the technical report. Luis Vasquez is responsible for Section 20 (excluding
sub-section 20.2.2), and shares responsibility for related disclosure in Sections 1, 25, 26, and 27 of the technical report. Carlos Iturralde
is responsible for Sections 18.2 and 20.2.2, and shares responsibility for related disclosure in Sections 1, 25, 26, and 27 of the technical
report.
In preparation of this technical report, the qualified
persons reviewed technical documents and reports on Jacobina supplied by on-site personnel. The documentation reviewed, and other sources
of information, are listed at the end of this technical report in Section 27-References.
The most recent technical report on Jacobina was compiled
by RPA Inc. (RPA) with an effective date of June 30, 2019 and a signature date of September 30, 2019 (RPA, 2019). The 2019 RPA
report served as the foundation for this current technical report which updates the information as of an effective date of December 31,
2019. This technical report also includes the results of a pre-feasibility study (PFS) conducted by Ausenco with a signature date of March 31,
2020.
15
3
RELIANCE ON OTHER EXPERTS
The information, conclusions, opinions, and estimates contained
herein in this technical report are based on the following parameters:
·
Information available to Yamana at the time of preparation of this technical report
·
Assumptions, conditions, and qualifications as set forth in this technical report
The Brazilian government department responsible for mining
lands, Agência Nacional de Mineração (ANM), maintains an internet-based system for accessing information on exploration
concessions granted in Brazil. Yamana has a computerized claim management system that monitors this site regularly and updates claim data
as required. The qualified persons have not performed an independent verification of the land title and tenure information, as summarized
in Section 4 of this technical report, nor have they verified the legality of any underlying agreement(s) that may exist concerning
the permits or other agreement(s) between third parties, as summarized in Section 4 of this technical report. For this topic,
the qualified persons of this report have relied on information provided by the legal department of Yamana.
The qualified persons have relied on various Yamana departments
for guidance on applicable taxes, royalties, and other government levies or interests, applicable to revenue or income from the Jacobina
mine.
Except for the purposes legislated under applicable securities
laws, any use of this technical report by any third party is at that party’s sole risk.
16
4
PROPERTY DESCRIPTION AND LOCATION
4.1
LOCATION
The Jacobina
Mine Complex, as shown in Figure 4-1, is located in the state of Bahia in northeastern Brazil (11°15’ S and 40°31’
W), approximately 340 km by road northwest of the city of Salvador. Salvador is the state capital of Bahia and has a population of approximately
2.9 million inhabitants.
The Jacobina project area forms a long rectangle measuring
155 km in a north-south direction and 5 to 25 km in an east-west direction. The shape of the claim package reflects the underlying geology
as the stratigraphy favourable for hosting gold mineralization trends north-south.

Figure
4-1: General location map
17
4.2
PROPERTY DESCRIPTION
The Jacobina property covers the core mine area as well
as the on-strike exploration potential in the remainder of the Jacobina basin. The core mine area measures roughly eight kilometers in
length, extending from João Belo (JBN) in the south through Morro do Cuscuz (MCZ), Morro do Vento (MVT) and the Canavieiras Sector
(CAV) (which comprises Canavieiras South (Sul) (CAS), Canavieiras Central (CAC), and Canavieiras North (Norte) (CAN)), at the north end.
All sectors of the mine are connected by roads and underground development. The core mine and the extension to the south are covered by
mining leases while the exploration potential to the north are covered by exploration concessions.
4.3
LAND TENURE
4.3.1
SURFACE RIGHTS
Two general types of surface rights exist on the project:
(1) rights of ownership and (2) rights of possession. Rights of ownership allow the title holder to occupy and sell the land
while rights of possession allow occupation and use but are non-transferable and can not be sold. JMC holds all of the surface rights
required for the development of its activities. There are no restrictions to surface rights in any of the areas encompassed by the project.
JMC holds
rights of possession on 25 areas (Table 4-1) and 15 property titles (surface rights, rights of ownership) (Table 4-2), in Itapicurú,
District of Jacobina, Bahia State, encompassing the entire project area.
18
Table
4-1: Jacobina — Rights of possession
| Vendor |
|
Area (ha) |
|
Location |
|
Date |
| André Santos da Silva |
|
0.155 |
|
Itapicurú |
|
September 2007 |
| Augusto Barbosa da Silva |
|
0.034 |
|
Itapicurú |
|
August 2007 |
| Augusto Barbosa da Silva |
|
0.553 |
|
Itapicurú |
|
June 2007 |
| Djalma Botelho |
|
0.436 |
|
Itapicurú |
|
May 1987 |
| Edivaldo Santos Santiago |
|
0.004 |
|
Itapicurú |
|
December 1995 |
| Edivaldo Santos Santiago and his wife |
|
0.004 |
|
Itapicurú |
|
December 1995 |
| Edivaldo Santos Santiago |
|
8.276 |
|
Jaboticaba |
|
May 2007 |
| Edivaldo Santos Santiago |
|
6.334 |
|
Jaboticaba |
|
January 2008 |
| Genivaldo Alves Bispo |
|
0.449 |
|
Itapicurú |
|
October 2007 |
| José Mariano Júnior |
|
5.227 |
|
Itapicurú |
|
February 2005 |
| José Martins de Olveira |
|
22.825 |
|
Barra/Itapicurú |
|
May 2007 |
| José Martins De Oliveira |
|
9.823 |
|
Jaboticaba |
|
August 2005 |
| Jovelina Ana Alves |
|
Not registered |
|
Itapicurú |
|
March 1997 |
| Jovelino Bispo do Nascimento |
|
2.971 |
|
Itapicurú |
|
April 2007 |
| Luiz Carlos M. Evangelista |
|
0.192 |
|
Itapicurú |
|
October 2007 |
| Manoel Xavier Mota |
|
0.066 |
|
Itapicurú |
|
April 2007 |
| Márcio de Jesus Silva |
|
0.004 |
|
Itapicurú |
|
June 2008 |
| Rita de Cássia Souza Lima |
|
0.093 |
|
Itapicuruzinho |
|
March 2005 |
| Rita de Cássia Souza Lima |
|
0.023 |
|
Itapicuruzinho |
|
February 2005 |
| Rita de Cássia Souza Lima |
|
0.040 |
|
Itapicurú |
|
February 2005 |
| Rita de Cássia Souza Lima |
|
0.217 |
|
Itapicurú |
|
March 2005 |
| Rita de Cássia Souza Lima |
|
0.653 |
|
Itapicurú |
|
March 2005 |
| Rita de Cássia Souza Lima |
|
0.133 |
|
Itapicurú |
|
November 2005 |
| Rita de Cássia Souza Lima |
|
0.030 |
|
Itapicurú |
|
April 2005 |
| Valdivino Lopes de Lima |
|
17.424 |
|
Canavieiras |
|
January 2007 |
| Total: |
|
75.96 ha |
|
|
|
|
19
Table
4-2: Jacobina — Rights of ownership
| Vendor |
|
Area (ha) |
|
Location |
|
Acquisition Date |
|
Registration |
| Adenício Francisco da Silva |
|
21.78 |
|
Itapicurú |
|
August 2007 |
|
4542 |
| Álvaro de Carvalho Abreu |
|
14.99 |
|
Genipapo e Itapicurú |
|
— |
|
— |
| Augusto Luiz Vieira Santos |
|
91.12 |
|
Córrego da Barra e Laginha |
|
September 2008 |
|
2063 |
| Augusto Luiz Vieira Santos |
|
17.50 |
|
Barra |
|
September 2008 |
|
3089 |
| Dionízio Moreira dos Santos |
|
15.25 |
|
Barra de Baixo e Roseta |
|
July 2007 |
|
4688 |
| Dionízio Moreira dos Santos |
|
35.20 |
|
Barra de Cima |
|
July 2007 |
|
3779 |
| Francisco Sales Verissimo |
|
141.64 |
|
Genipapo e Itapicurú |
|
— |
|
— |
| João Macário da Silva |
|
31.82 |
|
Itapicurú |
|
July 2007 |
|
1643 |
| João Macário da Silva |
|
51.45 |
|
Itapicurú |
|
July 2007 |
|
21038 |
| José Monteiro da Silva |
|
29.42 |
|
Estrada Nova Barra |
|
June 2007 |
|
3012 |
| Jovita lima de Oliveira |
|
4.42 |
|
Itapicurú |
|
May 2006 |
|
01-4.547 |
| Luiz Eduardo Lima dos Santos |
|
189.69 |
|
Córrego da Barra e Laginha |
|
September 2008 |
|
6887, 6886, 6883, 6895 |
| Luiz Maximiano dos Santos |
|
96.99 |
|
Córrego da Barra e Laginha |
|
— |
|
— |
| Maria Adélia Gomes Sales |
|
98.36 |
|
Genipapo e Itapicurú |
|
September 2007 |
|
3095 |
| Unigeo Ltda. |
|
261.36 |
|
Canavieiras |
|
— |
|
— |
| Total: |
|
1,100.99 ha |
|
|
|
|
|
|
4.3.2
MINERAL RIGHTS
The mineral
rights of the Jacobina property consist of approximately 5,954 ha of mining concessions, 71,045 ha of exploration permits, and one 650
ha mining claim; all of which are held by JMC (Figure 4-2). The leases and granted exploration concessions have been surveyed and
are marked by permanent concrete monuments at each corner. A complete list of the mining and exploration concessions with their current
status as of April 2020 is included in Appendix A. Exploration concessions are renewable on a three-year basis and have annual fees
ranging from US$1.00/ha to US$1.55/ha.
Most of mining concessions numbers 157, 608, and 1461 are
located within the boundary of Parque Sete Passagens (Seven Passes State Park) or in the park’s buffer zone. While mining is not
permitted within the park, JMC has valid mining concessions issued by the National Mining Agency, Agência Nacional de Mineração
(ANM) and is currently negotiating for access into the park with state government and park officials.
20

Figure 4-2:
Mining and exploration concessions
21
JMC does not pay royalties, however, it does pay taxes
to the federal mineral sector agency; these taxes, called Compensação Financeira pela Exploração de Recursos Minerais
(CFEM) and also known as the Brazilian mining royalty, are set at a rate of 1.5%. JMC does not have any obligations in respect to back-in
rights, payments, or other agreements or encumbrances.
JMC has all required permits to continue carrying out the
proposed mining operations on the Jacobina property. Further details of these permits can be found in Section 20 of this report.
4.4
ENVIRONMENTAL CONSIDERATIONS
The primary environmental considerations and potential
liabilities for the Jacobina Mine are related to the operations of the tailings storage facility (TSF) and the management of seepage water
and mine water. Yamana prioritizes the management of tailings and is in the process of aligning the company’s tailings management
system with best practices proposed by the Mining Association of Canada (MAC), Canadian Dam Association (CDA) guidelines and other international
standards.
Tailings produced at the mill are currently managed in
TSF B2, located approximately 2.5 km north of the main processing plant. TSF B2 is fully lined; this lining limits the flow of tailings
or process water into the environment.
All water pumped from the underground mines and that seeps
from the old tailings facility (TSF B1) is collected and pumped into the TSF B2 impoundment. Similarly, acid rock drainage (ARD) and run-off
water in contact with the waste rock piles are monitored and collected for proper containment and/or treatment.
As stated in the Environmental Permit, the TSF area will
be allowed to dry and consolidate once operations have ceased; this will allow for the installation of a geomorphic low-permeability closure
cover and subsequent rehabilitation activities similar to reclamation activities being completed in TSF B1.
Additional details on tailings infrastructure and management
at Jacobina are provided in Sections 18 and 20 of this technical report.
The qualified person responsible for this section is not
aware of any other significant factors and risks that may affect access, title, or the right or ability to perform mining and exploration
work on the property.
22
5
ACCESSIBILITY, CLIMATE, LOCAL RESOURCES, INFRASTRUCTURE, AND PHYSIOGRAPHY
5.1
ACCESSIBILITY
The Jacobina
Mine is located 10 km from the town of Jacobina, which is accessible by paved secondary highway (Routes 130 and 324) from Salvador, the
state capital of Bahia, located 340 km to the south-southeast (Figure 4-1) of the mine complex. Well-maintained paved roads from
the town of Jacobina provide access to the project.
5.2
CLIMATE
The town of Jacobina is located in a region of subtropical
semi-arid climate. Summer months are much rainier than the winter months. Precipitation at Jacobina is somewhat higher than the regional
average, likely due to the influence of the mountain range which hosts the deposits. Average annual precipitation is 840 mm, with May to
October experiencing relatively less precipitation than the rest of the year. Temperatures vary little throughout the year. July is
the coldest month with average daytime highs of 26ºC and nightly lows of 17ºC. February is the warmest month with average
daily highs of 32ºC and nightly lows of 20ºC. Mining operations can be carried out on a year-round basis.
5.3
LOCAL RESOURCES
The town of Jacobina was founded in 1722 and is a regional
agricultural centre with an official population of 79,247 as reported in 2010 by the Instituto Brasileiro de Geografia e Estatística.
It provides all the accommodation, shopping, and social amenities necessary for the mine’s labour force. Electrical services are
supplied to the mine by Companhia de Electricidade do Estado da Bahia (COELBA). Telephone and high-speed internet service are available
via the town of Jacobina. A combination of water wells, storm water catchment basins, and mine dewatering features satisfies the project’s
water requirements.
5.4
INFRASTRUCTURE
Yamana holds sufficient surface rights for mining operations.
Currently, the major assets and facilities associated with Jacobina are as follows:
·
Mine and mill infrastructure including office buildings, shops, and equipment.
·
A conventional flotation mill, with leach and carbon-in-pulp (CIP) tanks, which produces gold doré. The processing plant has
a current nominal capacity of 6,500 tonnes per day (tpd).
23
·
A TSF with a final design capacity for the life of mine (LOM).
5.5
PHYSIOGRAPHY
The town
of Jacobina is located at an approximate elevation of 500 m with topography varying from flat terrain to low rolling hills. The immediate
area surrounding the Jacobina Mine consists of steep-sided ridges rising to 1,200 m that are underlain by the resistive quartzites, metaconglomerates,
and schists in the Serra de Jacobina mountain range (Figure 5-1).
The project is located in the upper reaches of the Itapicurú
watershed, more precisely in the Upper Itapicurú region. The Itapicurú-Mirim River, an important tributary of the Itapicurú
River, represents the main drainage in the mine site area. Groundwater recharge occurs by direct rainfall infiltration. In the Serra de
Jacobina, which is underlain by quartzite and conglomerate, rainwater infiltration occurs through fractures, whereas in the recessive
topography of the crystalline basement, the recharge occurs mainly through infiltration of porous strata. The recharge is estimated to
be higher in the mountains. The water deficit in the region favors the recharge of aquifers only in the rainy season.
5.6
VEGETATION
The area of Jacobina and its surroundings host several
ecosystems, including seasonal semi-deciduous forest, the Caatinga (shrublands) in the lower portions of the terrain and Cerrado (dry
savannah) vegetation in the upper elevations. The town of Jacobina is located in a region of transition between several vegetation types:
(1) the Atlantic Forest and the Caatinga and (2) between the Caatinga and the Cerrado.
The main phyto-physiognomy in the drainage region of the
Itapicuruzinho watershed is represented by the seasonal semi-deciduous forest, one of the most important phyto- physiognomies of the Atlantic
Forest biome. Due to local soil variations and land use over time, the development of secondary forests is observed riparian forests to
the slopes and flat areas, where they occur in transition with the Caatinga and Cerrado. In some instances, vegetation of the Caatinga
has even been observed along the river banks.
The Alluvial Seasonal Forest (FEA), commonly referred to
as a riparian forest or gallery forest, is observed along the most enclosed and narrow watercourses. Within the project and the surrounding
area, FEAs are observed along the Cuia, Itapicuruzinho, and Canavieiras rivers and their tributaries. Due to its location, this phyto-physiognomy
corresponds to the Permanent Preservation Areas. Within the FEAs, the occurrence of dominant arboreal stratum and canopy formation is
observed, in addition to the presence of species of ferns and epiphytes (bromeliads and orchids). There is still, however, a strong presence
of ecotones, transition zones between areas with distinct abiotic conditions, with undifferentiated communities, where the floras interpenetrate.
Shrub-tree Caatinga in particular is observed around the tailing dams, in the
24
Legal Reserve area, on the banks of the Santo Antonio stream
at its intersection with the Itapicuruzinho river around the EMBASA dam, and around the Cuia dam.
5.7
AVIAN FAUNA
The use of birdlife as a biological indicator allows for
efficient environmental characterization studies as the degree of change in a given environment can potentially be inferred from the presence
or absence of species, decrease in numbers in a given area, or a species’s disappearance. The heterogeneity of habitats and the availability
of resources within a landscape is reflected by the composition of bird populations, the variation in species richness, and their abundance.
In addition to being a great indicator of the quality and preservation of environments, avifauna is a key group in ecological processes;
its high capacity for colonization of regenerating areas, even after intense modification of the environment, makes this group very efficient
in the acceleration of successional processes by means of pollination and dispersion of seeds of native plants.
In the Jacobina area, a total of 100 taxa were documented
in the FEAs, belonging to 33 families and 16 orders. The composition of the avifauna found is characterized by approximately 50% of general
habitat species, those that use open areas of both the Caatinga and forests. The most representative families are Tyranidae, Thraupidae,
Thamnophilidae and Trochilidae. Finally, approximately 60% of the documented species need forest areas and the majority of these (70%)
presented low sensitivity to anthropogenic disturbances, as most Caatinga birds present low and medium sensitivity to man-made disorders.
25

Figure
5-1: Infrastructure and typical landscape
A: Serra de Jacobina and mineral processing plant
B: João Belo mine entrance
C: Mineral processing plant
26
6
HISTORY
The Serra de Jacobina Mountains have been mined for gold
since the late 17th century. Numerous old workings from artisanal miners (garimpeiros) can be seen along a 15 km strike length, following
the ridges of the Serra Do Ouro mountain chain (Golder Associates, 2008). Companhia Minas do Jacobina operated the Gomes Costa Mine in
the Morro do Vento area between 1889 and 1896, with total reported production of 84 kg of gold from a 130 m long drift. The Canavieiras,
João Belo, and Serra Branca mines opened in the 1950s. The Canavieiras Mine was the largest of these operations, and at a capacity
of 30 tpd, produced 115,653 t with an average recovered grade of 18.13 g/t gold during the 1950s and 1960s.
6.1
PRIOR OWNERSHIP
The modern history of the Jacobina mining camp began in
the early 1970s with extensive geological studies and exploration carried out by Anglo American Corporation (Anglo American). A feasibility
study recommended that a mine be developed at Itapicurú (Morro do Vento area) with an initial plant capacity of 20,000 t per month.
Mine development commenced in October 1980 and the processing plant was commissioned in November 1982. In 1983, the first full
year of operation, production was 241,703 t with a recovered grade of 5.73 g/t gold, yielding 38,054 oz of gold.
Exploration between 1984 and 1987 at the João Belo
Norte Hill outlined sufficient mineral reserves to warrant an open pit operation, the development of which commenced in August 1989.
Concurrently, the processing plant capacity was increased to 75,000 t of ore per month. In 1990, 538,000 t grading 1.44 g/t gold were
produced, mainly from the open pit. Total production at Jacobina in 1990 was 45,482 oz of gold from 680,114 t processed, for a recovered
grade of 2.08 g/t gold. Underground development at João Belo commenced in 1990.
William Multi-Tech Inc. operated the João Belo and
Itapicurú mines from August 1996 until December 1998, when the mines were closed due to depressed gold prices and the strong
Brazilian currency. From 1983 to 1998, the project processed 7.96 Mt of ore at a recovered grade of 2.62 g/t gold, to produce approximately
670,000 oz of gold. The bulk of historical production came from the Itapicurú (Morro do Vento Intermediate and Morro do Vento Extension)
and João Belo areas.
In September 2003, Desert Sun completed the required
exploration expenditures to earn a 51% interest in the project and then exercised its option to acquire the remaining 49% interest in
the project, comprising the mineral rights, mines, and a 4,000 tpd plant located on the Jacobina property. Desert Sun had initiated exploration
in the project area in the fall of 2002 and this program was substantially expanded in September 2003. The original property holdings,
which extended approximately 62 km along strike, were expanded considerably so that the current property covers a strike length of 155
km.
27
Reactivation of the João Belo Mine started in April 2004
and ore extraction began in July 2004. The cost of the capital project, including development of the João Belo mine, refurbishment
of the mill facilities, and the purchase of all machinery, equipment, and vehicles, was approximately US$37 M. Desert Sun poured the first
gold bar at the João Belo Mine in March 2005 and declared commercial production effective July 1, 2005.
Desert Sun reactivated the Morro do Vento Mine in August 2005,
starting with the 720 Level portal and increasing the profile dimensions of the access adit. In November 2005, Desert Sun reported
in the third quarter ending September 30, 2005, that total ore mined was 340,913 t and ore processed was 300,505 t at an average
grade of 2.03 g/t gold. Gold production was 18,683 oz at an average cash cost of US$292/oz. The average recovery rate at the mill
was 95.4%.
Yamana acquired Jacobina when it completed the purchase
of Desert Sun in April 2006.
6.2
HISTORICAL MINERAL RESOURCE AND MINERAL RESERVE ESTIMATES
Although a number of historical mineral resource estimates
and mineral reserve estimates have been prepared for Jacobina throughout its life, none of these estimates are currently regarded as significant.
6.3
PAST PRODUCTION
Total
production for Jacobina since mining commenced in 1983 is shown in Table 6-1.
28
Table
6-1: Summary of gold production at the Jacobina mine, 1983 to 2019
| Year |
|
Tonnes
Processed
(t) |
|
Gold Feed
Grade
(g/t Au) |
|
Metallurgical
Recovery
(% Au) |
|
Gold Produced
(oz Au) |
|
| 1983 |
|
241,703 |
|
5.73 |
|
85.46 |
|
38,054 |
|
| 1984 |
|
301,946 |
|
5.18 |
|
92.48 |
|
46,529 |
|
| 1985 |
|
282,878 |
|
4.56 |
|
92.50 |
|
38,345 |
|
| 1986 |
|
311,174 |
|
3.60 |
|
92.50 |
|
33,312 |
|
| 1987 |
|
247,838 |
|
5.10 |
|
96.00 |
|
38,991 |
|
| 1988 |
|
244,628 |
|
5.33 |
|
96.00 |
|
40,238 |
|
| 1989 |
|
257,247 |
|
3.02 |
|
96.00 |
|
23,979 |
|
| 1990 |
|
681,955 |
|
2.01 |
|
96.00 |
|
42,202 |
|
| 1991 |
|
775,839 |
|
2.70 |
|
90.30 |
|
60,847 |
|
| 1992 |
|
594,181 |
|
2.57 |
|
89.90 |
|
44,184 |
|
| 1993 |
|
518,889 |
|
2.32 |
|
93.20 |
|
36,039 |
|
| 1994 |
|
551,141 |
|
2.54 |
|
90.00 |
|
40,582 |
|
| 1995 |
|
579,913 |
|
2.57 |
|
95.60 |
|
45,813 |
|
| 1996 |
|
591,107 |
|
2.36 |
|
94.60 |
|
42,390 |
|
| 1997 |
|
865,681 |
|
2.13 |
|
92.20 |
|
54,778 |
|
| 1998 |
|
741,089 |
|
1.91 |
|
93.00 |
|
42,386 |
|
| 1999-2004 |
|
0 |
|
0.00 |
|
0.00 |
|
0 |
|
| 2005 |
|
906,759 |
|
1.90 |
|
96.00 |
|
53,170 |
|
| 2006 |
|
1,418,508 |
|
1.86 |
|
96.00 |
|
81,272 |
|
| 2007 |
|
1,040,174 |
|
1.70 |
|
95.00 |
|
54,068 |
|
| 2008 |
|
1,388,087 |
|
1.83 |
|
89.86 |
|
73,241 |
|
| 2009 |
|
1,996,989 |
|
1.88 |
|
91.77 |
|
110,514 |
|
| 2010 |
|
2,158,096 |
|
1.89 |
|
93.30 |
|
122,152 |
|
| 2011 |
|
2,148,275 |
|
1.89 |
|
93.11 |
|
121,675 |
|
| 2012 |
|
2,104,683 |
|
1.84 |
|
93.73 |
|
116,862 |
|
| 2013 |
|
1,575,628 |
|
1.57 |
|
92.48 |
|
73,695 |
|
| 2014 |
|
1,419,031 |
|
1.78 |
|
92.93 |
|
75,650 |
|
| 2015 |
|
1,469,095 |
|
2.17 |
|
94.43 |
|
96,715 |
|
| 2016 |
|
1,802,855 |
|
2.17 |
|
95.71 |
|
120,478 |
|
| 2017 |
|
1,978,409 |
|
2.22 |
|
96.35 |
|
135,806 |
|
| 2018 |
|
2,035,457 |
|
2.30 |
|
96.21 |
|
144,695 |
|
| 2019 |
|
2,254,793 |
|
2.28 |
|
96.70 |
|
159,499 |
|
| Total |
|
33,484,048 |
|
2.19 |
|
93.91 |
|
2,208,161 |
|
29
7
GEOLOGICAL SETTING AND MINERALIZATION
The gold mineralization at Jacobina is hosted almost entirely
within quartz pebble conglomerates of the Serra do Córrego Formation, the lowermost sequence of the Proterozoic-age Jacobina Group.
This formation is typically 500-m thick but locally achieves thicknesses of up to 1 km.
The gold-bearing conglomerate units, known as reefs, range
from less than 1.5 m to 25 m in width and can be followed along strike for hundreds of metres, and in some cases for kilometres. Some
contacts between the reefs and crosscutting mafic and ultramafic intrusive rocks are enriched in gold. Although they are quite homogeneous
along their strike and dip extensions, the gold-bearing conglomerates differ from one another in stratigraphic position and pattern of
gold distribution. The differences are likely due to variations in the sedimentary source regions, in the erosion and transportation mechanisms,
and in the nature of the depositional environments. Not all conglomerates of the Serra do Córrego Formation are gold-bearing.
7.1
REGIONAL GEOLOGY
The Precambrian
terranes of the northeastern part of the São Francisco Craton in the state of Bahia show evidence of prolonged terrane accretion
history (Almeida, 1977). The three major Archean crustal units, the Gavião, Serrinha, and Jequié blocks, underwent several episodes
of tectonism and metamorphism that culminated in a continent-continent collision during the Paleoproterozoic, when the consolidation of
the craton took place along a main orogenic belt named the Itabuna-Salvador-Curaçá mobile belt, as shown in Figure 7-1.
All rocks described in the report are metamorphic but as the protoliths are typically evident they are described in the following text
by their protolith name. While metamorphic grade may vary considerably in the district, the rocks at the Jacobina Mine are characterized
by the development of white mica, andalusite, and locally, kyanite.
A prominent
zone of crustal weakness within this portion of the craton is the Contendas—Mirante—Jacobina lineament, a 500-km long and approximately
north-trending suture zone located close to the eastern margin of the Gavião block (Figure 7-1). A reactivation of the Contendas—Mirante—Jacobina
lineament during the Paleoproterozoic, prior to and during the continent-continent collision, gave rise to a continental margin rift-type
basin where the siliciclastic sedimentary rocks of the Jacobina Group were deposited.
30

Figure 7-1:
Tectonic assemblage map
7.2
LOCAL AND PROPERTY GEOLOGY
The Jacobina
gold district coincides with most of the Jacobina Range, where quartzite, conglomerate, and schist units of the Paleoproterozoic Jacobina
Group form a series of north-south-trending mountain ranges that rise up to 1,200 masl (Figure 7-2). The longitudinal north-south
valleys as well as the east-west oriented valleys often correspond to recessive ultramafic sills and dykes. The Mairi Complex consists
of a group of Archean-aged tonalitic, trondhjemitic, and granodioritic gneiss-dominated basement and related remnants supracrustal rocks
of the Gavião Block; it underlies the flatter terrain east of the Jacobina range. East of the Mairi Complex, the fine-grained biotite
gneisses of the Archean Saúde Complex also underlie a flat landscape. The transition between the hilly and the flatter topography
of the eastern domains corresponds to the exposures of the Archean Mundo Novo Greenstone Belt.
31

Figure
7-2: Geology of project area
7.2.1
JACOBINA GROUP
The stratigraphic subdivisions of the Jacobina Group (Griffon,
1967; Mascarenhas et al., 1998) have long been controversial. While the stratigraphy in the project area is well documented, it is challenging
to develop a usable nomenclature to define the upper formations of the Jacobina Group, specifically the Cruz das Almas, Serra do Meio,
and the Serra da Paciência Formations. Pearson et al. (2005) considers that the Jacobina Group only comprises the lower Serra do
32
Córrego and the upper Rio do Ouro formations, according
to sedimentary and stratigraphic studies carried out by Oram (1975), Minter (1975), Strydom and Minter (1976), Couto et al. (1978), and
Molinari et al. (1986). The stratigraphic nomenclature developed by these writers has been successfully employed within the project area
for over 25 years and its usage has been maintained by Yamana.
Serra do Córrego Formation
The Serra do Córrego Formation forms the western ridge
of the Serra da Jacobina mountain range and is exposed for a strike length of about 90 km. It consists of an interbedded series of orthoquartzite
and oligomictic conglomerate units that collectively range in total thickness from 500 to 1,000 m. The conglomerate pebbles are composed
of polycrystalline quartz with rare, fine-grained, fuchsite- and rutile-bearing quartzite. The conglomerate matrix is composed of quartz,
sericite, and fuchsite with detrital zircon, non-chromiferous rutile, tourmaline, and chromite grains (Ledru et al., 1964).
The geological
map (Figure 7-3) of the Jacobina area shows the distribution of the Serra do Córrego Formation. Figure 7-4 shows the stratigraphy
of the Serra do Córrego Formation and the stratigraphic correlations between the various mine centres at Jacobina. Within the project
area, the Serra do Corrego formation is divided into three units:
·
The Lower Conglomerate (40—200-m thick) outcrops along the lower parts of the western slopes of the Serra do Córrego,
Morro do Cuscuz, and Morro do Vento areas and is composed of interbedded quartzite, pebbly quartzite, and conglomerate units. The reef
zones consist of oligomictic conglomerates that are interbedded with orthoquartzite. Pebble sizes range from 35 to 60 mm. This unit hosts
the gold deposits of the Basal Reef and the Main Reef.
·
The Intermediate Quartzite (130—425-m thick) consists primarily of orthoquartzite with little or no conglomerate. The upper
part of this unit is characterized by a distinct horizon known as the “marker schist”, a highly sheared quartz-sericite-chlorite-andalusite
schist.
·
The Upper Conglomerate (120—400-m thick) comprises quartzite and pebbly quartzite interbedded with a number of conglomerate
layers. The reef zones consist of interbedded conglomerate and orthoquartzite units with pebble sizes ranging from 50 mm at Canavieiras
in the north to 100 mm at the João Belo Mine in the south. The Upper Conglomerate Unit hosts the main gold orebodies of the Canavieiras,
Morro do Vento, João Belo and Serra do Córrego mineralized areas.
Oram (1975), Minter (1975), and Strydom and Minter (1976)
concluded, based on isopachs and pebble size data, that the paleoslope during the sedimentation of the Serra do Córrego Formation
was inclined to the west. The westerly paleocurrent direction, indicated by the vector
33
data, drained a provenance area to the east of the present
outcrop area, and deposited these sediments in a fluvial environment.
Rio do Ouro Formation
The Rio do Ouro Formation is composed of mostly pure, fine-grained
to medium-grained quartzite which can be either white, gray, or light green in colour. The formation contains subordinate quantities of
calcareous pelitic rocks which are intercalated with the various quartzite beds.
The presence of this formation is interpreted to mark the
change from the fluvial sedimentary environment of the Serra do Córrego Formation to a shallow marine, intertidal depositional environment.
This change in depositional environment is suggested by a change in the paleocurrent patterns as indicated by ripple marks, small-scale
cross-bedding, and larger-scale herringbone cross-bedded features. The transition from the Serra do Córrego Formation to the Rio
do Ouro Formation is marked by the presence of conglomerate units with limited lateral continuity. These locally developed conglomerate
beds are present at the base of the Rio do Ouro Formation.
34

Figure
7-3: Geology of the Jacobina Mine Complex
35

Figure
7-4: Stratigraphic correlation between mining blocks
36
7.2.2
ULTRAMAFIC SILLS AND DYKES
The deep longitudinal valleys bordering the mountains which
form the Jacobina range often correspond to weathered pre- to syn-tectonic mafic to ultramafic sills and dikes. These intrusive rocks
include dark green peridotite and pyroxenite, which acquire a brownish stain where weathered (Teixeira et al., 2001). According to these
authors, deformation and metamorphism, coupled with hydrothermal alteration, have transformed these rocks into fine-grained schists containing
talc, serpentine, chlorite, tremolite, and carbonate. In the project area, the ultramafic rocks, which were emplaced along both north-trending
and east-trending structures, affected and reacted with the host rocks (quartzite and conglomerates of the Serra do Córrego and Rio
do Ouro formations) producing metre-scale alteration zones in the hosts. The ultramafic rocks display textural variation from aphanitic
borders to a medium to coarse-grained core, typical intrusive textures.
These intrusive rocks are known to locally host minor gold
mineralization within the project area, and at several other places like Rio Coxo, Jaqueira, Mina Velha, and Várzea Comprida. The
age of these sills and dikes is still unknown, but since they are deformed, they are interpreted to be of Archean or Paleoproterozoic
age.
7.3
STRUCTURAL GEOLOGY
Different styles of deformation are recognized within the
Jacobina Group and surrounding Archean rocks, along and across the northern portion of the 50-km long north-trending Contendas—Mirante—Jacobina
lineament. Thrust faults, oblique sinistral-reverse faults, and regional tight and open folds were developed in response to the strong
westward-verging mass transport event caused by the Paleoproterozoic continent/continent collision.
To the west, the Jacobina Group is thrust over the Archean
Mairi Complex, the Campo Formoso Mafic—Ultramafic Complex, and the late- to post-tectonic granitic intrusions (Miguel Calmon-Itapicurú,
Mirangaba-Carnaíba and Campo Formoso intrusions), along a thrust fault named the Jacobina Fault. This structural setting changes
eastwards to a series of steeply east-dipping blocks, bounded by east-dipping subparallel reverse faults.
As a result
of the regional compression associated with the development of the Itabuna- Salvador-Curaçá fold belt, a series of ductile shear
zones and brittle faults have developed in the area. The main elements of these include a series of north-trending strike-slip faults
with a sinistral sense of movement, east-trending strike-slip faults with a dextral sense of movement, and northwest-trending shear zones
with a sinistral sense of movement. These post-mineralization structures displaced and offset the various gold-bearing zones (Figure 7-5).
The Serra do Córrego Formation is exposed on the west
side of the Jacobina Range where it forms part of an extensive homocline that dips consistently 50° to 70° to the east and youngs
to
37
the east, as indicated by ripple marks and cross-bedding.
This orientation is interpreted to be the result of tilting during the intrusion of the late- to post-tectonic Mirangaba-Carnaíba
granite.

Figure
7-5: Examples of post-mineralization faults and shear zones
7.4
MINERALIZATION
The Jacobina gold district is defined by a 40-km long belt
that extends from Campo Limpo, in the south, to Santa Cruz do Coqueiro, in the north. The vast majority of significant gold mineralization
occurs within the matrix of the conglomerates; these include the Canavieiras, Morro do Vento, João Belo, Serra Branca deposits as
well as other minor occurrences.
At Jacobina, the age of deposition of the host sedimentary
sequence was broadly bracketed between 3.2 Ga and 2.3 Ga; however, the conglomerates yielded more restricted detrital zircon U-Pb ages
of 3.4 to 3.2 Ga. (Teles at al., 2014), providing a maximum age. The deposit was overprinted by deformation and hydrothermal alteration
associated with a younger orogenic
38
event (at 1.9 Ga (Ledru et al. 1997)) that generated pervasive
silicification, the development of chrome-sericite (fuchsite), and some gold remobilization along fractures and faults.
The gold mineralization found at Jacobina occurs as two
styles of mineralization (Texeira et al, 2001):
·
Conglomerate-hosted placer gold mineralization (the most important mineralization type in the Jacobina district)
·
Post-depositional gold-bearing stockwork, shear zones, and associated extensional quartz veins. These styles of mineralization
are relatively minor and do not contribute to the established resources at Jacobina.
The characteristics of these two styles of mineralization
are described in the following subsections.
7.4.1
CONGLOMERATE-HOSTED PLACER GOLD MINERALIZATION
Conglomerate-hosted
deposits contain very fine grains of native gold, typically 20 to 50 µm in size, hosted in the matrix of the conglomerate.
Gold may also be associated with rounded pyritic aggregates believed to be of sedimentary origin. There are no other significant elements
present, with detailed studies of the reef chemistry showing only very minor enrichment in iron, titanium and uranium in some reefs associated
with rounded grans of uraninite, ilmenite and rutile. Mineralization is typically hosted by well sorted, clast-supported conglomerate
and may comprise micro-fractured, gold-bearing, recrystallized, silicified, and pyritic conglomerate units of the Serra do Córrego
Formation, with a greenish fuchsite matrix and common hematite coatings along shear planes, joints, and fracture surfaces. Gold mineralization
does not display a correlation with the pyrite or fuchsite content of the rock, although well-mineralized reefs are typically enriched
in hematite and may contain red colored, oxidized pebbles.
A north-trending
and steeply dipping ultramafic dyke (Vale_ITV on Figure 7-5) subdivides the area into West and East blocks. All mineralized reefs
that are exposed at surface along the west flank of the Serra do Córrego Formation (Figure 7-3) to the west of this dyke are considered
on the West Block, whereas their down-dip extensions that are located east of the dyke, such as all of the Canavieiras zones, are considered
on the East Block.
Gold mineralization rarely occurs in the pebbles themselves;
however, when it does, it is along fractures. The interbedded quartzite units also host gold mineralization but almost exclusively along
fractures, especially near late mafic dikes.
Historically, the most important past producers have been
the Basal and Main reefs of the Lower Conglomerate Unit and the lower part of the Upper Conglomerate Unit. It is important to note, however,
that only certain reefs within particular lithological units are gold-bearing. Other nearby subparallel reefs with similar sedimentary
features may not be gold-bearing.
39
In addition, there is considerable local lateral variation
in grade within particular reefs. For example, the Main and Basal reefs are well mineralized in the Morro do Vento Sector but are essentially
barren to sub-economic in the Joao Belo and Canavieiras sectors. Despite this local grade variation, the overall average grade, based
on production records, is remarkably consistent both along strike and down dip within specific ore shoots.
Figure
7-6 shows a cross-section of the João Belo area. In the mine area, stratigraphy dips consistently eastward at 50° to 70°,
with some local flatter zones. Cross-bedding and ripple marks indicate that the sequence youngs upwards (i.e., stratigraphic tops are
towards the east). Table 7-1 summarizes the principal characteristics of the main gold-mineralized reefs at Jacobina and lists
the abbreviations for each reef.

Figure
7-6: Generalized cross-section through the Morro do Vento Mine
EMB= Itapicarú
intrusion, QTO=Quartzite, ITV_VALE = Mafic to ultramafic intrusion; Table 7-1 lists the key to the reef code abbreviations.
40
Table
7-1: Characteristics of gold mineralization at Jacobina
| Zone |
|
Code |
|
Location |
|
Strike
length
(m) |
|
Thickness (m) |
|
Average
Grade
(g/t Au) |
|
Description |
| Morro do Vento / Morro do Vento Extension / Morro do Cuscuz (Itapicurú) |
|
|
| LVLPC |
|
LVLPC |
|
Morro do Vento |
|
400 |
|
2 |
|
4.8 |
|
Large to very large pebbles, only locally mineralized |
| MU (Upper) Reef |
|
MU |
|
Morro do Vento |
|
1700 |
|
3 to 10 |
|
2.0 |
|
Medium to small pebbles |
| LU (Lower) Reef |
|
FLU |
|
Morro do Vento |
|
1700 |
|
3 to 10 |
|
2.4 |
|
Medium to large pebbles |
| Hangingwall Reef |
|
HW |
|
Morro do Vento |
|
3000 |
|
1 to 6 |
|
2.4 |
|
Large to medium pebbles |
| Main Reef |
|
MR |
|
Morro do Vento |
|
3000 |
|
Beds: 0.1 to 3 Zone: up to 12 |
|
6.0 |
|
Pyritic, small to medium pebble conglomerate beds. Three channels of deposition, broken by faults. |
| Footwall Reef |
|
FW |
|
Morro do Vento |
|
3000 |
|
Beds: 0.1 to 6 |
|
2.4 |
|
Pyritic, small to medium pebble conglomerate beds. |
| Basal Reef |
|
BR |
|
Morro do Vento |
|
1600 |
|
3 to 10 |
|
4.0 |
|
Small to medium pebbles, enrichment of gold at its upper and lower portions. |
| Canavieiras |
|
|
|
|
|
|
|
|
|
|
|
|
| Maneira |
|
|
|
Canavieiras |
|
>600 |
|
Beds: 0.4 to 7 Zone: up to 70 |
|
1.7 |
|
Large to very large pebbles |
| Holandez |
|
|
|
Canavieiras |
|
>600 |
|
Beds: 0.9 to 6 Zone: up to 30 |
|
1.7 |
|
Large to medium pebbles |
| MSPC |
|
MSPC |
|
Canavieiras |
|
800 |
|
2 to 4 |
|
4.4 |
|
Medium size pebbles with abundant pyrite |
| LVL |
|
LVL |
|
Canavieiras |
|
2600 |
|
0.5 to 5 |
|
2.6 |
|
Large to very large pebbles |
| Piritoso |
|
|
|
Canavieiras |
|
>600 |
|
1 to 3 |
|
9.5 |
|
Medium size pebbles with abundant pyrite |
| Liberino |
|
|
|
Canavieiras |
|
>600 |
|
1 to 3 |
|
6.1 |
|
10 m above Piritoso; medium to large pebbles |
| MU |
|
MU |
|
Canavieiras |
|
>400 |
|
10 to 25 |
|
3.2 |
|
Pyritic, medium to large pebble conglomerates |
| LU |
|
LU |
|
Canavieiras |
|
>400 |
|
1 to 10 |
|
2.2 |
|
Pyritic, large pebble conglomerate |
| João Belo |
|
|
|
|
|
|
|
|
|
|
|
|
| LVLPC |
|
LVLPC |
|
João Belo North |
|
>1,000 |
|
1 to 3 |
|
4.4 |
|
Large to very large pebbles |
| LMPC |
|
LMPC |
|
João Belo North |
|
>1,000 |
|
10 to 25 |
|
2.2 |
|
Large to medium pebbles |
| MPC |
|
MPC |
|
João Belo North |
|
>1,000 |
|
1 to 4 |
|
3.6 |
|
Medium sized pebbles; locally contains gold values |
41

Figure
7-7: Photographs of conglomerate-hosted gold mineralization
42
7.4.2
POST-DEPOSITIONAL GOLD-BEARING STOCKWORK, SHEAR ZONES AND EXTENSIONAL QUARTZ VEINS
This group encompasses gold-bearing extensional quartz veins and veinlets
related to semi-concordant shear zones hosted by quartzites, andalusite-graphite-quartz schists, and local conglomerates of the Rio do
Ouro Formation (e.g., Goela da Ema, Biquinha, Cercadinho and Guardanapo gold workings). This style of gold mineralization is a very minor
volumetric component at Jacobina and does not contribute significantly to the mineral resource. The main hydrothermal alterations associated
with this style of mineralization are silicification, sericitization, chloritization, and pyritization (locally with chalcopyrite), and
local tourmalinization.
The ultramafic and mafic rocks also host mineralization as narrow shear
zones up to 4 m-thick in north-south oriented ultramafic sills and dikes, close to their footwall and hangingwall contacts with the hosting
quartzite and conglomerate units of the Serra do Córrego, Rio do Ouro, and Serra da Paciência Formations. The mineralized shear
zones are characterized by the development of gold-bearing quartz veins and/or stockwork. The main hydrothermal alteration types are silicification,
fuchsitization, pyritization, and sericitization, with local tourmalinization. A number of examples of this group are known at the mine
sites and surrounding areas (Canavieiras, Itapicurú, Serra do Córrego, Morro do Vento, and João Belo), and at Serra
da Paciência (Mina Velha, Várzea Comprida, Ciquenta e Um, Cabeça de Nego and Milagres gold workings), in the north. This
style of mineralization does not contribute significantly to the mineral resource at Jacobina.
7.5
ALTERATION
The overprinting hydrothermal alteration event at the Jacobina deposit
consists of pyrite, pyrrhotite, quartz, chrome-sericite (fuchsite), chrome-rutile and chrome-tourmaline. The chromium-rich nature of this
alteration assemblage is attributed to leaching of the mafic-ultramafic intrusive rock by circulating hydrothermal fluids.
43
8
DEPOSIT TYPES
The mineralization at Jacobina consists of conglomerate-hosted gold
deposits generally interpreted to represent paleoplacer gold deposits, with some post-depositional modification by structural and hydrothermal
events (Bateman, 1958; Cox, 1967; Gross, 1968; Minter, 1975; Strydom and Minter, 1976; Hendrickson, 1984). This type of deposit is similar
to the Witwatersrand and Tarkwa deposits in South and West Africa (Pearson et al., 2005).
Karpeta (2004) argues that the gold was detrital and brought in and
concentrated by fluvial processes. Several lines of evidence, with quoted similarities to both the Tarkwa and the Witswatersrand deposits,
are provided.
1.
Gold is not generally evenly distributed throughout the conglomerates, but concentrated in the top of the conglomerate beds with
clean cross-bedded quartzite above them. This concentration of gold result from the aggradation and then incision of a braided fluvial
system.
2.
Gold mineralization appears to show a strong positive relationship with pebble size. This shows that gold grade can be correlated
with fluvial current dynamics.
3.
Although gold is always associated with pyrite and hematite, hematite and pyrite commonly occur without gold. This suggests that
gold concentration is independent of the distribution of pyrite, hematite, and chrome-sericite.
4.
Gold grade is higher in better-sorted, clast-supported conglomerates than in more poorly sorted matrix-supported conglomerate.
This indicates that gold grade appears to be related to the degree of reworking of a conglomerate (although it could be related to their
relative porosity/permeability characteristics).
5.
Higher-grade zones have a well-defined plunge that is postulated to coincide with the predominant paleocurrent direction.
Teles et al. (2014) further note that the mineralized conglomerates
at Jacobina have rounded grains of pyrite and gold, as well as uraninite, indicating detrital deposition.
Native gold is also present as flakes and thin films along fracture
surfaces within the conglomerate units, and less frequently in the quartzite, suggesting remobilization of gold during a hydrothermal
event (Karpeta, 2004) as described in Section 7.5.
44
9
EXPLORATION
Since acquiring Jacobina in 2006, Yamana has carried out regional mapping
and sampling with the goal of identifying additional surface occurrences of mineralized conglomerates along the strike length of the Jacobina
belt. The geological mapping team measured the surface locations of such mineralized outcroppings of conglomerates by means of a hand-held
Garmin GPS unit (using the Córrego Alegre datum). For each occurrence, data collected included the host rock, the type and size of
conglomerate pebbles, and descriptions of relevant geological features such as the presence of visible gold and type and intensity of
alteration minerals (hematite, fuchsite, pyrite, and chlorite). All information was entered into a master geological database.
Chip or grab samples, mainly of conglomerate, were collected; samples
weighed between one and three kilograms. A total of 9,629 chip samples were collected on the property by Yamana between 2010 and 2019.
Samples were submitted to the Jacobina analytical laboratory for determination of their gold content. All chip samples were processed
according to Yamana’s quality assurance/quality control (QA/QC) protocols.
In 2018, a structural
mapping program was carried out on surface in the immediate vicinity of the mines. The program focussed specifically on the Serra do Córrego,
Canavieiras North, Canavieiras Central, and Canavieiras South mine areas, in addition to the Lagartixa and Morro da Viúva target
areas (Figure 9-1). The results were used to reinterpret the structural setting and genesis of the Jacobina style of mineralization.
This improved understanding informed the drilling programs completed in 2018 and 2019.
The significant exploration results at Jacobina that are material to
this technical report were obtained by underground core drilling. This work and resulting interpretations are summarized in Sections 10,
14, and 15 of this technical report.
45

Figure
9-1: Location of geological mapping and sampling programs
46
9.1
EXPLORATION POTENTIAL
Exploration during 2018 and 2019 has focussed on the higher grade deposits
within the mine complex and have led to the discovery of significant extensions to mineralization at Moro do Vento, Moro do Cuscuz and
Canavieiras. Drilling in 2019 has extended Canavieiras Sul both down dip and along strike and expanded the Canavieiras Central zone with
excellent intercepts in the LU, MU, and LVLPC reefs. Notable results include the following estimated true width intervals: 10.5 g/t of
gold over 5.4 metres (drill hole CAS492); 5.3 g/t of gold over 3.4 metres (drill hole CAS473); 4.8 g/t of gold over 4.2 metres (drill
hole CAS471); 3.4 g/t of gold over 9.5 metres (drill hole CANEX60A); and 3.4 g/t of gold over 2.7 metres (drill hole CANEX86) while drilling
down plunge on the high grade.
The Morro do Vento sector also continues to provide excellent results
and show high potential as a new area for mineral reserve growth. Ongoing exploration drilling on a high grade shoot at Morro do Vento
has defined the down plunge continuation of the Main, Hangingwall, and Footwall reefs with the following significant intercepts with estimated
true width: 7.4 g/t of gold over 5.5 metres (drill hole MVTEX46); 8.4 g/t of gold over 2.3 metres (drill hole MVTEX32); and 4.9 g/t of
gold over 3.3 metres (drill hole MVTEX43).
Overall, these exploration
and infill drilling results suggest a significant expansion of both mineral reserves and mineral resources within the Canavieiras and
Morro do Vento sectors by the end of 2020, while new potential in the João Belo and Morro da Viúva sectors indicate excellent
potential for expansion of inferred mineral resources (Figure 9-2). The results, at minimum, support the Phase II Expansion production
scenario presented in Section 24 of this technical report.
In terms of the regional
exploration potential, the favourable gold-bearing stratigraphy at Jacobina has been traced along a strike length for approximately 150
km (Figure 9-1). Exploration programs have discovered many gold occurrences along this favourable stratigraphy, including the Jacobina
Norte project, where gold mineralization has been discovered along a continuous 15-km-long trend (Figure 9-1).
47

Figure
9-2: Jacobina longitudinal section showing down-plunge exploration potential
48
10
DRILLING
From 1970
to the end of December 2019, approximately 868,469 m of surface and underground drilling has been completed in the Jacobina project
area (Table 10-1, Table 10-2, Figure 10-1 and Figure 10-2). Surface drilling is done using NQ-diameter (47.6 mm)-sized core; underground
drilling uses LTK48-diameter core (35.3 mm) and BQ-diameter core (36.5 mm). The drill contractors used for surface drilling on the property
were Geoserv Pesquisa Geologicas S.A., WFS Sondagem Ltda., Geocontrole, and Geologia e Sondagens Ltda. (Geosol). Underground core drilling
was completed by Jacobina personnel. Any unsampled core is stored on site at the core storage facility.
Table
10-1: Summary of drilling history between 1970 and December 31, 2019
| Company |
|
Period |
|
No. Drill Holes |
|
Metres Drilled |
|
| Anglo American |
|
1970 - 1996 |
|
886 |
|
109,697 |
|
| William Multi-Tech |
|
1996 - 1998 |
|
134 |
|
9,235 |
|
| Desert Sun |
|
2003 - 2006 |
|
429 |
|
63,426 |
|
| Yamana |
|
2006 - 2019 |
|
5,790 |
|
686,111 |
|
| Total |
|
|
|
7,239 |
|
868,469 |
|
Table
10-2: Historical distribution of drilling by mine as of December 31, 2019
| Mining Block |
|
Type |
|
No. Drill Holes |
|
Total Length
(m) |
|
| João Belo |
|
Surface |
|
83 |
|
36,046 |
|
| |
Underground |
|
2264 |
|
181,808 |
|
| Morro do Vento |
|
Surface |
|
224 |
|
57,526 |
|
| |
Underground |
|
1373 |
|
106,647 |
|
| Morro do Cuscuz |
|
Surface |
|
42 |
|
13,673 |
|
| |
Underground |
|
491 |
|
47,433 |
|
| Serra do Córrego |
|
Surface |
|
118 |
|
25,037 |
|
| |
Underground |
|
519 |
|
52,966 |
|
| Canavieiras South |
|
Surface |
|
54 |
|
30,006 |
|
| |
Underground |
|
543 |
|
89,951 |
|
| Canavieiras Central |
|
Surface |
|
55 |
|
27,137 |
|
| |
Underground |
|
343 |
|
56,074 |
|
| Canavieiras North |
|
Surface |
|
35 |
|
9,190 |
|
| |
Underground |
|
751 |
|
62,499 |
|
| Exploratory |
|
Surface |
|
106 |
|
32,014 |
|
| |
Underground |
|
8 |
|
2,552 |
|
| Others |
|
|
|
230 |
|
37,910 |
|
| Total |
|
|
|
7,239 |
|
868,469 |
|
49

Figure
10-1: Distribution of drilling, by mine, as of December 31, 2019 (top); Drilling by year (2010—2019) (bottom)
50

Figure
10-2: Location of drill holes
51
Jacobina
geologists follow a series of standard operating procedures (SOPs) for the planning and execution of surface-based and underground-based
core drilling programs (Table 10-3). In brief, the procedures currently used during the core drilling programs are as follows:
1.
The collar locations of all drill holes are marked by Jacobina survey crews prior to drilling and the collars are surveyed using
a differential base-station GPS after the completion of the drilling.
2.
A Reflex Gyro survey instrument is used to provide control information on the directional deviation (both azimuth and inclination)
at three-metre intervals in each hole.
3.
Core is placed in labelled boxes at the drill site and the boxes are transported by the drill contractor to the logging facility.
4.
All core is photographed.
5.
Company geologist conduct lithological logging of drill core and recording of geotechnical observation, describing all downhole
data including assay intervals. All information is recorded on paper forms and then entered in digital format. The following features
are recorded:
·
Core diameter
·
Rock quality designation measurements
·
Core recovery record
·
Downhole inclination
·
Lithological contacts
·
Description of geology
·
Recording of heavy mineral and sulphide content
·
Type and intensity of various alterations
·
Structural features, such as fractures and fault zones
·
Core angles
·
Sampling intervals
52
Table
10-3: Drilling procedures
| Procedure Number |
|
Description |
| Planning and Execution |
| POP-04-12-3.5-227 |
|
Drill hole planning |
| POP-04-12-3.5-358 |
|
Diamec U6 drill rig operation |
| POP-04-12-3.5-213 |
|
Diamec 252 drill rig operation |
| POP-04-12-3.5-001 |
|
Channel sampling and underground geological mapping |
| POP-04-12-3.5-412 |
|
Mobilization, demobilization, and operation of drill rigs |
| Logging and Sampling |
| POP-04-12-3.5-318 |
|
Storage and organization of geological data and responsibilities |
| POP-04-12-3.5-372 |
|
Drill hole deviation measurement |
| POP-04-12-3.5-380 |
|
Photographic record of drill cores |
| POP-04-12-3.5-072 |
|
Lithological description |
No overall core recovery statistics were reviewed, but
it is estimated that overall core recovery is greater than 95%. The sampled core should provide a reliable reflection of the mineralization
in the mining operation.
Drilling activities at Jacobina have been successful at
expanding the extent of known gold mineralization and in defining the plunge of the higher-grade portions of mineralized zones. The results
and interpretations of this work are summarized in Sections 14 and 15.
The qualified person responsible for this section of the
technical report is of the opinion that the logging and recording procedures are consistent with industry standards, and that there are
no known drilling, sampling, or recovery factors that could materially affect the accuracy and reliability of the results.
53
11
SAMPLE PREPARATION, ANALYSES, AND SECURITY
Analytical samples include both drill core and channel
samples. The drill core samples are generated from exploration and infill drilling programs that are conducted on surface and underground;
they are used for target generation and estimation of mineral resources and reserves. The channel samples come from underground grade
control channels in development drifts; they are used for short-term forecasting and grade control as well as for estimation of mineral
resources and reserves.
11.1
SAMPLE PREPARATION AND ANALYSIS
Sample
preparation and analysis at Jacobina are carried out according to a series of SOPs (Table 11-1). The current methodology of sampling
drill core and underground workings at Jacobina is described below.
Table
11-1: List of sample preparation and analytical standard operating procedures
| Procedure Number |
|
Description |
|
| POP-04-12-3.5-060 |
|
Storage and disposal of cores, chips, and pulps |
|
| POP-04-12-3.5-381 |
|
Drill core sampling |
|
| POP-04-12-3.5-403 |
|
QA/QC protocol |
|
| POP-04-12-3.5-404 |
|
Rock density test |
|
| POP-04-12-3.5-077 |
|
Preparation and dispatch of samples to the laboratory |
|
| POP-04-12-3.5-337 |
|
Sample reception by the laboratory |
|
| POP-04-12-3.5-359 |
|
Sample preparation |
|
| POP-04-12-3.5-367 |
|
Gold analysis by fire assay (FA) |
|
| POP-04-12-3.5-370 |
|
Gold determination by atomic absorption |
|
Sampling of Drill Core:
1.
Sampling/assay intervals are generally 0.5 m in length in the conglomerates and 1.0 m in the boundary quartzites, but can be shorter
to respect geological boundaries. Four 0.5 m boundary samples are taken from the waste quartzites on each side of a conglomerate intersection.
2.
Sample numbers are assigned to the intervals. Certified standards and blanks are inserted into the sample stream.
3.
Core samples from the surface drilling (HQ and NQ core diameter, 63.5 mm and 47.6 mm, respectively) are cut in half by saw; one
half is sent for assay and the remainder is stored on site. Underground drill core (BQ and LTK48 core diameter, 36.5 mm and 35.3 mm, respectively)
is sampled in its entirety.
54
4.
Exploration drill core samples are placed in bags and are sent to the commercial laboratory ALS Chemex (ALS) laboratory in Vespasiano,
Brazil, for preparation and analysis.
5.
Infill drill core samples are placed in bags and are sent to the mine laboratory at Jacobina for preparation and analysis.
Underground Channel Sampling:
1.
Underground faces are washed and the contacts of the mineralization are marked.
2.
Channel samples are taken at right angles to the dip across the face in both ore and waste, respecting the geological contacts.
The normal sample length is 0.5 m.
3.
Samples are bagged and sent to the Jacobina Mine Laboratory for preparation and assaying. Certified standards and blanks are inserted
into the sample stream.
The results of the underground channel samples are used
for short-term forecasting and grade control as well as in the grade estimation process for resource models.
In the opinion of the qualified person responsible for
this section of the technical report, the sampling methodologies at Jacobina conform to industry standards and are adequate for use in
mineral resource estimation.
Preparation and Analytical Procedures
Samples from the exploration drilling programs are assayed
using ALS and the Jacobina laboratory as the primary laboratories, and SGS Geosol Lab Ltda (SGS Geosol) as the secondary laboratory, both
located in Vespasiano, Minas Gerais state, Brazil. Samples from the infill drilling programs and from the grade control channels are assayed
using the Jacobina laboratory as the primary laboratory and using SGS Geosol located in Vespasiano, Brazil, as the secondary laboratory.
The Jacobina laboratory is owned and operated by Yamana and is not accredited. ALS and SGS Geosol laboratories are independent of Yamana
and are accredited under ISO/IEC 17025.
The following procedures, including the insertion rate
of the QA/QC samples, are used by the Jacobina laboratory and ALS laboratory for sample preparation and analysis:
1.
A submittal form is filled out by a Jacobina geologist or technician and delivered with the samples to the Jacobina laboratory
or to ALS.
2.
Samples are sorted, logged in, opened, and dried at 110ºC.
3.
The entire sample is crushed in a jaw crusher to better than 90% passing 10 mesh. Crushers are cleaned with compressed air between
every sample
55
and with
a quartz blank wash every 20th sample. Every second quartz blank wash sample is placed
into the analytical sequence. Granulometric checks on the crushed material are done three times per shift.
4.
A 500 g subsample is taken by a rotary splitter or by Jones riffle splitter. The split is pulverized using a steel ring mill to
better than 95% passing 150 mesh. Pulverizers are cleaned with compressed air after each sample and with a quartz wash after every 20th sample.
Every second quartz wash sample is placed into the analytical sequence. Granulometric checks on the pulverized material are done three
times per shift.
5.
Standard fire assay (FA) methods using a 50 g pulp sample are used to determine total gold content. Samples containing visible
gold can be assayed using a screened metallic assay protocol. In this procedure, a 500 g or 1 kg split is pulverized to 95% passing 150
mesh; screening this pulp results in a fine and coarse fraction (possibly containing coarse gold) which are assayed separately.
6.
The sample, fluxes, lead oxide litharge, and silver are mixed and fired at 1,100 to 1,170ºC for 50 to 60 minutes so that
precious metals report to the molten lead metal phase. The samples are removed from the furnace and poured into moulds. Next, the slag
is removed from the cooled lead button and the button is placed in a cupel and fired at 920ºC to 960ºC for one hour to oxidize
all the lead and render a precious metal bead.
7.
The cupels are removed from the furnace and the beads are separated by acid digestion using nitric and hydrochloric acid to dissolve
the precious metals into solution. The sample solutions are analyzed by an atomic absorption spectrophotometer-AAS. For screened metallic
assays, the coarse fraction is assayed in total and an aliquot of the fine fraction is analyzed. The gold concentration of the entire
sample is determined by weighted average.
8.
Analytical batches contain 42 client samples, two pulp duplicates, two reagent blanks, and two certified standards.
The qualified person responsible for this section of the
technical report is of the opinion that the sample preparation, analytical, and assay procedures of drill core samples used for exploration
and delineation are consistent with industry standards and adequate for use in the estimation of mineral resources.
56
11.2
QUALITY ASSURANCE/ QUALITY CONTROL MEASURES
Yamana employs a comprehensive QA/QC program for monitoring
the assay results of exploration drilling programs, infill drilling programs, and grade control channel samples.
Yamana and JMC use certified reference materials (CRM or
standards), blanks, field and coarse crush duplicate samples and pulp duplicates to monitor the precision, accuracy, contamination and
quality of the laboratories. These standards are purchased from Geostats Pty Ltd. (Geostats) and ORE Pty Ltd. (OREAS), both in Australia.
Currently, Yamana has protocols in place for describing the frequency and type of QA/QC submission, the regularity of analysis of QA/QC
results, and failure limits. There are also set procedures to be followed in case of failure, or for flagging failures in the QA/QC database.
The results from the QA/QC program are reviewed and monitored
by a dedicated Quality Control team who presents the results by means of detailed reports on a regular basis. These results are discussed
in Section 12 of this technical report.
11.2.1
STANDARDS
For drill
core samples, Yamana inserts one standard for every 30 samples submitted to the primary laboratories (ALS or Jacobina laboratory). For
channel samples, Jacobina geology staff insert one standard for every 40 channel samples submitted to the Jacobina laboratory. Standards
of low, medium, and high gold grades are supplied in pre-packaged bags purchased from Geostats and OREAS. Geostats and OREAS provide Yamana
with certificates listing the round-robin assay results and the expected standard deviation for each standard. The certified values are
provided in Table 12-2.
Jacobina exploration staff submitted 2,949 standards with
drill core samples between January 2019 and December 2019 (submission frequency of one standard per 32 samples). Between January 2019
and December 2019, Jacobina geology staff submitted 643 standard samples with channel samples (submission frequency of one standard
per 39 samples).
11.2.2
BLANK SAMPLES
Blank samples are composed of siliceous material which
is known to contain gold grades that are less than the detection limit of the analytical method (< 0.005 g/t gold) for both the Jacobina
laboratory and ALS laboratory. Yamana inserts one blank sample for every 30 drill core samples submitted to the Jacobina laboratory and
ALS laboratory. Jacobina geology staff insert one blank sample for every 40 channel samples submitted to the Jacobina laboratory.
Between January 2019 and December 2019, Jacobina
exploration staff submitted 3,028 blank samples with drill core samples (submission frequency of one blank per 31 samples); geology staff
submitted 735 blank samples with channel samples (submission frequency of one blank per 34 samples).
57
11.2.3
COARSE CRUSH DUPLICATES
Yamana’s procedure requires the submission of one
coarse crush duplicate for every 20 samples. Between January 2019 and December 2019, 4,605 drill core coarse crush duplicate
samples and 1,325 channel sample crush duplicate samples were analyzed for gold.
The submission frequency in 2019 was one coarse crush duplicate
per 20 drill core samples, and one coarse crush duplicate per 19 channel samples.
11.2.4
FIELD DUPLICATES
Yamana’s procedure requires the submission of one
field duplicate for every 20 samples. Between January and December 2019, 1,231 drill core field duplicate samples (one for every
24 samples) and 715 channel field duplicate samples (one per 34 samples) were analyzed for gold.
The procedure for sampling the drill core field duplicate
is to saw the core in half, and to saw one of those halves to create two quarter-core samples. One quarter-core is sent as a regular sample
and the other quarter-core is sent as the field duplicate for that same interval. The remaining half-core is stored in the box in the
core shed.
Underground channel field duplicate procedure consists
of collecting a separate sample parallel to the original sample from the underground rock face.
11.2.5
INTER-LABORATORY PULP DUPLICATES
The Jacobina laboratory and the ALS laboratory send 5%
of pulp samples, as selected by Jacobina staff, on a monthly basis to the SGS Geosol laboratory in Vespasiano, Brazil, which is an independent
ISO 9001-2015- and ISO/IEC 17025:2005- certified laboratory for check assays reanalysis. Analysis of these pulps is useful for measuring
the precision of the analytical process of the ALS and Jacobina laboratories, assuring a better degree of accuracy and control on assays.
A total of 4,568 pulp samples from drill core and 1,241 channel pulp samples were sent between January 2019 and December 2019.
The qualified person responsible for this section of the
technical report is of the opinion that there are no drilling, sampling, or recovery factors that could materially affect the accuracy
and reliability of the results.
11.3
SAMPLE SECURITY
Samples are handled only by personnel authorized by JMC.
Channel samples from the mining operation are delivered directly to the Jacobina laboratory each day upon completion of underground sampling.
All drill core from surface and underground drill holes is taken directly to authorized exploration personnel to a drill logging and sampling
area within the secured and guarded mine property. The mineralized core intervals are logged and sampled. Core samples from infill drill
holes are subsequently delivered to the Jacobina laboratory and core samples
58
from exploratory drill core samples are loaded onto an
outsourced company truck and delivered to ALS laboratory in Vespasiano, Minas Gerais, Brazil.
Each sample is assigned a unique sample number that allows
it to be traced through the sampling, database, and analytical procedure workflow, and validated against the original sample site. For
exploration drill holes, the remaining half of the split core is stored on-site as a control sample, available for review and resampling
if required.
The photographic record is kept for all drill holes, for
later consultation, if necessary.
In the opinion of the qualified person responsible for
this section of the technical report, the sample preparation, sample security, and analytical procedures at Jacobina are adequate and
consistent with industry standards.
59
12
DATA VERIFICATION
12.1
DATABASE VERIFICATION
Jacobina staff carried out a data verification program
for the assay tables included in the drill hole databases by spot-checking the assay data from a selection of 2019 drill holes that intersected
the underground mineralized wireframe domains, thus relevant to the current mineral resource estimate. The validation was done by comparing
the selected information entered in the digital database with that of the original laboratory certificates.
Additional checks included a comparison of the drill hole
collar location data with the digital models of the surface topography and excavation models as well as a visual inspection of the downhole
survey information. The validation routines in Leapfrog Geo and Maptek Vulcan software, consisting of checking for overlapping samples
and duplicate records, were also carried out.
Based on the data review, in the opinion of the qualified
person responsible for this section of the technical report, the data entry and verification procedures of drill hole and channel samples
data at Jacobina are consistent with industry standards and the data is adequate for the purposes of mineral resource estimation.
The QA/QC database prior to 2019 has been validated by
independent consultants, most recently by RPA (2019).
12.2
QUALITY ASSURANCE/QUALITY CONTROL RESULTS
The performance
of the QA/QC program from January 1 to December 31, 2019 is presented in Table 12-1. Details on the performance of each
type of control sample are provided below.
Table
12-1: Summary of QA/QC results, January 1 to December 31, 2019
| Type |
|
Standards |
|
Blanks |
|
| |
Failure tolerance = 5% > ± 2SD |
|
Failure tolerance = 5% > 5×
Detection Limit |
|
| |
No of QC
samples |
|
%
Approved |
|
%
Failures |
|
%
Bias |
|
No of QC
samples |
|
%
Approved |
|
%
Failures |
|
| Exploration Drilling — ALS |
|
536 |
|
99.63 |
|
0.37 |
|
-0.23 |
|
544 |
|
99.63 |
|
0.37 |
|
| Infill Drilling — ALS |
|
40 |
|
100.00 |
|
0.00 |
|
0.49 |
|
43 |
|
100.00 |
|
0.00 |
|
| Exploration Drilling — Jacobina lab |
|
486 |
|
96.71 |
|
3.29 |
|
-0.95 |
|
494 |
|
99.61 |
|
0.39 |
|
| Infill Drilling — Jacobina lab |
|
1,891 |
|
97.46 |
|
2.54 |
|
-0.70 |
|
1,929 |
|
99.69 |
|
0.31 |
|
| Underground Channels — Jacobina lab |
|
643 |
|
98.29 |
|
1.71 |
|
-0.59 |
|
735 |
|
99.46 |
|
0.54 |
|
60
12.2.1
STANDARDS
Table
12-2 to Table 12-6 outline the performance and show the failure rates for the various standards submitted in 2019 as part of the
drilling (exploration and infill) and channel sample stream at both the ALS and Jacobina laboratories. The overall failure rates are within
the target of 5% standard failures; a failure is defined a gold analysis of a standard that assayed greater than plus or minus two standard
deviations (> ± 2SD) from the certified value. In the opinion of the qualified person responsible for this section of the technical
report, these results are considered acceptable.
Figure
12-1 shows the performance of the standards submitted with the exploration drill core samples, the infill drill core samples, and
the underground channel samples that were assayed at either the ALS laboratory or the Jacobina laboratory.
Table
12-2: Performance of standards, ALS laboratory — exploration drilling
| CRM no. |
|
G308-7 |
|
OREAS 251 |
|
G909-1 |
|
G908-3 |
|
G901-7 |
|
OREAS 209 |
|
G472-1 |
|
G900-5 |
|
G310-9 |
|
OREAS 215 |
|
G903-6 |
|
G910-5 |
|
G307-7 |
|
G310-8 |
|
Total
14 |
|
| Certified Au grade (g/t Au) |
|
0.27 |
|
0.50 |
|
1.02 |
|
1.03 |
|
1.52 |
|
1.58 |
|
2.80 |
|
3.21 |
|
3.29 |
|
3.54 |
|
4.13 |
|
5.23 |
|
7.87 |
|
7.97 |
|
|
|
| Average Result (g/t Au) |
|
0.26 |
|
0.51 |
|
1.02 |
|
1.04 |
|
1.48 |
|
1.69 |
|
2.83 |
|
3.15 |
|
3.35 |
|
3.58 |
|
4.09 |
|
5.10 |
|
7.95 |
|
7.70 |
|
|
|
| Au ppm Difference (g/t Au) |
|
-0.01 |
|
0.01 |
|
-0 |
|
0.01 |
|
-0 |
|
0.1 |
|
0.03 |
|
-0.1 |
|
0.06 |
|
0.04 |
|
-0 |
|
-0.13 |
|
0.08 |
|
-0.28 |
|
|
|
| Average Bias (%) |
|
-3.98 |
|
1.98 |
|
-0.5 |
|
0.66 |
|
-3 |
|
6.65 |
|
1.07 |
|
-1.9 |
|
1.66 |
|
1.13 |
|
-1.5 |
|
-2.58 |
|
0.99 |
|
-3.45 |
|
-0.23 |
|
| Min. zScore |
|
-1.65 |
|
0.4 |
|
-1.3 |
|
-1.1 |
|
-0.6 |
|
1.33 |
|
0.19 |
|
-0.4 |
|
-1.88 |
|
0.23 |
|
-3.3 |
|
-0.57 |
|
-1.04 |
|
-0.75 |
|
|
|
| Max. zScore |
|
0.45 |
|
0.4 |
|
1.33 |
|
1.94 |
|
-0.6 |
|
1.33 |
|
0.19 |
|
-0.4 |
|
2.01 |
|
0.23 |
|
1.02 |
|
-0.46 |
|
1.75 |
|
-0.63 |
|
|
|
| Total No. of Samples |
|
103 |
|
1 |
|
97 |
|
73 |
|
1 |
|
1 |
|
1 |
|
1 |
|
122 |
|
1 |
|
27 |
|
2 |
|
105 |
|
2 |
|
537 |
|
| Failures +/- 2SD |
|
0 |
|
0 |
|
0 |
|
0 |
|
0 |
|
0 |
|
0 |
|
0 |
|
1 |
|
0 |
|
1 |
|
0 |
|
0 |
|
0 |
|
2 |
|
| % Failures +/- 2SD |
|
0 |
|
0 |
|
0 |
|
0 |
|
0 |
|
0 |
|
0 |
|
0 |
|
0.82 |
|
0 |
|
3.7 |
|
0 |
|
0 |
|
0 |
|
0.37 |
|
| Failures +/- 3SD |
|
0 |
|
0 |
|
0 |
|
0 |
|
0 |
|
0 |
|
0 |
|
0 |
|
0 |
|
0 |
|
0 |
|
0 |
|
0 |
|
0 |
|
0 |
|
| % Failures +/- 3SD |
|
0 |
|
0 |
|
0 |
|
0 |
|
0 |
|
0 |
|
0 |
|
0 |
|
0 |
|
0 |
|
0 |
|
0 |
|
0 |
|
0 |
|
0.00 |
% |
61
Table
12-3: Performance of standards, ALS laboratory — infill drilling
| CRM no. |
|
G308-7 |
|
OREAS 251 |
|
G909-1 |
|
G908-3 |
|
OREAS 209 |
|
G310-9 |
|
OREAS 215 |
|
G903-6 |
|
G307-7 |
|
n=9 |
|
| Certified Au grade (g/t Au) |
|
0.27 |
|
0.50 |
|
1.02 |
|
1.03 |
|
1.58 |
|
3.29 |
|
3.54 |
|
4.13 |
|
7.87 |
|
|
|
| Average Result (g/t Au) |
|
0.26 |
|
0.51 |
|
1.00 |
|
1.05 |
|
1.69 |
|
3.32 |
|
3.58 |
|
4.34 |
|
7.99 |
|
|
|
| Au Difference (g/t Au) |
|
-0.01 |
|
0.01 |
|
-0.02 |
|
0.02 |
|
0.1 |
|
0.03 |
|
0.04 |
|
0.21 |
|
0.12 |
|
|
|
| Average Bias (%) |
|
-2.36 |
|
1.98 |
|
-1.99 |
|
1.94 |
|
6.65 |
|
0.85 |
|
1.13 |
|
5.08 |
|
1.48 |
|
0.49 |
% |
| Min. zScore |
|
-0.65 |
|
0.4 |
|
-0.82 |
|
-0.19 |
|
1.33 |
|
-0.18 |
|
0.23 |
|
1.02 |
|
-0.3 |
|
|
|
| Max. zScore |
|
0.05 |
|
0.4 |
|
0.17 |
|
1.07 |
|
1.33 |
|
0.43 |
|
0.23 |
|
1.02 |
|
0.86 |
|
|
|
| Total No. of Samples |
|
8 |
|
1 |
|
4 |
|
5 |
|
1 |
|
10 |
|
1 |
|
1 |
|
9 |
|
40 |
|
| Failures +/- 2SD |
|
0 |
|
0 |
|
0 |
|
0 |
|
0 |
|
0 |
|
0 |
|
0 |
|
0 |
|
0 |
|
| % Failures +/- 2SD |
|
0 |
|
0 |
|
0 |
|
0 |
|
0 |
|
0 |
|
0 |
|
0 |
|
0 |
|
0 |
|
| Failures +/- 3SD |
|
0 |
|
0 |
|
0 |
|
0 |
|
0 |
|
0 |
|
0 |
|
0 |
|
0 |
|
0 |
|
| % Failures +/- 3SD |
|
0 |
|
0 |
|
0 |
|
0 |
|
0 |
|
0 |
|
0 |
|
0 |
|
0 |
|
0 |
|
62
Table
12-4: Performance of standards, Jacobina laboratory — exploration drilling
| CRM no. |
|
G308-7 |
|
OREAS 251 |
|
G909-1 |
|
G908-3 |
|
G901-7 |
|
OREAS 209 |
|
G472-1 |
|
G900-5 |
|
G310-9 |
|
OREAS 215 |
|
G903-6 |
|
G910-5 |
|
G307-7 |
|
G310-8 |
|
n=14 |
|
| Certified
Au grade (g/t Au) |
|
0.27 |
|
0.50 |
|
1.02 |
|
1.03 |
|
1.52 |
|
1.58 |
|
2.8 |
|
3.21 |
|
3.29 |
|
3.54 |
|
4.13 |
|
5.23 |
|
7.87 |
|
7.97 |
|
|
|
| Average
Result (g/t Au) |
|
0.26 |
|
0.52 |
|
1.03 |
|
1.04 |
|
1.54 |
|
1.56 |
|
3.16 |
|
3.20 |
|
3.22 |
|
3.34 |
|
3.98 |
|
5.15 |
|
7.83 |
|
7.86 |
|
|
|
| Au
Difference (g/t Au) |
|
-0.01 |
|
0.02 |
|
0.01 |
|
0.01 |
|
0.02 |
|
-0.03 |
|
0.36 |
|
-0.02 |
|
-0.07 |
|
-0.2 |
|
-0.15 |
|
-0.08 |
|
-0.04 |
|
-0.11 |
|
|
|
| Average
Bias (%) |
|
-2.31 |
|
3.57 |
|
1.26 |
|
0.87 |
|
1.2 |
|
-1.58 |
|
13.02 |
|
-0.47 |
|
-2.11 |
|
-4.6 |
|
-3.53 |
|
-1.56 |
|
-0.54 |
|
-1.36 |
|
-0.95 |
% |
| Min.
zScore |
|
-4 |
|
0.71 |
|
-0.77 |
|
-2.74 |
|
-0.78 |
|
-1.03 |
|
2.15 |
|
-1.89 |
|
-3.78 |
|
-1.88 |
|
-10.15 |
|
-1.5 |
|
-3.03 |
|
-0.71 |
|
|
|
| Max.
zScore |
|
0.9 |
|
0.71 |
|
1.22 |
|
8.16 |
|
0.86 |
|
0.39 |
|
2.41 |
|
1.02 |
|
4.26 |
|
0.2 |
|
2.66 |
|
0.88 |
|
1.11 |
|
0.12 |
|
|
|
| Total
No. of Samples |
|
87 |
|
1 |
|
71 |
|
54 |
|
8 |
|
2 |
|
2 |
|
9 |
|
91 |
|
3 |
|
36 |
|
8 |
|
102 |
|
8 |
|
481 |
|
| Failures
+/- 2SD |
|
0 |
|
0 |
|
0 |
|
1 |
|
0 |
|
0 |
|
2 |
|
0 |
|
3 |
|
0 |
|
1 |
|
0 |
|
0 |
|
0 |
|
7 |
|
| %
Failures +/- 2SD |
|
0.00 |
|
0.00 |
|
0.00 |
|
1.82 |
|
0.00 |
|
0.00 |
|
100.00 |
|
0.00 |
|
3.30 |
|
0.00 |
|
2.78 |
|
0.00 |
|
0.00 |
|
0.00 |
|
1.44 |
|
| Failures
+/- 3SD |
|
1 |
|
0 |
|
0 |
|
1 |
|
0 |
|
0 |
|
0 |
|
0 |
|
4 |
|
0 |
|
2 |
|
0 |
|
1 |
|
0 |
|
9 |
|
| %
Failures +/- 3SD |
|
1.12 |
|
0.00 |
|
0.00 |
|
1.82 |
|
0.00 |
|
0.00 |
|
0.00 |
|
0.00 |
|
4.40 |
|
0.00 |
|
5.26 |
|
0.00 |
|
0.98 |
|
0.00 |
|
1.85 |
% |
63
Table
12-5: Performance of standards, Jacobina laboratory — infill drilling
| CRM no. |
|
G307-7 |
|
G308-7 |
|
G310-9 |
|
G903-6 |
|
G908-3 |
|
G909-1 |
|
OREAS 209 |
|
OREAS 210 |
|
OREAS 215 |
|
OREAS 251 |
|
n=10 |
|
| Certified
Au grade (g/t Au) |
|
7.87 |
|
0.27 |
|
3.29 |
|
4.13 |
|
1.03 |
|
1.02 |
|
1.58 |
|
5.49 |
|
3.54 |
|
0.50 |
|
|
|
| Average
Result (g/t Au) |
|
7.77 |
|
0.27 |
|
3.25 |
|
3.71 |
|
1.03 |
|
1.04 |
|
1.51 |
|
5.22 |
|
3.38 |
|
0.50 |
|
|
|
| Au
Difference (g/t Au) |
|
-0.1 |
|
0 |
|
-0.04 |
|
-0.42 |
|
0.001 |
|
0.02 |
|
-0.08 |
|
-0.27 |
|
-0.16 |
|
0 |
|
|
|
| Average
Bias (%) |
|
-1.27 |
% |
-1.04 |
% |
-1.18 |
% |
-10.25 |
% |
-0.37 |
% |
2.01 |
% |
-4.77 |
% |
-4.97 |
% |
-4.55 |
% |
-0.66 |
% |
-0.70 |
% |
| Min.
zScore |
|
-19.95 |
|
-2 |
|
-18.36 |
|
-18.74 |
|
-14.62 |
|
-3.5 |
|
-2.66 |
|
-4.74 |
|
-1.9 |
|
-3.33 |
|
|
|
| Max.
zScore |
|
2.52 |
|
39 |
|
27.54 |
|
0.82 |
|
1.2 |
|
39.17 |
|
0.43 |
|
0.26 |
|
0.4 |
|
2.58 |
|
|
|
| Total
No. of Samples |
|
404 |
|
456 |
|
433 |
|
41 |
|
73 |
|
424 |
|
16 |
|
18 |
|
13 |
|
13 |
|
1,891 |
|
| Failures
+/- 2SD |
|
2 |
|
2 |
|
7 |
|
3 |
|
0 |
|
1 |
|
2 |
|
0 |
|
0 |
|
1 |
|
18 |
|
| %
Failures +/- 2SD |
|
0.50 |
% |
0.44 |
% |
1.62 |
% |
7.32 |
% |
0.00 |
% |
0.24 |
% |
12.50 |
% |
0.00 |
% |
0.00 |
% |
7.69 |
% |
0.95 |
% |
| Failures
+/- 3SD |
|
10 |
|
4 |
|
5 |
|
4 |
|
1 |
|
3 |
|
0 |
|
2 |
|
0 |
|
1 |
|
30 |
|
| %
Failures +/- 3SD |
|
2.48 |
% |
0.88 |
% |
1.15 |
% |
9.76 |
% |
1.37 |
% |
0.71 |
% |
0.00 |
% |
11.11 |
% |
0.00 |
% |
7.69 |
% |
1.59 |
% |
64
Table
12-6: Performance of standards, Jacobina laboratory — underground channel samples
| CRM no. |
|
G307-7 |
|
G308-7 |
|
G310-9 |
|
G908-3 |
|
G909-1 |
|
n=5 |
|
| Certified Au grade (g/t Au) |
|
7.87 |
|
0.27 |
|
3.29 |
|
1.03 |
|
1.02 |
|
|
|
| Average Result (g/t Au) |
|
7.75 |
|
0.27 |
|
3.23 |
|
1.05 |
|
1.03 |
|
|
|
| Au Difference (g/t Au) |
|
-0.12 |
|
-0.00 |
|
-0.06 |
|
0.02 |
|
0.01 |
|
|
|
| Average Bias |
|
-1.61 |
% |
-0.23 |
% |
-1.62 |
% |
1.74 |
% |
0.98 |
% |
-0.59 |
% |
| Min. zScore |
|
-15.91 |
|
-1.2 |
|
-7.29 |
|
-0.41 |
|
-12.65 |
|
|
|
| Max. zScore |
|
1.32 |
|
39.65 |
|
0.77 |
|
5.01 |
|
2.93 |
|
|
|
| Total No. of Samples |
|
157 |
|
161 |
|
167 |
|
46 |
|
112 |
|
643 |
|
| Failures +/- 2SD |
|
0 |
|
0 |
|
2 |
|
0 |
|
2 |
|
4 |
|
| % Failures +/- 2SD |
|
0.00 |
% |
0.00 |
% |
1.20 |
% |
0.00 |
% |
1.79 |
% |
0.62 |
% |
| Failures +/- 3SD |
|
2 |
|
1 |
|
2 |
|
1 |
|
1 |
|
7 |
|
| % Failures +/- 3SD |
|
1.27 |
% |
0.62 |
% |
1.20 |
% |
2.17 |
% |
0.89 |
% |
1.09 |
% |
65

Figure
12-1: Assay results of standards analyzed at ALS and Jacobina laboratories
12.2.2
BLANKS
Of the 3,763 blanks submitted in the sample streams in
2019, two blank samples (0.34% of total) submitted with drill core at ALS, eight blank samples (0.33% of total) submitted with drill core
at Jacobina laboratory, and four blank samples (0.54% of total) submitted with the channel samples at Jacobina laboratory returned assay
results greater than the selected upper limit of 0.025 g/t gold. In the opinion of the qualified person responsible for this section of
the technical report, these results are acceptable.
66
In cases
of failure, Yamana’s procedures require investigation by the laboratory as well as re-analysis of six adjacent samples or of the
entire batch containing a failed blank sample. Figure 12-2 illustrates the results of the analyses of the blanks inserted into
the sample stream for the drill core samples and channel samples, with the failure criteria (0.025 g/t gold) outlined in red.

Figure
12-2: Assay results of inserted blank samples at ALS and Jacobina laboratories
67
12.2.3
COARSE CRUSH DUPLICATES
Yamana’s
procedure requires the submission of one coarse crush duplicate for every 20 samples. Between January and December 2019, 4,663
drill hole coarse crush duplicate samples and 1,325 channel sample crush duplicate samples were analyzed for gold. The dispersion pattern
for these coarse crushed duplicate samples are consistent with expectations for this type of sample material (Figure 12-3).
12.2.4
FIELD DUPLICATES
Yamana’s
procedure requires the submission of field duplicates for every 20 samples. Between January and December 2019, 1,231 drill field
duplicate samples and 715 channel field duplicate samples were analyzed for gold. The dispersion pattern for these field duplicate samples
are consistent with expectations for this type of sample material. In view of the deposit characteristics, with the presence of free gold
and nugget effect, the qualified person responsible for this section of the technical report is of the opinion that these results are
satisfactory (Figure 12-4).
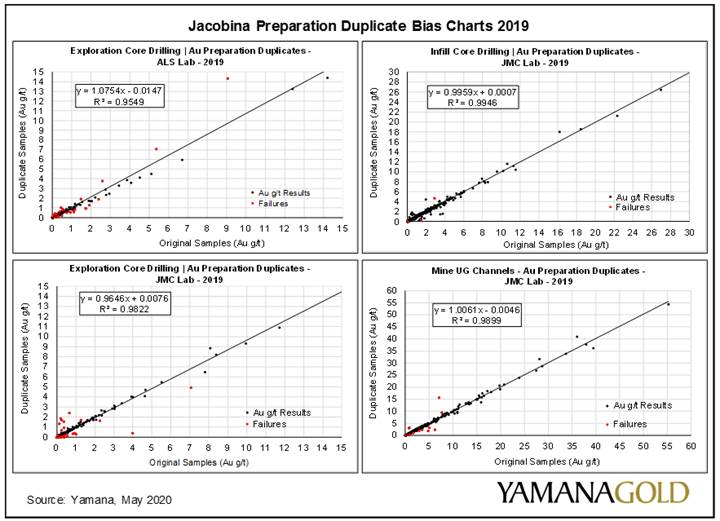
Figure
12-3: Bias charts for coarse crushed duplicates analyzed at ALS and Jacobina laboratories
68

Figure
12-4: Bias charts for field duplicates analyzed at ALS and Jacobina laboratories
12.2.5
INTER-LABORATORY PULP DUPLICATES
The ALS
and Jacobina laboratories send pulp samples, selected by the Jacobina geology team, on a monthly basis to the independent ISO 9001-2015
and ISO/IEC 17025:2005-certified SGS Geosol laboratory in Vespasiano, Minas Gerais for check assay reanalysis. Analysis of these pulps
helps determine the precision of the analytical process at the external ALS laboratory and the internal Jacobina laboratory, ensuring
a greater degree of accuracy and control on assays. A total of 4,568 pulp samples from the drilling programs and 1,241 pulp samples from
underground channel sampling were sent to SGS Geosol between January and December 2019, the results of which are presented in
Figure 12-5.
The dispersion pattern for these inter-laboratory pulp
duplicate samples are consistent with expectations for this type of sample material. No material bias is detected between the primary
and secondary laboratories.
69
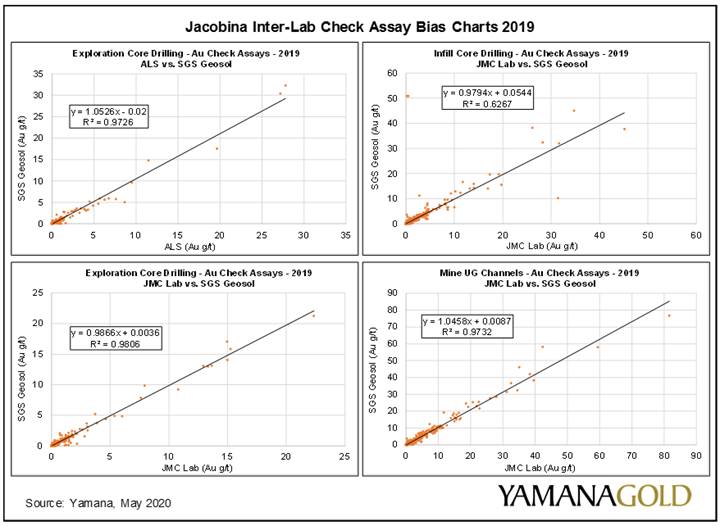
Figure
12-5: Bias charts of inter-laboratory check assay results
There were no limitations in the ability of the qualified
person to verify the data. In the opinion of the qualified person responsible for this section of the technical report, the verification
of the sampling data, including the analytical quality control data produced by Yamana for samples submitted to various laboratories,
suggests that the analytical results delivered by the laboratories are sufficiently reliable for the purpose of mineral resource and mineral
reserve estimation.
70
13
MINERAL PROCESSING AND METALLURGICAL TESTING
13.1
PROCESSING PLANT
The Jacobina mineral processing plant uses conventional
gold processing methodologies to treat run-of-mine (ROM) material from the underground mines. Comminution comprises three stages of crushing
followed by wet grinding. Within the grinding circuit, gravity concentration of gold is performed on a bleed stream of classification
cyclone underflow. Rejects from the gravity circuit are returned to the grinding circuit. The cyclone overflow is sent to leaching in
a conventional cyanide leaching process, and gold extraction from the leach solution is performed by carbon adsorption in the carbon-in-pulp
(CIP) tanks. Gold is stripped in an elution circuit and final gold recovery is performed in an electrowinning circuit. The sludge and
solids from electrowinning are dried and smelted in an induction furnace to produce doré bars. More information about the processing
plant is provided in Section 17 of this technical report.
There are no known processing factors or deleterious elements
that could have a significant effect on potential economic extraction.
13.2
METALLURGICAL TESTING
13.2.1
HISTORICAL TEST WORK
Metallurgical tests were conducted on samples from pre-2006
core drill holes from the Morro do Vento target area.
The metallurgical test work was conducted to determine
recoveries using conventional milling. SGS Lakefield Research Limited in Lakefield, Ontario (SGS Lakefield) completed the test work on
six grade/ore-type composites and one overall master composite prepared from rejects of drill core samples from the Morro do Vento project.
Samples were selected to provide a representative range of grades and a representative proportion of oxides and sulphides.
All samples were originally prepared and tested for gold
by fire assay by SGS Geosol in Brazil. Metallurgical tests consisted of grinding tests on the master composite, and cyanidation tests
on the master composite and the individual grade/ore-type composites. Average gold assay results for the individual composites ranged
from 0.53 g/t gold for the low-grade oxide composite to 3.50 g/t gold for the high-grade oxide composite. Direct assay of the master composite
by screened metallics indicated a grade of 1.73 g/t gold.
SGS Lakefield reported that the overall gold extraction
for the master composite was 96.4% from tests that ranged from 95.7% to 97.0%. The leach times were 24 hours, and no significant difference
in extraction was observed for the tests conducted over shorter (12 h), and longer (48 h) leach times. Cyanide and lime consumption
for the master composite were found to be 0.81 kg/t and 0.22 kg/t, respectively. Extractions for the individual grade/ore-type composites
71
ranged from 90.8% for low-grade oxide to 98.5% for high-grade
mixed. Tailings gold grades for these samples ranged from 0.02 g/t to 0.07 g/t.
The test work did not identify any appreciable deleterious
elements and there are no known processing factors that could have a significant effect on economic extraction.
Geometallurgical testing has been performed on an ongoing
basis from the second half of 2015 through 2019. The results of these tests are reported internally and used for operational purposes
in short-term production planning and processing plant operation. Integrating these test results has resulted in higher production rates
and improved metallurgical recovery.
In the
opinion of the qualified person responsible for this section of the technical report, the test work recoveries and grades expressed by
the master composite demonstrate expected process plant recovery and correlate well with actual plant production. Actual plant-adjusted
production for 2018 and 2019 is presented in Table 13-1 and Table 13-2, respectively. The monthly tonnage, gold grade, and gold
recovery varied during 2018 and 2019; however, the overall gold recovery of 96.2% for 2018 and the overall gold recovery of 96.7% for
2019 fit well with the results of the 2006 test work. This demonstrates acceptable reconciliation between the test work and operational
data and that an assumption of a gold recovery of 96.5% for the LOM appears reasonable. All mining sectors included in the year-end 2019
mineral reserves and LOM plan have been processed in the past, or are currently being processed, providing additional confidence in the
LOM gold recovery assumption.
Table
13-1: 2018 Jacobina mineral processing plant production
| |
|
Production |
|
Gold Recovery |
|
| Month |
|
Tonnes
(t) |
|
Gold Grade
(g/t Au) |
|
Gold
(oz) |
|
(% Au) |
|
| January |
|
166,576 |
|
2.25 |
|
11,716 |
|
97.0 |
|
| February |
|
162,199 |
|
1.98 |
|
9,960 |
|
96.3 |
|
| March |
|
174,057 |
|
2.37 |
|
12,849 |
|
96.7 |
|
| April |
|
176,748 |
|
2.29 |
|
12,598 |
|
96.7 |
|
| May |
|
186,176 |
|
2.18 |
|
12,390 |
|
95.1 |
|
| June |
|
172,398 |
|
2.38 |
|
12,743 |
|
96.5 |
|
| July |
|
130,586 |
|
2.53 |
|
10,097 |
|
95.1 |
|
| August |
|
191,805 |
|
2.25 |
|
13,374 |
|
96.4 |
|
| September |
|
156,959 |
|
2.42 |
|
11,897 |
|
97.4 |
|
| October |
|
163,164 |
|
2.46 |
|
12,408 |
|
96.1 |
|
| November |
|
172,821 |
|
2.34 |
|
12,352 |
|
94.8 |
|
| December |
|
181,969 |
|
2.15 |
|
12,311 |
|
97.7 |
|
| Total |
|
2,035,457 |
|
2.30 |
|
144,695 |
|
96.2 |
|
72
Table
13-2: 2019 Jacobina mineral processing plant production
| |
|
Production |
|
Gold
Recovery |
|
| Month |
|
Tonnes
(t) |
|
Gold Grade
(g/t Au) |
|
Gold (oz) |
|
(% Au) |
|
| January |
|
184,080 |
|
2.31 |
|
13,374 |
|
97.7 |
|
| February |
|
168,098 |
|
2.30 |
|
12,095 |
|
97.3 |
|
| March |
|
181,907 |
|
2.30 |
|
13,149 |
|
97.8 |
|
| April |
|
182,912 |
|
2.16 |
|
12,188 |
|
95.8 |
|
| May |
|
192,964 |
|
2.11 |
|
12,648 |
|
96.7 |
|
| June |
|
187,783 |
|
2.40 |
|
14,115 |
|
97.4 |
|
| July |
|
192,663 |
|
2.42 |
|
14,512 |
|
96.7 |
|
| August |
|
202,719 |
|
2.08 |
|
13,080 |
|
96.6 |
|
| September |
|
194,338 |
|
2.12 |
|
12,565 |
|
95.1 |
|
| October |
|
199,452 |
|
2.18 |
|
13,499 |
|
96.5 |
|
| November |
|
185,300 |
|
2.47 |
|
14,231 |
|
96.9 |
|
| December |
|
182,577 |
|
2.49 |
|
14,044 |
|
95.9 |
|
| Total |
|
2,254,793 |
|
2.28 |
|
159,499 |
|
96.7 |
|
73
14
MINERAL RESOURCE ESTIMATES
14.1
MINERAL RESOURCE SUMMARY
Preparation of the mineralized wireframe models used to
estimate the block grades began with the preparation of a structural model that reflected the current understanding of the location and
offsets of the many post-mineralization faults present in the mining areas. A series of lithological wireframe models was subsequently
prepared to depict the overall location and distribution of the quartz-pebble conglomerate reefs and the interbedded massive quartzite
beds. These lithological models were subsequently used to prepare wireframe models of the mineralized intervals. No minimum thickness
was applied to the mineralized wireframes used to generate the grade estimation domains. The mineralized wireframes were created using
a cut-off grade of 0.5 g/t gold. However, minimum thickness-reporting criteria for mineral resources was applied during the generation
of conceptual mining shapes.
Jacobina mineral resources have been estimated in conformity
with generally accepted standards set out in CIM Mineral Resource and Mineral Reserves Estimation Best Practices Guidelines (November 2019)
and were classified according to CIM Definition Standards for Mineral Resources and Mineral Reserves (May 2014) guidelines. Mineral
resources are reported exclusive of mineral reserves. Mineral resources are not mineral reserves and have not demonstrated economic viability.
Underground mineral resources are estimated within conceptual underground mining shapes at a cut-off grade of 1.00 g/t gold, which corresponds
to 75% of the break-even cut-off used to estimate the mineral reserves. A minimum mining width of 1.5 m is used to construct the conceptual
mining shapes. Mineral resources are reported considering internal waste and dilution.
The Mineral
Resource Statement of the Jacobina Gold Mine as of December 31, 2019, exclusive of mineral reserves, is presented in Table 14-1.
74
Table
14-1: Jacobina Mineral Resource Statement, December 31, 2019
| Category |
|
Tonnage
(kt) |
|
Gold
Grade
(Au g/t) |
|
Contained Gold
(koz) |
|
| Measured |
|
27,705 |
|
2.26 |
|
2,014 |
|
| Indicated |
|
14,765 |
|
2.27 |
|
1,076 |
|
| Total Measured + Indicated |
|
42,470 |
|
2.26 |
|
3,090 |
|
| Inferred |
|
18,528 |
|
2.36 |
|
1,406 |
|
1.
Mineral resources have been estimated by the Jacobina Resources Geology Team under the supervision of Renan Garcia Lopes, Senior
Geologist, Registered Chartered Professional Member of Australasian Institute of Mining and Metallurgy, MAusIMM CP(Geo) Number 328085,
a full-time employee of JMC, and a qualified person as defined by National Instrument 43-101. The mineral resource estimate conforms to
the CIM (2014) Standards.
2.
Mineral resources are reported exclusive of mineral reserves.
3.
Mineral resources are not mineral reserves and do not have demonstrated economic viability.
4.
Underground cut-off grade is 1.00 g/t Au, which corresponds to 75% of the cut-off used to estimate the mineral reserves.
5.
Minimum mining width of 1.5 m, considering internal waste and dilution
6.
All figures are rounded to reflect the relative accuracy of the estimate. Numbers may not add up due to rounding.
14.2
RESOURCE DATABASE AND VALIDATION
All drill
core, survey, geological, and assay information used for the mineral resource and mineral reserve estimates is verified and approved by
the Jacobina geological staff and maintained in an on-site database. Verification is done in part by using the Leapfrog Geo and Maptek
Vulcan software data validation tools. A summary of the drilling and channel sampling databases is provided in Table 14-2.
Table
14-2: Summary of drilling and channel databases used for resource estimation
| Mining Block |
|
Crystallization
Date |
|
No. of Drill
Holes |
|
No. of
Channels |
|
| Canavieiras North |
|
July 11, 2019 |
|
807 |
|
1,770 |
|
| João Belo |
|
April 29, 2019 |
|
2,271 |
|
6,248 |
|
| Morro do Cuscuz |
|
July 4, 2018 |
|
499 |
|
950 |
|
| Morro do Vento |
|
March 11, 2019 |
|
1,503 |
|
3,536 |
|
| Serra do Córrego |
|
August 31, 2018 |
|
681 |
|
96 |
|
| Canavieiras South |
|
December 6, 2018 |
|
470 |
|
5,647 |
|
| Canavieiras Central |
|
October 28, 2018 |
|
348 |
|
2,471 |
|
| Total |
|
|
|
6,579 |
|
20,718 |
|
75
14.3
INTERPRETATION OF THE GEOLOGICAL STRUCTURES, LITHOLOGY, AND MINERALIZATION
Given
the strike length of the favourable mineralized stratigraphic units outlined to date, modelling and preparation of mineral resource estimates
were undertaken only for those stratigraphic units located in the vicinity of the current mine infrastructure. To facilitate modelling
activities, these were divided into seven mining blocks covering a total strike length of approximately 8,350 m (Table 14-3, Figure
7-3).
Table
14-3: Summary of modelling extents
| Model Area |
|
Minimum Northing
(m) |
|
Maximum Northing
(m) |
|
Strike Length
(m) |
|
| João Belo |
|
8,750,310 |
|
8,752,060 |
|
1,750 |
|
| Morro do Vento |
|
8,752,400 |
|
8,755,300 |
|
2,900 |
|
| Morro do Cuscuz |
|
8,755,050 |
|
8,756,600 |
|
1,550 |
|
| Serra do Córrego |
|
8,755,000 |
|
8,757,780 |
|
2,780 |
|
| Canavieiras South |
|
8,755,450 |
|
8,756,700 |
|
1,250 |
|
| Canavieiras Central |
|
8,756,870 |
|
8,757,910 |
|
1,040 |
|
| Canavieiras North |
|
8,757,600 |
|
8,758,850 |
|
1,250 |
|
The Leapfrog Geo software package was used to prepare three-dimensional
(3D) models of the post-mineralization faults, the lithologies, and the mineralization zones. These fault surfaces were created as implicit
models using various sources of information from drill holes, channel samples, and geological mapping (both current and historical mapping).
At João Belo, a total of 19 fault planes were modelled in 2019, compared to the five fault planes modelled for the 2016 mineral resource
estimate. These fault planes were used to constrain the subsequent lithological and mineralization wireframe models.
Lithological
models for all major gold-bearing reefs, intervening massive fine-grained quartzite units, and post-mineralization intrusive units were
modeled using available underground mapping and drilling data (the cross-section in Figure 7-6 shows an example of lithological
modelling).
Separate
models of the mineralized intervals were created using sampled assay values at a threshold grade of 0.5 g/t gold. Wireframes were snapped
to the limit of the selected samples in each drill hole. The mineralized wireframe domains were constrained to within the respective reef
models, and were also constrained to their respective fault blocks (Table 14-4).
All structural, lithological, and mineralization models
are created in accordance with the procedures described in Jacobina’s standard operating procedure POP-04-12-3.5-231.
76
Table
14-4: Number of mineralized wireframes (reefs) by model area
| Model Area |
|
No. of Mineralization
Models (Reefs) |
|
| João Belo |
|
10 |
|
| Morro do Vento |
|
18 |
|
| Morro do Cuscuz |
|
9 |
|
| Serra do Córrego |
|
16 |
|
| Canavieiras South |
|
16 |
|
| Canavieiras Central |
|
26 |
|
| Canavieiras North |
|
25 |
|
| Total |
|
120 |
|
14.4
TOPOGRAPHY AND EXCAVATION MODELS
The mineralization
at Jacobina was extracted by means of open-pit mining methods during the early phases of its production history. Mining of the plant feed
is currently achieved by means of underground mining methods from a total of seven mining blocks that access the mineralized stratigraphy
along a strike length of approximately eight kilometres. All of the mineralized horizons are accessed via adits and ramps (Figure 14-1).
A topographic surface of the project area, current as of
May 2015, was used to code the block model. The topographic map includes one open pit mine (João Belo) that is now depleted;
open pit mine operations there have ceased. Wireframe models of the completed underground excavations as of December 31, 2019, were
prepared and used to code the block models for the portions of the mineralized zones that have been mined out. For older-vintage excavations,
the wireframe models for the underground accesses and stopes were reconstructed by preparing 3D-solids models from information contained
on existing two- dimensional paper maps and sections. For more recent underground excavations, solids models of the mine accesses were
constructed digitally from data collected using a total station surveying instrument. Digital information collected using cavity-monitoring
equipment was used to create 3D excavation models for stopes.
Excavation models were used to code the block model with
a single value for both development and stope volumes. The sub-blocking functions of the Maptek Vulcan software package were employed
to maximize the accuracy of the block model.
A separate
set of depletion solids were created by manual digitization on cross sections so as to encompass the excavated stope and development volumes,
any remaining intervening material residing as either ribs or sill pillars, and several metres of wall rock material in the hangingwall
and footwall of the stope voids (Figure 14-2). The objective of creating this set of depletion solids is to code the block model
so as to ensure this material is excluded from either the mineral resource or mineral reserve estimates.
77
An additional depletion solid was created to define a crown
pillar at surface in compliance with geomechanical and environmental restrictions. This was achieved by creating a parallel surface approximately
30 m beneath the topographic surface.

Figure
14-1: Plan (top) and longitudinal view (bottom) of the mine infrastructure
78

Figure
14-2: Example of excavation and depletion models
14.5
COMPOSITING METHODS
It has
been determined that 0.5 m was the most common sample length at Jacobina. A composite length of 1.0 m was selected for all drill holes
and channel samples so that the majority of the assay intervals were not split into separate composite values. Compositing is done by
mineralized layer, so the last composite of a drill hole or a channel can be less than 1.0 m long. If the last composite is 0.15
m or less, the composite is merged with the previous composite. When a given channel sample’s length is less than 1.0 m, the average
grade of the composite sample is utilized. The summary statistics and box plots of the composited length are examined by mean, minimum,
and maximum values and are shown in Figure 14-3.
79
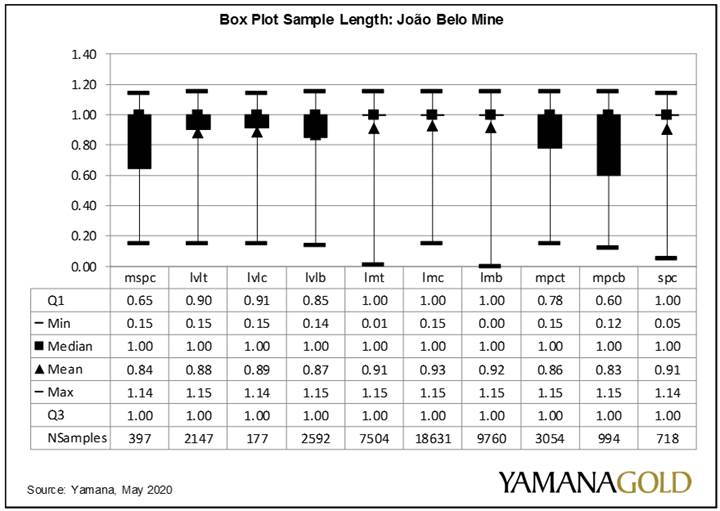
Figure
14-3: Box and whisker plot of João Belo composite samples
14.6
SAMPLE STATISTICS AND GRADE CAPPING
Descriptive statistics were computed for every mineralized
layer considering raw and composited datasets. Also, the exploratory analysis was done with histograms, probability plot and box-plots.
This procedure is a check for inconsistencies in assay and length values. Declustering weights were also computed and were reviewed for
statistical analysis.
The presence
of local high-grade outliers could potentially affect the accuracy of the mineral resource estimate. Therefore, composite samples were
statistically examined for the presence of grade outliers by using a combination of methodologies such as inspection of probability plots
(calculated with and without considering declustering weights), histogram analysis, relative error analysis, Parrish method, and indicator
correlation plot (Figure 14-4). Once the outliers were identified, appropriate capping values were established and used. Each mineralized
layer was examined separately (Figure 14-4). The capping values are listed in Table 14-5.
80

Figure
14-4: Graphical guides used for selection of capping values, João Belo Mine (lvlc reef)
81
Table
14-5: Summary of capping values by mineralized wireframe model
| Reef |
|
Capping
Value
(g/t Au) |
|
Reef |
|
Capping
Value
(g/t Au) |
|
Reef |
|
Capping
Value
(g/t Au) |
|
Reef |
|
Capping
Value
(g/t Au) |
|
Reef |
|
Capping
Value
(g/t Au) |
|
| JBN Reef |
|
Sco Reef |
|
Canavieieras
South |
|
Canavieieras
Central |
|
Canavieiras
North |
|
| Mspc |
|
4.50 |
|
Man1 |
|
22.29 |
|
|
|
|
| Lvlt |
|
11.50 |
|
Man2 |
|
9.90 |
Mspc |
|
28.0 |
|
Manc |
|
3.0 |
|
Manc1 |
|
6.5 |
|
| Lvlc |
|
3.00 |
|
Mspc |
|
8.03 |
|
Lvlt |
|
34.5 |
|
Manc1 |
|
4.8 |
|
Manc2 |
|
6.5 |
|
| Lvlb |
|
15.50 |
|
Lvlt |
|
5.43 |
|
Lvlc |
|
28.0 |
|
Manc2 |
|
4.0 |
|
Manc3 |
|
9.5 |
|
| Mpct |
|
21.00 |
|
Lvlc |
|
11.21 |
|
Lvlc1 |
|
14.5 |
|
Manc3 |
|
5.0 |
|
Mant |
|
9.0 |
|
| Mpcb |
|
18.50 |
|
Lvlc3 |
|
7.60 |
|
Lvlc2 |
|
10.5 |
|
Manb1 |
|
11.5 |
|
Manb |
|
25.0 |
|
| Lmb |
|
15.50 |
|
Lvlc4 |
|
4.71 |
|
Lvlb |
|
24.5 |
|
Manb |
|
23.5 |
|
Qtohol |
|
5.0 |
|
| Lmc |
|
19.00 |
|
Lvlc5 |
|
4.71 |
|
Mut |
|
31.0 |
|
Holc |
|
3.5 |
|
Holt |
|
21.0 |
|
| Lmt |
|
18.00 |
|
Lvlc8 |
|
4.71 |
|
Muc |
|
19.5 |
|
Lvlt |
|
12.0 |
|
Holc |
|
24.5 |
|
| Spc |
|
13.00 |
|
Lvlb |
|
12.98 |
|
Mub |
|
24.0 |
|
Lvlc1 |
|
26.5 |
|
Holb |
|
8.5 |
|
| |
|
|
|
Mut |
|
14.21 |
|
Lut |
|
27.5 |
|
Lvlc2 |
|
16.0 |
|
Libb |
|
19.0 |
|
| MVT Reef |
|
Muc |
|
11.36 |
|
Luc |
|
13.0 |
|
Lvlc3 |
|
11.0 |
|
libc |
|
18.0 |
|
| Mspc |
|
7.46 |
|
Mub |
|
15.14 |
|
Lub |
|
18.5 |
|
Lvlc4 |
|
5.5 |
|
Libt |
|
19.5 |
|
| Lvlt |
|
11.41 |
|
Lut |
|
27.13 |
|
Mant |
|
5.0 |
|
Lvlc5 |
|
16.0 |
|
Qtopir |
|
12.5 |
|
| Lvlb |
|
9.27 |
|
Luc |
|
6.11 |
|
Manc |
|
7.0 |
|
Lvlc6 |
|
13.0 |
|
Pirb |
|
36.5 |
|
| Mut |
|
15.14 |
|
Lub |
|
8.75 |
|
Manc1 |
|
2.5 |
|
Lvlc7 |
|
3.5 |
|
Pirt |
|
61.5 |
|
| Muc |
|
10.23 |
|
|
|
|
|
Manb |
|
4.0 |
|
Lvlb |
|
18.0 |
|
Lvlt |
|
16.5 |
|
| Mub |
|
8.97 |
|
MCZ Reef |
|
|
|
|
|
Mut |
|
36.0 |
|
lvlb |
|
18.0 |
|
| Flu |
|
9.84 |
|
Hw |
|
8.53 |
|
|
|
|
|
Muc |
|
13.0 |
|
Lvlc1 |
|
29.0 |
|
| Lut |
|
15.30 |
|
Mrt |
|
17.38 |
|
|
|
|
|
Mub |
|
15.0 |
|
Lvlc2 |
|
7.5 |
|
| Luc |
|
10.60 |
|
Mrb |
|
8.50 |
|
|
|
|
|
Lut |
|
74.5 |
|
Mut |
|
12.5 |
|
| Lub |
|
5.02 |
|
Fwt |
|
13.33 |
|
|
|
|
|
Luc |
|
6.0 |
|
Muc |
|
23.5 |
|
| Hwt |
|
6.50 |
|
Fwc |
|
10.57 |
|
|
|
|
|
Lub |
|
20.0 |
|
Mub |
|
10.5 |
|
| Hwb |
|
8.00 |
|
Fwb |
|
9.43 |
|
|
|
|
|
Qtolvlt |
|
7.5 |
|
Qtolu |
|
11.0 |
|
| Mr |
|
26.00 |
|
Bast |
|
17.45 |
|
|
|
|
|
Qtomub |
|
3.0 |
|
Lut |
|
58.0 |
|
| Fwt |
|
11.00 |
|
Basc |
|
23.48 |
|
|
|
|
|
Qtolut |
|
8.0 |
|
Lub |
|
15.5 |
|
| Fwc |
|
9.50 |
|
Basb |
|
29.28 |
|
|
|
|
|
Qtomut |
|
17.0 |
|
|
|
|
|
| Fwb |
|
6.50 |
|
|
|
|
|
|
|
|
|
|
|
|
|
|
|
|
|
| Bast |
|
18.43 |
|
|
|
|
|
|
|
|
|
|
|
|
|
|
|
|
|
| Basb |
|
21.84 |
|
|
|
|
|
|
|
|
|
|
|
|
|
|
|
|
|
82
14.7
BULK DENSITY
Several
thousand density measurements have been collected on drill core over the years, resulting in good understanding of the density values
and variations for the different mineralized zones and wall rocks. In general terms, the variation in density values of individual reefs
is low (Figure 14-5). Density values, which are dependent on pyrite content, were determined individually for each mineralized zone and
reef. These values are summarized in Table 14-5.

Figure
14-5: Summary of the density values for the João Belo Mine as of December 31, 2019
83
Table
14-6: Block model bulk density values
| Reef |
|
JBN |
|
MCZ |
|
MVT |
|
SCO |
|
CAS |
|
CAC |
|
CAN |
|
| |
|
(t/m3) |
|
| man |
|
— |
|
— |
|
— |
|
2.63 |
|
2.64 |
|
2.64 |
|
2.63 |
|
| hol |
|
— |
|
— |
|
— |
|
2.62 |
|
— |
|
2.64 |
|
2.64 |
|
| lib |
|
— |
|
— |
|
— |
|
— |
|
— |
|
— |
|
2.63 |
|
| pir |
|
— |
|
— |
|
— |
|
— |
|
— |
|
— |
|
2.63 |
|
| mspc |
|
2.63 |
|
— |
|
2.62 |
|
2.64 |
|
2.66 |
|
— |
|
— |
|
| qto_lvl |
|
— |
|
— |
|
— |
|
— |
|
— |
|
2.63 |
|
2.66 |
|
| lvl |
|
2.63 |
|
— |
|
2.62 |
|
2.62 |
|
2.68 |
|
2.65 |
|
2.64 |
|
| qto_mu |
|
— |
|
— |
|
— |
|
— |
|
— |
|
2.63 |
|
2.66 |
|
| mu |
|
— |
|
— |
|
2.62 |
|
2.62 |
|
2.64 |
|
2.65 |
|
2.64 |
|
| lmpc |
|
2.63 |
|
— |
|
— |
|
— |
|
— |
|
— |
|
— |
|
| flu |
|
|
|
|
|
2.60 |
|
— |
|
— |
|
|
|
|
|
| qto_lu |
|
— |
|
— |
|
— |
|
— |
|
|
|
— |
|
2.66 |
|
| lu |
|
— |
|
— |
|
2.62 |
|
2.62 |
|
2.65 |
|
2.64 |
|
2.63 |
|
| mpc |
|
2.63 |
|
— |
|
— |
|
— |
|
— |
|
— |
|
— |
|
| qto_spc |
|
— |
|
— |
|
— |
|
— |
|
— |
|
— |
|
— |
|
| spc |
|
2.65 |
|
— |
|
— |
|
— |
|
— |
|
— |
|
— |
|
| hw |
|
— |
|
2.63 |
|
2.64 |
|
— |
|
— |
|
— |
|
— |
|
| mr |
|
— |
|
2.65 |
|
2.64 |
|
— |
|
— |
|
— |
|
— |
|
| fw |
|
— |
|
2.64 |
|
2.68 |
|
— |
|
— |
|
— |
|
— |
|
| bas |
|
— |
|
2.63 |
|
2.63 |
|
— |
|
— |
|
— |
|
— |
|
| waste |
|
2.63 |
|
2.64 |
|
2.64 |
|
2.62 |
|
2.64 |
|
2.64 |
|
2.66 |
|
14.8
VARIOGRAPHY
Due to the degree of gentle undulations and the number
of post-mineralization brittle faults that are observed in the mine stratigraphy, a modified workflow was adopted for the preparation
of the block models in the various mining blocks. The process incorporates reconstruction and unfolding using the U-Fo software package
developed by the Advanced Laboratory for Geostatistical Supercomputing at the University of Chile in Santiago.
The principal steps employed by the U-Fo software package
begin with the preparation of wireframe models of the structure and mineralized zones using existing drill hole and channel sample information,
combined with geological information derived from detailed production mapping. The wireframe models are used to prepare block models of
the mineralization. These block models are then manually restored for any structural offsets using the U-Fo software. These displacements
are also applied to all drill hole and channel sample information so as to reconstruct and reflect the mineralization distribution in
the original state. The next step is to
84
carry out an unfolding step in which the reconstructed
folded block models and all sample information are transformed to a flattened plane.
Variography
and grade estimation is completed on individual reefs after the block model and sampling data has been transformed back to its original
stratigraphic position (unfaulted and unfolded). Once all estimation passes have been completed, the flattened block model is subjected
to a back-transformation step that converts the estimated block grades back to the correct location in 3D space. The variogram parameters
for the main reefs of each mine is presented in Table 14-7.
Table
14-7: Variogram parameters for the main reef of each mine
| |
|
|
|
|
|
|
|
R1x |
|
R1y |
|
R1z |
|
Angles* |
|
Bearing |
|
Plunge |
|
Dip |
|
| Mine/Reef |
|
Structure |
|
Contribution |
|
Model |
|
m |
|
m |
|
m |
|
1 |
|
2 |
|
3 |
|
1 |
|
2 |
|
3 |
|
| JBN / lmc |
|
C0 |
|
4.300 |
|
Nugget |
|
— |
|
— |
|
— |
|
0 |
|
0 |
|
0 |
|
030 |
|
00 |
|
00 |
|
| |
C1 |
|
2.300 |
|
Sph |
|
25 |
|
25 |
|
2 |
|
0 |
|
0 |
|
0 |
|
030 |
|
00 |
|
00 |
|
| |
C2 |
|
1.200 |
|
Sph |
|
110 |
|
80 |
|
¥ |
|
0 |
|
0 |
|
0 |
|
030 |
|
00 |
|
00 |
|
| |
C3 |
|
0.500 |
|
Sph |
|
110 |
|
¥ |
|
¥ |
|
0 |
|
0 |
|
0 |
|
030 |
|
00 |
|
00 |
|
| MVT / basb |
|
C0 |
|
0.546 |
|
Nugget |
|
— |
|
— |
|
— |
|
0 |
|
0 |
|
0 |
|
345 |
|
00 |
|
00 |
|
| |
C1 |
|
0.454 |
|
Sph |
|
20 |
|
10 |
|
2 |
|
0 |
|
0 |
|
0 |
|
345 |
|
00 |
|
00 |
|
| |
C2 |
|
— |
|
— |
|
— |
|
— |
|
— |
|
0 |
|
0 |
|
0 |
|
— |
|
— |
|
— |
|
| |
C3 |
|
— |
|
— |
|
— |
|
— |
|
— |
|
— |
|
— |
|
— |
|
— |
|
— |
|
— |
|
| MCZ / basb |
|
C0 |
|
0.388 |
|
Nugget |
|
— |
|
— |
|
— |
|
0 |
|
0 |
|
0 |
|
345 |
|
00 |
|
00 |
|
| |
C1 |
|
0.484 |
|
Exp |
|
25.23 |
|
5 |
|
1 |
|
0 |
|
0 |
|
0 |
|
345 |
|
00 |
|
00 |
|
| |
C2 |
|
0.170 |
|
Sph |
|
73.68 |
|
50 |
|
4 |
|
0 |
|
0 |
|
0 |
|
345 |
|
00 |
|
00 |
|
| |
C3 |
|
— |
|
— |
|
— |
|
— |
|
— |
|
— |
|
— |
|
— |
|
— |
|
— |
|
— |
|
| SCO / lut |
|
C0 |
|
0.350 |
|
Nugget |
|
|
|
|
|
|
|
0 |
|
0 |
|
0 |
|
000 |
|
00 |
|
00 |
|
| |
C1 |
|
0.490 |
|
Sph |
|
18.5 |
|
45 |
|
1.6 |
|
0 |
|
0 |
|
0 |
|
000 |
|
00 |
|
00 |
|
| |
C2 |
|
0.160 |
|
Sph |
|
70 |
|
50 |
|
2.1 |
|
0 |
|
0 |
|
0 |
|
000 |
|
00 |
|
00 |
|
| |
C3 |
|
— |
|
— |
|
— |
|
— |
|
— |
|
— |
|
— |
|
— |
|
— |
|
— |
|
— |
|
| CAS / lvlt |
|
C0 |
|
0.400 |
|
Nugget |
|
— |
|
— |
|
— |
|
0 |
|
0 |
|
0 |
|
330 |
|
00 |
|
00 |
|
| |
C1 |
|
0.465 |
|
Exp |
|
20 |
|
25 |
|
2 |
|
0 |
|
0 |
|
0 |
|
330 |
|
00 |
|
00 |
|
| |
C2 |
|
0.153 |
|
Exp |
|
140 |
|
120 |
|
5 |
|
0 |
|
0 |
|
0 |
|
330 |
|
00 |
|
00 |
|
| |
C3 |
|
— |
|
— |
|
— |
|
— |
|
— |
|
— |
|
— |
|
— |
|
— |
|
— |
|
— |
|
| CAC / lu |
|
C0 |
|
0.400 |
|
Nugget |
|
— |
|
— |
|
— |
|
0 |
|
0 |
|
0 |
|
330 |
|
00 |
|
00 |
|
| |
C1 |
|
0.540 |
|
Exp |
|
7.2 |
|
13 |
|
3.2 |
|
0 |
|
0 |
|
0 |
|
330 |
|
00 |
|
00 |
|
| |
C2 |
|
0.060 |
|
Exp |
|
50 |
|
70 |
|
4 |
|
0 |
|
0 |
|
0 |
|
330 |
|
00 |
|
00 |
|
| |
C3 |
|
— |
|
— |
|
— |
|
— |
|
— |
|
— |
|
— |
|
— |
|
— |
|
— |
|
— |
|
| CAN / pirb |
|
C0 |
|
0.500 |
|
Nugget |
|
— |
|
— |
|
— |
|
0 |
|
0 |
|
0 |
|
285 |
|
00 |
|
00 |
|
| |
C1 |
|
0.496 |
|
Sph |
|
20 |
|
50 |
|
2 |
|
0 |
|
0 |
|
0 |
|
285 |
|
00 |
|
00 |
|
| |
C2 |
|
0.100 |
|
Sph |
|
50 |
|
30 |
|
5 |
|
0 |
|
0 |
|
0 |
|
285 |
|
00 |
|
00 |
|
| |
C3 |
|
— |
|
— |
|
— |
|
— |
|
— |
|
— |
|
— |
|
— |
|
— |
|
— |
|
— |
|
* The rotation angles are shown in Maptek Vulcan convention and
were calculated after the unfolding process
85
14.9
BLOCK MODEL CONSTRUCTION
Block
models for all seven mining blocks were created for their original 3D position using the Maptek Vulcan mine modelling software package.
The block models employed a variable block size strategy. For those blocks contained within a mineralized wireframe outline, the block
sizes are set at 1 × 1 × 1 m. For those blocks that are located outside of the boundary of a mineralized wireframe, the parent
block size was set at 10 × 10 × 10 m, with sub-blocking to 1 × 1 × 1 m. A summary of the block model attributes is
provided in Table 14-8.
Table
14-8: Generalized block model parameters
Attribute
Name |
|
Type |
|
Decimals |
|
Background |
|
Description |
| ad |
|
Float |
|
0 |
|
-99 |
|
Average distance Block x Samples |
| au |
|
Float |
|
0 |
|
-99 |
|
Gold estimated grades |
| bound |
|
Character |
|
— |
|
waste |
|
Flag orebody ID |
| chn |
|
Integer |
|
— |
|
-99 |
|
Channel sample zone for classification |
| class_b |
|
Integer |
|
— |
|
-99 |
|
Official Resource Classification |
| data |
|
Integer |
|
— |
|
20190831 |
|
Date in yyyymmdd |
| dens |
|
Float |
|
0 |
|
2.624 |
|
Density |
| deplet |
|
Integer |
|
— |
|
0 |
|
Geological deplete |
| geo |
|
Character |
|
— |
|
out |
|
Flag Reef Name |
| id3 |
|
Float |
|
0 |
|
-99 |
|
Gold estimated grades with ID3 |
| island |
|
Integer |
|
— |
|
-99 |
|
Shell ufo |
| ke |
|
Float |
|
0 |
|
-99 |
|
Kriging efficiency |
| kv |
|
Float |
|
0 |
|
-99 |
|
Kriging variance |
| lp |
|
Float |
|
0 |
|
-99 |
|
Lagrange Parameter |
| mine |
|
Character |
|
— |
|
jbn |
|
JBN |
| mined_out |
|
Integer |
|
— |
|
0 |
|
Mined out |
| nh |
|
Integer |
|
— |
|
-99 |
|
Number of holes |
| nn |
|
Float |
|
0 |
|
-99 |
|
Gold estimated grades near neighbour |
| ns |
|
Integer |
|
— |
|
-99 |
|
Number of samples |
| octi |
|
Float |
|
0 |
|
-99 |
|
Octant information |
| octu |
|
Float |
|
0 |
|
-99 |
|
Octant used |
| oxi |
|
Integer |
|
— |
|
-99 |
|
1 Sap 2 oxi 3 Sulf |
| prazo |
|
Character |
|
— |
|
mp |
|
LP_Long-Term MP_Medium-Term CP_Short-Term |
| run |
|
Integer |
|
— |
|
-99 |
|
Estimative Resource Classification |
| sil30 |
|
Integer |
|
— |
|
0 |
|
Blocks below 30 m surface |
| sr |
|
Float |
|
0 |
|
-99 |
|
Slope regression |
| topo |
|
Character |
|
— |
|
rock |
|
Topographic data |
86
Block
model grades were interpolated into blocks with the ordinary kriging (OK) algorithm, using the capped composite grades for each individual
reef separately. Gold grades were estimated for the waste intervals located between the mineralized reefs. The restricted search function
of the Maptek Vulcan software package was used to limit the influence of high-grade sample values to within 3 m of the composite. A discretization
factor of 4 × 4 × 2 was used for all estimation passes. Several estimation passes were applied using increasing search ellipse
sizes and different estimation parameters. A summary of the general search strategies used to prepare the estimation on the flattened
block models is presented in Table 14-9.
Table
14-9: Summary of the general estimation search parameters
| Parameter |
|
1st Pass |
|
2nd Pass |
|
3rd Pass |
|
4th Pass |
|
| Interpolation method |
|
OK |
|
OK |
|
OK |
|
OK |
|
| Search range X |
|
6 |
|
35 |
|
65 |
|
150 |
|
| Search range Y |
|
15 |
|
30 |
|
60 |
|
100 |
|
| Search range Z |
|
1 |
|
2 |
|
4 |
|
15 |
|
| Minimum number of composites |
|
4 |
|
3 |
|
2 |
|
1 |
|
| Maximum number of composites |
|
8 |
|
10 |
|
12 |
|
8 |
|
| Octant search |
|
Yes |
|
Yes |
|
Yes |
|
Yes |
|
| Minimum number of octant |
|
4 |
|
3 |
|
2 |
|
— |
|
| Maximum number of composites per octant |
|
6 |
|
6 |
|
6 |
|
— |
|
| Minimum number of composites per boreholes |
|
3 |
|
3 |
|
2 |
|
— |
|
| Maximum number of composites per boreholes |
|
2 |
|
2 |
|
2 |
|
2 |
|
*Search parameters vary for each mine and reef. The
parameters shown in this table are the most common.
14.10
BLOCK MODEL VALIDATION
The block
grade models from each of the interpolated zones were systematically validated against their corresponding composite data set (capped
and declustered), nearest neighbour (NN), and inverse distance to the power of three (ID3)
models in order to validate appropriate reproduction of the input data. The ID3 interpolations
were estimated with the same parameters as the OK estimate. The average grades of the various datasets are presented in Table 14-10 with
an example from João Belo.
Visual
inspection of the block model results against the input data is a useful tool to detect any spatial artefacts that may come from the interpolation
setup. The block model should honour the input data within reasonable limits. The composite data, block model, and geological overlays
were reviewed on the computer screen on cross-sections, longitudinal sections, and plans. This inspection determined that the representation
of the grade distribution, according to the drilling information, was found to be adequate and accurate. An example swath plot is presented
in Figure 14-6.
87
Table
14-10: Statistical validation of the estimated block model (João Belo — mspc reef)
| |
|
Samples
(Declustered) |
|
OK |
|
ID3 |
|
NN |
|
| Number of blocks |
|
— |
|
991,927 |
|
991,927 |
|
991,927 |
|
| Number of samples |
|
397 |
|
— |
|
— |
|
— |
|
| Gold Statistics (g/t Au): |
|
|
|
|
|
|
|
|
|
| Minimum |
|
0.12 |
|
0.35 |
|
0.15 |
|
0.12 |
|
| Q1 |
|
0.67 |
|
0.95 |
|
0.89 |
|
0.71 |
|
| Median |
|
1.03 |
|
1.26 |
|
1.23 |
|
1.12 |
|
| Q3 |
|
1.81 |
|
1.64 |
|
1.74 |
|
2.01 |
|
| Maximum |
|
4.50 |
|
4.20 |
|
4.50 |
|
4.50 |
|
| Mean |
|
1.41 |
|
1.43 |
|
1.43 |
|
1.42 |
|
| Standard deviation |
|
1.00 |
|
0.75 |
|
0.80 |
|
0.95 |
|
| Variance |
|
1.01 |
|
0.56 |
|
0.63 |
|
0.91 |
|
| Coefficient of variation |
|
0.71 |
|
0.52 |
|
0.56 |
|
0.67 |
|
88

Figure 14-6:
Swath plots for lvlc Reef, João Belo Mine
14.11
CLASSIFICATION OF MINERAL RESOURCES
The mineral resource classification was done within each
grade shell based on the distance from the drill holes. The block models were flagged using a distance buffer from the wireframe solids.
The blocks inside a 30 m radius from a minimum of three drill holes composites were classified as measured mineral resources. The blocks
inside a 30 to 80 m radius from the minimum of three drill holes composites were classified as indicated mineral resource. Finally,
89
the blocks
within a distance between 80 and 150 m from a single drill hole composite were classified as inferred mineral resource. A manual post-processing
smoothing step was subsequently performed. Longitudinal sections of the mineral resource categories are shown in Figure 14-7 to
Figure 14-9.
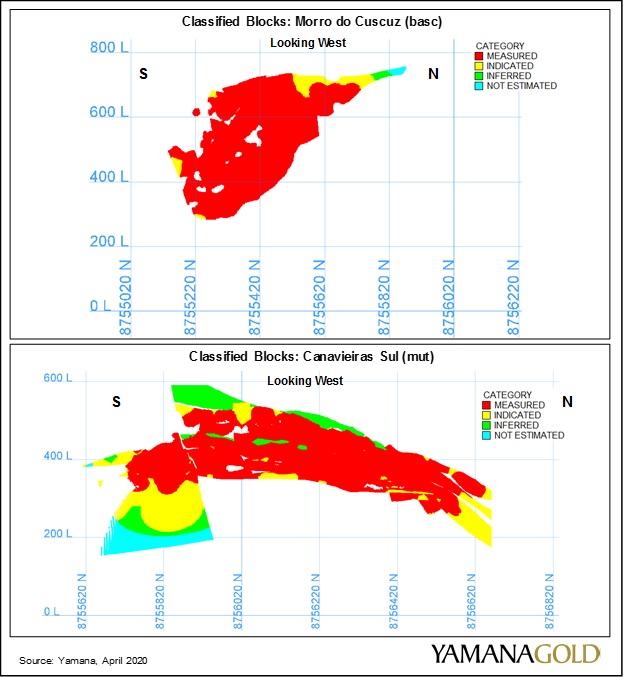
Figure
14-7: Long section of classified block models at Morro do Cuscuz (top) and Canavieiras South (bottom)
90

Figure
14-8: Long section of classified block models at Serra do Córrego (top) and Canavieiras Central (bottom)
91

Figure
14-9: Long section of classified block models at João Belo (top) and Morro do Vento (bottom)
92
14.12
MINERAL RESOURCE STATEMENT
The “reasonable prospect for eventual economic extraction”
requirement in CIM Definition Standards for Mineral Resources and Mineral Reserves (2014) generally implies that the quantity and grade
estimates meet certain economic thresholds and that the mineral resources are reported at an appropriate cut-off grade that takes into
account extraction scenarios and processing recoveries. After evaluation, it was determined that underground extraction methods can be
considered for mineral resource reporting at Jacobina.
A cut-off grade of 1.0 g/t gold was used for reporting
the mineral resource estimates. This cut-off grade corresponds to approximately 75% of the break-even cut-off grade used to estimate the
mineral reserves. Otherwise, the price, processing recovery, and operating cost assumptions are the same than those used to estimate mineral
reserves.
The mineral resources are exclusive of mineral reserves
and are prepared using Mineable Stope Optimizer (MSO) shapes that are based on a cut-off grade of 1.0 g/t gold, a stope size of 10 m ×
10 m, and a minimum width of 1.5 m. Their use as constraints in preparing mineral resource estimates demonstrate that the mineralization
meets the “reasonable prospects for eventual economic extraction” requirement for mineral resources as defined in the CIM definitions.
The Mineral Resource Statement for Jacobina as of December 31,
2019, exclusive of mineral reserves, is presented in at the beginning of this Section 14. A summary of the mineral resources by mining
block is presented in Table 14-11.
93
Table
14-11: Summary of Jacobina mineral resources by mining block as of December 31, 2019
| |
|
|
|
Cut-Off
Grade |
|
Tonnage |
|
Gold
Grade |
|
Contained
Gold |
|
| Category |
|
Zone |
|
(g/t Au) |
|
(kt) |
|
(g/t Au) |
|
(koz) |
|
| Measured |
|
JBN |
|
1.0 |
|
11,175 |
|
2.07 |
|
744 |
|
| |
MVT |
|
1.0 |
|
4,508 |
|
2.19 |
|
317 |
|
| |
MCZ |
|
1.0 |
|
2,242 |
|
1.98 |
|
143 |
|
| |
SCO |
|
1.0 |
|
696 |
|
2.32 |
|
52 |
|
| |
CAS |
|
1.0 |
|
5,630 |
|
2.32 |
|
420 |
|
| |
CAC |
|
1.0 |
|
1,767 |
|
3.35 |
|
190 |
|
| |
CAN |
|
1.0 |
|
1,687 |
|
2.73 |
|
148 |
|
| |
|
Total Measured |
|
1.0 |
|
27,705 |
|
2.26 |
|
2,014 |
|
| Indicated |
|
JBN |
|
1.0 |
|
4,636 |
|
2.03 |
|
302 |
|
| |
MVT |
|
1.0 |
|
6,178 |
|
2.52 |
|
501 |
|
| |
MCZ |
|
1.0 |
|
282 |
|
1.60 |
|
14 |
|
| |
SCO |
|
1.0 |
|
1,017 |
|
2.56 |
|
84 |
|
| |
CAS |
|
1.0 |
|
1,058 |
|
1.45 |
|
49 |
|
| |
CAC |
|
1.0 |
|
958 |
|
2.76 |
|
85 |
|
| |
CAN |
|
1.0 |
|
637 |
|
1.98 |
|
41 |
|
| |
Total Indicated |
|
1.0 |
|
14,765 |
|
2.27 |
|
1,076 |
|
| Measured & Indicated |
|
JBN |
|
1.0 |
|
15,811 |
|
2.06 |
|
1046 |
|
| |
MVT |
|
1.0 |
|
10,686 |
|
2.38 |
|
818 |
|
| |
MCZ |
|
1.0 |
|
2,524 |
|
1.94 |
|
157 |
|
| |
SCO |
|
1.0 |
|
1,713 |
|
2.46 |
|
136 |
|
| |
CAS |
|
1.0 |
|
6,688 |
|
2.18 |
|
469 |
|
| |
CAC |
|
1.0 |
|
2,724 |
|
3.14 |
|
275 |
|
| |
CAN |
|
1.0 |
|
2,324 |
|
2.53 |
|
189 |
|
| |
Total M+I |
|
1.0 |
|
42,470 |
|
2.26 |
|
3,090 |
|
| Inferred |
|
JBN |
|
1.0 |
|
7,797 |
|
2.08 |
|
521 |
|
| |
MVT |
|
1.0 |
|
6,019 |
|
2.59 |
|
501 |
|
| |
MCZ |
|
1.0 |
|
69 |
|
1.57 |
|
3 |
|
| |
SCO |
|
1.0 |
|
708 |
|
1.97 |
|
45 |
|
| |
CAS |
|
1.0 |
|
1,286 |
|
1.66 |
|
69 |
|
| |
CAC |
|
1.0 |
|
2,365 |
|
3.26 |
|
248 |
|
| |
CAN |
|
1.0 |
|
285 |
|
2.13 |
|
20 |
|
| |
Total Inferred |
|
1.0 |
|
18,528 |
|
2.36 |
|
1,406 |
|
1.
Mineral resources are reported exclusive of mineral reserves.
2.
Mineral resources are not mineral reserves and do not have demonstrated economic viability.
94
3.
Underground cut-off grade is 1.00 g/t Au, which corresponds to 75% of the cut-off used to estimate the mineral reserves.
4.
Minimum mining width of 1.5 m, considering internal waste and dilution
5.
All figures are rounded to reflect the relative accuracy of the estimate. Numbers may not add up due to rounding.
The qualified person responsible for this section of the
technical report is not aware of any environmental, permitting, legal, title, taxation, socio-economic, marketing, political or other
relevant factors that could materially affect the mineral resource estimate.
95
15
MINERAL RESERVE ESTIMATES
15.1
MINERAL RESERVE SUMMARY
The Mineral
Reserve Statement of Jacobina as of December 31, 2019, is presented in Table 15-1.
Table
15-1: Jacobina Mineral Reserve Statement, December 31, 2019
| |
|
|
Proven |
|
|
Probable |
|
|
Total Reserves |
|
| |
|
|
|
|
Gold |
|
Contained |
|
|
|
|
Gold |
|
Contained |
|
|
|
|
Gold
Grade |
|
Contained |
|
| Zone |
|
|
Tonnes
kt |
|
Grade
g/t Au |
|
Gold
koz |
|
|
Tonnes
kt |
|
Grade
g/t Au |
|
Gold
koz |
|
|
Tonnes
kt |
|
g/t
Au |
|
Gold
koz |
|
| JBN |
|
|
6,591 |
|
1.93 |
|
408 |
|
|
3,388 |
|
1.87 |
|
203 |
|
|
9,979 |
|
1.91 |
|
612 |
|
| MVT |
|
|
2,268 |
|
2.11 |
|
154 |
|
|
5,674 |
|
2.44 |
|
445 |
|
|
7,942 |
|
2.35 |
|
599 |
|
| MCZ |
|
|
1,449 |
|
1.93 |
|
90 |
|
|
87 |
|
1.96 |
|
5 |
|
|
1,536 |
|
1.93 |
|
95 |
|
| SCO |
|
|
673 |
|
1.93 |
|
42 |
|
|
1,356 |
|
2.1 |
|
92 |
|
|
2,030 |
|
2.04 |
|
133 |
|
| CAS |
|
|
5,761 |
|
2.33 |
|
432 |
|
|
1,117 |
|
2.12 |
|
76 |
|
|
6,878 |
|
2.3 |
|
508 |
|
| CAC |
|
|
2,640 |
|
3.39 |
|
288 |
|
|
1,372 |
|
2.56 |
|
113 |
|
|
4,012 |
|
3.1 |
|
400 |
|
| CAN |
|
|
1,338 |
|
2.59 |
|
111 |
|
|
461 |
|
2.29 |
|
34 |
|
|
1,799 |
|
2.51 |
|
145 |
|
| Total |
|
|
20,720 |
|
2.29 |
|
1,525 |
|
|
13,456 |
|
2.24 |
|
968 |
|
|
34,176 |
|
2.27 |
|
2,493 |
|
1.
Mineral reserves have been estimated by the Jacobina long-term mine planning team under the supervision of Eduardo de Souza
Soares, Registered Chartered Professional Member of Australasian Institute of Mining and Metallurgy, MAusIMM CP(Min) Number 330431, a
full-time employee of JMC, and a qualified person as defined by National Instrument 43-101. The mineral reserve estimate conforms to the
CIM (2014) Standards.
2.
Mineral reserves are reported by zone at variable cut-off grades ranging from of 1.12 g/t to 1.30 g/t gold. Lower-grade
stopes were subsequently excluded from the life of mine plan and mineral reserves inventory to optimize the cash flow model. The cut-off
grade is based on metal price assumptions of US$1,250/oz for gold, a gold processing recovery assumption of 96%, and operating cost assumptions
ranging from US$42.60 to 49.52/t processed.
3.
Mineral reserves are stated at a mill feed reference point and account for minimum mining widths, diluting material, and mining
losses.
4.
All stope shapes contain a majority of measured and indicated mineral resources and may include minority portions of inferred
resources and unclassified material with modelled gold grades.
5.
Numbers may not add up due to rounding.
15.2
CONVERSION METHODOLOGY
The methodology used at Jacobina to convert mineral resources
to mineral reserves is summarized as follows:
·
Verify geometries for the block model and resource wireframes.
96
·
Confirm accurate block model depletion with current excavated development and stope solids up to the effective reporting date.
·
Discard any resources within 30 m of the surface topography.
·
Create automated stope shapes using MSO in Datamine using variable break-even cut-off grades by zone and stope dimensions of 10
× 10 m.
·
Design stope polygons in Maptek Vulcan based on MSO stope shapes at section spacing of 5 to 10 m, depending on continuity of mineralization.
·
Design the stope shapes in Maptek Vulcan based on the stope polygons and the stope design parameters outlined in Table 15-2, considering
orebody geometry, mine layout, historical information, and geotechnical analysis.
·
Design development shapes and cut development shapes from stope shapes.
·
Evaluate all shapes against the block model and report ore tonnes and grade by classification. Exclude stope shapes and associated
development below the cut-off grades outlined in Table 15-3.
·
Exclude all stopes that contain mostly inferred mineral resources.
·
Design capital and auxiliary development, including ramps, ventilation, materials handling, access, and infrastructure.
·
Complete an economic analysis of each stope shape and exclude all stope shapes that are not cash-flow positive when considering
associated development and infrastructure.
·
Complete a geotechnical analysis of each sector and make adjustments to the design where required.
·
List stopes as “approved” or “not approved” based on cut-off grade, economic and geotechnical analyses prior
to conversion to mineral reserves. Apply the mining extraction factor.
97
Table
15-2: Stope design parameters
| Sector |
|
Minimum
Mining Width
(m) |
|
Hangingwall
Overbreak
(m) |
|
Stope
Length
(m) |
|
Stope
Height*
(m) |
|
Sill Pillar
Height
(m) |
|
Rib Pillar
Length
(m) |
|
Rib Pillar
Length at
Crosscut (m) |
|
| CAN |
|
2.5 to 3.0 |
|
0.4 to 3.0 |
|
40 |
|
25 to 28 |
|
6 to 8 |
|
5 |
|
15 |
|
| CAC |
|
2.5 to 3.0 |
|
0.4 to 3.0 |
|
40 |
|
25 to 28 |
|
7 to 12 |
|
5 |
|
15 |
|
| CAS |
|
2.5 to 3.0 |
|
0.4 to 3.0 |
|
30 |
|
25 to 28 |
|
6 to 8 |
|
5 |
|
15 |
|
| JBN |
|
2.5 to 3.0 |
|
0.4 to 3.0 |
|
30 |
|
25 to 28 |
|
7 to 12 |
|
5 |
|
15 |
|
| MVT |
|
2.5 to 3.0 |
|
0.4 to 3.0 |
|
25 |
|
25 to 28 |
|
6 to 7 |
|
5 |
|
15 |
|
| MCZ |
|
2.5 to 3.0 |
|
0.4 to 3.0 |
|
30 |
|
25 to 28 |
|
6 to 7 |
|
5 |
|
15 |
|
| SCO |
|
2.5 to 3.0 |
|
0.4 to 3.0 |
|
50 |
|
25 to 28 |
|
6 to 8 |
|
5 |
|
15 |
|
*Stope height measured from floor
of bottom drift to back of stope (inclined distance)
15.3
DILUTION AND EXTRACTION
Dilution of sublevel longhole stopes is modelled by applying
an overbreak skin to the hanging walls of stope widths based on stope spans and dilution abacuses, averaging 15%. A variable extraction
factor ranging from 92% to 93% is then applied to the resulting diluted tonnes of ore. The average operational dilution and extraction
performance for 2019 was approximately 12% and 93%, respectively, which supports the values used for mineral reserve reporting as of December 31,
2019.
15.4
CUT-OFF GRADE
Cut-off
grades for the mineral reserve estimate were calculated on a zone by zone basis, and range from 1.12 g/t gold to 1.30 g/t gold, as shown
in Table 15-3.
Table
15-3: Cut-off grades
| Description |
|
Units |
|
CAC |
|
CAN |
|
CAS |
|
JBN |
|
MCZ |
|
MVC |
|
MVS |
|
SCO |
|
| Plant Recovery |
|
% Au |
|
96 |
% |
96 |
% |
96 |
% |
96 |
% |
96 |
% |
96 |
% |
96 |
% |
96 |
% |
| Taxes — CFEM |
|
% |
|
1.50 |
% |
1.50 |
% |
1.50 |
% |
1.50 |
% |
1.50 |
% |
1.50 |
% |
1.50 |
% |
1.50 |
% |
| Gold Price |
|
US$/oz |
|
1,250 |
|
1,250 |
|
1,250 |
|
1,250 |
|
1,250 |
|
1,250 |
|
1,250 |
|
1,250 |
|
| Mining Cost |
|
US$/t processed |
|
27.52 |
|
23.92 |
|
23.25 |
|
26.54 |
|
24.73 |
|
30.17 |
|
27.25 |
|
30.12 |
|
| Plant Cost |
|
US$/t processed |
|
12.43 |
|
12.43 |
|
12.43 |
|
12.43 |
|
12.43 |
|
12.43 |
|
12.43 |
|
12.43 |
|
| G&A + Other + Overhead |
|
US$/t processed |
|
6.92 |
|
6.92 |
|
6.92 |
|
6.92 |
|
6.92 |
|
6.92 |
|
6.92 |
|
6.92 |
|
| Cut-Off Grade |
|
g/t Au |
|
1.23 |
|
1.14 |
|
1.12 |
|
1.21 |
|
1.16 |
|
1.30 |
|
1.23 |
|
1.30 |
|
98
15.5
RECONCILIATION
Reconciliation
for the period comprised between January and December 2019 for mined versus processed tonnage, and planned versus recalculated
feed grade was analyzed. The reconciliation results are presented in Table 15-4.
Table
15-4: 2019 Reconciliation
| |
|
Jan |
|
Feb |
|
Mar |
|
Apr |
|
May |
|
Jun |
|
Jul |
|
Aug |
|
Sep |
|
Oct |
|
Nov |
|
Dec |
|
2019 |
|
| Mine (oz) |
|
12,677 |
|
13,083 |
|
13,763 |
|
13,390 |
|
14,065 |
|
13,956 |
|
13,648 |
|
15,479 |
|
13,219 |
|
13,929 |
|
16,884 |
|
10,396 |
|
164,489 |
|
| Plant Gold Recovery (oz) |
|
12,900 |
|
12,329 |
|
13,218 |
|
12,658 |
|
13,782 |
|
13,800 |
|
13,029 |
|
12,933 |
|
12,743 |
|
13,797 |
|
13,560 |
|
13,173 |
|
157,922 |
|
| Smelter Gold Recovery (oz) |
|
13,374 |
|
12,095 |
|
13,149 |
|
12,188 |
|
12,648 |
|
14,115 |
|
14,512 |
|
13,080 |
|
12,565 |
|
13,499 |
|
14,231 |
|
14,044 |
|
159,499 |
|
| Mine Variation vs. Smelter (%) |
|
105 |
|
92 |
|
96 |
|
91 |
|
90 |
|
101 |
|
106 |
|
85 |
|
95 |
|
97 |
|
84 |
|
135 |
|
97 |
|
The qualified person responsible for this section of the
technical report is not aware of any mining, metallurgical, infrastructure, permitting or other relevant factors that could materially
affect the mineral reserve estimate.
99
16
MINING METHODS
16.1
MINE DESIGN AND MINING METHOD
Jacobina utilizes the sublevel longhole stoping (SLS) method
without backfill to achieve an average production rate of approximately 6,500 tpd from the ramp-accessed underground mines; these include
João Belo, Canavieiras, Serra do Córrego, Morro do Cuscuz, and Morro do Vento.
The SLS
method uses fan drilling as shown in Figure 16-1. Production drill holes vary from 76 to 112.5 mm in diameter and are drilled using
three types of fan drills; these include the Solo 5 7F, the Solo DL 420, and the Solo DL 421. For the most part, drill holes are no longer
than 25 m, which helps control deviation. Backfill is not required for the SLS mining method as the stopes are supported by pillars left
in place. However, development waste is increasingly being deposited in underground voids.
Ramp access
to the mineralized zones allows for a high degree of flexibility. Figure 16-2 to Figure 16-4 show the mined out areas and mineral
reserves for the south (João Belo), central (Morro do Vento and Morro do Cuscuz) and north (Canavieiras and Serra do Córrego)
portions of the mining complex.
Yamana is currently reviewing alternative mining methods
and testing the suitability of the Jacobina tailings for paste fill or hydraulic fill applications. The results will be considered in
a conceptual study that will evaluate the potential for constructing a fill plant at Jacobina. The use of cemented rock fill is also being
evaluated. Alternative mining methods and the use of backfill is likely to increase mining extraction and has the potential to increase
conversion of measured and indicated mineral resources to mineral reserves.
100

Figure
16-1: Schematic cross-section of sublevel stoping
101

Figure 16-2:
Mineral reserves — South Complex
102

Figure
16-3: Mineral reserves — Central Complex
103

Figure
16-4: Mineral reserves — North Complex
104
16.2
GEOMECHANICS
Production dilution estimates at Jacobina have been developed
through measurement of the stope geometries to evaluate the correlation between stope dilution and hydraulic radius.
Empirical
models were developed to provide estimates of potential dilution using the Mathews method. Figure 16-5 shows an example of estimated
dilution curves as a function of the rock mass rating and the dimensions and geometry of the stope. The N’ input parameters are based
on field measurement that assess the rock mass quality. Long-term rock mass quality values used for dilution estimates were prepared by
E- Mining Technology S.A. as part of their geotechnical study for Jacobina in 2016 (E- Mining, 2016).
Stope stability is typically controlled through modification
of the stope length as a way to manage the hydraulic radius of the hangingwall. For long-term planning, a hydraulic radius of approximately
13 is typically used, resulting in stope dilution estimates of 10% to 20%. Short-term planning dilution estimates are supported by the
actual results of the reconciliation process.
Safety factor estimates of rib and sill pillars considered
for short-term production plans are calculated using the Lunder and Pakalnis (1997) empirical method. The overall stability for long-term
planning is estimated by means of numerical analysis with the MAP3D software.
The rib pillar width is most commonly 5 m but can reach
to up to 10 m; a 15 m pillar dimension is used for the protection of any main access. In 2007 and 2008, Itasca was commissioned to
carryout studies following pillar failures. Since completion of the studies, there have been no pillar failures and the dimensions of
the stope design and pillars have proven adequate.
The support standards applied to underground excavations
are selected according to the classification of rock masses adopted by JMC; these are based on Barton’s Q system and RMR classification
methods, protocols that are internationally adopted by the civil construction and mining industries. The selection of ground support for
temporary and permanent excavations depends on the class of the rock mass (geomechanical domain) in which they are located. Bolts; bolts
and steel screen; or a combination of bolts, steel screen, and shotcrete are used. The bolts are the primary support element. They can
be fixed with resin or cement cartridges and their spatial distribution varies in spacing and quantity according to the quality of the
rock mass. Steel screens are installed in regions or areas of very fractured rocks to hold the rock blocks that form between the risers.
Shotcrete is used in areas of extremely fractured rock, subject to popping or immediate rupture; its thickness can vary between 60 mm
and 90 mm.
Typical
ground support standards by excavation type and quality of the rock mass are summarized in Table 16-1.
105
Table
16-1: Jacobina ground support standards
| Class |
|
Bolt Length |
|
Bolt Spacing (m) |
|
Start Bolting Height (m) |
|
Mesh Type |
|
Shotcrete Thickness (cm) |
|
| Ramps and Permanent Development — 4.5 m x 5.5 m |
|
| II |
|
2.4 m Rebar |
|
1.70 x 1.70 |
|
1.6 |
|
Welded |
|
— |
|
| III |
|
2.4 m Rebar |
|
1.50 x 1.50 |
|
1.3 |
|
Welded |
|
— |
|
| IV |
|
2.4 m Rebar |
|
1.25 x 1.25 |
|
1.3 |
|
Welded |
|
60 to 90 |
|
| V |
|
2.4 m Rebar |
|
1.10 x 1.10 |
|
1.0 |
|
Welded |
|
60 to 90 |
|
| Temporary Development — 4.0 m x 4.8 m |
|
| II |
|
2.4 m Rebar |
|
1.70 x 1.70 |
|
1.6 |
|
Welded |
|
— |
|
| III |
|
2.4 m Rebar |
|
1.50 x 1.50 |
|
1.3 |
|
Welded |
|
— |
|
| IV |
|
2.4 m Rebar |
|
1.25 x 1.25 |
|
1.3 |
|
Welded |
|
60 to 90 |
|
| V |
|
2.4 m Rebar |
|
1.10 x 1.10 |
|
1.0 |
|
Welded |
|
60 to 90 |
|

Figure
16-5: Stability chart with dilution curves
106
16.3
LIFE OF MINE PLAN
This section outlines the LOM plan of the Phase 1 scenario,
including optimization of the processing plant to stabilize throughput at a sustainable 6,500 tpd (Phase 1 Optimization). Additional LOM
scenarios, including the Phase 2 Expansion to 8,500 tpd, developed as part of the Phase 2 pre-feasibility study (PFS), are outlined in
Section 24 of this technical report.
The Phase 1 LOM plan has been developed based on the mineral
reserves inventory of Jacobina as of December 31, 2019, resulting in a mine life of 14.5 years. No additional mineral resources or
exploration potential are considered in this mine plan. Mining of lower grade supplementary ore is deferred until late in the mine life
where possible, allowing feed grades of approximately 2.4 g/t gold to be maintained.
A summary
of the Phase 1 Optimization LOM plan by sector and processing plan is presented in Figure 16-6. At a throughput of 6,500 tpd, gold
feed grade of 2.4 g/t and metallurgical recovery of 96.5%, gold production increases to approximately 175,000 oz per year, a shown in
Figure 16-6. Lateral development requirements to achieve the LOM plan are approximately 64,000 metres of capital development and 100,000
metres of secondary development.

Figure
16-6: Phase 1 LOM gold production profile
Source: Yamana, May 2020
For internal planning purposes, Yamana includes conversion
of inferred mineral resources in the later years of the LOM, which increases the Phase 1 Optimization LOM to 18.5 years. There is also
a significant inferred mineral resource that may be converted to measured and indicated mineral resources in the future with the required
infill drilling, which has potential to further extend the mineral reserve LOM plan.
107
Table
16-2: Life of mine plan — Phase 1 Optimization
| Description |
|
Units |
|
LOM |
|
FY20 |
|
FY21 |
|
FY22 |
|
FY23 |
|
FY24 |
|
FY25 |
|
FY26 |
|
FY27 |
|
FY28 |
|
FY29 |
|
FY30 |
|
FY31 |
|
FY32 |
|
FY33 |
|
FY34 |
|
| Tonnes Mined |
|
kt |
|
34,248 |
|
2,372 |
|
2,364 |
|
2,362 |
|
2,355 |
|
2,369 |
|
2,362 |
|
2,362 |
|
2,362 |
|
2,376 |
|
2,369 |
|
2,369 |
|
2,369 |
|
2,352 |
|
2,262 |
|
1,242 |
|
| JBN |
|
kt |
|
9,919 |
|
707 |
|
733 |
|
751 |
|
552 |
|
205 |
|
442 |
|
364 |
|
483 |
|
563 |
|
567 |
|
933 |
|
912 |
|
943 |
|
946 |
|
816 |
|
| MVC |
|
kt |
|
4,412 |
|
17 |
|
136 |
|
55 |
|
535 |
|
597 |
|
396 |
|
672 |
|
488 |
|
497 |
|
346 |
|
150 |
|
221 |
|
139 |
|
159 |
|
3 |
|
| MVS |
|
kt |
|
3,521 |
|
154 |
|
101 |
|
149 |
|
206 |
|
436 |
|
100 |
|
287 |
|
282 |
|
206 |
|
262 |
|
468 |
|
171 |
|
271 |
|
301 |
|
127 |
|
| CAS |
|
kt |
|
6,873 |
|
955 |
|
938 |
|
925 |
|
567 |
|
266 |
|
365 |
|
114 |
|
206 |
|
554 |
|
258 |
|
35 |
|
206 |
|
494 |
|
695 |
|
296 |
|
| CAC |
|
kt |
|
4,097 |
|
196 |
|
180 |
|
304 |
|
116 |
|
292 |
|
421 |
|
439 |
|
379 |
|
199 |
|
344 |
|
433 |
|
442 |
|
281 |
|
73 |
|
0 |
|
| MCZ |
|
kt |
|
1,582 |
|
237 |
|
102 |
|
41 |
|
231 |
|
27 |
|
143 |
|
116 |
|
217 |
|
83 |
|
91 |
|
178 |
|
79 |
|
37 |
|
0 |
|
0 |
|
| SCO |
|
kt |
|
2,029 |
|
0 |
|
0 |
|
0 |
|
0 |
|
56 |
|
89 |
|
154 |
|
241 |
|
250 |
|
501 |
|
173 |
|
312 |
|
165 |
|
88 |
|
0 |
|
| CAN |
|
kt |
|
1,816 |
|
106 |
|
173 |
|
138 |
|
147 |
|
489 |
|
406 |
|
216 |
|
67 |
|
25 |
|
0 |
|
0 |
|
27 |
|
21 |
|
0 |
|
0 |
|
| Mining Grade |
|
g/t Au |
|
2.27 |
|
2.21 |
|
2.29 |
|
2.36 |
|
2.38 |
|
2.38 |
|
2.39 |
|
2.39 |
|
2.39 |
|
2.38 |
|
2.39 |
|
2.39 |
|
2.06 |
|
2.05 |
|
1.89 |
|
2.02 |
|
| JBN |
|
g/t Au |
|
1.88 |
|
1.84 |
|
1.93 |
|
1.86 |
|
1.76 |
|
1.92 |
|
1.70 |
|
1.84 |
|
1.86 |
|
1.96 |
|
1.97 |
|
1.98 |
|
2.01 |
|
1.98 |
|
1.75 |
|
1.75 |
|
| MVC |
|
g/t Au |
|
2.50 |
|
3.62 |
|
3.27 |
|
2.70 |
|
2.53 |
|
2.81 |
|
2.73 |
|
2.63 |
|
2.35 |
|
2.71 |
|
2.11 |
|
1.90 |
|
1.85 |
|
1.94 |
|
2.01 |
|
3.15 |
|
| MVS |
|
g/t Au |
|
2.17 |
|
2.19 |
|
2.35 |
|
1.88 |
|
2.18 |
|
2.06 |
|
1.97 |
|
2.29 |
|
1.91 |
|
2.23 |
|
3.19 |
|
2.02 |
|
2.3 |
|
1.94 |
|
1.84 |
|
2.54 |
|
| CAS |
|
g/t Au |
|
2.32 |
|
2.44 |
|
2.26 |
|
2.45 |
|
2.73 |
|
2.05 |
|
2.05 |
|
2.57 |
|
2.38 |
|
2.38 |
|
2.17 |
|
2.16 |
|
1.96 |
|
2.21 |
|
2.02 |
|
2.54 |
|
| CAC |
|
g/t Au |
|
3.09 |
|
2.59 |
|
2.54 |
|
3.31 |
|
3.55 |
|
2.28 |
|
3.36 |
|
2.73 |
|
4.09 |
|
3.37 |
|
3.31 |
|
4.27 |
|
2.38 |
|
2.11 |
|
2.09 |
|
0.00 |
|
| MCZ |
|
g/t Au |
|
1.91 |
|
1.85 |
|
2.05 |
|
1.54 |
|
2.13 |
|
1.35 |
|
1.79 |
|
2.20 |
|
2.02 |
|
1.83 |
|
1.69 |
|
1.85 |
|
1.85 |
|
1.57 |
|
0.00 |
|
0.00 |
|
| SCO |
|
g/t Au |
|
2.07 |
|
0.00 |
|
0.00 |
|
0.00 |
|
0.00 |
|
2.15 |
|
2.07 |
|
2.00 |
|
1.89 |
|
2.16 |
|
2.25 |
|
1.95 |
|
1.88 |
|
2.22 |
|
2.00 |
|
0.00 |
|
| CAN |
|
g/t Au |
|
2.58 |
|
2.37 |
|
3.11 |
|
2.95 |
|
2.61 |
|
2.65 |
|
2.5 |
|
2.33 |
|
2.09 |
|
2.04 |
|
0.00 |
|
0.00 |
|
1.91 |
|
2.11 |
|
0.00 |
|
0.00 |
|
| Mill Feed |
|
|
|
|
|
|
|
|
|
|
|
|
|
|
|
|
|
|
|
|
|
|
|
|
|
|
|
|
|
|
|
|
|
|
|
| Ore Processed |
|
kt |
|
34,348 |
|
2,372 |
|
2,364 |
|
2,362 |
|
2,355 |
|
2,369 |
|
2,362 |
|
2,362 |
|
2,362 |
|
2,376 |
|
2,369 |
|
2,369 |
|
2,369 |
|
2,352 |
|
2,362 |
|
1,242 |
|
| Feed Grade |
|
g/t Au |
|
2.27 |
|
2.21 |
|
2.29 |
|
2.36 |
|
2.38 |
|
2.38 |
|
2.39 |
|
2.39 |
|
2.39 |
|
2.38 |
|
2.39 |
|
2.39 |
|
2.06 |
|
2.05 |
|
1.88 |
|
2.00 |
|
| Recovery |
|
% |
|
96.5 |
|
96.5 |
|
96.5 |
|
96.5 |
|
96.5 |
|
96.5 |
|
96.5 |
|
96.5 |
|
96.5 |
|
96.5 |
|
96.5 |
|
96.5 |
|
96.5 |
|
96.5 |
|
96.5 |
|
96.5 |
|
| Gold Produced |
|
koz |
|
2,421 |
|
162 |
|
168 |
|
173 |
|
174 |
|
175 |
|
175 |
|
175 |
|
175 |
|
175 |
|
176 |
|
176 |
|
151 |
|
149 |
|
138 |
|
77 |
|
108
16.4
MINE EQUIPMENT
A list
of the active mine equipment at Jacobina is shown in Table 16-3. Equipment age varies, with most of the equipment acquired in 2019
for the internalization of mine development. Trucks are contractor-owned and operated. The equipment required to achieve the mine plan
for the expansion case is outlined in Section 24 of this technical report.
Table
16-3: List of current mobile mining equipment
| Equipment |
|
Total |
|
| Fan Drills |
|
6 |
|
| Front-end Loaders |
|
8 |
|
| Jumbos |
|
7 |
|
| LHDs |
|
8 |
|
| Scalers |
|
7 |
|
| Scissor Lifts |
|
11 |
|
| Trucks |
|
45 |
|
| Graders |
|
4 |
|
| Backhoes |
|
3 |
|
| Water trucks |
|
2 |
|
| Shotcreters |
|
2 |
|
16.5
VENTILATION
Primary
ventilation of the underground mines at Jacobina is provided through the use of the main exhaust fans, ventilation raises, and ramps.
Air is provided to the working faces through the use of auxiliary fan with flexible and rigid ventilation ducting. A schematic ventilation
circuit for Canavieiras South Mine is shown in Figure 16-7. The underground ventilation fans utilized at the various underground
mining sectors are shown in Table 16-4. Fan air flow rates range from 120 m³/s to 200 m³/s.
Table
16-4: Ventilation fans — Number of units
| |
|
Auxiliary Fans (unit) |
|
Main Exhaust Fans (unit) |
|
| Mine |
|
75 hp |
|
100 hp |
|
125 hp |
|
150 hp |
|
Total |
|
250 hp |
|
550 hp |
|
Total |
|
| JBN |
|
4 |
|
12 |
|
— |
|
3 |
|
19 |
|
1 |
|
4 |
|
5 |
|
| MVS |
|
5 |
|
5 |
|
1 |
|
— |
|
11 |
|
1 |
|
1 |
|
2 |
|
| MVN |
|
— |
|
2 |
|
— |
|
— |
|
2 |
|
1 |
|
— |
|
1 |
|
| SCO |
|
— |
|
— |
|
— |
|
— |
|
— |
|
— |
|
— |
|
— |
|
| CAS |
|
3 |
|
15 |
|
— |
|
6 |
|
24 |
|
— |
|
3 |
|
3 |
|
| CAC |
|
— |
|
11 |
|
— |
|
2 |
|
13 |
|
— |
|
2 |
|
2 |
|
| SPARE |
|
— |
|
5 |
|
— |
|
1 |
|
6 |
|
— |
|
4 |
|
4 |
|
| Total |
|
12 |
|
50 |
|
1 |
|
12 |
|
75 |
|
3 |
|
14 |
|
17 |
|
109

Figure 16-7: Schematic sectional view of ventilation circuit –
Canavieiras South Mine
110
16.6
COMPRESSED AIR
Compressed
air is used for the operation of development jumbos and production fan drills. Air is delivered from air compressors on surface to the
underground working faces. Ramp access headings are fitted with 100-mm-diameter compressed air lines and off-takes into each level consist
of 63-mm-diameter lines. The number of units installed and their capacities are indicated in Table 16-5. Other operations that
will come on-line in the future will utilize a similar system.
Table
16-5: Compressed air
| Mine |
|
Equipment |
|
No. |
|
Pressure
(bars) |
|
Volume
(m³/h) |
|
| JBN / MVT S |
|
AC GA 160 |
|
2 |
|
7.5 |
|
1,800 |
|
| MVT C |
|
AC GA 160 |
|
2 |
|
7.5 |
|
1,000 |
|
| SCO / CAN S |
|
AC GA 160 |
|
1 |
|
7.5 |
|
1,800 |
|
| CAN N |
|
AC GA 160 |
|
2 |
|
7.5 |
|
1,800 |
|
16.7
DEWATERING
Dewatering
of underground operations is completed via a system of sumps on each level which pump up to a main sump at the collar of the portals.
This water is subsequently pumped to a treatment basin where the pH is adjusted to the required level using caustic soda. A typical dewatering
system used at the João Belo Mine is shown in Figure 16-8, although there are slight variations from mine to mine. All the
mine water is pumped back to the underground operations.
Dewatering is carried out with 13 hp Flygt submersible
pumps and 50 hp and 100 hp Weir-type pumps, with 100 to 125 mm discharge lines being the standard.
111

Figure
16-8: Schematic drawing of dewatering system at João Belo Mine
112
16.8
POWER
The power supply and distribution at Jacobina is described
in detail in Section 18 of this technical report.
16.9
COMMUNICATIONS
Underground communications are carried out with the use
of a Leaky Feeder system, which permits continuous contact between mine supervisors and operating and service crews in various locations
throughout the mine complex.
Additional systems are used for better communication between
the operators and the information center on the surface. The Newtrax system is a technology project implemented in 2018 and 2019 for controlling
secondary fans, tracking underground personnel, and monitoring gas emissions. The system reduces energy consumption by stopping secondary
fans during shift changes; improves logistics in times of emergency by tracking the location of personnel in the underground mines; and
monitors gas levels in the underground working areas, which allows supervision to anticipate ventilation problems and minimize re-entry
times after blasting.
Smartmine is a fleet control system which allows total
control of equipment in the underground mines, delivering performance information and equipment status.
113
17
RECOVERY METHODS
17.1
PROCESSING PLANT
The mineral processing plant at Jacobina is currently being
optimized to support a daily production of 6,500 tpd at a gold recovery of 96.5%. The optimization project currently underway will stabilize
the plant to ensure that the plant can achieve 6,500 tpd on a sustainable basis and maintain current recoveries as the feed grade is increased.
ROM ore
is fed to the plant after three stages of crushing. The crushed ore feeds the grinding circuit where ball mill/cyclone combinations are
used to grind and classify the ore to prepare it for feed to the leach circuit. Within the grinding circuit, gravity concentration of
gold is performed on a portion of coarse recycled material that returns to grinding. The cyclone overflow feeds a dewatering circuit (a
pre-leach thickener), which in turn feeds higher-density slurry to a leaching circuit that uses a conventional cyanide leaching process.
Carbon adsorption is used for gold extraction from the leach solution, and gold recovery is performed by electrowinning a strip solution
of highly concentrated gold from the desorption process used in the elution circuit. The current process flow sheet is depicted in Figure
17-1. The solids and sludge from the electrowinning circuit are dried and fluxed prior to being smelted to produce doré bars.
17.1.1
CRUSHING CIRCUIT
The ROM material is trucked to the crushing facilities
located adjacent to the processing plant. The broken ore is passed through a grizzly (80% passing (P80) < 180 mm) and fed to the jaw
crusher with a capacity of 942 t/h. The coarsely crushed material is then passed through secondary and tertiary cone crushers with a capacity
of approximately 556 t/h. The secondary crusher reduces the size of the feed to P80 < 40 mm, and the tertiary crusher further reduces
the feed to P80 < 8 mm.
17.1.2
GRINDING CIRCUIT
The crushed ore feeds the grinding circuit where ball mill/cyclone
combinations are used to grind and classify the ore to prepare the feed for the leach circuit. The product of the crushing circuit is
fed to storage silos and then conveyed to the ball milling circuit where ore is ground to a P80 < 150 µm. Ball mill product is
classified in cyclones, with the cyclone underflow being returned to the ball mills, and the overflow forming the feed to the leach circuit.
A portion of the cyclone underflow is processed through Knelson concentrators with concentrate pumped to Acacia Reactors. It is estimated
that 60% of the gold in the plant is recovered by the concentrator/reactor combination. Cyclone overflow from the grinding circuit is
pumped through trash screens to the pre-leach thickener followed by the leach tanks.
17.1.3
THICKENING, LEACHING, AND ADSORPTION
Cyclone
overflow from the grinding circuit is pumped to the pre-leach thickener and then to the leach tanks. The leaching circuit consists of
seven leaching tanks with a total capacity of 5,350 m3.
114
The pulp from the leaching circuit is delivered to the
carbon-in-pulp (CIP) adsorption circuit which has been optimized to include two lines of five mechanically agitated CIP tanks (increased
from one line of six CIP tanks). The activated carbon is pumped to a single screen per adsorption line. One of these screens is installed
as part of the expansion project.
The loaded carbon from the CIP circuit is delivered to
the elution circuit.
17.1.4
ELUTION CIRCUIT
The loaded carbon from the CIP circuit reports to the acid
wash column where concentrated hydrochloric acid is circulated through the bed of carbon to remove inorganic foulants such as scale and
other salts. The acid-washed carbon is then transported to a separate elution column. The elution column is filled with NaCN and NaOH
where the acid washed carbon is stripped to produce a high-grade solution which reports to the pregnant eluate tank.
17.1.5
ELECTROWINNING CIRCUIT
The pregnant solution from the carbon elution circuit and
from the Acacia reactor is circulated through electrolytic cells. Both gold rich streams are pumped to two plating cells in parallel where
the gold is deposited in the cathode cell and the solution returned to the storage tank. Doré bars are produced from the resulting
sludge; they have a nominal composition of 96.5% gold, 3% silver, and 0.5% other metals. The doré bars are transported by air to
Umicore in São Paulo for refining.
17.1.6
PROCESSING PLANT OPTIMIZATION AND EXPANSION
In 2019, Jacobina commenced an optimization of the processing
plant to stabilize throughput at a sustainable 6,500 tpd (Figure 17-2). Yamana refers to this optimization as the Phase 1 Optimization.
The first phase of the optimization was the installation of an Advanced Process Control system in early 2019. Other components of the
optimization include the installation of two additional gravity concentrators, a new induction kiln, replacement of screens, and new CIP
tanks. The project is scheduled for completion in mid-2020. Jacobina achieved the Phase 1 Optimization objective of 6,500 tpd in the first
quarter of 2020, a full quarter ahead of schedule and without the benefits expected from the installation of all the plant modifications
expected by mid-2020.The flow sheet of the plant upon completion of Phase 1 Optimization is depicted in Figure 17-2.
The PFS studying the Phase 2 Expansion to increase throughput
to 8,500 tpd was completed and is described in Section 24 of this technical report.
115

Figure 17-1: Current process flow sheet
116

Figure 17-2: Phase 1 Optimization
process flow sheet
117
18
PROJECT INFRASTRUCTURE
Jacobina currently operates five mines and has all required
infrastructure necessary for a mining complex, including:
·
Five underground mines: Canavieiras, João Belo, Morro do Cuscuz, Morro de Vento, and Serra do Córrego.
·
A conventional processing plant, with crushers, ball mills, leach tanks and CIP tanks, which produces gold doré.
·
Mine and processing plant infrastructure including office buildings, shops, and equipment.
·
A fully lined tailings storage facility (TSF B2). It consists of a cyclone sand dam constructed following the downstream construction
method and corresponding tailings and reclaim water pumping systems. The current phase (phase IV) has a dam height of 95 m at its highest
point, at an elevation of 605 masl. At the final phase, Phase VII, TSF B2 will have an ultimate dam crest elevation of 640 masl. The TSF
has an ultimate capacity of 27.8 M m3 of slurry tailings and 14 M m3 of
cyclone sand used for construction of the main dam (DAM, 2020a).
·
Water for the processing plant is mainly supplied by water pumped from the mine and by collected water in the tailings impoundment
(94% recirculation).
·
Electric power from the national grid.
·
Mine ventilation fans and ventilation systems.
·
Haulage roads from the mines to the plant.
·
Stockpile areas.
·
Maintenance facilities.
·
Administrative office facilities.
·
Core storage and exploration offices.
·
Security gates and manned security posts at mine entries.
·
Access road network connecting the mine infrastructure to the town site and to public roads.
The current
infrastructure comprising the canteen, maintenance workshop and administrative office facilities is able to support the Phase 2 Expansion
plan. The warehouse would need an expansion to store consumables and spare parts for the additional equipment. The project spans an approximate
strike length of eight kilometres. The mine and processing plant infrastructure are illustrated in Figure 18-1. The TSF designs
and management are described in sections 18.2 and 20.2.2.
118

Figure
18-1: Site layout of mine infrastructure
119
18.1
POWER
Jacobina Mine is connected to the National Electric Grid
through a 138 kV transmission line connected to the Jacobina II electric substation in the City of Jacobina. Power is supplied by COELBA,
an energy distribution company, with an average contracted demand of 15.0 MW at 138 kV. The contracted demand can be exceeded by
up to 5% (to a maximum of 15.75 MW), but power demand in excess of 15.75 MW incurs additional charges. The contract is automatically renewed
each year.
From the main substation at the Jacobina Mine, at 138 kV/13.8
kV, power is supplied to three distribution substations, at 13.8 kV/4.16 kV, which supply the processing plant with electrical power for
crushing and grinding. Electrical transformers, at 4.16 kV/0.44 kV, feed the plant auxiliary loads.
Power distribution to the underground mines is divided
into two areas. The South Mining Complex consists of the João Belo and Morro do Vento mines, and the North Mining Complex consists
of the Canavieiras, Morro do Cuscuz, and Serra do Córrego mines. There are currently 34 underground portable substations in the South
Complex and 31 substations in the North Complex to supply electrical energy to the mine production faces. The portable substations are
rated at 13.8 kV/440 V and designed at 750, 1000 or 1500 kVA.
18.2
TAILINGS DAM DESIGN AND CONSTRUCTION
The tailings
produced at the Jacobina mill are presently stored in a fully lined tailings storage facility, TSF B2, located 2.5 km north of the mineral
processing plant. TSF B2 consists of a cyclone sand dam built following a downstream construction method. TSF B1 is a legacy tailings
facility that has not been in operation since 2012. Figure 18-1 shows the location of both TSFs, B1 and B2.
TSF B2
will be built in seven construction phases. Phase IV construction was completed in 2018 to an elevation of 605 masl and it is currently
in operation. Phase IV impoundment capacity is 4.27 M m3, assuming a 2 m freeboard. Construction
of phase V is planned to start in the second half of 2020. Phase V has a dam elevation of 620 masl. The final phase, Phase VII, has an
ultimate dam elevation of 640 masl, as shown in Figure 18-2. The TSF designs for phases IV and V are summarized in design reports by DAM
Projectos de Engenharia (DAM) (2017 and 2020a). The following paragraphs describe some of the key design characteristics for TSF B2.
The mine’s
Phase 2 expansion design assumes a processing rate of 8,500 tpd and operation until year 2032. TSF B2’s ultimate capacity is of approximately
41.8 M m3 of tailings, including 27.8 M m3 of
slurry fine tailings and 14 M m3 of cyclone sand material used for construction of the embankment
dam. The final storage capacity for TSF B2 will be sufficient to manage the mineral reserves as well as approximately 7 M additional tonnes
of slurry fine tailings, assuming a density of 1.35 t/m3.
120
The TSF B2 dam has an overall downstream slope of approximately
2.5H:1V and upstream slope of 1.8H:1V. The following features improve the drainage and stability of the dam:
·
A rockfill initial embankment dam (compacted to a 95% standard proctor density)
·
Coarse-grained underdrain system
·
Coarse-grained material for erosion protection
·
Construction of a tailings beach extending from the crest of the dam
In addition, the total surface area of TSF B2 is lined
using a 1.5 mm-thick low-density geomembrane to limit potential seepage from the impoundment into the environment. Suitable borrow
material encountered within the TSF impoundment area was used for construction of the fine-grained low permeability bedding layer underlying
the geomembrane liner. Unsuitable materials and overburden soils were removed and stockpiled for use during closure and remediation activities.

Figure
18-2: Cross-section of TSF B2 dam at final elevation
Monitoring instruments installed for performance monitoring
of the cyclone-sand dam and tailings impoundment area include piezometers and survey monuments. Section 20.3 provides more information
on monitoring instrumentation and activities in the tailings area.
The Canadian Dam Association (CDA) ranks dams as structures
of low, significant, high, very high, and extreme consequence based on the potential social, environmental, and economic damage that a
dam failure may cause to the floodplain area located immediately downstream of the facility. Based on the CDA’s consequence classification
guidelines (CDA, 2007), TSF B2 dam is considered of high consequence, as permanent populations are located in the downstream area of the
dam.
The precipitation event considered in the TSF B2 design
is the 1-in-10,000-year 24-hr storm event estimated at 286 mm (DAM, 2020b). The design considers a minimum of 2 m freeboard
121
above
the maximum supernatant pond level for Phase IV up to Phase VII. In addition, an emergency spillway with a flow capacity of 2.8 m3 per
second is installed for each dam raise.
TSF B2 was designed assuming a peak ground acceleration
(PGA) of 0.05 g. For reference, a PGA of 0.025 g corresponds to the 1-in-475-year seismic event in the area (DAM, 2020b).
Such low PGA values are typical of seismically inactive areas.
Foundations conditions in TSF B2 dam area generally consist
of dense residual soils on top of bedrock. All alluvial material encountered at the bottom of the basin was removed during construction
of the initial TSF phases.
Ancillary infrastructures include a service road and diversion
water channels around the entire perimeter of the TSF. These were built as part of the initial construction activities for TSF B2.
18.2.1
TAILINGS DEPOSITION AND RECLAIM WATER SYSTEM
Tailings enter a tailings thickener prior to being pumped
into the system of cyclones located in the TSF area. Coarse tailings from the underflow are used for construction of the tailings dam
while fine tailings are deposited in the TSF impoundment area. Process water from slurry tailings discharged in the TSF impoundment contribute
to the creation of a supernatant pond. Water accumulated in the TSF pond that is not lost to evaporation is reclaimed into the process
plant. On average, water available from the TSF pond represents a significant percentage of the overall water needs of the mineral processing
plant. The remainder of process water supplied to the process plant is pumped from the mine dewatering operations and wells. Tailings
deposition and water reclaim lines to and from the TSF are located within a secondary containment. There is no discharge of tailings or
process water into the environment at Jacobina.
Precipitation and surface water run-off represent a significant
additional volume that needs to be managed in the TSF impoundment area. The region has a net positive precipitation rate (evaporation
< precipitation). To limit the supernatant pond size, the mine installed a system of water canons in 2018 that spray water to increase
the evaporation rates.
122
19
MARKET STUDIES AND CONTRACTS
19.1
MARKETS
The principal commodity at Jacobina, gold, is freely traded
at prices that are widely known, so that prospects for sale of any production are virtually assured. A gold price of US$1,250/oz was used
for mineral reserve estimation as well as for completing the economic analysis outlined in section 22, which ensures the project is cash
flow positive and therefore supports the mineral reserve estimate. The same gold price was also used to complete the economic analyses
on the pre-feasibility study (PFS) on the expansion scenario outlined in section 24 of this technical report.
19.2
CONTRACTS
JMC currently has a collective agreement with the workers
union “Sindicato dos Trabalhadores na Indústria da Extração de Ouro e Metais Preciosos, Ferro, Metais Básicos,
Pedras Preciosas, Semipreciosas, Mármore, Calcário, Pedras e Minerais Não Metálicos de Jacobina- Bahia e Região.”
JMC also has existing contracts for equipment leasing,
equipment operating, ore and waste haulage, material transport, and water trucks.
JMC has contracts for mine and plant consumables including
drilling products and explosives.
Average prices for consumables during 2019 were as follows:
·
Diesel fuel: US$0.76/L
·
Lime: US$0.09/kg
·
Steel balls: US$1.12/kg
·
Cyanide: US$1.96/kg
·
Power: US$56.99/MWh
The qualified person responsible for this section of the
technical report has reviewed the market studies and contracts, the results of the review support the assumptions in the technical report.
The terms, rates or charges for material contracts are within industry norms.
123
20
ENVIRONMENTAL STUDIES, PERMITTING, AND SOCIAL OR COMMUNITY IMPACT
The information presented in this section is based on a
review of available information and documentation, and a discussion held with Atila Almeida Rios, the Environmental Engineer at Jacobina.
No site visit was conducted in support of the preparation of Section 20 of this technical report.
20.1
PROJECT PERMITTING AND AUTHORIZATIONS
The operation activities at Jacobina are regulated and
inspected by Instituto do Meio Ambiente e Recursos Hídricos (INEMA), the environmental agency for the state of Bahia. All environmental
issues related to Jacobina activities, both internal (environmental management, execution of environmental controls, attendance to environmental
monitoring), and external (relationship with public agencies, environmental agency, renewal of licences), are supervised by the Technical
Environmental Guarantee Commission (Comissão Técnica de Garantia Ambiental — CTGA), according to the requirements of the
State Environmental Council of Bahia (Conselho Estadual de Meio Ambiente da Bahia — CEPRAM).
The Jacobina mine site includes the following facilities:
·
Processing plant
·
Water dam
·
Tailings dam
·
Administrative facilities
·
Maintenance facilities
·
Underground mining and stockpile areas
·
Internal accesses — unpaved roads
·
Concrete batching plant
·
Fuelling stations (diesel)
·
Water and wastewater treatment plants
·
Inactive open pit/waste rock dump (legacy from previous mine operations)
Licences required by various government agencies covering
the operation of the mines, mill, and TSF B2 have been obtained and applications for renewals have been filed. The information on operational
licences and water permits presented below was taken from the PFS by Ausenco (2020).
Jacobina
has two operational licences, one for underground mining (Operational License (L.O 1791/11)) and another for the processing plant and
TSF (Operational License (L.O. 14.100/11)). The quantities and rates permitted by these licences are summarized in Table 20-1.
124
Table
20-1: Summary of environmental operational licences
Operational
Licence |
|
Activity |
|
Permitted
Quantity/Rate |
|
Date of Issue |
|
Valid Until* |
| |
|
Processing plant |
|
7,500 tpd |
|
|
|
|
| L.O. 14.100/11 |
|
Stockpile area |
|
15,000 t |
|
January 30, 2011 |
|
January 30, 2016 |
| |
|
TSF |
|
23,938,000 m3 |
|
|
|
|
| L.O. 1791/11 |
|
Underground mining |
|
2,500,000 tpy |
|
December 28, 2011 |
|
December 28, 2016 |
* Because the requests for revalidations were submitted
more than 120 days before the expiration dates, both of the licences remain valid until the process is analyzed and completed by INEMA.
Yamana has commenced a process to renew and change these
operational licences through the INEMA. Yamana met with INEMA in Salvador at the end of 2019 to present the Phase 2 Expansion. INEMA recommended
that Jacobina should apply for a change licence for Operational Licence (L.O. 14.100/11) (i.e., Change Licence (L.O. 14.100/11)) because
the renewal of the Operational Licence (L.O.14.100/11) is still in progress. On the week of March 9, 2020, INEMA visited the
Jacobina mine site. Presentations were given on the processing plant, TSF, and environment, highlighting the changes to the operation
that had occurred between 2015 and 2019.
Changes since 2015 are being reviewed by INEMA and include
the following:
·
Installation of a new gravimetric concentrator and hydrocylones
·
Renovation of the gold refinery
·
Installation of a concrete batching plant
·
Operation of the hydraulic barrier downstream of TSF B2
·
Increase of the stockpile area capacity from 15,000 t to 40,000 t
·
Closure of João Belo waste dump
Yamana is applying for the following inclusions in Change
Licence (L.O 14.100/11) (Process number 2020.001.001035/INEMA/LIC-01035):
·
Increase of the processing plant throughput to 8,500 t per calendar day, with a maximum throughput of up to 10,000 t per operating
day.
·
Increase of the stockpile area capacity from 40,000 t to over 80,000 t.
·
Decrease of the environmental free board of TSF B2 from 3 m to 2 m.
·
Installation of a new ball mill, silo, electrowinning cell, and area for preparation of cyanide briquettes.
·
Improvements to the tailings pumping system with new tanks, pumps, and cover of the entire pipeline.
125
·
Construction of a new waste dump area and emulsion plant.
Yamana expects INEMA to request updates of the documents,
to schedule presentations in Salvador regarding the João Belo Waste Dump Closure project and the final TSF B2, and to provide details
of each phase. In parallel, the report for the Phase 2 Expansion will be submitted and another visit will be scheduled by INEMA. Yamana
expects the renewal of the processing Operational Licence (L.O. 14.100/11) to be issued by the end of 2020 and the Change Licence (L.O.
14.100/11) to be issued in 2021. The renewal process of the mining Operational Licence (L.O. 1791/11) will be processed in parallel and
is expected to be completed soon after.
A summary
of water permits is provided in Table 20-2.
Table
20-2: Summary of water permits
Ordinance Granting
Water Use |
|
Object |
|
Authorized
Flow Rate
(m3/day) |
|
Issue Date |
|
Expiry Date |
| 15.752/2018 Freshwater withdrawal |
|
Authorizes freshwater withdrawal in the Itapicurú River watershed, from an existing dam, (Cuia) authorized through Ordinance No. 219/04 |
|
2,125 |
|
March 14, 2018 |
|
March 14, 2022 |
| 18.678/2018 Mine water discharge |
|
Authorizes the discharge of effluent into the Itapicurú River watershed, on the “Sem Nome” River |
|
7,200 |
|
July 16, 2019 |
|
July 16, 2023 |
| Discharge grant exemption process water discharge (TSF) 2016.001.000691/ INEMA/LIC-00691 |
|
Exempts the discharge of effluent into the Itapicurú River watershed, on the Itapicurú Mirim River |
|
3,840 |
|
February 9, 2017 |
|
February 09, 2052 (35 years) |
20.2
ENVIRONMENTAL MANAGEMENT
20.2.1
ENVIRONMENTAL MANAGEMENT SYSTEM
Yamana has implemented an integrated management system
covering health, safety, environment, and community through internationally accredited systems that include the ISO 14001 Environment
Management System, the OSHAS 18001 Occupational Health and Safety Management System, and the International Cyanide Management Code.
Jacobina is certified under ISO 14001 and for the International
Cyanide Management Code. Jacobina has implemented the Yamana Management System (SYG for its acronym in Portuguese) to establish the organization’s
policies and objectives. This system supports the management of environmental and occupational health and safety policies, social responsibility,
and community relations; it also helps manage proposed objectives and meet stakeholder needs, expectations, and requirements. A risk assessment
matrix was developed for the Jacobina mine operation by integrating risk matrices for ISO 14001:2015 and OHSAS
126
18001:2007. An operational process standard was developed
for the management of hazardous and non-hazardous solid waste (POP-04-02-3.5-039).
Yamana’s 2016 integrated Health, Safety, Environment,
and Community (HSEC) framework (2016 HSEC Framework) represents the company’s approach to health & safety, environmental
management, and social risk management. Its purpose is to help develop a common understanding across Yamana’s operations of its general
approach to HSEC management and how to achieve its vision. Yamana acknowledges that every operation is at a unique stage of development
and situated in unique socio-political and legal contexts. Accordingly, the management framework specifically targets the following goals:
·
Outline industry best practices for HSEC management.
·
Guide the development of new tools, processes, procedures, policies and/or standards, whether they are developed at the site or
at the corporate level.
·
Assist operations in any evaluations or self-evaluations of their current state of practice.
·
Improve the overall integration of HSEC into the operations.
Yamana has strict health and safety procedures that are
applied in every operating unit, working on the prevention of accidents through the implementation of best practices. Yamana’s safety
standards provide safe working conditions for its staff and its contractors.
20.2.2
TAILINGS MANAGEMENT, MONITORING, AND WATER MANAGEMENT
Yamana prioritizes the management of tailings and it is
currently in the process of aligning the company’s tailings management system with best practices proposed by the Mining Association
of Canada (MAC), Canadian Dam Association (CDA) guidelines, and other international standards, including technical guidance provided by
the International Committee of Large Dams (ICOLD). Yamana currently has a dedicated Corporate Director whose sole responsibility is the
governance of the tailings management system and to provide technical guidance and support to ensure compliance.
Since 2017, Yamana has implemented a tailings management
system known as SYGBAR. The system is built on a six-point management system that focuses on the following protocols:
·
Standards for design and construction, and the use of design reviews
·
Constant TSF monitoring and site-specific key performance indicators for development and performance management
·
Periodic safety inspection
·
Documentation and monthly reporting
·
Training and continuous improvement
127
·
Emergency response plans with dam failure analysis
As a member of the MAC, Yamana will be assessing its current
tailings management systems with respect to the tailings framework proposed in MAC (2019). MAC’s tailings management systems and
guidelines have been adopted by mining associations in Canada, Argentina, and Brazil in recent years. The MAC systems include the completion
of a Dam Safety Review (DSR) that follows the guidelines and recommendations provided in CDA dam safety guidelines (CDA, 2007) and its
corresponding mining bulletin.
The tailings produced at the Jacobina mill are presently
stored in a fully-lined facility, TSF B2. TSF B1 is a legacy tailings facility that has not been in operation since 2012. TSF B1is currently
being rehabilitated according to the Recovery Plan Report (PRAD) and INEMA standards, which include the installation of closure cover
in the impoundment area (~50% completion) and the placement of a revegetation layer.
Both TSF B1 and TSF B2 are monitored on an ongoing basis
for seepage and physical stability conditions. Monitoring includes collecting data on phreatic surface levels in the dams and potential
signs of deformation or other physical instabilities. Monitoring instrumentation includes a network of piezometers and survey monuments
installed in the B1 and B2 dams. Volumes of deposited tailings, grain size distribution and density of the tailings, and impoundment water
levels and volumes are also recorded for TSF B2 on a regular basis.
In addition, the Jacobina tailings area is covered by an
extensive environmental monitoring program; this consists of 21 surface water stations, 60 groundwater monitoring points, as well as the
monitoring of effluent, sediment, air quality (dust fallout), noise, and weather. INEMA approved a project proposed by Yamana to collect
sulphate emanating from the old TSF B1. The project was fully implemented by November 2017; it consists of a system of groundwater
interception wells installed downstream of TSF B2, immediately upstream of the Itapicurú River, designed to intercept the sulphate
plume from TSF B1. Monitoring in 2018 has shown a reduction in sulphate at downstream locations. In addition, metals potentially associated
with TSF B1’s water quality, such as lead, copper, and zinc, are now also being intercepted (MDGEO, 2018). Recommendations from MDGEO
Servicos de Hidrogeologia Ltda. (MDGEO) included the installation of additional monitoring wells to better assess the system’s performance.
As part of the mine’s tailings management system,
Jacobina completed several independent expert reviews for TSF B2 in recent years; these include a review in 2017 and 2018 performed by
a renowned international expert, Mr. Steven Vick. The review process includes an assessment of the design, stability, construction,
and operation of the tailings facility. Mr. Vick’s assessment (Vick, 2018) concluded that there were no significant weaknesses
nor discrepancies from international best practices.
128
More recent
dam inspections of TSF B2 were completed by local engineering experts, including GeoHydroTech in 2019 and DAM Projetos de Engenharia (DAM)
in 2020. DAM is the design firm responsible for the design of TSF B2. Both Dam Safety Inspections of TSF B2 concluded that the facility
is in good condition, the instrumentation system in place is adequate, and the dam is stable and meets the recommended safety standards.
GeoHydroTech provided additional recommendations on maintenance
and potential improvements, including completion of an assessment of the tailings materials characteristics in the dam, improved maintenance
of the surface water diversion system, and cleaning of seepage water collection system at the toe of the dam. Similar recommendations
for additional maintenance of the seepage collection system at the dam’s toe and maintenance of surface water diversion system
in the abutments areas were provided by DAM. In addition, DAM observed the need to drain water accumulating behind the geomembrane liner
in the southern portion of the impoundment in TSF B2 at the toe of TSF B1. The mine is progressively working towards addressing these
recommendations: the water behind the liner in TSF B2 was pumped and erosion gullies were repaired.
Finally, the current closure plan for TSF B2 is presently
at a conceptual level. The existing closure plan needs to be further developed, including preparation of more detailed closure design
to confirm the feasibility of the existing conceptual closure plan approved by the regional authority (ANM), including budgets, and implementation
schedules. The mine closure plan needs to also consider a plan for the long-term management of sulphate/metals in water collected from
TSF B1.
20.2.3
WATER MANAGEMENT
Water management is a primary focus at Jacobina and has
two main goals: (i) to minimize freshwater consumption at all times, including during drought conditions, and (ii) to intercept
and treat contact water and site effluent. Water management also includes the interception of a sulphate/metals plume emanating from TSF
B1 to minimize downstream effects from the Jacobina mine operation on the Itapicurú River.
According
to verbal communication between SLR and Yamana, no acid rock drainage (ARD) and metal leaching (ML) issues associated with the active
operating facilities have been identified. The waste rock extracted from underground mining is used for underground backfill and for dam
construction when required. ARD/ML management is required for legacy mine facilities located at the Jacobina mine site. The water quality
of concern is collected from the TSF B1 and the João Belo stockpile, both inactive facilities.
The freshwater used for ore processing is collected in
the Cuia dam reservoir located in the river of the same name, approximately 1.5 km from the industrial area. The water collected in the
reservoir is clarified prior to being used in the metallurgical process. A portion of the water collected in this reservoir is conveyed
to a potable water treatment plant for domestic use and drinking water supply.
129
The Phase 2 Expansion plan will not require increased consumption
of freshwater from the Cuia dam reservoir. There will only be an increase in volume of process water pumped from the TSF B2 tailings pond
(Hace, 2019).
The water used in underground mine operations is first
pumped into sumps and from there to a water treatment tank where the pH is adjusted to the desired level using caustic soda. All the mine
water is pumped back to the underground operations.
The Phase 2 Expansion involves the development of a waste
rock stockpile; drainage collection channels will be installed to intercept surface runoff and convey it appropriately for use in mine
operation activities.
TSF B1, no longer in operation, has no tailings pond as
is being rehabilitated. TSF B2 is lined with a geomembrane which reduces water infiltration to the groundwater environment. Diversion
channels around the TSFs minimize the catchment area that contributes surface runoff from precipitation. A total of four evaporators reduce
the water inventory in the tailings pond, thus preventing the need to discharge excess water to the environment. The percolated solution
of TSF B1 and seepage from TSF B2 are pumped to the tailings pond of the active TSF. Water collected in this tailings pond is recirculated
and reused in the industrial process.
TSF B2 is equipped with an emergency overflow structure
designed to safely convey the 1-in-10,000-year runoff event while maintaining a minimum freeboard from the dam crest to prevent dam overtopping.
Operation requirements of the TSF B2 tailings pond include maintaining the storage availability between the maximum operating water level
elevation and the invert elevation of the emergency overflow structure. The purpose of this storage allowance is to manage runoff resulting
from extreme storm events without activating the emergency overflow. Operation of TSF B2 is currently planned to continue until year 2032.
The water management system of Jacobina has been designed
as a closed circuit, where water collected in the tailings pond is either used in the industrial process (or other activities such as
dust suppression) without discharge of water to the environment. However, as a contingency, an effluent treatment system located in the
TSF area is intended to treat the supernatant solution stored in the tailings pond. The water treatment system involves use of flocculant
and aluminum sulphate solution, oxidation tanks, use of sodium hypochlorite, carbon columns and addition of hydrogen peroxide to destroy
remaining cyanide in the effluent in case excess water has to be discharged to the environment (SETE, 2018).
The TSF B1, built in the 1980s, is not lined with geomembrane
to reduce water infiltration. In November 2017, with approval from INEMA, a system of groundwater interception wells was put
into operation downstream of TSF B2 and upstream of the Itapicurú River; with the purpose of intercepting the sulphate plume from
TSF B1 in an effort to reduce sulphate concentrations downstream of the TSF dam. The intercepted water is pumped back to the TSF B2 tailings
pond. In addition to the sulphate, other metals such as lead, copper, and zinc, potentially
130
associated
with the tailings, are being intercepted. Monitoring in 2018 showed a reduction in sulphate at downstream locations after the system was
implemented (RPA, 2019). Following a performance assessment in 2018, recommendations were made to include additional monitoring wells
to improve the assessment, and to carry out a study to evaluate the installation of additional interception wells in some areas of the
current system to improve collection of the plume (RPA, 2019).
During operations, the collected water is recirculated
and used for mine operation activities; however, another plan for sulphate/metals management will be required post-closure. It is anticipated
that during the closure and post-closure phases the water collected in the TSF B2 tailings pond will have to be treated prior to discharge
to the environment to comply with national environmental legislation on water quality (SETE, 2018).
The sewage treatment plant receives and treats the sanitary
effluent from the plant area and the support facilities.
Of note,
the water from the waste rock stockpile of the former João Belo Mine is acidic. In 2019, a water collection pond was built
downstream of the stockpile to collect runoff from the João Belo stockpile and prevent the water from draining to the Cuia River.
The water is now pumped to the recirculation circuit of the Jacobina operation for use in the process. Furthermore, pilot-scale studies
have been carried out for effluent water treatment of the João Belo stockpile at closure (SETE, 2018). The bench/pilot-scale studies
conclude that the best alternative for full-scale treatment will be a passive treatment system.
A site-wide water balance has been developed to mitigate
the risk to water supply due to drought as well as the risk of excess water to the operation. Recently and in response to drought conditions,
Jacobina has been successful at reducing freshwater consumption.
The environmental unit of Jacobina carried out an Operational
Excellence project in 2019. As part of this project, the operation’s tracking of water balance was automated. The main objective
was to integrate the automation systems of the mine and plant in the PI software, a database program used by the environmental unit for
online monitoring of the main flows between the different areas of the operation.
20.3
ENVIRONMENTAL MONITORING
To comply with environmental legislation and applicable
standards, the Jacobina Mine carries out environmental monitoring in the areas influenced by the operation. The monitoring is carried
out by an internal technical team, trained and qualified for execution and evaluation of the monitoring program, as well as externally
by third parties contracted for each type of monitoring. Where applicable, accreditation of methods according to INMETRO/ABNT NBR ISO/IEC
17025 is requested from the external companies (Yamana, 2020).
131
The environmental monitoring program at Jacobina is extensive;
it relies on 24 surface water stations, 18 effluent stations (including industrial, mine and sanitary), 52 groundwater wells, 8 sediment
stations, 3 potable water stations, as well as monitoring of air quality (dust fallout), noise, and weather.
Monitoring
of fauna and flora has not been a condition to current and previous operation licences, but will be a condition in subsequent operation
licences. In a proactive approach, Jacobina initiated a monitoring program for fauna and flora with the completion of an initial inventory
in March 2020. A work plan has been developed for implementation of the monitoring program moving forward.
An operational process standard has been developed for
surface water, groundwater, and liquid effluent monitoring (POP-04-02-4.1-170). Water quality compliance is evaluated with reference to
the following documents:
·
CONAMA Resolution 357/2005 - Surface waters
·
CONAMA Resolution 430/2011 - Effluents (Industrial, Mine and Sanitary)
·
CONAMA Resolutions 420/2009 and 396/2008 - Groundwater
·
CONAMA Resolution 454/2012 - Sediments
·
PRC 5/2017 of the Ministry of Health - Potability
·
International Cyanide Code - CIC3
CONAMA (Conselho Nacional do Meio Ambiente) is the National
Environmental Council.
Water quality samples are analyzed in the Jacobina site
laboratory for a suite of parameters that include alkalinity, pH, free cyanide, WAD cyanide, total cyanide, chloride, free residual chlorine,
total coliforms (P/A), conductivity, colour, biochemical oxygen demand (BOD), chemical oxygen demand (COD), hardness, Escherichia coli
(P/A), dissolved iron, ammoniacal nitrogen, oils and greases, dissolved oxygen (DO), total cadmium, total lead, total zinc, total dissolved
solids (TDS), total suspended solids (TSS), sedimentable solids (SS), sulphate, temperature, and turbidity. In October 2019, Jacobina
contracted Corplab Environmental Analytical Services, an accredited external laboratory affiliated with ALS, to analyze samples for an
expanded suite of water quality parameters.
Determining the background groundwater quality concentrations
that can serve as a reference to identify environmental impacts for the area is a complex task. Many parameters, such as antimony, arsenic,
iron, lead, and manganese can occur naturally in concentrations above reference thresholds adopted for groundwater in mineralized areas.
Historical high concentrations of anionic compounds and metals in the area downstream of TSF B1 are indicative of its influence on groundwater.
Likewise, the influence of mining activities on groundwater is noticed in the processing area and João Belo area, where the water
quality samples can present higher concentrations of some parameters than in areas located upstream.
132
In compliance with conditions established in the operating
licences, annual environmental assurance technical reports are submitted to INEMA in March of every year, in addition to other submissions
of monitoring results that take place throughout the year. The latest Environmental Assurance Technical Report summarizes reporting for
2019 (Yamana, 2020). Environmental monitoring is summarized in section 6 of the document, with the following supporting technical reports
included as appendices:
·
Water (surface water, groundwater, effluents, treated water [potable], water balance, meteorological and river monitoring, groundwater
interception wells).
·
Air quality and atmospheric emissions
·
Noise
According to verbal communication between SLR and Yamana,
no non-compliance issues have been raised by INEMA.
Surface water exceedances were consistently detected in
2019 for one parameter: dissolved iron. However, Yamana indicates that the exceedance is characteristic of the regional background and
that the groundwater is not being used. Occasional exceedances in a small number of samples at some locations were also detected for BOD,
ammoniacal nitrogen, TDS, total sulphate, turbidity, total lead, and total zinc. Results for pH values show a typical range from 6 to
9.
Groundwater exceedances were detected in 2019 for cadmium
(one location), lead, and dissolved iron. Groundwater exceedances were detected in 2019 for chloride, TDS, and sulphate. Results for pH
values show a typical range from 3.5 to 8 at most groundwater wells.
The water levels in the groundwater interception wells
downstream of TSF B2 initially showed significant oscillation, but a decreasing trend in the water levels was observed in 2019.
A summary of licences and conditions is provided in section
7 of the annual environmental assurance technical report (Yamana, 2020), with compliance reports included as appendices G to Q:
·
Status of Environmental Licences for Operation
·
Status of Water Use Grants
·
Status of Authorization for Suppression of Native Vegetation
·
Conditions Ordinance IMA 14,100 — Industrial Plant and TSF
·
Conditions Ordinance INEMA 1791/2011 — Mine Operation
20.4
ENVIRONMENTAL STATUS
The main programs undertaken by Jacobina to cover various
environmental aspects in and around the mine complex are as follows:
133
·
Environmental Complex Project. Aims to integrate environmental practices and sustainability concepts through reactivation
of the sewage treatment station plant, implementation of temporary residue deposit program, implementation of composting unit, construction
of tree nursery, and construction of environmental education center.
·
Solid Residue Management Program. Aims at managing solid residues by the identification, collection, and disposal of selected
residues to licensed recipients and by conducting experimental research and analytical work. Includes identification of requirements,
and of licensed recipients as well as periodic revisions.
·
Degraded Areas Recovery Plan. Mapping of the degraded areas, studies of fauna and flora interaction, definition of recovery
methodology, chronogram of activities, and presentation to environmental authorities.
·
Water Balance and Water Use Program. A comprehensive site-wide water balance has been developed with support of external
consultants in order to mitigate the risk of both drought and excess water to the operation. Recently, and in response to drought conditions,
Jacobina has been successful at reducing freshwater consumption.
·
Environmental Control and Monitoring Plan. Monitoring of the TSF dams and acid rock drainage. Establishment of methods to
monitor the impact and frequency of operation activities on surface water, groundwater, ambient noise, and air emissions (dust, gases,
“black smoke”). Monitoring of flora and fauna was initiated in the first quarter of 2020.
·
Other environmental initiatives such as environmental education and environmental emergency brigade.
20.5
COMMUNITY RELATIONS
20.5.1
GENERAL CONTEXT
The two closest communities to the Jacobina mine site include
Jacobina (with an approximate population of 79,000) and the small town of Itapicurú (with an approximate population of 36,000). The
Jacobina Mine is located within the Serra de Jacobina mountains, where gold mining has taken place since the late 17th Century.
Jacobina is one of the poorest towns in Bahia State. Most
of the economic activity is centered around livestock, the service industry, manufacturing, and mining. Due to the semi-arid climate,
the conditions are not ideal for agricultural activity beyond subsistence agriculture and most produce does not make it to market.
134
In comparison to other settlement areas in Bahia State,
Jacobina is relatively more traditional and less developed. It has a relatively high unemployment rate as compared to the rest of Brazil,
although the rate is slightly lower than observed across Bahia State. Household incomes in Jacobina are also lower than average in Brazil
and also lower than the average for Bahia State. Jobs related to mineral extraction in Jacobina comprise about 9% of formal jobs, although
wages from mining account for 1/5 of the total in the municipality.
This section
presents the results of the social review that was based on available documentation for Yamana’s JMC operations and compared
to relevant International Finance Corporation (IFC) Performance Standards (PS). This social review does not represent a detailed audit
of Yamana’s compliance with the IFC Performance Standards. Yamana’s social performance at Jacobina is benchmarked against the
following IFC 2012 PS:
PS1:
Social and Environmental Assessment and Management Systems requires that companies identify, assess, and mitigate the social
and environmental impacts and risks they generate throughout the lifecycle of their projects and operations. From a social perspective,
the requirement includes: a comprehensive social assessment; identification of critical social impacts and risks; community consultation
and engagement; information disclosure; mitigation plans to address impacts and risks; and development of an organizational structure
with qualified staff and budgets to manage the overall social management system.
PS2:
Labour and Working Conditions incorporates the International Labour Organization conventions that seek to protect workers’
basic rights and promote effective worker/management relations.
PS4:
Community Health and Safety declares the project’s duty to avoid or minimize risks and impacts to community health and
safety, and addresses priorities and measures to avoid and mitigate project-related impacts and risks that might generate community exposure
to risks of accidents and diseases.
PS5:
Land Acquisition and Involuntary Resettlement considers the need for land acquisition or involuntary resettlement of any individual,
family or group; including the potential for economic displacement.
PS7:
Indigenous Peoples considers the presence of Indigenous groups, communities, or lands in the area that may be directly or indirectly
affected by projects or operations.
PS8:
Cultural Heritage. This standard is based on the Convention on the Protection of the World Cultural and Natural Heritage.
The objectives are to preserve and protect irreplaceable cultural heritage during a project’s operations, whether or not it is legally
protected or previously disturbed and promote the equitable sharing of benefits from the use of cultural heritage in business activities.
135
PS3
Resource Efficiency and Pollution Prevention and PS6 Biodiversity Conservation are not included in this list for social
performance as they correspond to environmental performance standards.
20.5.2
PS1: SOCIAL AND ENVIRONMENTAL ASSESSMENT AND MANAGEMENT SYSTEMS
Yamana uses its corporate Integrated Health, Safety, Environment,
and Community (HSEC) Framework (2016) to serve as guidance across operations to achieve the following objectives:
·
Outline industry best practices for HSEC management
·
Guide the development of new tools, processes, procedures, policies and/or standards
·
Assist operations in any evaluations or self-evaluations or their current state of practice
·
Improve the overall integration of HSEC into the operations
The HSEC
Framework includes guidance for (i) Health and Safety, (ii) Environmental Management and (iii) Social Risk Management.
Of relevance to this report and this section is the guidance for Social Risk Management, which includes the components listed in Table
20-3.
Table
20-3: Social risk management element of Yamana’s 2016 HSEC Framework
| Category |
|
Management Elements |
|
Stakeholder
Engagement |
|
Stakeholder Identification and Analysis (mapping) |
| |
Stakeholder Engagement |
| |
Identification of Issues |
| |
Feedback Management |
| Impact Management |
|
Impact Identification |
| |
Impact Management |
| |
Community Baseline Information Tracking |
| |
Plans for Closure |
| Benefit Management |
|
Expectation Management |
| |
Local Employment and Procurement |
| |
Community Investment |
The 2016 HSEC Framework provides guidance to Yamana and
its operations regarding the collection of information on relevant stakeholders, assessment of potential impacts, and development of mitigation
measures.
In concordance with these guidance documents, Yamana has
been tracking stakeholder issues and risks related to Jacobina and tries to communicate project activities and other programs to stakeholders
and members of the public on an ongoing basis. Based on the available information, it is evident that at Jacobina, stakeholder outreach,
communication, and monitoring is conducted, and complaints and feedback are also collected and reported on. However, at the
136
time of preparing this technical report, the details on
the collection methods and specific complaints and how they were resolved were not available.
In 2019, the number of external complaints for Jacobina
doubled that of the previous year. Most of these complains were related to housing construction and noise, though noise and dust emissions
were all within the regulated limits. Details on the complaints database were not available at the time of preparing this technical report,
although it is clear that each complaint is considered and tabulated in Yamana’s review process.
Jacobina holds a number of environmental certifications
which are relevant to the social environment including:
·
ISO 14001:2015, a tool to help companies identify, prioritize, and manage environmental risks.
·
OHAS 18001:2007, consisting of a series of British Standards for guidance on the formation of an Occupational Safety and Health
Management Certification System.
Regular audits and reports on social performance are conducted
for Jacobina and recommendations are made to improve communications and performance based on the audit findings.
Yamana made the corporate commitment to adopt the Social
Licence to Operate (SLO) Index in order to inform the company on how to improve its operations and its current risk level. In 2017, Yamana
began to conduct a series of surveys and outreach throughout the year at each of its sites, including Jacobina. The surveys are administered
through in-person interviews as well as short mobile-based surveys. The survey results help to inform Yamana on the overall level of trust
and acceptance by the community and details on how to improve. Data can also be reviewed by location and neighborhood to help with targeted
engagement strategies.
The 2017 and 2018 SLO Index scores were relatively strong
for Jacobina using the scale developed by the implementing partner - CSIRO (the Commonwealth Scientific and Industrial Research Organization).
Yamana reported that in 2019 at Jacobina, community trust in the mine operation is high, with some concerns regarding noise and dust,
but with results demonstrating a continuous improvement over the two-year period. These survey results indicated that there was potential
for Yamana to increase its engagement with the local community through more frequent outreach and communications.
At the time of preparing this technical report, a detailed
social impact assessment for the Jacobina mine operation was not available. However, the impact assessment findings for the eventual mine
closure were available (SETE, 2018). This document included an assessment of the mine closure on the local economy, workforce, communities,
and provided recommended mitigation measures to help transition workers to new jobs.
137
20.5.3
PS2: LABOUR AND WORKING CONDITIONS
Workers at Jacobina are registered and fall under a collective
bargaining agreement which was signed in 2019. Some examples of worker benefits include (but are not limited to):
·
Christmas basket
·
Overtime
·
Compensation for dangerous activities
·
Retirement bonus
·
Profit sharing
·
Food and meal cards
·
Tuition aid for employees
·
Educational supplements for employees and families
·
Health plan
·
Dental plan
·
Life insurance
·
Childcare benefits
·
Holiday benefits
Jacobina has a large share of local employment with approximately
90% of workers coming from the local community. Approximately 6% are from the wider region and 4 % are sourced nationally.
A number
of guidance documents provide the framework for health and safety measures at Jacobina. At a corporate level, Yamana relies on its 2016
HSEC Framework which acts as a guidance document for all its operations. Of relevance to this technical report and this section is the
guidance for Health and Safety, which includes the components listed in Table 20-4.
Table
20-4: Health and safety management element of Yamana’s 2016 HSEC Framework
| Category |
|
Management Elements |
| Leadership |
|
Positive Recognition |
| |
Leadership Training |
| Risk and Hazard Management |
|
Hazard Identification |
| |
Job Hazard Analysis |
| |
Field Level Risk Assessment |
| |
Employee Reporting and At-Risk Behaviour |
| |
Standard Operating Procedures |
| |
Hazardous Materials |
| |
Safety Design Reviews |
| Health, Hygiene and Medical |
|
Health and Hygiene |
| |
Medical |
| |
Drug and Alcohol |
138
The 2016 HSEC Framework provides guidance to Yamana and
its operations to inform the development of site-specific health and safety procedures and on how to improve operations based on monitoring
and health and safety performance.
As stated above, Jacobina holds an environmental certification
which is relevant to worker health and safety. OHAS 18001:2007, consists of a series of British standards for guidance on the formation
of an Occupational Safety and Health Management Certification System.
In 2018,
Jacobina initiated an action plan to reduce accidents, with participation from both workers and management at the mine site. The
plan was implemented in 2019 with the following principal goals:
·
Identify higher-risk activities and procedures
·
Schedule workplace safety audits
·
Provide training with visible leadership
·
Perform workplace safety audits
·
Provide leadership examples of health and safety behaviour
·
Update Standard Operating Procedures
·
Strengthen visible leadership
Regular audits and reports on worker health and safety
are conducted for Jacobina and recommendations are made to improve performance based on the audit findings. Recent audit reports for 2019
report on a number of safety performance indicators including the following:
·
Frequency of accidents with injury
·
Severity and frequency of accidents with and without loss of time
·
Accidents by type and company
The findings of the 2019 report indicate that most incidents
were related to contractors as opposed to direct employees, resulting in recommendations to improve communications with contracted companies
on health and safety measures. Jacobina maintains a tool to collect and monitor health and safety issues, and employees are encouraged
to participate and fully consult in health and safety monitoring and meetings.
The environmental impact assessment on the effects of the
future Jacobina closure (SETE, 2018) provides a summary of the potential effects on the local economy. The findings indicate that while
the local economy is diversified and the overall effects are expected to be minimal and mitigation measures will help to provide additional
training and support to workers in their transition to new employment.
20.5.4
PS4: COMMUNITY HEALTH AND SAFETY
Yamana has made a number of commitments to community well-being,
health, and safety at Jacobina, including the following:
139
·
Corporate programs with direct investments in the community such as community developments, the “Open Doors” Program
to improve community communications, and the “Integration Program” aimed at improving community quality of life.
·
Arts and Education Programs.
·
Community Strengthening Programs.
JMC provides
updates on these programs to community members through presentations and ongoing discussions with stakeholders. Some of these recent
and specific programs are listed below:
·
Local housing projects and renovations
·
Citizen meetings
·
Seminar for Women Entrepreneurs
·
Jacobina Micareta (Carnival)
·
Walk of Light Cultural Event
·
Actions to combat the sexual exploitation of children and adolescents
·
Environment Week
·
Itapicurú Watershed Committee
·
Volunteer Day at the Fazendinha (little farm) project
·
Storytelling at schools
·
Broadcast of religious service on two local radio stations
This list is only a portion of the social, cultural, educational,
economic, and religious programs supported by Yamana at Jacobina.
20.5.5
PS5: LAND ACQUISITION AND INVOLUNTARY RESETTLEMENT
At the time of preparing this technical report, since there
are no new activities proposed outside of the existing project footprint, there is no new land acquisition or involuntary resettlement.
20.5.6
PS7: INDIGENOUS PEOPLES
Based on available information there are no Indigenous
Peoples residing in or using the project area lands. Therefore, this standard is not relevant to this review.
20.5.7
PS8: CULTURAL HERITAGE
Based on information received from Yamana, the area surrounding
the Jacobina Mine is not known for archaeological resources and no related studies have been completed to date.
At the time of preparing this technical report, there was
no available information on any Chance Find Procedures that might be required, should archaeological evidence be discovered in the future.
140
20.6
MINE CLOSURE
The Jacobina operation involves mining and processing of
gold ore. The mining unit consists of four underground mines (João Belo, Morro do Vento, Canavieiras and Basal) with respective openings
for galleries and ventilation shafts, a metallurgical plant with ore processing facilities, the Cuia dam and reservoir (freshwater), TSF
B1 and TSF B2, administrative and operational support facilities, and haul and access roads. Two additional inactive facilities, an open
pit and a waste rock stockpile from the former João Belo Mine are located at the Jacobina mine site.
The mine
closure plan for Jacobina will be developed in three stages: conceptual plan, basic plan and executive plan, with increased level
of detail as the operation approaches the end of the mine life. The current mine closure plan (SETE, 2018), which corresponds to the conceptual
stage, considers the beginning of mine closure in 2032. It was prepared based on Yamana’s standard procedure PCS-00-00-3.5-015 —
Closing of Mining Activities; these activities are in line with the recommendations of the International Council on Mining and Metals
(ICMM, 2008) according to SETE (2018).
The mining regulatory norm NRM No. 20/2001 establishes
administrative and operational procedures in case of mine closure (definitive cessation), suspension (temporary cessation), and resumption
of mining operations. NRM No. 20/2001 also outlines the content requirements of the mine closure plan.
The mining regulatory norm NRM No. 21/2001 establishes
administrative and operational procedures in case of rehabilitation of mined and impacted areas. According to this norm, rehabilitation
projects must be prepared by legally qualified technicians and submitted to the National Mining Agency (ANM for its acronym in Portuguese)
for evaluation.
The main objective of the conceptual mine closure plan
for Jacobina is to present solutions to be implemented before, during, and after mine closure in order to avoid, eliminate, or minimize
occurrences of long-term environmental liabilities and eventual future obligations for Yamana. The conceptual mine closure plan for Jacobina
considers the following three phases:
·
Pre-closure phase: encompasses a period of 2 years prior to commencement of decommissioning activities and execution of closure
works. Final closure studies will be developed during this phase.
·
Closure phase: encompasses decommissioning activities and execution of closure works for rehabilitation of the mine site area.
·
Post-closure phase: expected minimum duration of 5 years encompassing environmental stabilization, post-closure monitoring and
verification of physical, biological and socioeconomic stability, including maintenance activities. Post-closure monitoring of the tailings
dams is expected to be required for a longer period, estimated to be 10 years.
141
A summary
of the main proposed closure activities is presented in Table 20-5.
Table
20-5: Summary of main closure activities
| |
Mine Component |
|
Closure Activities |
| Mine |
Open pit mine (João Belo) |
|
Removal of equipment and auxiliary infrastructure |
| Construction of perimeter fencing |
| Signage |
| Underground mines |
|
Dismantling and removal of mobile equipment for reuse or sale |
| Dismantling and removal of water management, ventilation, and communication infrastructure |
| De-energization and contaminant removal |
| Installation of reinforced concrete at access points to block access |
| Waste Disposal Facilities |
Waste rock stockpiles |
|
Recontouring of slope, if needed, for physical stability |
| Installation of low-permeability cover to limit infiltration and promote storage and evaporation of surface water runoff |
| Construction of surface drainage system with erosion-protection lining for management of clean surface runoff |
| Revegetation where possible |
| Tailings storage facility |
|
Consolidation and treatment of tailings by removing impounded water |
| Levelling, slope stabilization, and recontouring |
| Installation of low-permeability cover to limit infiltration, induce chemical stabilization, and promote storage and evaporation of surface water runoff |
| Construction of drainage system as part of the cover |
| Reconfiguration of non-contact water diversion channels |
| Removal of equipment and auxiliary infrastructure |
| Revegetation where possible |
| Other Infrastructure |
Process plant
Water management infrastructure
Workshops
Warehouse & auxiliary buildings
Electrical substations
Access and hauling roads
Fuel station
Gallery 7
Environmental complex |
|
Disassembly of electrical, mechanical, and hydraulic systems |
| Topographic regularization for revegetation, in compliance with the Degraded Areas Recovery Plan |
| Adequate disposal of chemical substances, contaminated materials, non-contaminated materials, hazardous waste and non-hazardous waste |
| Dismantling, demolition, salvaging, and disposal of structures; including buried structures when necessary |
| Demolition of masonry building facilities |
| General sanitation and cleaning |
| Removal of equipment |
| Verification of soil quality and removal of contaminated soils if required |
| Scarification of access roads |
| Transportation to authorized disposal or collection areas |
142
| |
Mine Component |
|
Closure Activities |
| |
|
|
Maintenance of Gallery 7 for visitors in partnership with the Ouro Vivo Museum and in association with the Environmental Education Center |
| Keep the environmental Education Center area operational. Seedling Nursery repurposed for cultivation of ornamental plants. Disposable Materials Center repurposed for commercialization of ornamental plants to be produced by the community. |
| Staff Facilities |
Administrative buildings
Potable water and sewage systems |
|
Dismantling and removal of structures and equipment to authorized disposal areas |
| Removal of prefabricated elements |
| Demolition of concrete slabs |
| Recontouring of surface topography for revegetation, in compliance to the PRAD |
| Implementation of natural drainage |
Physical, chemical, hydrological, and biological stability
conditions following closure will be verified through implementation of a post-closure maintenance and monitoring program. Monitoring
should also support the evaluation and verification of compliance with closure activities and targets, and the identification of deviations
leading to the adoption of corrective measures.
The closure and post-closure initiatives and monitoring
programs designed to achieve physical, chemical, biological, and social stability consist of both engineering measures, land revegetation,
as well as socioeconomic measures. The closure initiatives and monitoring programs identified in the conceptual mine closure plan are
as follows:
·
Geochemical monitoring program
·
Geotechnical monitoring program for open pit, waste rock piles, and dam slopes
·
Air emissions and ambient noise control program
·
Solid waste management program
·
Erosive and settlement process control program
·
Degraded areas recovery plan
·
Flora and fauna monitoring program in rehabilitation areas
·
Social communication program
·
Program to promote the creation of an Association of Ornamental Plant Growers
·
Program to promote creation of an Association of Productors and Collectors
·
Labourers demobilization program
·
Social and environmental closure performance monitoring program
It is noted that surface water and groundwater monitoring
locations have not yet been proposed in the current mine closure plan. SLR recommends incorporating a preliminary closure and post-closure
water monitoring program that identifies the future location of stations, the suite of
143
water quality parameters to be sampled and analyzed, and
the reporting procedures and their frequency.
As noted in RPA (2019), the 2018 mine closure plan does
not provide details on the potential requirement for long-term water management and treatment, particularly in regard to the sulphate/metals
plume from TSF B1, which is currently intercepted downstream of TSF B2. Due to the potential for environmental impacts to downstream water
from the existing sulphate/metals plume, long-term closure costs could potentially extend decades beyond closure. SLR recommends that
costs for management of water and for monitoring and maintenance of dams during the post-closure period be reviewed as the closure plan
is developed in more detail.
Table
20-6 lists the current estimate for closure costs as presented in the 2018 mine closure plan (SETE, 2018), using an exchange rate
of 4.00 BRL:USD (Brazilian real to US dollar).
Table
20-6 Total estimated costs for mining reclamation and closure (from 2018 mine closure plan)
| Activity |
|
Cost |
|
Cost |
|
| |
|
(R$) |
|
(US$) |
|
| Future closure planning studies |
|
969,000 |
|
242,250 |
|
| Monitor, pump and treat groundwater - 60 months |
|
2,162,000 |
|
540,500 |
|
| Demolition, waste management, underground mine |
|
44,302,000 |
|
11,075,500 |
|
| Air and noise monitoring |
|
544,000 |
|
136,000 |
|
| Geotechnical monitoring |
|
3,451,000 |
|
862,750 |
|
| Revegetation, contaminated soil, contouring, fencing |
|
76,508,000 |
|
19,127,000 |
|
| Fauna monitoring |
|
920,000 |
|
230,000 |
|
| Environmental programs |
|
10,200,000 |
|
2,550,000 |
|
| 20% contingency |
|
27,811,000 |
|
6,952,750 |
|
| Total |
|
166,867,000 |
|
41,716,750 |
|
20.7
SLR COMMENTS
No environmental issues were identified from the documentation
available for review that could materially impact the ability to extract the mineral resources and mineral reserves. Jacobina has the
operational licences required for operation according to the national legislation. The approved licences address the authority’s
requirements for mining extraction and operation activities. For expired licences in the process of being renewed, they remain valid until
the revalidation process is completed by INEMA. In compliance with conditions established in the operating licences, annual environmental
assurance technical reports are submitted to the authorities.
144
An environmental monitoring program is in place at Jacobina
for weather, surface water quality, groundwater quality, air quality and emissions, and ambient noise. Monitoring of flora and fauna was
initiated in the first quarter of 2020.
ARD/ML associated with TSF B1 and the João Belo stockpile
(inactive facilities), are managed through ponds and groundwater interceptor wells located downstream of the facilities. Water quality
is monitored by Yamana at various locations downstream. Yamana is planning to install additional groundwater monitoring wells in the TSF
areas. TSF B1 is being rehabilitated.
The water management system implemented at Jacobina appears
to be sound and follows common practices applicable for the protection of the environment.
The ore processing system was designed to maximize the
recirculation of process water and minimize the requirement for freshwater. The mine water is pumped back to the underground operations.
The water collected in the active TSF B2 is recirculated to the process plant. Freshwater required for ore processing is supplied from
a reservoir built in the Cuia River. There is no discharge of industrial water to the environment. The site-wide water balance mitigates
the risk to water supply due to drought as well as the risk of excess water to the operation.
Yamana has implemented an integrated management system
covering health, safety, environment, and community through internationally accredited systems.
A conceptual mine closure plan was developed in 2018 for
the mine components that includes a closure cost estimate. The latest version was completed in December 2018. With the potential
for impacts to water from ARD/ML, and an existing sulphate/metals plume collection system, there could be long-term water management and
treatment requirements post-closure. Long term closure costs could potentially extend several years beyond closure.
No known social issues were identified from the documentation
available for review. At present, Yamana’s operations at Jacobina are a positive contribution to sustainability and community well-being.
Jacobina has demonstrated a commitment to employee health, safety, and well-being; community programs; and ongoing outreach and data collection
to support issues management and mitigation. Yamana has established and continues to implement its various policies, procedures, and practices
in a manner broadly consistent with relevant IFC Performance Standards.
SLR recommends that Yamana should implement the following:
·
Conduct geochemical sampling and characterization of waste rock before developing a new waste rock stockpile.
·
Maintain a robust water quality monitoring program to verify compliance with applicable environmental standards and evaluate the
appropriateness of the water management strategies that are in place.
145
·
Continue to implement the environmental monitoring program, which monitors and manages potential environmental impacts resulting
from the mine operations, to inform future permit applications and mine closure plan updates.
·
Consider the implementation of a noise- and vibrations-monitoring program, consistent with the integrated 2016 HSEC Framework.
·
Consider establishing an energy and emissions strategy/plan to determine, on a defined frequency, sources of energy consumption
and associated greenhouse gas (GHG) emissions, consistent with the integrated HSEC framework (Yamana, 2016).
·
The existing sulphate/metals plume originating from the decommissioned TSF B1 may potentially cause ongoing effects on water. This
could result in long-term closure costs extending beyond the five-year post-closure treatment period that is currently outlined in the
conceptual 2018 mine closure plan. It is recommended that the closure cost estimate be reviewed as the mine closure plan and designs for
both TSF facilities are developed in more detail. Costs for long-term monitoring and maintenance of dams should also be reviewed.
·
Considering that, historically, mine site closures have the potential to result in significant economic impacts to a community,
a detailed social management plan should be developed to mitigate the economic and social effects of mine closure; this plan would include
ongoing consultation, training, and planning.
·
Incorporate a strategy for closure of the inactive open pit into the mine closure plan.
146
21
CAPITAL AND OPERATING COSTS
The capital and operating costs outlined in this section
of the technical report and based on the Phase 1 Optimization LOM plan presented in Section 16.3 of this technical report. Capital
and operating costs for the Phase 2 expansion scenario are summarized in Section 24 of this technical report. The capital and operating
cost estimates were prepared based on recent operating performance and on Yamana’s current budget forecast. All costs in this section
are in US dollars and are based on an exchange rate assumption of 4.00 BRL:USD, compared to an exchange rate assumption of 3.50 to 3.60
BRL:USD used in the most recent technical report on Jacobina compiled by RPA with an effective date of June 30, 2019 (RPA, 2019).
21.1
CAPITAL COSTS
The total
LOM capital costs estimate is approximately US$357 M and is assumed to support sustaining capital requirements for the mining and processing
of mineral reserves over the project’s 14.5-year LOM. A summary of the LOM capital costs for the project is shown in Table 21-1.
Table
21-1: Life of mine capital costs
| Category |
|
Phase 1 Optimization
Total LOM $US |
|
| Sustaining Capital Cost |
|
326,818,000 |
|
| Mine Development |
|
142,164,000 |
|
| Infrastructure |
|
70,981,000 |
|
| Vehicles & Machinery |
|
52,140,000 |
|
| Tailings Dam |
|
30,144,000 |
|
| Hardware & Software |
|
13,016,000 |
|
| Other Sustaining CAPEX |
|
18,373,000 |
|
| Expansionary Capital Costs |
|
30,259,000 |
|
| Capacity Increase |
|
8,587,000 |
|
| Tailings Dam Expansions |
|
11,895,000 |
|
| Expansion Mine Development |
|
7,306,000 |
|
| Other Expansionary CAPEX |
|
2,471,000 |
|
| Total Capital Cost |
|
357,077,000 |
|
Capital costs do not include project financing and interest
charges, working capital, sunk costs, capitalized exploration, closure costs, or capital costs estimated to be required for the construction
of the Phase 2 Expansion project; these costs are outlined in Section 24 of this technical report.
147
The main capital costs are related to capitalized mine
development; this consists of approximately 64,000 m over the LOM period.
Annual mine closure costs are listed in Section 20
of this technical report and cover rehabilitation, dismantling, tailings, and closure of mine accesses as well as post-closure monitoring
for a five-year period.
21.2
OPERATING COSTS
Operating costs are defined as the direct operating costs;
these include mining, processing, tailings storage, water treatment, general and administrative and refining costs.
The production plan drove the calculation of the mining
and processing costs as the mining mobile equipment fleet, manpower, contractors, power, and consumables requirements were calculated
based on specific consumption rates.
The operating cost estimates rely on the following assumptions:
·
The specific consumptions for all consumables for mining and processing were analyzed based on historical usage over the last 12
months and defined based on the continuous improvement projects, assuring alignment with the mine production and cost plan.
·
Power cost was calculated based on power capacity load of each equipment and area, considering the availability, utilization, and
power factor. The prices were based on the contract for demand and supply.
·
Labour cost was calculated based on the estimated headcount requirements, including salaries, benefits, workload, and personal
protective equipment (PPE).
·
The maintenance costs were calculated at a task level for each equipment for both mining and processing areas. The drivers for
those costs were equipment working hours, preventive maintenance plan, and useful life for spare parts and components.
·
Contractor costs are based on existing contracts, where the most expensive costs are the mine hauling contract and light vehicles
rental. The costs for the hauling contract were calculated considering contract rates, truck productivity, and necessary working hours
to support the mine plan and. The fixed costs of this contract were also considered.
·
General and administrative (G&A) costs consider the supporting areas, such as human resources, accounting, HSEC, IT, general
services, security and procurement. The main costs are labour and contracts like surveillance, catering, environmental monitoring and
consulting.
148
The operating cost has an exposure to the local currency
of around 80%.
Operating
costs are forecasted to average US$41.04/t over the LOM period, as set out in Table 21-2. Operating cost data for the expansion
case scenarios, as well as the comparisons with the current estimate, are outlined in Section 24.7.
Table
21-2: LOM Average unit operating costs
| |
|
Base Case |
|
| |
|
(US$/t processed) |
|
| Mining |
|
23.33 |
|
| Process |
|
12.28 |
|
| G&A |
|
5.43 |
|
| Total |
|
41.04 |
|
149
22
ECONOMIC ANALYSIS
Financial information has been excluded from this technical
report as Yamana is a producing issuer and the Jacobina Mine is currently in production. Yamana has performed an economic analysis of
the current project using a gold price of US$1,250/oz, at the forecasted production rates, metal recoveries, and capital and operating
cost estimated in this technical report. Yamana confirms that the outcome is a positive cash flow that supports the mineral reserve estimate.
Due to the nature of the mining business, these conditions can change significantly over relatively short periods of time. Consequently,
actual results may be significantly more or less favourable.
Section 24 summarizes a pre-feasibility study based
on the Phase 2 Expansion, an expansion scenario that would increase throughput to 8,500 tpd. The economic analysis for this scenario is
presented in Section 24.8.
150
23
ADJACENT PROPERTIES
There are no adjacent properties that are relevant to this
technical report. Yamana controls almost all of the Bahia Gold Belt except for a few small artisanal miner (garimpeiro) holdings.
151
24
OTHER RELEVANT DATA AND INFORMATION
Yamana commissioned Ausenco to conduct a pre-feasibility
study (PFS) of the Phase 2 Expansion. This study, dated March 31, 2020, considered an expansion scenario that would increase the
processing plant’s throughput capacity of 6,500 tpd to 8,500 tpd (Ausenco, 2020). This section summarizes this pre-feasibility study.
In 2019, Jacobina began optimizing the processing plant
to stabilize throughput at a target rate of 6,500 tpd. Yamana refers to this optimization as Phase 1 Optimization. The first step of the
optimization was the installation of an Advanced Process Control system in early 2019 to increase the level of plant automation. Other
components of the optimization include additional gravity concentrators, a new induction kiln, replacement of screens, and new carbon-in-pulp
(CIP) tanks. The Phase 1 project is on track for completion in mid-2020.
Jacobina achieved the Phase 1 Optimization throughput objective
of 6,500 tpd in the first quarter of 2020, a full quarter ahead of schedule and without the benefits expected from the installation of
all the plant modifications. Yamana continues to evaluate the actual Phase 1 performance and pursue further debottlenecking initiatives
to determine the sustainable throughput level in excess of 6,500 tpd that the mill can achieve without additional investment.
Following up on Phase 1 Optimization, Yamana is studying
the increase in throughput to 8,500 tpd, referred to as the Phase 2 Expansion. The throughput increase is expected to be achieved through
the installation of an additional grinding line and incremental upgrades to the crushing and gravity circuits. If implemented, the Phase
2 Expansion is expected to increase annual gold production by 31%, reduce costs, and generate significant cash flow and attractive returns.
The total capital cost of the Phase 2 Expansion is estimated at US$57 M, of which US$35 M is assigned for the processing plant, US$14
M for underground mining, and US$8 M for infrastructure.
24.1
PHASE 2 EXPANSION — UNDERGROUND MINING EQUIPMENT AND INFRASTRUCTURE
The current mining equipment fleet and underground infrastructure
can support most of the additional production requirements for the Phase 2 Expansion. However, a modest amount of additional mining equipment
and ventilation and dewatering infrastructure is required and the acquisition of certain infrastructure will be brought forward to support
the increased production rate.
A list
of the active mine equipment at Jacobina is shown in Table 24-1 and is compared to the maximum amount of equipment that will be
required to achieve the mine plan for the Phase 2 Expansion. Equipment replacement has also been included in sustaining capital cost estimates
152
based on estimated equipment operating hours. Trucks will
continue to be contractor-owned and operated.
Table
24-1: Mining equipment requirements
| Equipment |
|
Currently
Active |
|
Maximum Required for
Phase 2 Expansion |
|
Additional Equipment
Required |
|
| Fan Drills |
|
6 |
|
9 |
|
3 |
|
| Front-end Loaders |
|
8 |
|
8 |
|
0 |
|
| Jumbos |
|
7 |
|
10 |
|
3 |
|
| LHDs |
|
8 |
|
12 |
|
4 |
|
| Scalers |
|
7 |
|
9 |
|
2 |
|
| Scissor Lifts |
|
11 |
|
11 |
|
0 |
|
| Trucks |
|
45 |
|
62 |
|
17 |
|
| Graders |
|
4 |
|
4 |
|
0 |
|
| Backhoes |
|
3 |
|
3 |
|
0 |
|
| Water trucks |
|
2 |
|
2 |
|
0 |
|
| Shotcreters |
|
2 |
|
3 |
|
1 |
|
Ventilation
infrastructure will be upgraded to provide adequate airflow to the additional working areas and for increased equipment fleet. The ventilation
model has been simulated to estimate the required airflow quantities. At the Morro do Vento South, Morro do Vento North, and Morro do
Cuscuz mines, additional airflow of 300 m3/s will be required to support the increased production
rates. The Canavieiras North Mine is currently served by the Canavieiras Central main ventilation circuit, where the existing raise infrastructure
will be used to reactivate an independent ventilation circuit by 2023. Options are being currently being evaluated to determine if new
fans will be purchased for Canavieiras North, or if existing fans will be relocated to that mine.
Additional dewatering infrastructure, not considered in
the base case, will be required to achieve the Phase 2 Expansion scenario, such as an additional acid water treatment plant to treat dewatering
effluent. The plant will be located close to the portals of the João Belo and Morro do Vento mines.
24.2
PHASE 2 EXPANSION — PROCESSING PLANT
The mineral processing plant at Jacobina is currently being
optimized to support a daily production throughput of 6,500 tpd. The Phase 2 Expansion would increase throughput to 8,500 tpd on a sustainable
basis, while maintaining current gold recoveries of 96% to 97%.
Plant modifications include the replacement of the existing
tertiary crusher with a larger capacity crusher, the addition of a third ball mill, and the addition of a new silo. The third ball mill
is identical in size to the existing ball mill 2, which will enable synergies in maintenance and supply
153
of spare parts. The target throughput rate of 8,500 tpd
can be achieved with only two grinding lines in operation (ball mills 2 and 3). The intention is to shut down the smaller ball mill 1.
With three ball mill lines in operation, plant throughput could be expanded to 10,000 tpd in the future.
The Phase
2 Expansion process flow sheet is depicted in Figure 24-1 and described in more detail below.
154

Figure
24-1: Phase 2 Expansion process flow sheet
155
24.2.1
CRUSHING CIRCUIT
Several options were considered to increase secondary crushing
capacity and provide the greater operational flexibility needed for the Phase 2 Expansion:
·
Option 1: Operate the crushing circuit at an increased availability.
·
Option 2: Include a third HP500 crusher.
·
Option 3: Replace the two existing HP500 crushers with two HP6 crushers.
·
Option 4: Replace an existing HP500 crusher with one HP800 crusher.
Option 1, while not requiring capital investment, would
limit the crushing circuit’s catch-up capacity, and would therefore present a risk to reaching the required production rate.
Option 2 would require a third HP500 crusher which is of
a similar size as the existing crushers. Yamana indicated that the inclusion of a third crusher would require major changes in the secondary
and tertiary crushing areas such as new conveyor belts, new belt feeder, modification of the crusher feed silo, relocation of the hydraulic
units for all crushers (to allow for expansion of existing buildings) and structural works (concrete and steel structures). These changes
were deemed complex, expensive, time consuming, and would impact the existing operation during construction and commissioning.
Option 3 considers the replacement of both HP500 secondary
crushers with two HP6 crushers; the HP6 is slightly larger than the HP500.
Option 4 requires the replacement of one existing HP500
with a larger and heavier HP800.
Both options 3 and 4 can achieve the required throughput
rates for the crushing circuit. Yamana has selected to proceed with option 4, in which the new crusher can be installed in the location
of the existing HP500, offering the least impact on the operation.
24.2.2
GRINDING CIRCUIT
The Phase 2 Expansion project includes the following additional
grinding equipment:
·
A third ball mill (15’ x 30’). The new ball mill is identical in size to the existing ball mill 2, which will enable
synergies in maintenance and supply of spare parts.
·
A 6,000 t capacity silo for additional storage of crushed ore to feed the third ball mill circuit.
·
A new cyclone feed hopper and duty/standby pumping arrangement.
·
A new cyclone cluster, screen, and gravity concentrator associated with the third ball mill.
156
·
A new cyclone feed distribution box associated with ball mill 1 and ball mill 2 to split feed to an existing gravity concentrator
as well as to a new gravity concentrator.
·
A new Acacia intensive leach reactor to work in parallel with an existing Acacia intensive leach reactor.
24.2.3
THICKENING OF GRINDING PRODUCT
The Phase 2 Expansion project includes a new distribution
box and two additional trash screens (making four trash screens in total for this duty) to adequately process the higher volumetric flows
from the grinding circuit.
The existing hydrocyclones in this part of the circuit
will be optimized (increased number of operating cyclones) as a result of the increased flow rates. Similarly, the operation of the existing
Falcon concentrator, which receives the hydrocyclone underflow, will also be optimized based on the higher design feed rate.
The hydrocylone overflow will report to the existing pre-leach
thickener without needing any modification, based on existing operational experience.
The underflow from the pre-leach thickener feeds is combined
with “reject” from the Falcon concentrator in order to provide a higher density slurry to the leaching circuit which uses a
conventional cyanide leaching process.
24.2.4
LEACHING CIRCUIT
The leaching circuit consists of seven leaching tanks;
no additional equipment is required for the increased flow rate resulting from the Phase 2 Expansion project. Both historical test work
and operational experience provide confirmation that adequate residence time will be available to achieve the required gold dissolution.
24.2.5
CIP ADSORPTION CIRCUIT
The pulp from the leaching circuit is delivered to the
CIP adsorption circuit which has been optimized to include two lines of five mechanically agitated CIP tanks (increased from one line
of six CIP tanks). The activated carbon is pumped to a single screen per adsorption line. One of these screens is installed as part of
the Phase 2 Expansion project.
24.2.6
ELUTION CIRCUIT
The Phase 1 Optimization already includes the installation
of another elution system in parallel to the existing one; this meets the Phase 2 expansion needs.
24.2.7
ELECTROWINNING CIRCUIT
A new plating cell is planned for the Phase 2 Expansion
project.
157
24.2.8
TAILINGS DISPOSAL
A new
tank of 585 m3 capacity has been included to store tailings decant return water. This
represents approximately 2 hours storage at the nominal throughput rate. The tailings pumping system will be upgraded with new tanks and
pumps to manage the increased capacity, and the entire tailings pipeline will be covered. No changes to the TSF design are expected, although
the construction schedule is accelerated to align with the increased processing rate.
24.2.9
AUTOMATION, INSTRUMENTATION, AND CONTROL
The current supervision and control system installed at
Jacobina uses both programmable logic controllers (PLCs) and remote input/outputs (I/Os) from the Siemens Simatic line. The Phase 2 Expansion
project includes the acquisition of new automation hardware compatible with the existing system and an update of the existing central
processing units (CPUs).
24.2.10
ARCHITECTURE AND CONSTRUCTION
The current canteen, maintenance workshop, and administrative
office facilities are able to support the Phase 2 Expansion plan. The warehouse would need to be expanded to store consumables and spare
parts required for the additional equipment. Building constructions include an expansion of the warehouse and grinding building, and new
sheds for cyanide preparation. These new and expanded buildings will follow the same architectural line as those of the existing infrastructure.
24.3
PHASE 2 EXPANSION — POWER SUPPLY
The current power demand at Jacobina is approximately 17.2
MW. For the Phase 2 Expansion, the required power demand is estimated at 27.4 MW, representing an increase of approximately 10 MW. Energy
consumption is expected to increase from 10,877 to 17,302 MWh/year after the Phase 2 Expansion. Yamana is currently working with the power
distributor, COELBA, to plan the required infrastructure to support the increase in power demand.
This power demand is expected to increase gradually from
2020 to 2024, as additional equipment is progressively added to the processing plant and mine. The increased power demand at the processing
plant is mostly related to the new ball mill and crusher, whereas the increased power demand at the mine is mostly related to ventilation
and pumping.
24.4
PHASE 2 EXPANSION — LIFE OF MINE PLAN
The Phase
2 Expansion LOM (PFS case) is based on the mineral reserves with an effective date of December 31, 2019, described in Section 15
of this technical report. The PFS case LOM plan considers a mine life of 11.5 years, starting with a plant feed rate of 6,500 tpd for
2020 and 2021, ramping up production in 2022, to reach the average plant feed rate of 8,500 tpd by 2023, as shown in Table 24-2.
Plant throughput will be maintained at 8,500 tpd until 2030 and will decrease in 2031. The LOM gold production profile of the PFS case
increases from a target
158
Phase
1 Optimization running rate of 175 koz per year to approximately 230 koz per year, as shown in Figure 24-2.
Total LOM underground development for the expansion scenario
is unchanged from the base case, but higher annual development rates will be required to achieve increased mine production rates. LOM
lateral development requirements are approximately 64,000 m of capital development and 100,000 m of secondary development. The development
rate for the PFS expansion case peaks at a total of 19,300 m per year, compared to a peak annual development rate of 16,800 m required
for the base case processing rate of 6,500 tpd.
For internal
planning purposes, an extended mine plan (Extended Case) has been developed that considers the addition of 9.5 Mt of plant feed with an
average grade of 2.40 g/t gold, assuming the successful conversion of mineral resources into reserves. This would increase the mine life
of the Phase 2 Expansion scenario from 11.5 years to 14.5 years. The gold production profile of the Extended Case is shown in Figure 24-3.
Based on Jacobina’s impressive track record of discovery
and successful conversion of mineral resources to mineral reserves, Yamana is confident that, based on required infill drilling, the future
conversion of mineral resources to mineral reserves will continue to show positive results. Furthermore, Jacobina’s favourable geological
environment, both near mine and regionally, provides exceptional mineral potential that may eventually result in extending the mine life
beyond the Extended Case.
159
Table
24-2: LOM plan — Phase 2 Expansion PFS Case
| Description |
|
Units |
|
LOM |
|
FY20 |
|
FY21 |
|
FY22 |
|
FY23 |
|
FY24 |
|
FY25 |
|
FY26 |
|
FY27 |
|
FY28 |
|
FY29 |
|
FY30 |
|
FY31 |
|
| Tonnes Mined |
|
kt |
|
34,248 |
|
2,372 |
|
2,364 |
|
2,540 |
|
3,106 |
|
3,138 |
|
3,130 |
|
3,130 |
|
3,130 |
|
3,138 |
|
3,130 |
|
3,154 |
|
1,917 |
|
| JBA |
|
kt |
|
9,919 |
|
707 |
|
733 |
|
613 |
|
541 |
|
373 |
|
645 |
|
616 |
|
871 |
|
892 |
|
1319 |
|
1319 |
|
1290 |
|
| MVC |
|
kt |
|
4,412 |
|
17 |
|
136 |
|
252 |
|
677 |
|
721 |
|
719 |
|
551 |
|
356 |
|
181 |
|
396 |
|
405 |
|
0 |
|
| MVS |
|
kt |
|
3,521 |
|
154 |
|
101 |
|
89 |
|
197 |
|
517 |
|
628 |
|
625 |
|
274 |
|
520 |
|
281 |
|
133 |
|
0 |
|
| CAS |
|
kt |
|
6,873 |
|
955 |
|
938 |
|
989 |
|
909 |
|
384 |
|
237 |
|
331 |
|
429 |
|
218 |
|
291 |
|
703 |
|
489 |
|
| CAC |
|
kt |
|
4,097 |
|
196 |
|
180 |
|
372 |
|
208 |
|
418 |
|
390 |
|
506 |
|
741 |
|
666 |
|
377 |
|
42 |
|
0 |
|
| MCZ |
|
kt |
|
1,582 |
|
237 |
|
102 |
|
26 |
|
265 |
|
182 |
|
97 |
|
188 |
|
113 |
|
230 |
|
33 |
|
54 |
|
55 |
|
| SCO |
|
kt |
|
2,029 |
|
0 |
|
0 |
|
0 |
|
0 |
|
139 |
|
115 |
|
229 |
|
228 |
|
348 |
|
423 |
|
463 |
|
83 |
|
| CAN |
|
kt |
|
1,816 |
|
106 |
|
173 |
|
198 |
|
308 |
|
404 |
|
298 |
|
84 |
|
117 |
|
83 |
|
9 |
|
36 |
|
0 |
|
| Mining Grade |
|
g/t Au |
|
2.27 |
|
2.21 |
|
2.29 |
|
2.52 |
|
2.36 |
|
2.37 |
|
2.36 |
|
2.37 |
|
2.37 |
|
2.37 |
|
2.00 |
|
2.00 |
|
1.98 |
|
| JBA |
|
g/t Au |
|
1.88 |
|
1.84 |
|
1.93 |
|
1.96 |
|
1.75 |
|
1.77 |
|
1.84 |
|
1.89 |
|
1.91 |
|
1.81 |
|
1.87 |
|
1.94 |
|
1.91 |
|
| MVC |
|
g/t Au |
|
2.50 |
|
3.62 |
|
3.27 |
|
2.65 |
|
2.65 |
|
2.77 |
|
2.75 |
|
2.63 |
|
2.13 |
|
2.21 |
|
1.80 |
|
1.94 |
|
0.00 |
|
| MVS |
|
g/t Au |
|
2.17 |
|
2.19 |
|
2.35 |
|
2.09 |
|
2.51 |
|
1.91 |
|
2.11 |
|
2.10 |
|
2.05 |
|
2.50 |
|
2.06 |
|
2.27 |
|
0.00 |
|
| CAS |
|
g/t Au |
|
2.32 |
|
2.44 |
|
2.26 |
|
2.49 |
|
2.41 |
|
2.33 |
|
2.14 |
|
2.39 |
|
2.22 |
|
2.22 |
|
2.00 |
|
2.18 |
|
2.24 |
|
| CAC |
|
g/t Au |
|
3.09 |
|
2.59 |
|
2.54 |
|
3.32 |
|
2.59 |
|
3.08 |
|
2.98 |
|
3.36 |
|
3.32 |
|
3.38 |
|
2.55 |
|
2.25 |
|
0.00 |
|
| MCZ |
|
g/t Au |
|
1.91 |
|
1.85 |
|
2.05 |
|
1.78 |
|
2.04 |
|
1.94 |
|
1.87 |
|
1.92 |
|
2.25 |
|
1.82 |
|
1.61 |
|
1.57 |
|
1.58 |
|
| SCO |
|
g/t Au |
|
2.07 |
|
0.00 |
|
0.00 |
|
0.00 |
|
0.00 |
|
2.00 |
|
2.11 |
|
2.08 |
|
2.17 |
|
2.29 |
|
2.09 |
|
1.92 |
|
1.71 |
|
| CAN |
|
g/t Au |
|
2.58 |
|
2.37 |
|
3.11 |
|
3.07 |
|
2.67 |
|
2.43 |
|
2.70 |
|
1.90 |
|
2.25 |
|
2.10 |
|
1.73 |
|
1.85 |
|
0.00 |
|
| Mill Feed |
|
|
|
|
|
|
|
|
|
|
|
|
|
|
|
|
|
|
|
|
|
|
|
|
|
|
|
|
|
| Ore Processed |
|
kt |
|
34,348 |
|
2,372 |
|
2,364 |
|
2,540 |
|
3,106 |
|
3,138 |
|
3,130 |
|
3,130 |
|
3,130 |
|
3,138 |
|
3,130 |
|
3,154 |
|
2,018 |
|
| Feed Grade |
|
g/t Au |
|
2.27 |
|
2.21 |
|
2.29 |
|
2.52 |
|
2.36 |
|
2.37 |
|
2.36 |
|
2.37 |
|
2.37 |
|
2.37 |
|
2.00 |
|
2.00 |
|
1.97 |
|
| Recovery |
|
% |
|
96.5 |
|
96.5 |
|
96.5 |
|
96.5 |
|
96.5 |
|
96.5 |
|
96.5 |
|
96.5 |
|
96.5 |
|
96.5 |
|
96.5 |
|
96.5 |
|
96.5 |
|
| Gold Produced |
|
koz |
|
2,421 |
|
162 |
|
168 |
|
199 |
|
227 |
|
231 |
|
229 |
|
230 |
|
230 |
|
231 |
|
194 |
|
196 |
|
123 |
|
160

Figure 24-2:
LOM production profile — Phase 2 Expansion PFS case
Modified from: Ausenco, 2020

Figure 24-3:
LOM production profile — Phase 2 Extended Case
Modified from: Ausenco, 2020
161
24.5
PHASE 2 EXPANSION — PERMITTING
Yamana is applying to include the following features in
the Change Licence (L.O 14.100):
·
Increase the processing plant throughput to 8,500 t per calendar day, with a maximum throughput of up to 10,000 t per operating
day.
·
Increase of the stockpile area capacity from 40,000 t to over 80,000 t.
·
Decrease the dam freeboard of TSF B2 from 3 m to 2 m.
·
Installation of a new ball mall, silo, electrowinning cell, and area for preparation of cyanide briquettes.
·
Improvements to the tailings pumping system with new tanks, pumps, and cover of the entire pipeline.
·
New waste dump area and emulsion plant.
The renewal of the processing Operational Licence (L.O.
14.100) is expected by early 2021, with issuance of the Change Licence (L.O. 14.100) expected by late 2021. The renewal process of the
mining Operational Licence (L.O. 1791) will be processed in parallel.
Yamana continues to work with the Bahia state environmental
agency, INEMA, to provide the necessary information and coordinate site visits.
24.6
PHASE 2 EXPANSION — CAPITAL COST ESTIMATE
Capital cost estimates were prepared from the current budget
and business plan, updated with capital cost estimates for the Phase 1 Optimization LOM plan and Phase 2 Expansion PFS case LOM plan.
Costs estimates are based on an exchange rate assumption of 4.00 BRL:USD.
For the
PFS case, the LOM capital costs estimate totals approximately US$ 414 M (Table 24-3). Total capital costs for Phase 2 Expansion
are estimated at $57 M, of which $35 M is dedicated to the processing plant, $14 M to underground mining, and $8 M to infrastructure.
The project’s capital cost is expected to be invested incrementally and would allow the project to be funded by Jacobina’s cash
flow. A detailed summary of the Phase 2 plant expansion capital cost estimate is provided in Section 24.6.1.
162
Table
24-3: Phase 2 Expansion LOM Capital costs
| Category |
|
Phase 2
Expansion
US$ |
|
| Sustaining Capital Cost |
|
332,105,000 |
|
| Mine Development |
|
117,742,000 |
|
| Infrastructure |
|
83,240,000 |
|
| Vehicles & Machinery |
|
72,282,000 |
|
| Tailings Dam |
|
27,696,000 |
|
| Hardware & Software |
|
12,901,000 |
|
| Other Sustaining CAPEX |
|
18,245,000 |
|
| Expansion Capital Cost |
|
82,172,000 |
|
| Phase 2 Expansion |
|
57,000,000 |
|
| Other Expansionary LOM CAPEX |
|
25,172,000 |
|
| Total Capital Cost |
|
414,277,000 |
|
The main capital costs are related to the plant expansion,
tailings dam construction, capital mine development, and mining infrastructure. The sustaining cost estimate considers the primary mine
development, tailings dam maintenance, mine infrastructure (dewatering, communication and ventilation), and mine fleet replacement and
overhaul over the mine life. Underground development capital costs are estimated based on unit costs ranging from US$2,110/m to US$2,239/m,
depending on the support requirements in the different underground mining sectors. Capital costs do not include working capital, capitalized
exploration, or closure costs.
The expected run rate for sustaining capital is approximately
US$ 30 M per year, decreasing towards the end of the mine life in line with the decrease in underground development rates.
24.6.1
PROCESSING PLANT EXPANSION CAPITAL COST
The processing plant Phase 2 Expansion capital cost estimate
was prepared by Ausenco at an FEL (front-end loading)-II engineering level, assuming a range of accuracy of - 30% to + 40%, in accordance
to American Association of Cost Engineering (AACE) CLASS 4, at an assumed exchange rate of 4.00 BRL:USD.
Direct costs include supply of electromechanical and process
equipment, electrical materials, automation, instrumentation, communication, structures, platework, and piping, as well as civil works,
infrastructure, and electromechanical assembly services.
Mechanical equipment includes the crusher, ball mill, screens,
gravimetric concentrator, and slurry pumps. Prices were quoted by specialized equipment vendors. The cost of concrete is based on volume
estimates for each area of the plant and includes concrete, steel bar reinforcement, formwork, excavation, anchor bolts, and inserts.
The electromechanical assembly capital cost was estimated per equipped worker; the cost includes all the resources, tools, personal protective
equipment, consumables, and other items necessary for the complete execution of services.
163
Indirect costs include the following:
·
First fill
·
Shipping and insurance
·
Assembly supervision
·
Commissioning and start-up
·
Spare parts
·
Owner costs
·
Engineering, procurement, construction management (EPCM)
·
Engineering risk insurance
Uncertainties and unassessed risks in the execution of
Phase 2 Expansion are covered by a 35% contingency, applied on the total capital cost.
The total estimated
capital cost for the Jacobina Phase 2 plant expansion project is US$35.5 M, including direct costs, indirect costs, and contingencies,
as summarized in Table 24-4.
164
Table
24-4: Capital cost estimate by discipline
| Code |
|
Description |
|
Cost (R$) |
|
Cost (US$) |
|
% Total |
|
| Direct Costs |
|
| F |
|
Supply |
|
55,400,000 |
|
13,850,000 |
|
66.80 |
% |
| F-10 |
|
Mechanical |
|
33,377,000 |
|
8,344,000 |
|
40.20 |
% |
| F-15 |
|
Platework |
|
3,341,000 |
|
835,000 |
|
4.00 |
% |
| F-20 |
|
Piping, valves, fittings and accessories |
|
4,344,000 |
|
1,086,000 |
|
5.20 |
% |
| F-30 |
|
Electrical equipment, cables and materials |
|
10,003,000 |
|
2,501,000 |
|
12.10 |
% |
| F-40 |
|
Steel structures |
|
2,661,000 |
|
665,000 |
|
3.20 |
% |
| F-50 |
|
Automation, Instrumentation and telecom |
|
1,674,000 |
|
418,000 |
|
2.00 |
% |
| M |
|
Electromechanical Assembly |
|
18,478,000 |
|
4,620,000 |
|
22.30 |
% |
| M-01 |
|
Construction site - Assembly |
|
1,367,000 |
|
342,000 |
|
1.60 |
% |
| M-10 |
|
Mechanical |
|
3,341,000 |
|
835,000 |
|
4.00 |
% |
| M-11 |
|
Modifications to existing equipment |
|
253,000 |
|
63,000 |
|
0.30 |
% |
| M-15 |
|
Platework |
|
3,175,000 |
|
794,000 |
|
3.80 |
% |
| M-20 |
|
Piping, valves, fittings and accessories |
|
4,995,000 |
|
1,249,000 |
|
6.00 |
% |
| M-30 |
|
Electrical equipment, cables and materials |
|
3,000,000 |
|
750,000 |
|
3.60 |
% |
| M-40 |
|
Steel structures |
|
2,262,000 |
|
565,000 |
|
2.70 |
% |
| M-50 |
|
Automation, Instrumentation and telecom |
|
84,000 |
|
21,000 |
|
0.10 |
% |
| C |
|
Civil Works |
|
9,093,000 |
|
2,273,000 |
|
11.00 |
% |
| C-01 |
|
Site - Civil Works |
|
673,000 |
|
168,000 |
|
0.80 |
% |
| C-10 |
|
Concrete |
|
8,135,000 |
|
2,034,000 |
|
9.80 |
% |
| C-25 |
|
Infrastructure |
|
285,000 |
|
71,000 |
|
0.30 |
% |
| |
|
TOTAL DIRECT COST |
|
82,971,000 |
|
20,743,000 |
|
78.90 |
% |
| Indirect Costs |
|
| E-15 |
|
EPCM |
|
8,643,000 |
|
2,161,000 |
|
8.20 |
% |
| E-15 |
|
Commissioning and Start-up |
|
2,489,000 |
|
622,000 |
|
2.40 |
% |
| E-15 |
|
First fills |
|
1,245,000 |
|
311,000 |
|
1.20 |
% |
| E-15 |
|
Assembly supervision |
|
868,000 |
|
217,000 |
|
0.80 |
% |
| E-15 |
|
Spare parts |
|
4,338,000 |
|
1,084,000 |
|
4.10 |
% |
| E-15 |
|
Shipping and insurance (national) |
|
2,770,000 |
|
692,000 |
|
2.60 |
% |
| E-15 |
|
Shipping and insurance (international) |
|
526,000 |
|
132,000 |
|
0.50 |
% |
| E-15 |
|
Engineering risk insurance |
|
480,000 |
|
120,000 |
|
0.50 |
% |
| E-15 |
|
Owner costs |
|
830,000 |
|
207,000 |
|
0.80 |
% |
| |
|
TOTAL INDIRECT COSTS |
|
22,189,000 |
|
5,547,000 |
|
21.00 |
% |
| Totals |
|
| |
|
Total without Contingency |
|
105,159,000 |
|
26,290,000 |
|
100.00 |
% |
| |
|
Contingency (35)% |
|
36,806,000 |
|
9,201,000 |
|
|
|
| |
|
Total with Contingency |
|
141,965,000 |
|
35,491,000 |
|
|
|
Note: Numbers may not add up due to rounding.
165
24.7
PHASE 2 EXPANSION — OPERATING COST ESTIMATE
Mining, processing, and G&A operating costs were estimated
based on the planned mining fleet, headcount, contractor requirements, power demand, and consumption of consumables, using a similar methodology
to the one used for preparing annual budget cost estimates.
LOM average
unit operating costs for the Phase 2 Expansion PFS case are compared to the Phase 1 Optimization case in Table 24-5. Unit costs
are lower in the PFS case due to improved efficiency, the distribution of fixed costs over a greater quantity of tonnes per year, and
the fewer total years of production.
Table
24-5: LOM average unit operating costs
| |
|
Phase 1
Optimization |
|
Phase 2
Expansion |
|
| |
|
(US$/t processed) |
|
(US$/t processed) |
|
| Mining |
|
23.33 |
|
21.43 |
|
| Process |
|
12.28 |
|
11.51 |
|
| G&A |
|
5.43 |
|
4.56 |
|
| Total |
|
41.04 |
|
37.50 |
|
24.8
PHASE 2 EXPANSION — ECONOMIC ANALYSIS
The pre-feasibility economic analysis is based on a gold
price assumption of $1,250 per oz. Costs incurred in Brazilian reals (B$ or BRL) have been converted to US dollars (US$ or USD) using
an exchange rate assumption of 4.00 BRL:USD. A discount rate of 5% was used. The economic analysis is based on the Phase 2 PFS case and
Extended Case mining and processing plans presented in Section 24.4.
The PFS
case scenario, which is based on current mineral reserves only, delivers a net present value (NPV) of $777 M over an 11.5-year mine life.
Under the Extended Case, which includes 9.5 Mt of additional plant feed with an average feed grade of 2.4 g/t of gold, the LOM increases
to 14.5 years at 8,500 tpd. Under this scenario, the after-tax NPV increases to $993 M. Highlights of the economic analysis, comparing
Phase 1 Optimization, Phase 2 PFS case, and Phase 2 Extended Case are shown in Table 24-6.
166
Table
24-6: Phase 2 LOM Summary
| |
|
Units |
|
Phase 1
Optimization |
|
Phase 2
Expansion |
|
Phase 2
Extended Case |
|
| Life of mine |
|
years |
|
14.5 |
|
11.5 |
|
14.5 |
|
| Throughput |
|
tpd |
|
6,500 |
|
8,500 |
|
8,500 |
|
| Recovery rate |
|
% |
|
96.5 |
|
96.5 |
|
96.5 |
|
| Annual gold production |
|
koz |
|
175 |
|
230 |
|
230 |
|
| Cash flow (2020-2029) |
|
US$M |
|
662 |
|
930 |
|
969 |
|
| NPV (5%) |
|
US$M |
|
699 |
|
777 |
|
993 |
|
Note: Based on metal price assumptions of US$1,250/oz
for gold and an exchange rate assumption of 4.00 BRL:USD
The long-term
strategic benefit to an expansion at Jacobina exists in the flexibility to bring cash flows forward, while quickly delivering additional
value from the impressive mineral inventory and exploration potential at the immediate mine and in the surrounding mining concessions.
These benefits are illustrated in Figure 24-4.

Figure 24-4:
Cumulative discounted cash flow at 5% discount rate
Source: Yamana, May 2020
167
An additional benefit
of the Phase 2 Expansion project is to increase the mine’s leverage to gold prices. Sensitivities for both the Phase 2 PFS and Extended
Case scenarios are presented at different gold prices in Table 24-7, assuming an exchange rate BRL:USD of 4.0:1, and in Table 24-8,
assuming an exchange rate BRL:USD of 5.0:1.
Table
24-7: Phase 2 Expansion — Gold price sensitivity at BRL:USD exchange rate of 4.0:1
| Gold Price (US$/oz) |
|
$1,250 |
|
$1,450 |
|
$1,550 |
|
| Phase 2 Expansion Case — Mineral reserves effective December 31, 2019 |
|
| NPV (millions) |
|
777 |
|
1,079 |
|
1,229 |
|
| Cash flow — first 5 years |
|
569 |
|
761 |
|
858 |
|
| Cash flow — first 10 years |
|
953 |
|
1,264 |
|
1,419 |
|
| Phase 2 Extended Case — Additional 9.5 Mt converted from mineral resources |
|
| NPV (millions) |
|
993 |
|
1,360 |
|
1,544 |
|
| Cash flow — first 5 years |
|
569 |
|
761 |
|
858 |
|
| Cash flow — first 10 years |
|
1,203 |
|
1,590 |
|
1,784 |
|
Table
24-8: Phase 2 Expansion — Gold price sensitivity at BRL:USD exchange rate of 5.0:1
| Gold Price (US$/oz) |
|
$1,250 |
|
$1,450 |
|
$1,550 |
|
| Phase 2 Expansion Case — Mineral reserves effective December 31, 2019 |
|
| NPV (millions) |
|
978 |
|
1,279 |
|
1,430 |
|
| Cash flow — first 5 years |
|
688 |
|
881 |
|
977 |
|
| Cash flow — first 10 years |
|
1,145 |
|
1,455 |
|
1,610 |
|
| Phase 2 Extended Case — Additional 9.5 Mt converted from mineral resources |
|
| NPV (millions) |
|
1,238 |
|
1,602 |
|
1,779 |
|
| Cash flow — first 5 years |
|
688 |
|
881 |
|
977 |
|
| Cash flow — first 10 years |
|
1,444 |
|
1,825 |
|
2,007 |
|
168
24.9
PHASE 2 EXPANSION — IMPLEMENTATION SCHEDULE
The Phase 2 Expansion plan builds on the success of the
Phase 1 Optimization project, which targeted a sustained throughput of 6,500 tpd and annual gold production of 175,000 oz. The Phase 1
Optimization includes the installation of an advanced processing control system, two additional gravity concentrators, an additional kiln,
and four new carbon-in-pulp tanks.
Jacobina achieved the Phase 1 Optimization objective of
6,500 tpd in the first quarter of 2020, a full quarter ahead of schedule and without the benefits expected from the installation of all
the plant modifications, which are scheduled for completion in mid-2020. Yamana continues to evaluate the actual performance of Phase
1 Optimization and pursue further debottlenecking initiatives to determine the sustainable throughput level in excess of 6,500 tpd that
the mill can achieve without additional investment.
Detailed
engineering for the Phase 2 Expansion is currently scheduled to commence soon after commissioning of the Phase 1 Optimization in mid-2020.
This would allow engineering and construction to be completed by early 2023, as shown in Table 24-9. An incremental increase in
throughput to approximately 7,000 tpd could be achieved in 2022 after upgrading the crushing circuit. The critical path for the Phase
2 Expansion is in the grinding area, as the ball mill requires a long lead time to construct and deliver to site.
Capital costs associated with the Phase 2 Expansion would
not commence until 2021; completion of the project would be then expected by early 2023. These timelines are dependent on completion of
the Phase 2 Expansion feasibility study by mid-2021. The feasibility study will look to further refine and optimize operating costs and
also take into account the actual realized potential under the Phase 1 Optimization to determine the true potential of the Phase 2 Expansion.
Yamana may choose to normalize operations under the Phase 1 Optimization for a period of time in order to determine the true realizable
throughput for this phase before proceeding with the Phase 2 Expansion.
JMC has applied for permitting and expects the permits
to be issued by late 2021, within the timeframes currently assumed for implementation of the Phase 2 Expansion. The permit application
is for higher throughput than what is contemplated in the Phase 2 Expansion; this to ensure future flexibility. JMC is already permitted
for throughput of up to 7,500 tpd.
169
Table
24-9: Project implementation schedule

170
25
INTERPRETATION AND CONCLUSIONS
More than 2.2 Moz of gold have been produced from Jacobina
since modern mining commenced in 1983. Annual gold production has increased year-after-year from 74 koz in 2013 to more than 159 koz in
2019, through increases in plant throughput, gold feed grade, and metallurgical recovery.
Drilling activities in previous years have been successful
in defining the plunge of the higher-grade portions of the mineralized zones and have led to the discovery of new mineralized zones, such
as João Belo Sul and the extension of mineralization in the East Block. On the basis of these exploration successes and the production
history at Jacobina, good potential exists in the proximity of the current mine infrastructure for discovering new mineralized zones and/or
the strike and dip extents of the known mineralized horizons.
In terms of the regional exploration potential, the favourable
stratigraphy hosting the gold mineralization at Jacobina has been traced along a strike length of approximately 150 km. Exploration programs
have discovered many gold occurrences along this favourable stratigraphy, including the Jacobina Norte project where gold mineralization
has been discovered along a continuous 15 km-long trend. As of the end of December 2019, 7,067 drill holes were drilled in the Jacobina
project area, for a total of 868,000 metres. Almost all of this drilling has been within the 11 km-long mining district, with the majority
of the 88,000 hectares of exploration concessions still yet to be drilled.
Jacobina mineral resources and mineral reserves have been
estimated in conformity with generally accepted CIM Estimation of Mineral Resources and Mineral Reserves Best Practice Guidelines (November 2019)
and are reported in accordance with CIM (2014) Standards. The total proven and probable mineral reserve at Jacobina as of December 31,
2019, is 34.2 Mt averaging 2.27 g/t gold, for approximately 2.5 Moz of contained gold. In addition, measured and indicated mineral resources
total 42.5 Mt grading 2.26 g/t gold (3.1 Moz gold) and inferred mineral resources of 18.5 Mt grading 2.36 g/t gold (1.4 Moz gold).
In 2019, Jacobina began optimizing the processing plant
to stabilize throughput at a target rate of 6,500 tpd, referred to as the Phase 1 Optimization, which is on track for completion in mid-2020.
Jacobina achieved the Phase 1 Optimization objective of 6,500 tpd in the first quarter of 2020, a full quarter ahead of schedule and without
the benefits expected from the installation of all the plant modifications. Yamana continues to evaluate the actual performance of the
Phase 1 Optimization and pursue further debottlenecking initiatives to determine the sustainable throughput level in excess of 6,500 tpd
that the mill can achieve without additional investment.
Following up on the Phase 1 Optimization, Jacobina is studying
the increase in throughput to 8,500 tpd, referred to as the Phase 2 Expansion. Yamana completed a pre-feasibility study
171
(PFS) for the Phase 2 Expansion in the first quarter of
2020 and will continue with a feasibility study, scheduled for completion in mid-2021.
Three LOM plan scenarios have been developed. In all scenarios,
mining and processing of lower-grade supplementary mineral reserves is deferred until late in the mine life where possible, allowing feed
grades of approximately 2.4 g/t gold to be maintained. The Phase 1 Optimization LOM plan assumes a plant throughput rate of 6,500 tpd
and is based on mineral reserves as of December 31, 2019. In this scenario, the mine life is 14.5 years, with gold production of
175,000 oz per year at a gold feed grade of 2.4 g/t, and a gold metallurgical recovery of 96.5%.
The second scenario, the Phase 2 Expansion PFS case, is
based on the same mineral reserves as the Phase 1 case, but includes the Phase 2 Expansion with plant throughput ramping up to 8,500 tpd
by 2023. With the higher throughput rate, mine life is reduced to 11.5 years and gold production increases to 230,000 oz per year. The
third scenario, referred to as the Phase 2 Expansion Extended Case and that Yamana uses as a base case for internal planning purposes,
is the same as the Phase 2 PFS case, but considers an additional 9.5 Mt of plant feed at an average grade of 2.4 g/t gold based on the
expected conversion of current mineral resources to mineral reserves through infill drilling. Gold production remains at 230,000 oz per
year and mine life is extended to 14.5 years. Based on the impressive track record of discovery and successful conversion of mineral resources
to mineral reserves at Jacobina, Yamana is confident that, based on required infill drilling, the future conversion of mineral resources
to mineral reserves will continue to show positive results. Furthermore, the favourable geological environment, both near mine and regionally,
provides exceptional mineral potential that may eventually result in extending the mine life beyond the Extended Case.
The capital and operating cost estimates for the Phase
1 Optimization LOM plan are based on mine budget data and operating experience, and are appropriate for the known mining methods and production
schedule. Capital cost estimates include appropriate sustaining estimates. Under the assumptions in this technical report, Jacobina has
positive project economics until the end of mine life, which supports the mineral reserve estimate. Capital and operating cost estimates
for the Phase 2 Expansion scenarios were revised as part of the Phase 2 Expansion pre-feasibility study. Total Phase 2 Expansion project
capital costs are estimated at US$57 M, of which $35 M is dedicated to the processing plant, $14M to underground mining, and $8 M to infrastructure.
The project’s capital cost is expected to be invested incrementally and would allow the project to be funded by Jacobina’s cash
flow. LOM average unit operating costs are estimated to decrease from US$41.04/t in the Phase 1 Optimization case to $37.50/t in the Phase
2 Expansion PFS case, due to improved efficiency and the distribution of fixed costs over a greater quantity of tonnes per year.
No environmental issues were identified from the documentation
available for review that could materially impact the ability to extract the mineral resources and mineral reserves. Jacobina has all
the operational licences required for operation according to the national legislation. The
172
approved licences address the authority’s requirements
for mining extraction and operation activities. For the Phase 2 Expansion, Yamana has applied for permitting and expects the permits to
be issued by late 2021, within the timeframes currently assumed for implementation of Phase 2. The permit application is for higher throughput
than what is contemplated in Phase 2 to ensure future flexibility. JMC is already permitted for throughput of up to 7,500 tpd.
No social issues were identified from the documentation
available for review. At present, Yamana’s operations at Jacobina are a positive contribution to sustainability and community well-being.
Jacobina has demonstrated a commitment to employee health, safety, and well-being; community programs; and ongoing outreach and data collection
to support issues management and mitigation. Yamana has established and continues to implement its various policies, procedures, and practices
in a manner broadly consistent with relevant IFC Performance Standards.
The results of this technical report are subject to variations
in operational conditions including, but not limited to the following:
·
Assumptions related to commodity and foreign exchange (in particular, the relative movement of gold and the Brazilian real/US dollar
exchange rate)
·
Unanticipated inflation of capital or operating costs
·
Significant changes in equipment productivities
·
Geological continuity of the mineralized structures
·
Geotechnical assumptions in pit and underground designs
·
Ore dilution or loss
·
Throughput and recovery rate assumptions
·
Changes in political and regulatory requirements that may affect the operation or future closure plans
·
Changes in closure plan costs
·
Availability of financing and changes in modelled taxes
In the opinion of the qualified persons, there are no reasonably
foreseen inputs from risks and uncertainties identified in the technical report that could affect the project’s continued economic
viability.
173
26
RECOMMENDATIONS
Based on the information presented in this technical report,
the qualified persons recommend the following action items.
Based on success in extending known mineral resources,
Yamana should continue exploration at the mining operations. Due to the quantity of material in the mineral reserve category and its impact
on mine life, Yamana’s focus is to continue infill drilling programs in support of converting mineral resources to mineral reserves.
An additional focus will be to carry out exploration programs in the vicinities of the current mines to search for the strike and depth
extensions of known mineralization.
Drilling programs should continue to be carried out with
the following objectives:
·
Replacing the mined-out material and growing the mineral reserve base through conversion of inferred mineral resources to indicated
and measured mineral resources. The focus of the drilling programs should be on the higher-grade sectors of the known mineralized zones.
·
Increasing the inferred mineral resources through conversion of material that has been identified by exploration drilling located
in close proximity to the current mining infrastructure into the inferred mineral resource category. The focus of this activity will be
on those areas which have grades above 3.0 g/t gold, with the goal of building a higher-grade inventory of inferred mineral resources.
·
Develop a long-term pipeline of brownfields exploration discoveries through testing of exploration targets.
·
Evaluate the known gold mineralization at the Jacobina Norte project with the goal of developing a greenfields mineral resource
target of over 1 Moz gold along the known strike length of 15 km.
Based on processing plant performance in the first quarter
of 2020, in which the processing plant throughput exceeded the Phase 1 Optimization target of 6,500 tpd, without the inclusion of the
benefits expected from the installation of all the plant modifications, Yamana should continue to evaluate the Phase 1 Optimization actual
performance and pursue further debottlenecking initiatives to determine the sustainable throughput level in excess of 6,500 tpd that the
mill can achieve without additional investment.
Based on the positive results of the Phase 2 Expansion
pre-feasibility study, Yamana should continue to advance the level of engineering for the Phase 2 Expansion and proceed to feasibility
study. The feasibility study should look to further improve operating costs and also take into account the actual realized potential under
the Phase 1 Optimization to determine the
174
true potential
of Phase 2 Expansion. In parallel to the Phase 2 Expansion feasibility study, Yamana should continue the application of permits
for the increased throughput capacity.
Yamana should continue to evaluate the suitability of alternative
mining methods and tailings as paste or hydraulic backfill, in addition to the use of multiple backfill types to optimize mining extraction.
Yamana has initiated a separate study outside the Phase 2 Expansion PFS to evaluate the installation of a backfill plant to allow up to
2,000 tpd of tailings to be deposited in underground voids. Preliminary results indicate that the project has the potential to reduce
the environmental footprint, extend the life of the existing tailing storage facility, and improve mining recovery, resulting in an increased
conversion of mineral resources to mineral reserves.
Regarding environmental and social management, SLR recommends
the following:
·
Conduct geochemical sampling and characterization of waste rock before developing a new waste rock stockpile.
·
Maintain a robust water quality monitoring program to verify compliance with applicable environmental standards and evaluate the
appropriateness of the water management strategies that are in place.
·
Continue to implement the environmental monitoring program, which monitors and manages potential environmental impacts resulting
from the mine operations, to inform future permit applications and mine closure plan updates.
·
Consider the implementation of a noise- and vibrations-monitoring program, consistent with the integrated 2016 HSEC Framework.
·
Consider establishing an energy and emissions strategy/plan to determine, on a defined frequency, sources of energy consumption
and associated greenhouse gas (GHG) emissions, consistent with the integrated 2016 HSEC Framework.
·
The existing sulphate/metals plume originating from the decommissioned TSF B1 may potentially cause ongoing effects on water. This
could result in long-term closure costs extending beyond the five-year post-closure treatment period that is currently outlined in the
conceptual 2018 mine closure plan. It is recommended that the closure cost estimate be reviewed as the closure plan and designs for both
TSF facilities are developed in more detail. Costs for long-term monitoring and maintenance of dams should also be reviewed.
·
Considering that, historically, mine site closures have the potential to result in significant economic impacts to a community,
a detailed social management plan should be developed to mitigate the economic and social effects of mine closure; this plan would include
ongoing consultation, training, and planning.
175
·
Incorporate a strategy for closure of the inactive open pit into the mine closure plan.
176
27
REFERENCES
Almeida FFM. 1977. O Cráton São
Francisco, SBG Rev Bras Geoc, São Paulo, v7, pp. 349-364.
Ausenco, 2020. Jacobina Phase 2 Expansion;
Final PFS Report; March 2020. Report prepared for Yamana Gold Inc., dated March 31, 2020. 124p.
Bateman JD. 1958. Uranium-Bearing
Auriferous Reefs at Jacobina, Brazil. Econ. Geol., vol. 53. pp. 417—425.
Canadian
Dam Association Dam Safety Guidelines 2007 (2013 Edition). Report available at www.cda.ca
Couto PA et al. 1978. Projeto Serra
de Jacobina: Geologia e Prospecção Geoquímica, Relatório Final, Salvador, CPRM, Convenio DNPM-CPRM, 415 p.
Cox DP. 1967. Regional Environment
of the Jacobina Auriferous Conglomerate, Brazil. Econ Geol., vol. 62, pp. 773—780.
DAM
Projetos de Engenharia. 2017. Barragem de Rejeitos de Jacobina. 4a. Etapa de Alteamento — El. 605 m Sequenciamento do Revestimento
do Reservatorio. JMC02-2390-C-RL-0066.
DAM
Projetos de Engenharia. 2020a. Barragem de Rejeitos de Jacobina. 4a. Manual de Operacao e Construca, TSF B2 — Phase V. JMC02-2390-C-MO-0004.
DAM
Projetos de Engenharia. 2020b. Barragem de Rejeitos de Jacobina. 5a. Etapa de Alteamento — El. 620 m. JMC02-2390-C-RL-0092.
E-Mining
Technology S.A. 2016. Abaco de Estimación de Largo de Caserón Abierto, Mina João Belo, Minera Jacobina. PowerPoint
presentation, June 2016.
GeoHydroTech Engenharia. 2019. Barragem
de Rejitos B2, Relatório de Inspeção de Segurança Regular. September 2019.
Golder Associates. 2008. Report on
Mineral Resource and Mineral Reserve Update for the Canavieiras, Serra do Córrego, Morro do Vento and João Belo Deposits, Jacobina
Mine, Bahia State, Brazil. Technical Report for Yamana Gold Inc., March 2008, 127 p.
Griffon JC. 1967. Apresentação
do Mapa Geológico (1:100,000) da parte Central da Serra de Jacobina (Bahia). In XXI Congresso Brasiliero de Geologia, Programa,
Resumo das Comunicações, Roteiro das Excursões, SGB, Curitiba, pp. 33—34.
Gross WH. 1968. Evidence for a Modified
Placer Origin for Auriferous Conglomerates, Canavierias Mine, Jacobina, Brazil. Econ. Geol., vol. 63, pp. 271—276.
177
Hace.
2019. Relatório Técnico Solicitação de Licença de Alteração Expansão da Planta Metalúrgica.
Modernização e Ampliação da Capacidade Instalada. Yamana Gold. Unidade: Jacobina Mineração e Comércio
(JMC). December 5, 2019.
ICMM (International Council on Mining
and Metals). 2008. Planning for Integrated Mine Closure: toolkit.
Karpeta WP. 2004. A Comparison Between
the Witwatersrand, Tarkwa and Jacobina Basins. Internal report, Desert Sun.
Ledru
GW, Cox DP, and Carvalho JPP. 1964. Geologia da Parte Sul da Serra de Jacobina, Bahia, Brasil, Rio de Janeiro, DNPM/DGM, Boletim
No. 209, 87 p.
Ledru P, Milesi JP, Johan V, Sabate
P, and Maluski H. 1997. Foreland Basins and Gold-Bearing Conglomerates: A New Model for the Jacobina Basin (Sao Francisco Province, Brazil).
Precambrian Research, vol. 86, Issues 3—4, 22 December 1997. pp. 155—176.
Mascarenhas JF, Ledru P, de Souza
SL, Conceição Filho VM, Melo LFA, Lorenzo CL, and Milesi JP. 1998. Geologia e Recursos Minerais do Groupo Jacobina e da Parte
Sul do Greenstone Belt de Mundo Novo, Salvador, CBPM, Série Arquivos Abertos, vol. 13. 58 p.
MDGEO Servicos de Hidrogeologia Ltda.,
2018. Relatorio de Avaliacao de Perfromance da Barreira Hidraulica. Jacobina Mineracao e Comercio, Jacobina, BA. November 2018.Mello
R and Petter R. 2007. Mineral Resource and Mineral Reserve Estimate Update for Canavieiras, Serra do Córrego, Morro do Vento and
João Belo, Jacobina Mine, as of December 31, 2006. Technical Report by NCL Brasil for Yamana Gold Inc., February 2007.
132 p
Milesi JP, Ledru P, Marcoux E, Mougeot
R, Johan V, Lerouge C, Sabaté P, Bailly L, Respaut JP, and Skipwith P. 2002. The Jacobina Paleoproterozoic Gold-Bearing Conglomerates,
Bahia, Brazil; a “Hydrothermal Shear-Reservoir Model”, Ore Geology Reviews 19 (2002). pp. 95—136.
Minter WEL. 1975. Sedimentological
Aspects of the Serra do Córrego Formation with Particular Reference to the Main Reef Unit at Cuscuz and Morro do Vento near Jacobina,
Bahia, Brazil. Unpublished report by Anglo American. 11 p.
Molinari L, Gama HB, and Schettini
P. 1986. Estratigrafia do Groupo Jacobina. Unpublished report by Mineração Morro Velho.
Moreno R. 2007. Pindobaçu Project,
Resource Estimate Report, Pindobaçu District, Brazil. Mineral Resource Report by Moreno & Associates for Jacobina Mineração
e Comércio S. A., January 2007. 99 p.
Navarro F, Baeza D, Herreros D, and
Valencia M. 2016. Calculating Ore Resources on Complex Geology Using a Geometric Restitution Methodology: In Modelling to the Estimation:
1st International Conference on Mining. 11 p.
178
Navarro F, Garrido M, González
C, Baeza D, Soto F, Herreros D, Valencia M, and Egaña A. 2017, 10 p.
Oram WG. 1975. A Preliminary Sedimentological
Study of the Serra do Córrego Formation at Jacobina, Brazil. Unpublished report by Anglo American. 22 pp.
Pearson W, Moura de Macedo P, Rubio
A, Lorenzo C, and Karpeta P. 2005. Geology and Gold Mineralization of the Jacobina Mine and Bahia Gold Belt, Bahia, Brazil and a Comparison
to Tarkwa and Witwatersrand; in Rhoden, H.N., Steininger, R.C., and Vikre, P.G., editors, Geological Society of Nevada Symposium
2005, pp. 757—785.
Pressacco R and Hennessey BT. 2007.
An Updated Mineral Resource Estimate and Results of 2006 Exploration Program for the João Belo Mine, Jacobina Mine Project, Bahia
State, Brazil. Technical Report by Micon International Limited for Yamana Gold Inc., February 2007. 202 pp.
Ramachandran P and Varoquaux G. 2011.
Mayavi: 3D Visualization of Scientific Data: IEEE Computing in Science & Engineering, pp. 40—51.
RPA Inc. 2014. Technical Report on
the Jacobina Mine Complex, Bahia State, Brazil: Unpublished Internal Yamana Gold Inc. Report, 157 p.
RPA Inc. 2018. Technical Report on
the Jacobina Mine Complex, Bahia State, Brazil: Unpublished Internal Yamana Gold Inc. Report, 164 p.
RPA Inc. 2019. Technical Report on
the Jacobina Mine Complex, Bahia State, Brazil. National Instrument 43-101 Technical Report dated September 30, 2019, with an effective
date of June 30, 2019. 77 p. Report available on Sedar.
SETE. 2018. Actualização
do Plano Conceitual Ambiental de Fechamiento de Mina — PFM (Update of Conceptual Environmental Mine Closure Plan). December 2018.
Strydom PM and Minter WEL. 1976. A
Stratigraphic and Sedimentological Report of the Main Reef in the Itapicurú Prospect near Jacobina, Bahia, Brazil. Unpublished report
by Anglo American, 20 p.
Teixeira JBG, Souza JAB, da Silva
MdG, et al,. 1999, Metalogênese dos depósitos auíferos na Região Central da Serra de Jacobina, Bahia, Relatório
Técnico preparado para a [Technical Report prepared for] William Resources Inc., Salvador. 39 pp.
Teixeira JBG, de Souza JAB, da Silva
MdG, Leite CMM, Barbosa JSF, Coelho CES, Abram MB, Filho VMC, and Iyer SSS. 2001. Gold Mineralization in the Serra de Jacobina Region,
Bahia, Brazil: Tectonic Framework and Metallogenesis, Mineralium Deposita (2001) 36, pp. 322—344.
179
Teles G, Chemale Jr F, Oliveira CG.
2014. Paleoarchean record of the detrital pyrite-bearing, Jacobina Au-U deposit, Bahia, Brazil. Precambrian Research, pp. 289—313.
Vick S. 2018. Dam Safety Review Jacobina
Tailings Storage Facility and Joao Belo Mine Waste Facility, Jacobina, Brazil. November 19, 2018
Yamana. 2016. Integrated HSEC Framework.
Version 1.0, April 2016.
Yamana. 2020. Relatório Técnico
de Garantia Ambiental — RTGA. Ano-Base 2019. March 2020.
180
28
CERTIFICATES OF QUALIFIED PERSONS
CERTIFICATE OF QUALIFIED PERSON — EDUARDO
DE SOUZA SOARES
I, Eduardo de Souza Soares, MAusIMM CP (Min), as an author of this
report entitled “NI 43-101 Technical Report, Jacobina Gold Mine, Bahia State, Brazil” prepared for Yamana Gold Inc. (the Issuer)
and dated effective as of December 31, 2019 (the Technical Report), do hereby certify the following:
1.
I am Coordinator Technical Services at Jacobina Mineração e Comércio, a subsidiary of the Issuer, with an office
at Itapicuru Farm, rural zone, Jacobina, Bahia, Brazil.
2.
I graduated from the Universidade Federal de Bahia in 2011 with a Bachelor’s degree in mining engineering and I obtained a
Master of Business Administration from the Fundação Getulio Vargas in 2017. I am Chartered Professional Member of the Australasian
Institute of Mining and Metallurgy (AusIMM) — MAusIMM CP(Min): 328085. I have practiced my profession continuously since 2011. My
relevant experience for the purpose of the Technical Report includes the following:
·
Mining engineer at Yamana Gold Inc. operation in charge of mine design, sequencing, budgeting, and forecast.
·
Planning, organizing, and coordination of mine planning, ensuring compliance with operational procedures and health and safety
guidelines.
3.
I have read the definition of “qualified person” set out in National Instrument 43-101 (NI 43-101) and certify that by
reason of my education, affiliation with a professional association (as defined in NI 43-101), and past relevant work experience, I
fulfill the requirements to be a “qualified person” for the purposes of NI 43-101.
4.
I work at the project and was most recently at the project between May 10 and 21, 2020.
5.
I am responsible for Sections 13, 15 to 19 (excluding sub-section 18.2), 21 to 22, 24, and share responsibility for related disclosure
in Sections 1, 25, 26, and 27 of the Technical Report.
6.
I am not independent of the Issuer. I am a full-time employee of Jacobina Mineração e Comércio, a subsidiary of
the Issuer.
7.
I have had prior involvement with the property that is the subject of the Technical Report in my role as Coordinator Technical
Services at the project.
8.
I have read NI 43-101 and the sections of Technical Report for which I am responsible have been prepared in compliance with NI
43-101 and Form 43-101F1.
9.
At the effective date of the Technical Report, to the best of my knowledge, information, and belief, Sections 13, 15 to 19 (excluding
sub-section 18.2), 21 to 22, 24, and related disclosure in Sections 1, 25, 26, and 27 in the Technical Report for which I am responsible
contain all the scientific and technical information that is required to be disclosed to make the Technical Report not misleading.
| “Signed” |
|
| Eduardo de Souza Soares, MAusIMM CP(Min) |
Dated this 29th day of May, 2020 |
181
CERTIFICATE OF QUALIFIED PERSON — RENAN
GARCIA LOPES
I, Renan Garcia Lopes, MAusIMM CP (Geo), as an author of this report
entitled “NI 43-101 Technical Report, Jacobina Gold Mine, Bahia State, Brazil” prepared for Yamana Gold Inc. (the Issuer) and
dated effective as of December 31, 2019 (the Technical Report), do hereby certify the following:
1.
I am Senior Geologist at Jacobina Mineração e Comércio, a subsidiary of the Issuer, with an office at Itapicuru
Farm, rural zone, Jacobina, Bahia, Brazil.
2.
I graduated from the University of São Paulo in 2010 with a B.Sc. and I obtained a M.Sc. degree from the same university in
2016. I am a Chartered Professional Member of the Australasian Institute of Mining and Metallurgy (AusIMM) — MAusIMM CP(Geo): 328085.
I have practiced my profession continuously since 2010. My relevant experience for the purpose of the Technical Report includes the following:
·
Reviewing and reporting as a consultant and employee on numerous exploration and mining projects around the world for due diligence
and regulatory requirements, including preparation of mineral resource estimates and NI 43-101 technical reports.
·
Execution of numerous assignments in a variety of deposit types and a variety of geological environments; commodities include Au,
Zn, Mn, Al, Fe and industrial minerals.
·
Senior position with major multinational mining companies in South America, focusing on geostatistical studies, geological modelling,
and resource modelling.
3.
I have read the definition of “qualified person” set out in National Instrument 43-101 (NI 43-101) and certify that by
reason of my education, affiliation with a professional association (as defined in NI 43-101), and past relevant work experience, I
fulfill the requirements to be a “qualified person” for the purposes of NI 43-101.
4.
I work at the project and was most recently at the project on March 18, 2020.
5.
I am responsible for Sections 11, 12 and 14, and share responsibility for related disclosure in Sections 1, 25, 26, and 27 of the
Technical Report.
6.
I am not independent of the Issuer. I am a full-time employee of Jacobina Mineração e Comércio, a subsidiary of
the Issuer.
7.
I have had prior involvement with the property that is the subject of the Technical Report in my role as Senior Geologist at the
project.
8.
I have read NI 43-101 and the sections of Technical Report for which I am responsible have been prepared in compliance with NI
43-101 and Form 43-101F1.
9.
At the effective date of the Technical Report, to the best of my knowledge, information, and belief, Sections 11, 12, 14, and related
disclosure in Sections 1, 25, 26, and 27 in the Technical Report for which I am responsible contain all the scientific and technical information
that is required to be disclosed to make the Technical Report not misleading.
| “Signed” |
|
| Renan Garcia Lopes, MAusIMM CP(Geo) |
Dated this 29th day of May, 2020 |
182
CERTIFICATE OF QUALIFIED PERSON — HENRY
MARSDEN
I, Henry Marsden, P.Geo., as an author of this report entitled “NI
43-101 Technical Report, Jacobina Gold Mine, Bahia State, Brazil” prepared for Yamana Gold Inc. (the Issuer) and dated effective
as of December 31, 2019 (the Technical Report), do hereby certify the following:
1.
I am Senior Vice President, Exploration of the Issuer, with an office at Royal Bank Plaza, North Tower, 200 Bay Street, Suite 2200,
Toronto, Ontario M5J 2J3.
2.
I graduated from the University of British Columbia with a Bachelor of Science degree in Geology in 1987 and I graduated from Carleton
University, Ottawa, Ontario, with a Master of Science degree in Earth Sciences in 1991; I am a Professional Geologist registered with
the Association of Professional Geoscientists of Ontario (APGO #0885). My relevant experience for the purpose of the Technical Report
includes the following:
·
I have worked as a geologist for over 30 years since my graduation, including more than 20 years as a consulting geologist working
with a variety of clients and focusing on field exploration work.
·
I have played a key role in the discovery and advancement of several mineral deposits including Rio Blanco and Pico Machay in Peru,
and the Timmins West gold deposit in Timmins, Ontario.
3.
I have read the definition of “qualified person” set out in National Instrument 43-101 (NI 43-101) and certify that by
reason of my education, affiliation with a professional association (as defined in NI 43-101), and past relevant work experience, I
fulfill the requirements to be a “qualified person” for the purposes of NI 43-101.
4.
I visited the Jacobina project on six occasions since January 2017 and most recently between September 12 and 14, 2019.
5.
I am responsible for Sections 2 to 10, 23, and share responsibility for related disclosure in Sections 1, 25, 26, and 27 of the
Technical Report.
6.
I am not independent of the Issuer. I am a full-time employee of the Issuer.
7.
I have had prior involvement on the property in my role with the Issuer.
8.
I have read NI 43-101 and the sections of Technical Report for which I am responsible have been prepared in compliance with NI
43-101 and Form 43-101F1.
9.
At the effective date of the Technical Report, to the best of my knowledge, information, and belief, Sections 2 to 10, 23, and
related disclosure in Sections 1, 25, 26, and 27 in the Technical Report for which I am responsible contain all the scientific and technical
information that is required to be disclosed to make the Technical Report not misleading.
| “Signed” |
|
| Henry Marsden, P.Geo. |
Dated this 29th day of May, 2020 |
183
CERTIFICATE OF QUALIFIED PERSON — LUIS
VÁSQUEZ
I, Luis Vasquez, P.Eng, as an author of this report entitled “NI
43-101 Technical Report, Jacobina Gold Mine, Bahia State, Brazil” prepared for Yamana Gold Inc. (the Issuer) and dated effective
as of December 31, 2019 (the Technical Report), do hereby certify the following:
1.
I am a Senior Hydrotechnical Engineer with SLR Consulting (Canada) Ltd., at 36 King St. East 4th Floor in Toronto, ON, M5C 1E5.
2.
I am a graduate of Universidad de Los Andes, Bogotá, Colombia, in 1998 with a B.Sc. degree in Civil Engineering. I am registered
as a Professional Engineer in the Province of Ontario (Reg. #100210789). I have worked as a as a Civil Engineer on mining-related projects
for a total of 15 years since my graduation. My relevant experience for the purpose of the Technical Report includes the following:
·
Preparation of numerous environmental impact assessments for regulatory approval of mining projects located in Canada and South
America.
·
Preparation of multiple mine closure plans for mining projects in Canada and South America.
·
Preparation of several scoping, pre-feasibility, feasibility, and detailed design level studies for projects located in North America,
South America, the Caribbean, and Asia, with a focus on planning, design, and safe operation of water management systems.
3.
I have read the definition of “qualified person” set out in National Instrument 43-101 (NI 43-101) and certify that by
reason of my education, affiliation with a professional association (as defined in NI 43-101) and past relevant work experience, I
fulfill the requirements to be a “qualified person” for the purposes of NI 43-101.
4.
I have not visited the Jacobina project due to travel restrictions related to the global COVID-19 pandemic.
5.
I am responsible for Section 20 (excluding sub-section 20.2.2) and share responsibility for related disclosure in Sections
1, 25, 26, and 27 of the Technical Report.
6.
I am independent of the Issuer.
7.
I have had no prior involvement with the property that is the subject of the Technical Report.
8.
I have read NI 43-101 and the sections of Technical Report for which I am responsible have been prepared in compliance with NI
43-101 and Form 43-101F1.
9.
At the effective date of the Technical Report, to the best of my knowledge, information, and belief, Section 20 (excluding
sub-section 20.2.2) and related disclosure in Sections 1, 25, 26, and 27 in the Technical Report for which I am responsible contain all
the scientific and technical information that is required to be disclosed to make the Technical Report not misleading.
| “Signed” |
|
| Luis Vásquez, P.Eng. |
Dated this 29th day of May, 2020 |
184
CERTIFICATE OF QUALIFIED PERSON — CARLOS
ITURRALDE
I, Carlos Iturralde, P.Eng., as an author of this report entitled “NI
43-101 Technical Report, Jacobina Gold Mine, Bahia State, Brazil” prepared for Yamana Gold Inc. (the Issuer) and dated effective
as of December 31, 2019 (the Technical Report), do hereby certify the following:
1.
I am Director, Tailings of the Issuer, with an office at Royal Bank Plaza, North Tower,200 Bay Street, Suite 2200, Toronto,
Ontario M5J 2J3
2.
I graduated from the University of Kansas with a dual major in Civil Engineering and Mathematics in 2002. I received a MSc. from
the University of Tübingen in Applied Environmental Geosciences in 2007. I am a professional engineer registered with Engineers and
Geoscientist British Columbia since 2010 (License # 40153). I have over 17 years of professional experience in the mining industry
in technical and management aspects related to tailings management and related infrastructure. The following aspects of my experience
are relevant for the purpose of the Technical Report:
·
Completion of design and engineering studies and dam safety reviews of tailings facilities
·
Best management practices following the Mining Association of Canada (MAC) and Canadian Dam Association (CDA) proposed framework
and dam safety criteria.
·
Implementation of risk management and quality management strategies, including QA/QC programs and risk evaluation and mitigation
through identification of critical controls.
·
Since 2015, I have been an active member of MAC’s tailings working group (TWG) and participated in the development of
the 3rd edition of MAC’s tailings management guidelines.
3.
I have read the definition of “qualified person” set out in National Instrument 43-101 (NI 43-101) and certify that by
reason of my education, affiliation with a professional association (as defined in NI 43-101) and past relevant work experience, I
fulfill the requirements to be a “qualified person” for the purposes of NI 43-101.
4.
I have not visited the project due to travel restrictions related to the global COVID-19 pandemic.
5.
I am responsible for Sections 18.2 and 20.2.2 and share responsibility for related disclosure in Sections 1, 25, 26, and 27 of
the Technical Report.
6.
I am not independent of the Issuer. I am a full-time employee of the Issuer.
7.
I have had no prior involvement with the property that is the subject of the Technical Report.
8.
I have read NI 43-101, and the sections of Technical Report for which I am responsible have been prepared in compliance with NI
43-101 and Form 43-101F1.
9.
At the effective date of the Technical Report, to the best of my knowledge, information, and belief, Sections 18.2 and 20.2.2
and related disclosure in Sections 1, 25, 26, and 27 in the Technical Report for which I am responsible contain all the scientific and
technical information that is required to be disclosed to make the Technical Report not misleading.
| “Signed” |
|
| Carlos Iturralde, P.Eng. |
Dated this 29th day of May, 2020 |
185
APPENDIX A — MINERAL TITLE
Mining concessions
| Licence |
|
Process Number |
|
Area
(ha) |
|
Application Date |
|
| 416 |
|
004.951/35 |
|
889.14 |
|
1935 |
|
| 239 |
|
815.706/72 |
|
821.19 |
|
1972 |
|
| 206 |
|
815.708/72 |
|
532.86 |
|
1972 |
|
| 1128 |
|
815.710/72 |
|
1,000.00 |
|
1972 |
|
| 1461 |
|
815.712/72 |
|
1,000.00 |
|
1972 |
|
| 157 |
|
815.714/72 |
|
903.75 |
|
1972 |
|
| 608 |
|
815.715/72 |
|
807.5 |
|
1972 |
|
| Total |
|
|
|
5,954.44 |
|
|
|
Mining claim
| Licence |
|
Process
Number |
|
Area
(ha) |
|
Final Report
Submission |
|
Final Report
Approval |
|
Status |
|
| 1236 |
|
800.602/78 |
|
650 |
|
27/12/1989 |
|
19/08/2003 |
|
Mining Claim |
|
Note: Application for Mining Concession submitted on
May 12, 2006.
Exploration permits
JMC Land
Control |
|
Area (ha) |
|
Application
Date |
|
ANM
Exploration
Permit No |
|
Expiry Date |
|
Status |
| 870.188/03 |
|
1,696 |
|
10/02/2003 |
|
4996 |
|
|
|
Under review by ANM |
| 871.652/09 |
|
770 |
|
13/07/2009 |
|
8,543 |
|
|
|
Under review by ANM |
| 872.072/07 |
|
5 |
|
20/06/2007 |
|
232 |
|
|
|
Under review by ANM |
| 870.770/12 |
|
1,695 |
|
22/03/2012 |
|
8,688 |
|
12/09/2021 |
|
Renewal Approved |
| 870.771/12 |
|
50 |
|
22/03/2012 |
|
8,689 |
|
03/10/2021 |
|
Renewal Approved |
| 870.323/14 |
|
894 |
|
20/03/2014 |
|
7,626 |
|
04/01/2021 |
|
Renewal Approved |
| 870.479/13 |
|
1,919 |
|
08/03/2013 |
|
10,367 |
|
03/10/2021 |
|
Renewal Approved |
| 870.480/13 |
|
1,840 |
|
08/03/2013 |
|
10,368 |
|
03/10/2021 |
|
Renewal Approved |
| 870.481/13 |
|
1,885 |
|
08/03/2013 |
|
10,369 |
|
12/09/2021 |
|
Renewal Approved |
| 870.482/13 |
|
1,854 |
|
08/03/2013 |
|
10,370 |
|
12/09/2021 |
|
Renewal Approved |
| 870.483/13 |
|
1,607 |
|
08/03/2013 |
|
10,371 |
|
12/09/2021 |
|
Renewal Approved |
| 870.484/13 |
|
1,638 |
|
08/03/2013 |
|
10,372 |
|
14/11/2021 |
|
Renewal Approved |
| 870.485/13 |
|
1,715 |
|
08/03/2013 |
|
10,373 |
|
12/09/2021 |
|
Renewal Approved |
| 870.118/12 |
|
349 |
|
17/01/2012 |
|
8,423 |
|
22/08/2021 |
|
Renewal Approved |
| 872.264/12 |
|
193 |
|
23/10/2012 |
|
9,295 |
|
12/09/2021 |
|
Renewal Approved |
| 872.116/12 |
|
2,000 |
|
08/10/2012 |
|
9,252 |
|
03/10/2021 |
|
Renewal Approved |
| 872.117/12 |
|
2,000 |
|
08/10/2012 |
|
9,253 |
|
03/10/2021 |
|
Renewal Approved |
JMC Land
Control |
|
Area (ha) |
|
Application
Date |
|
ANM
Exploration
Permit No |
|
Expiry Date |
|
Status |
| 872.118/12 |
|
1,825 |
|
08/10/2012 |
|
9,254 |
|
03/10/2021 |
|
Renewal Approved |
| 872.119/12 |
|
630 |
|
08/10/2012 |
|
9,255 |
|
22/08/2021 |
|
Renewal Approved |
| 872.120/12 |
|
1,911 |
|
08/10/2012 |
|
9,256 |
|
03/10/2021 |
|
Renewal Approved |
| 872.125/12 |
|
1,406 |
|
08/10/2012 |
|
9,257 |
|
03/10/2021 |
|
Renewal Approved |
| 872.142/12 |
|
597 |
|
10/10/2012 |
|
9,258 |
|
31/12/2020 |
|
Under review by ANM |
| 872.143/12 |
|
273 |
|
10/10/2012 |
|
9,259 |
|
12/09/2021 |
|
Renewal Approved |
| 871.460/14 |
|
701 |
|
26/08/2014 |
|
15,188 |
|
12/09/2021 |
|
Renewal Approved |
| 870.889/13 |
|
547 |
|
18/04/2013 |
|
14,555 |
|
03/10/2021 |
|
Renewal Approved |
| 872.067/15 |
|
821 |
|
23/09/2015 |
|
16,555 |
|
12/09/2021 |
|
Renewal Approved |
| 871.447/16 |
|
528 |
|
12/07/2016 |
|
11,196 |
|
31/12/2020 |
|
Under review by ANM |
| 871.448/16 |
|
682 |
|
12/07/2016 |
|
11,197 |
|
31/12/2020 |
|
Under review by ANM |
| 871.467/16 |
|
686 |
|
12/07/2016 |
|
10,970 |
|
31/12/2020 |
|
Under review by ANM |
| 871.472/16 |
|
968 |
|
12/07/2016 |
|
10,971 |
|
31/12/2020 |
|
Under review by ANM |
| 871.477/16 |
|
1,695 |
|
12/07/2016 |
|
11,417 |
|
31/12/2020 |
|
Under review by ANM |
| 871.520/16 |
|
553 |
|
14/07/2016 |
|
11,420 |
|
31/12/2020 |
|
Under review by ANM |
| 871.533/16 |
|
443 |
|
14/07/2016 |
|
10,978 |
|
31/12/2020 |
|
Under review by ANM |
| 871.539/16 |
|
579 |
|
14/07/2016 |
|
60 |
|
31/12/2020 |
|
Under review by ANM |
| 871.854/16 |
|
1,208 |
|
11/08/2016 |
|
2,098 |
|
31/12/2020 |
|
Under review by ANM |
| 871.855/16 |
|
211 |
|
11/08/2016 |
|
2,099 |
|
31/12/2020 |
|
Under review by ANM |
| 871.858/16 |
|
779 |
|
11/08/2016 |
|
2,101 |
|
15/04/2023 |
|
Renewal Approved |
| 871.859/16 |
|
713 |
|
11/08/2016 |
|
2,102 |
|
15/04/2023 |
|
Renewal Approved |
| 871.860/16 |
|
1,948 |
|
11/08/2016 |
|
2,103 |
|
31/12/2020 |
|
Under review by ANM |
| 871.861/16 |
|
267 |
|
11/08/2016 |
|
2,104 |
|
31/12/2020 |
|
Under review by ANM |
| 871.862/16 |
|
1,365 |
|
11/08/2016 |
|
2,105 |
|
31/12/2020 |
|
Under review by ANM |
| 871.863/16 |
|
831 |
|
11/08/2016 |
|
2,106 |
|
15/04/2023 |
|
Renewal Approved |
| 871.865/16 |
|
875 |
|
11/08/2016 |
|
2,276 |
|
31/12/2020 |
|
Under review by ANM |
| 871.868/16 |
|
1,000 |
|
11/08/2016 |
|
2,277 |
|
15/04/2023 |
|
Renewal Approved |
| 871.905/16 |
|
1,420 |
|
12/08/2016 |
|
2,582 |
|
15/04/2023 |
|
Renewal Approved |
| 872.549/16 |
|
1,009 |
|
10/11/2016 |
|
1,593 |
|
27/03/2023 |
|
Renewal Approved |
| 872.551/16 |
|
1,721 |
|
10/11/2016 |
|
1,594 |
|
31/12/2020 |
|
Under review by ANM |
| 872.554/16 |
|
1,421 |
|
10/11/2016 |
|
1,595 |
|
31/12/2020 |
|
Under review by ANM |
| 872.559/16 |
|
451 |
|
10/11/2016 |
|
1,596 |
|
27/03/2023 |
|
Renewal Approved |
| 872.600/16 |
|
263 |
|
21/11/2016 |
|
1,597 |
|
20/03/2020 |
|
Under review by ANM |
| 872.441/16 |
|
951 |
|
07/11/2016 |
|
1,572 |
|
27/03/2023 |
|
Renewal Approved |
| 872.450/16 |
|
219 |
|
07/11/2016 |
|
1,576 |
|
31/12/2020 |
|
Under review by ANM |
| 872.455/16 |
|
1,614 |
|
07/11/2016 |
|
1,577 |
|
31/12/2020 |
|
Under review by ANM |
| 870.693/17 |
|
1,447 |
|
17/03/2017 |
|
6,248 |
|
21/08/2020 |
|
Permit Granted |
| 870.694/17 |
|
1,261 |
|
17/03/2017 |
|
6,249 |
|
21/08/2020 |
|
Permit Granted |
| 870.505/17 |
|
73 |
|
21/02/2017 |
|
9,345 |
|
21/12/2020 |
|
Permit Granted |
| 870.770/17 |
|
20 |
|
28/03/2017 |
|
9,347 |
|
21/12/2020 |
|
Permit Granted |
| 870.792/17 |
|
654 |
|
30/03/2017 |
|
9,349 |
|
21/12/2020 |
|
Permit Granted |
JMC Land
Control |
|
Area (ha) |
|
Application
Date |
|
ANM
Exploration
Permit No |
|
Expiry Date |
|
Status |
| 870.793/17 |
|
322 |
|
30/03/2017 |
|
9,350 |
|
21/12/2020 |
|
Permit Granted |
| 872.211/17 |
|
1,875 |
|
20/12/2017 |
|
3,140 |
|
07/05/2021 |
|
Permit Granted |
| 871.362/17 |
|
1,618 |
|
29/06/2017 |
|
9,408 |
|
21/12/2020 |
|
Permit Granted |
| 872.448/16 |
|
123 |
|
07/11/2016 |
|
238 |
|
07/01/2022 |
|
Permit Granted |
| 871.106/18 |
|
598 |
|
30/07/2018 |
|
274 |
|
07/01/2022 |
|
Permit Granted |
| 871.107/18 |
|
1,864 |
|
30/07/2018 |
|
275 |
|
07/01/2022 |
|
Permit Granted |
| 871.108/18 |
|
1,337 |
|
30/07/2018 |
|
276 |
|
07/01/2022 |
|
Permit Granted |
| 871.109/18 |
|
517 |
|
30/07/2018 |
|
277 |
|
07/01/2022 |
|
Permit Granted |
| 871.305/18 |
|
42 |
|
04/09/2018 |
|
1,397 |
|
03/04/2022 |
|
Permit Granted |
| 871.448/18 |
|
25 |
|
18/09/2018 |
|
2,008 |
|
29/04/2022 |
|
Permit Granted |
| 871.496/18 |
|
582 |
|
25/09/2018 |
|
2,019 |
|
29/04/2022 |
|
Permit Granted |
| 871.497/18 |
|
578 |
|
25/09/2018 |
|
2,020 |
|
29/04/2022 |
|
Permit Granted |
| 871.586/18 |
|
1,989 |
|
09/10/2018 |
|
2,031 |
|
29/04/2022 |
|
Permit Granted |
| 871.498/18 |
|
804 |
|
25/09/2018 |
|
2,021 |
|
29/04/2022 |
|
Permit Granted |
| 871.449/18 |
|
100 |
|
18/09/2018 |
|
4,894 |
|
26/08/2022 |
|
Permit Granted |
| Total |
|
71,045 |
|
|
|
|
|
|
|
|
Exhibit 99.2
Filed by SEDAR
Carlos Iturralde
Yamana Gold Inc.
Royal Bank Plaza, North Tower
200 Bay Street, Suite 2200
Toronto, ON, M5J 2J3
CONSENT OF QUALIFIED PERSON
I, Carlos Iturralde, P.Eng., consent to the public
filing of the technical report titled “NI 43-101 Technical Report, Jacobina Gold Mine, Bahia State, Brazil” and dated December
31, 2019 (the “Technical Report”) by the Yamana Gold Inc.
I also consent to any extracts from or a summary
of the Technical Report in the press release dated May 6, 2020 of Yamana Gold Inc. (the “Press Release”).
I certify that I have read the Press Release and
that it fairly and accurately represents the information in the sections of the Technical Report for which I am responsible.
Dated this 29th day of May, 2020.
| “Carlos Iturralde” |
|
| Carlos Iturralde, P.Eng. |
|
Exhibit 99.3
Filed by SEDAR
Renan Garcia Lopes
Yamana Gold Inc.
Royal Bank Plaza, North Tower
200 Bay Street, Suite 2200
Toronto, ON, M5J 2J3
CONSENT OF QUALIFIED PERSON
I, Renan Garcia Lopes, MAusIMM CP (Geo), consent
to the public filing of the technical report titled “NI 43-101 Technical Report, Jacobina Gold Mine, Bahia State, Brazil”
and dated December 31, 2019 (the “Technical Report”) by the Yamana Gold Inc.
I also consent to any extracts from or a summary
of the Technical Report in the press release dated May 6, 2020 of Yamana Gold Inc. (the “Press Release”).
I certify that I have read the Press Release and
that it fairly and accurately represents the information in the sections of the Technical Report for which I am responsible.
Dated this 29th day of May, 2020.
| “Renan Garcia Lopes” |
|
| Renan Garcia Lopes, MAusIMM CP (Geo) |
|
Exhibit 99.4
Filed by SEDAR
Henry Marsden
Yamana Gold Inc.
Royal Bank Plaza, North Tower
200 Bay Street, Suite 2200
Toronto, ON, M5J 2J3
CONSENT OF QUALIFIED PERSON
I, Henry Marsden, P.Geo., consent to the public
filing of the technical report titled “NI 43-101 Technical Report, Jacobina Gold Mine, Bahia State, Brazil” and dated December
31, 2019 (the “Technical Report”) by the Yamana Gold Inc.
I also consent to any extracts from or a summary
of the Technical Report in the press release dated May 6, 2020 of Yamana Gold Inc. (the “Press Release”).
I certify that I have read the Press Release and
that it fairly and accurately represents the information in the sections of the Technical Report for which I am responsible.
Dated this 29th day of May, 2020.
| “Henry Marsden” |
|
| Henry Marsden, P.Geo. |
|
Exhibit 99.5
Filed by SEDAR
Eduardo de Souza Soares
Yamana Gold Inc.
Royal Bank Plaza, North Tower
200 Bay Street, Suite 2200
Toronto, ON, M5J 2J3
CONSENT OF QUALIFIED PERSON
I, Eduardo de Souza Soares, MAusIMM CP (Min),
consent to the public filing of the technical report titled “NI 43-101 Technical Report, Jacobina Gold Mine, Bahia State, Brazil”
and dated December 31, 2019 (the “Technical Report”) by the Yamana Gold Inc.
I also consent to any extracts from or a summary
of the Technical Report in the press release dated May 6, 2020 of Yamana Gold Inc. (the “Press Release”).
I certify that I have read the Press Release and
that it fairly and accurately represents the information in the sections of the Technical Report for which I am responsible.
Dated this 29th day of May, 2020.
| “Eduardo de Souza
Soares” |
|
| Eduardo de Souza Soares, MAusIMM CP
(Min) |
|
Exhibit 99.6
Filed by SEDAR
CONSENT OF QUALIFIED PERSON
I, Luis Vasquez, P.Eng., consent to the public
filing of the technical report titled “NI 43-101 Technical Report, Jacobina Gold Mine, Bahia State, Brazil” and dated December
31, 2019 (the “Technical Report”) by the Yamana Gold Inc.
I also consent to any extracts from or a summary
of the Technical Report in the press release dated May 6, 2020 of Yamana Gold Inc. (the “Press Release”).
I certify that I have read the Press Release and
that it fairly and accurately represents the information in the sections of the Technical Report for which I am responsible.
Dated this 29th day of May, 2020.
| “Signed" |
|
| Luis Vasquez, P.Eng. |
|
Pan American Silver (NYSE:PAAS)
Historical Stock Chart
From Sep 2024 to Oct 2024

Pan American Silver (NYSE:PAAS)
Historical Stock Chart
From Oct 2023 to Oct 2024
