false
0000752642
0000752642
2024-08-06
2024-08-06
0000752642
UMH:CommonStock0.10ParValueMember
2024-08-06
2024-08-06
0000752642
UMH:Sec6.375SeriesDCumulativeRedeemablePreferredStock0.10ParValueMember
2024-08-06
2024-08-06
iso4217:USD
xbrli:shares
iso4217:USD
xbrli:shares
UNITED
STATES
SECURITIES
AND EXCHANGE COMMISSION
Washington,
D.C. 20549
FORM
8-K
CURRENT
REPORT
Pursuant
to Section 13 or 15(d) of The Securities Exchange Act of 1934
Date
of Report (Date of earliest event reported): August 6, 2024
UMH
Properties, Inc.
(Exact
name of registrant as specified in its charter)
| Maryland |
|
001-12690 |
|
22-1890929 |
| (State
or other jurisdiction |
|
(Commission |
|
(IRS
Employer |
| of
incorporation) |
|
File
Number) |
|
Identification
No.) |
| Juniper
Business Plaza, 3499 Route 9 North, Suite 3-C, Freehold, NJ |
|
07728 |
| (Address
of principal executive offices) |
|
(Zip
Code) |
Registrant’s
telephone number, including area code: (732) 577-9997
Not
Applicable
(Former
name or former address, if changed since last report.)
Check
the appropriate box below if the Form 8-K filing is intended to simultaneously satisfy the filing obligation of the registrant under
any of the following provisions (see General Instruction A.2. below):
| ☐ |
Written
communications pursuant to Rule 425 under the Securities Act (17 CFR 230.425) |
| |
|
| ☐ |
Soliciting
material pursuant to Rule 14a- 12 under the Exchange Act (17 CFR 240.14a-12) |
| |
|
| ☐ |
Pre-commencement
communications pursuant to Rule 14d-2(b) under the Exchange Act (17 CFR 240.14d-2(b)) |
| |
|
| ☐ |
Pre-commencement
communications pursuant to Rule 13e-4(c) under the Exchange Act (17 CFR 240.13e-4(c)) |
Securities
registered pursuant to Section 12(b) of the Act:
| Title
of each class |
|
Trading
Symbol(s) |
|
Name
of exchange on which registered |
| Common
Stock, $0.10 par value |
|
UMH |
|
New
York Stock Exchange |
| 6.375%
Series D Cumulative Redeemable Preferred Stock, $0.10 par value |
|
UMH
PD |
|
New
York Stock Exchange |
Indicate
by check mark whether the registrant is an emerging growth company as defined in Rule 405 of the Securities Act of 1933 (§230.405
of this chapter) or Rule 12b-2 of the Securities Exchange Act of 1934 (§240.12b-2 of this chapter).
Emerging growth company ☐
If
an emerging growth company, indicate by check mark if the registrant has elected not to use the extended transition period for complying
with any new or revised financial accounting standards provided pursuant to Section 13(a) of the Exchange Act. ☐
Item 2.02 Results of Operations and Financial Condition.
Item 7.01 Regulation FD Disclosure.
On
August 6, 2024, UMH Properties, Inc. issued a press release announcing the results for the second quarter June 30, 2024 and disclosed
a supplemental information package in connection with its earnings conference call for the second quarter June 30, 2024. A copy of the
supplemental information package and press release is furnished with this report as Exhibit 99 and is incorporated herein by reference.
The
information in this report and the exhibit attached hereto is being furnished, not filed, for the purposes of Section 18 of the Securities
Exchange Act of 1934, as amended, and pursuant to Item 2.02 and Item 7.01 of Form 8-K will not be incorporated by reference into any
filing under the Securities Act of 1933, as amended, unless specifically identified therein as being incorporated therein by reference.
Forward-Looking
Statements
Statements
contained in this report, including the document that is incorporated by reference, that are not historical facts are forward-looking
statements within the meaning of Section 27A of the Securities Act of 1933, as amended (the “Securities Act”), and Section
21E of the Securities Exchange Act of 1934, as amended and the Private Securities Litigation Reform Act of 1995 (the “Exchange
Act”). All statements, other than statements of historical facts that address activities, events or developments where the Company
uses any of the words “anticipates,” “assumes,” “believes,” “estimates,” “expects,”
“intends,” or similar expressions, are forward-looking statements. These forward-looking statements are not guaranteed and
are based on the Company’s current intentions and on the Company’s current expectations and assumptions. These statements,
intentions, expectations and assumptions involve risks and uncertainties, some of which are beyond the Company’s control that could
cause actual results or events to differ materially from those that the Company anticipates or projects, such as:
| ● | changes
in the real estate market conditions and general economic conditions; |
| ● | the
inherent risks associated with owning real estate, including local real estate market conditions,
governing laws and regulations affecting manufactured housing communities and illiquidity
of real estate investments; |
| ● | increased
competition in the geographic areas in which we own and operate manufactured housing communities;
|
| ● | our
ability to continue to identify, negotiate and acquire manufactured housing communities and/or
vacant land which may be developed into manufactured housing communities on terms favorable
to us; |
| ● | our
ability to maintain or increase rental rates and occupancy levels; |
| ● | changes
in market rates of interest; |
| ● | inflation
and increases in costs, including personnel, insurance and the cost of purchasing manufactured
homes; |
| ● | our
ability to purchase manufactured homes for rental or sale; |
| ● | our
ability to repay debt financing obligations; |
| ● | our
ability to refinance amounts outstanding under our credit facilities at maturity on terms
favorable to us; |
| ● | our
ability to comply with certain debt covenants; |
| ● | our
ability to integrate acquired properties and operations into existing operations; |
| ● | the
availability of other debt and equity financing alternatives; |
| ● | continued
ability to access the debt or equity markets; |
| ● | the
loss of any member of our management team; |
| ● | our
ability to maintain internal controls and processes to ensure all transactions are accounted
for properly, all relevant disclosures and filings are timely made in a timely manner in
accordance with all rules and regulations, and any potential fraud or embezzlement is thwarted
or detected; |
| ● | the
ability of manufactured home buyers to obtain financing; |
| ● | the
level of repossessions by manufactured home lenders; |
| ● | market
conditions affecting our investment securities; |
| ● | changes
in federal or state tax rules or regulations that could have adverse tax consequences; |
| ● | our
ability to qualify as a real estate investment trust for federal income tax purposes; and |
| ● | risks
and uncertainties related to the COVID-19 pandemic or other highly infectious or contagious
diseases. |
Item 9.01 Financial Statements and Exhibits.
SIGNATURE
Pursuant
to the requirements of the Securities Exchange Act of 1934, the registrant has duly caused this report to be signed on its behalf by
the undersigned hereunto duly authorized.
| |
UMH
Properties, Inc. |
| |
|
|
| Date:
August 6, 2024 |
By: |
/s/
Anna T. Chew |
| |
Name: |
Anna
T. Chew |
| |
Title: |
Executive
Vice President and Chief Financial Officer |
Exhibit 99

Certain
information in this Supplemental Information Package contains Non-GAAP financial measures. These Non-GAAP financial measures are REIT
industry financial measures that are not calculated in accordance with accounting principles generally accepted in the United States
of America. Please see page 15 for a definition of these Non-GAAP financial measures and page 7 for the reconciliation of certain captions
in the Supplemental Information Package to the statement of operations as reported in the Company’s filings with the SEC on Form
10-Q.
| UMH Properties, Inc. | Second Quarter FY 2024 Supplemental Information | 2 |
Financial
Highlights
(dollars
in thousands except per share amounts) (unaudited)
| | |
Three Months
Ended | | |
Six Months
Ended | |
| | |
June
30, 2024 | | |
June
30, 2023 | | |
June
30, 2024 | | |
June
30, 2023 | |
| Operating
Information | |
| | | |
| | | |
| | | |
| | |
| Number of Communities (1) | |
| | | |
| | | |
| 136 | | |
| 135 | |
| Total Sites | |
| | | |
| | | |
| 25,787 | | |
| 25,729 | |
| Rental and Related Income | |
$ | 51,494 | | |
$ | 47,063 | | |
$ | 101,823 | | |
$ | 92,368 | |
| Community Operating Expenses | |
$ | 21,595 | | |
$ | 20,034 | | |
$ | 42,692 | | |
$ | 40,122 | |
| Community NOI | |
$ | 29,899 | | |
$ | 27,029 | | |
$ | 59,131 | | |
$ | 52,246 | |
| Expense Ratio | |
| 41.9 | % | |
| 42.6 | % | |
| 41.9 | % | |
| 43.4 | % |
| Sales of Manufactured Homes | |
$ | 8,834 | | |
$ | 8,227 | | |
$ | 16,185 | | |
$ | 15,529 | |
| Number of Homes Sold | |
| 105 | | |
| 91 | | |
| 200 | | |
| 174 | |
| Number of Rentals Added, net | |
| 111 | | |
| 304 | | |
| 167 | | |
| 534 | |
| Net Income (Loss) | |
$ | 5,181 | | |
$ | (403 | ) | |
$ | 3,556 | | |
$ | (1,904 | ) |
| Net Income (Loss) Attributable to Common Shareholders | |
$ | 527 | | |
$ | (4,418 | ) | |
$ | (5,737 | ) | |
$ | (9,715 | ) |
| Adjusted EBITDA excluding Non-Recurring Other
Expense | |
$ | 28,329 | | |
$ | 25,270 | | |
$ | 55,014 | | |
$ | 48,731 | |
| FFO Attributable to Common Shareholders | |
$ | 16,182 | | |
$ | 12,043 | | |
$ | 30,228 | | |
$ | 22,683 | |
| Normalized FFO Attributable to Common Shareholders | |
$ | 16,807 | | |
$ | 13,049 | | |
$ | 31,824 | | |
$ | 24,769 | |
| | |
| | | |
| | | |
| | | |
| | |
| Shares Outstanding
and Per Share Data | |
| | | |
| | | |
| | | |
| | |
| Weighted Average Shares Outstanding | |
| | | |
| | | |
| | | |
| | |
| Basic | |
| 71,418 | | |
| 61,236 | | |
| 70,291 | | |
| 60,186 | |
| Diluted | |
| 71,884 | | |
| 61,760 | | |
| 70,700 | | |
| 60,844 | |
| Net Income (Loss) Attributable
to Shareholders per Share- | |
| | | |
| | | |
| | | |
| | |
| Basic and Diluted | |
$ | 0.01 | | |
$ | (0.07 | ) | |
$ | (0.08 | ) | |
$ | (0.16 | ) |
| FFO per Share-(2) | |
| | | |
| | | |
| | | |
| | |
| Basic | |
$ | 0.23 | | |
$ | 0.20 | | |
$ | 0.43 | | |
$ | 0.38 | |
| Diluted | |
$ | 0.23 | | |
$ | 0.19 | | |
$ | 0.43 | | |
$ | 0.37 | |
| Normalized FFO per Share-(2) | |
| | | |
| | | |
| | | |
| | |
| Basic | |
$ | 0.24 | | |
$ | 0.21 | | |
$ | 0.45 | | |
$ | 0.41 | |
| Diluted | |
$ | 0.23 | | |
$ | 0.21 | | |
$ | 0.45 | | |
$ | 0.41 | |
| Dividends per Common Share | |
$ | 0.215 | | |
$ | 0.205 | | |
$ | 0.42 | | |
$ | 0.41 | |
| | |
| | | |
| | | |
| | | |
| | |
| Balance
Sheet | |
| | | |
| | | |
| | | |
| | |
| Total Assets | |
| | | |
| | | |
$ | 1,441,295 | | |
$ | 1,393,869 | |
| Total Liabilities | |
| | | |
| | | |
$ | 697,315 | | |
$ | 756,002 | |
| | |
| | | |
| | | |
| | | |
| | |
| Market
Capitalization | |
| | | |
| | | |
| | | |
| | |
| Total Debt, Net of Unamortized Debt Issuance
Costs | |
| | | |
| | | |
$ | 668,876 | | |
$ | 726,862 | |
| Equity Market Capitalization | |
| | | |
| | | |
$ | 1,163,272 | | |
$ | 1,007,888 | |
| Series D Preferred Stock | |
| | | |
| | | |
$ | 295,757 | | |
$ | 265,032 | |
| Total Market Capitalization | |
| | | |
| | | |
$ | 2,127,905 | | |
$ | 1,999,782 | |
| |
(1) |
As of January 1, 2024, includes Duck River Estates,
a newly constructed community. |
| |
(2) |
Please see Definitions on page 15. |
| UMH Properties, Inc. | Second Quarter FY 2024 Supplemental Information | 3 |
Consolidated
Balance Sheets
(in
thousands except per share amounts)
| | |
June 30, | | |
December 31, | |
| | |
2024 | | |
2023 | |
| | |
(unaudited) | | |
| | |
| ASSETS | |
| | | |
| | |
| Investment Property and
Equipment | |
| | | |
| | |
| Land | |
$ | 87,301 | | |
$ | 86,497 | |
| Site and Land Improvements | |
| 907,400 | | |
| 896,568 | |
| Buildings and Improvements | |
| 39,749 | | |
| 39,506 | |
| Rental Homes and Accessories | |
| 539,746 | | |
| 516,470 | |
| Total Investment Property | |
| 1,574,196 | | |
| 1,539,041 | |
| Equipment and Vehicles | |
| 30,059 | | |
| 29,126 | |
| Total Investment Property and Equipment | |
| 1,604,255 | | |
| 1,568,167 | |
| Accumulated Depreciation | |
| (443,448 | ) | |
| (416,309 | ) |
| Net
Investment Property and Equipment | |
| 1,160,807 | | |
| 1,151,858 | |
| | |
| | | |
| | |
| Other Assets | |
| | | |
| | |
| Cash and Cash Equivalents | |
| 39,457 | | |
| 57,320 | |
| Marketable Securities at Fair Value | |
| 28,673 | | |
| 34,506 | |
| Inventory of Manufactured Homes | |
| 31,986 | | |
| 32,940 | |
| Notes and Other Receivables, net | |
| 85,940 | | |
| 81,071 | |
| Prepaid Expenses and Other Assets | |
| 15,485 | | |
| 11,729 | |
| Land Development Costs | |
| 52,736 | | |
| 33,302 | |
| Investment in Joint
Venture | |
| 26,211 | | |
| 24,851 | |
| Total
Other Assets | |
| 280,488 | | |
| 275,719 | |
| | |
| | | |
| | |
| TOTAL
ASSETS | |
$ | 1,441,295 | | |
$ | 1,427,577 | |
| | |
| | | |
| | |
| LIABILITIES AND SHAREHOLDERS’
EQUITY | |
| | | |
| | |
| Liabilities | |
| | | |
| | |
| Mortgages Payable, net
of unamortized debt issuance costs | |
$ | 491,030 | | |
$ | 496,483 | |
| Other Liabilities | |
| | | |
| | |
| Accounts Payable | |
| 5,386 | | |
| 6,106 | |
| Loans Payable, net of unamortized debt issuance
costs | |
| 77,367 | | |
| 93,479 | |
| Series A Bonds, net of unamortized debt issuance
costs | |
| 100,479 | | |
| 100,055 | |
| Accrued Liabilities and Deposits | |
| 13,145 | | |
| 15,117 | |
| Tenant Security Deposits | |
| 9,908 | | |
| 9,543 | |
| Total Other Liabilities | |
| 206,285 | | |
| 224,300 | |
| Total
Liabilities | |
| 697,315 | | |
| 720,783 | |
| | |
| | | |
| | |
| COMMITMENTS AND CONTINGENCIES | |
| | | |
| | |
| | |
| | | |
| | |
| Shareholders’ Equity: | |
| | | |
| | |
| Series D- 6.375% Cumulative Redeemable Preferred Stock, $0.10 par value
per share; 13,700 shares authorized as of June 30, 2024 and December, 31 2023; 11,830 and 11,607 shares issued and outstanding as
of June 30, 2024 and December 31, 2023, respectively | |
| 295,757 | | |
| 290,180 | |
| Common Stock- $0.10 par value per share: 153,714 shares authorized as
of June 30, 2024 and December 31, 2023; 72,750 and 67,978 shares issued and outstanding as of June 30, 2024 and December 31, 2023,
respectively | |
| 7,275 | | |
| 6,798 | |
| Excess Stock- $0.10 par value per share: 3,000 shares authorized; no
shares issued or outstanding as of June 30, 2024 and December 31, 2023 | |
| -0- | | |
| -0- | |
| Additional Paid-In Capital | |
| 464,330 | | |
| 433,106 | |
| Accumulated Deficit | |
| (25,364 | ) | |
| (25,364 | ) |
| Total UMH Properties, Inc.
Shareholders’ Equity | |
| 741,998 | | |
| 704,720 | |
| Non-Controlling Interest
in Consolidated Subsidiaries | |
| 1,982 | | |
| 2,074 | |
| Total
Shareholders’ Equity | |
| 743,980 | | |
| 706,794 | |
| | |
| | | |
| | |
| TOTAL
LIABILITIES AND SHAREHOLDERS’ EQUITY | |
$ | 1,441,295 | | |
$ | 1,427,577 | |
| UMH Properties, Inc. | Second Quarter FY 2024 Supplemental Information | 4 |
Consolidated
Statements of Income (Loss)
(in
thousands except per share amounts) (unaudited)
| | |
Three Months
Ended | | |
Six Months
Ended | |
| | |
June
30, 2024 | | |
June
30, 2023 | | |
June
30, 2024 | | |
June
30, 2023 | |
| INCOME: | |
| | |
| | |
| | |
| |
| Rental and Related Income | |
$ | 51,494 | | |
$ | 47,063 | | |
$ | 101,823 | | |
$ | 92,368 | |
| Sales of Manufactured
Homes | |
| 8,834 | | |
| 8,227 | | |
| 16,185 | | |
| 15,529 | |
| TOTAL
INCOME | |
| 60,328 | | |
| 55,290 | | |
| 118,008 | | |
| 107,897 | |
| | |
| | | |
| | | |
| | | |
| | |
| EXPENSES: | |
| | | |
| | | |
| | | |
| | |
| Community Operating Expenses | |
| 21,595 | | |
| 20,034 | | |
| 42,692 | | |
| 40,122 | |
| Cost of Sales of Manufactured Homes | |
| 5,461 | | |
| 5,740 | | |
| 11,017 | | |
| 10,725 | |
| Selling Expenses | |
| 1,744 | | |
| 1,665 | | |
| 3,390 | | |
| 3,477 | |
| General and Administrative Expenses | |
| 5,506 | | |
| 5,181 | | |
| 10,874 | | |
| 10,163 | |
| Depreciation Expense | |
| 15,001 | | |
| 13,751 | | |
| 29,742 | | |
| 27,124 | |
| TOTAL
EXPENSES | |
| 49,307 | | |
| 46,371 | | |
| 97,715 | | |
| 91,611 | |
| | |
| | | |
| | | |
| | | |
| | |
| OTHER INCOME (EXPENSE): | |
| | | |
| | | |
| | | |
| | |
| Interest Income | |
| 1,501 | | |
| 1,217 | | |
| 3,068 | | |
| 2,355 | |
| Dividend Income | |
| 362 | | |
| 531 | | |
| 722 | | |
| 1,237 | |
| Loss on Sales of Marketable Securities, net | |
| (3,778 | ) | |
| (1 | ) | |
| (3,778 | ) | |
| (43 | ) |
| Increase (Decrease) in Fair Value of
Marketable Securities | |
| 3,338 | | |
| (2,548 | ) | |
| (2,031 | ) | |
| (4,943 | ) |
| Other Income | |
| 205 | | |
| 288 | | |
| 364 | | |
| 616 | |
| Loss on Investment in Joint Venture | |
| (87 | ) | |
| (175 | ) | |
| (224 | ) | |
| (480 | ) |
| Interest Expense | |
| (7,371 | ) | |
| (8,639 | ) | |
| (14,845 | ) | |
| (16,969 | ) |
| TOTAL
OTHER INCOME (EXPENSE) | |
| (5,830 | ) | |
| (9,327 | ) | |
| (16,724 | ) | |
| (18,227 | ) |
| | |
| | | |
| | | |
| | | |
| | |
| Income (Loss) before Gain (Loss) on Sales of
Investment Property and Equipment | |
| 5,191 | | |
| (408 | ) | |
| 3,569 | | |
| (1,941 | ) |
| Gain (Loss) on Sales of
Investment Property and Equipment | |
| (10 | ) | |
| 5 | | |
| (13 | ) | |
| 37 | |
| NET INCOME (LOSS) | |
| 5,181 | | |
| (403 | ) | |
| 3,556 | | |
| (1,904 | ) |
| | |
| | | |
| | | |
| | | |
| | |
| Preferred Dividends | |
| (4,712 | ) | |
| (4,051 | ) | |
| (9,385 | ) | |
| (7,887 | ) |
| Loss Attributable to
Non-Controlling Interest | |
| 58 | | |
| 36 | | |
| 92 | | |
| 76 | |
| | |
| | | |
| | | |
| | | |
| | |
| NET
INCOME (LOSS) ATTRIBUTABLE TO COMMON SHAREHOLDERS | |
$ | 527 | | |
$ | (4,418 | ) | |
$ | (5,737 | ) | |
$ | (9,715 | ) |
| | |
| | | |
| | | |
| | | |
| | |
NET
INCOME (LOSS) ATTRIBUTABLE TO COMMON SHAREHOLDERS PER SHARE – | |
| | | |
| | | |
| | | |
| | |
| Basic and Diluted | |
$ | 0.01 | | |
$ | (0.07 | ) | |
$ | (0.08 | ) | |
$ | (0.16 | ) |
| | |
| | | |
| | | |
| | | |
| | |
WEIGHTED
AVERAGE COMMON SHARES OUTSTANDING: | |
| | | |
| | | |
| | | |
| | |
| Basic | |
| 71,418 | | |
| 61,236 | | |
| 70,291 | | |
| 60,186 | |
| Diluted | |
| 71,884 | | |
| 61,760 | | |
| 70,700 | | |
| 60,844 | |
| UMH Properties, Inc. | Second Quarter FY 2024 Supplemental Information | 5 |
Consolidated
Statements of Cash Flows
(in
thousands) (unaudited)
| | |
Six Months
Ended | |
| | |
June
30, 2024 | | |
June
30, 2023 | |
| CASH FLOWS FROM OPERATING
ACTIVITIES: | |
| | | |
| | |
| Net Income (Loss) | |
$ | 3,556 | | |
$ | (1,904 | ) |
| Non-Cash Items Included in Net Income (Loss): | |
| | | |
| | |
| Depreciation | |
| 29,742 | | |
| 27,124 | |
| Amortization of Financing
Costs | |
| 1,163 | | |
| 1,056 | |
| Stock Compensation Expense | |
| 2,543 | | |
| 2,999 | |
| Provision for Uncollectible
Notes and Other Receivables | |
| 795 | | |
| 797 | |
| Loss on Sales of Marketable
Securities, net | |
| 3,778 | | |
| 43 | |
| Decrease in Fair Value
of Marketable Securities | |
| 2,031 | | |
| 4,943 | |
| (Gain) Loss on Sales of
Investment Property and Equipment | |
| 13 | | |
| (37 | ) |
| Loss on Investment in Joint
Venture | |
| 469 | | |
| 577 | |
| Changes in Operating Assets and Liabilities: | |
| | | |
| | |
| Inventory of Manufactured
Homes | |
| 954 | | |
| 27,414 | |
| Notes and Other Receivables,
net of notes acquired with acquisitions | |
| (5,664 | ) | |
| (9,017 | ) |
| Prepaid Expenses and Other
Assets | |
| 552 | | |
| 1,591 | |
| Accounts Payable | |
| (720 | ) | |
| 317 | |
| Accrued Liabilities and
Deposits | |
| (1,972 | ) | |
| (3,534 | ) |
| Tenant
Security Deposits | |
| 365 | | |
| 633 | |
| Net
Cash Provided by Operating Activities | |
| 37,605 | | |
| 53,002 | |
| CASH FLOWS FROM INVESTING
ACTIVITIES: | |
| | | |
| | |
| Purchase of Manufactured
Home Communities | |
| -0- | | |
| (3,679 | ) |
| Purchase of Investment
Property and Equipment | |
| (41,052 | ) | |
| (74,604 | ) |
| Proceeds from Sales of
Investment Property and Equipment | |
| 2,348 | | |
| 1,332 | |
| Additions to Land Development
Costs | |
| (18,249 | ) | |
| (12,587 | ) |
| Purchase of Marketable
Securities | |
| (12 | ) | |
| (11 | ) |
| Proceeds from Sales of
Marketable Securities | |
| 36 | | |
| 502 | |
| Investment
in Joint Venture | |
| (1,829 | ) | |
| (5,349 | ) |
| Net
Cash Used in Investing Activities | |
| (58,758 | ) | |
| (94,396 | ) |
| CASH FLOWS FROM FINANCING
ACTIVITIES: | |
| | | |
| | |
| Net (Payments) Proceeds
from Short-Term Borrowings | |
| (15,837 | ) | |
| 29,527 | |
| Principal Payments of Mortgages
and Loans | |
| (5,915 | ) | |
| (64,583 | ) |
| Financing Costs on Debt | |
| (552 | ) | |
| (814 | ) |
| Proceeds from At-The-Market
Preferred Equity Program, net of offering costs | |
| 5,058 | | |
| 34,600 | |
| Proceeds from At-The-Market
Common Equity Program, net of offering costs | |
| 56,478 | | |
| 78,447 | |
| Proceeds from Issuance
of Common Stock in the DRIP, net of dividend reinvestments | |
| 3,503 | | |
| 3,197 | |
| Proceeds from Exercise
of Stock Options | |
| 2,079 | | |
| 550 | |
| Preferred Dividends Paid | |
| (9,385 | ) | |
| (7,887 | ) |
| Common
Dividends Paid, net of dividend reinvestments | |
| (27,831 | ) | |
| (23,331 | ) |
| Net
Cash Provided by Financing Activities | |
| 7,598 | | |
| 49,706 | |
| | |
| | | |
| | |
| NET (DECREASE) INCREASE
IN CASH, CASH EQUIVALENTS AND RESTRICTED CASH | |
| (13,555 | ) | |
| 8,312 | |
| CASH,
CASH EQUIVALENTS AND RESTRICTED CASH AT BEGINNING OF PERIOD | |
| 64,437 | | |
| 40,876 | |
| CASH,
CASH EQUIVALENTS AND RESTRICTED CASH AT END OF PERIOD | |
$ | 50,882 | | |
$ | 49,188 | |
| UMH Properties, Inc. | Second Quarter FY 2024 Supplemental Information | 6 |
Reconciliation
of Net Income (Loss) to Adjusted EBITDA and Net Income (Loss) Attributable to Common Shareholders to FFO and Normalized FFO
(in
thousands) (unaudited)
| | |
Three Months
Ended | | |
Six Months
Ended | |
| | |
June
30, 2024 | | |
June
30, 2023 | | |
June
30, 2024 | | |
June
30, 2023 | |
| Reconciliation of Net Income (Loss)
to Adjusted EBITDA | |
| | |
| |
| | |
| | |
| | |
| | |
| |
| Net Income
(Loss) | |
$ | 5,181 | | |
$ | (403 | ) | |
$ | 3,556 | | |
$ | (1,904 | ) |
| Interest Expense | |
| 7,371 | | |
| 8,639 | | |
| 14,845 | | |
| 16,969 | |
| Franchise Taxes | |
| 114 | | |
| 100 | | |
| 228 | | |
| 201 | |
| Depreciation Expense | |
| 15,001 | | |
| 13,751 | | |
| 29,742 | | |
| 27,124 | |
| Depreciation Expense from
Unconsolidated Joint Venture | |
| 204 | | |
| 166 | | |
| 401 | | |
| 325 | |
| (Increase) Decrease in
Fair Value of Marketable Securities | |
| (3,338 | ) | |
| 2,548 | | |
| 2,031 | | |
| 4,943 | |
| Loss
on Sales of Marketable Securities, net | |
| 3,778 | | |
| 1 | | |
| 3,778 | | |
| 43 | |
| Adjusted
EBITDA | |
| 28,311 | | |
| 24,802 | | |
| 54,581 | | |
| 47,701 | |
| Non-
Recurring Other Expense (1) | |
| 18 | | |
| 468 | | |
| 433 | | |
| 1,030 | |
Adjusted
EBITDA without Non-recurring Other Expense | |
$ | 28,329 | | |
$ | 25,270 | | |
$ | 55,014 | | |
$ | 48,731 | |
| | |
| | | |
| | | |
| | | |
| | |
| Reconciliation of Net Income (Loss) Attributable to Common Shareholders to Funds from Operations |
| | |
| | | |
| | | |
| | | |
| | |
| Net Income (Loss) Attributable
to Common Shareholders | |
$ | 527 | | |
$ | (4,418 | ) | |
$ | (5,737 | ) | |
$ | (9,715 | ) |
| Depreciation Expense | |
| 15,001 | | |
| 13,751 | | |
| 29,742 | | |
| 27,124 | |
| Depreciation Expense from
Unconsolidated Joint Venture | |
| 204 | | |
| 166 | | |
| 401 | | |
| 325 | |
| (Gain) Loss on Sales of
Investment Property and Equipment | |
| 10 | | |
| (5 | ) | |
| 13 | | |
| (37 | ) |
| (Increase) Decrease in
Fair Value of Marketable Securities | |
| (3,338 | ) | |
| 2,548 | | |
| 2,031 | | |
| 4,943 | |
| Loss
on Sales of Marketable Securities, net | |
| 3,778 | | |
| 1 | | |
| 3,778 | | |
| 43 | |
| Funds
from Operations Attributable to Common Shareholders (“FFO”) | |
| 16,182 | | |
| 12,043 | | |
| 30,228 | | |
| 22,683 | |
| | |
| | | |
| | | |
| | | |
| | |
| Adjustments: | |
| | | |
| | | |
| | | |
| | |
| Amortization of Financing
Costs | |
| 607 | | |
| 538 | | |
| 1,163 | | |
| 1,056 | |
| Non-
Recurring Other Expense (1) | |
| 18 | | |
| 468 | | |
| 433 | | |
| 1,030 | |
Normalized
Funds from Operations Attributable to Common Shareholders (“Normalized FFO”) | |
$ | 16,807 | | |
$ | 13,049 | | |
$ | 31,824 | | |
$ | 24,769 | |
| |
(1) |
Consists of non-recurring
one-time legal fees ($18 and $51, respectively), and costs associated with the liquidation/sale of inventory in a particular sales
center ($0 and $382, respectively) for the three and six months ended June 30, 2024. Consists of special bonus and restricted stock
grants for the August 2020 groundbreaking Fannie Mae financing, which were being expensed over the vesting period ($431 and $862, respectively)
and non-recurring expenses for the joint venture with Nuveen ($3 and $50, respectively), one-time legal fees ($30 and $50, respectively),
fees related to the establishment of the OZ Fund ($4 and $37, respectively), and costs associated with an acquisition that was not
completed ($0 and $31, respectively) for the three and six months ended June 30, 2023. |
| UMH Properties, Inc. | Second Quarter FY 2024 Supplemental Information | 7 |
Market
Capitalization, Debt and Coverage Ratios
(in
thousands) (unaudited)
| | |
Six Months Ended | | |
Year Ended | |
| | |
June 30, 2024 | | |
June 30, 2023 | | |
December 31, 2023 | |
| Shares Outstanding | |
| 72,750 | | |
| 63,072 | | |
| 67,978 | |
| Market Price Per Share | |
$ | 15.99 | | |
$ | 15.98 | | |
$ | 15.32 | |
| Equity Market Capitalization | |
$ | 1,163,272 | | |
$ | 1,007,888 | | |
$ | 1,041,422 | |
| Total Debt | |
| 668,876 | | |
| 726,862 | | |
| 690,017 | |
| Preferred | |
| 295,757 | | |
| 265,032 | | |
| 290,180 | |
| Total Market Capitalization | |
$ | 2,127,905 | | |
$ | 1,999,782 | | |
$ | 2,021,619 | |
| | |
| | | |
| | | |
| | |
| Total Debt | |
$ | 668,876 | | |
$ | 726,862 | | |
$ | 690,017 | |
| Less: Cash and Cash Equivalents | |
| (39,457 | ) | |
| (41,484 | ) | |
| (57,320 | ) |
| Net Debt | |
| 629,419 | | |
| 685,378 | | |
| 632,697 | |
| Less: Marketable Securities at Fair Value (“Securities”) | |
| (28,673 | ) | |
| (36,701 | ) | |
| (34,506 | ) |
| Net Debt Less Securities | |
$ | 600,746 | | |
$ | 648,677 | | |
$ | 598,191 | |
| | |
| | | |
| | | |
| | |
| Interest Expense | |
$ | 14,845 | | |
$ | 16,969 | | |
$ | 32,475 | |
| Capitalized Interest | |
| 2,378 | | |
| 2,699 | | |
| 5,032 | |
| Preferred Dividends | |
| 9,385 | | |
| 7,887 | | |
| 16,723 | |
| Total Fixed Charges | |
$ | 26,608 | | |
$ | 27,555 | | |
$ | 54,230 | |
| | |
| | | |
| | | |
| | |
| Adjusted EBITDA excluding Non-Recurring Other Expenses | |
$ | 55,014 | | |
$ | 48,731 | | |
$ | 101,780 | |
| | |
| | | |
| | | |
| | |
| Debt and Coverage Ratios | |
| | | |
| | | |
| | |
| | |
| | | |
| | | |
| | |
| Net Debt / Total Market Capitalization | |
| 29.6 | % | |
| 34.3 | % | |
| 31.3 | % |
| | |
| | | |
| | | |
| | |
| Net Debt Plus Preferred / Total Market Capitalization | |
| 43.5 | % | |
| 47.5 | % | |
| 45.7 | % |
| | |
| | | |
| | | |
| | |
| Net Debt Less Securities / Total Market Capitalization | |
| 28.2 | % | |
| 32.4 | % | |
| 29.6 | % |
| | |
| | | |
| | | |
| | |
| Net Debt Less Securities Plus Preferred / Total Market Capitalization | |
| 42.1 | % | |
| 45.7 | % | |
| 43.9 | % |
| | |
| | | |
| | | |
| | |
| Interest Coverage | |
| 3.2x | | |
| 2.5x | | |
| 2.7x | |
| | |
| | | |
| | | |
| | |
| Fixed Charge Coverage | |
| 2.1x | | |
| 1.8x | | |
| 1.9x | |
| | |
| | | |
| | | |
| | |
| Net Debt / Adjusted EBITDA excluding Non-Recurring Other Expense | |
| 5.7x | | |
| 7.0x | | |
| 6.2x | |
| | |
| | | |
| | | |
| | |
| Net Debt Less Securities / Adjusted EBITDA excluding Non-Recurring Other Expense | |
| 5.5x | | |
| 6.7x | | |
| 5.9x | |
| | |
| | | |
| | | |
| | |
| Net Debt Plus Preferred / Adjusted EBITDA excluding Non-Recurring Other Expense | |
| 8.4x | | |
| 9.8x | | |
| 9.1x | |
| | |
| | | |
| | | |
| | |
| Net Debt Less Securities Plus Preferred / Adjusted EBITDA excluding Non-Recurring Other Expense | |
| 8.1x | | |
| 9.4x | | |
| 8.7x | |
| UMH Properties, Inc. | Second Quarter FY 2024 Supplemental Information | 8 |
Debt
Analysis
(in
thousands) (unaudited)
| | |
Six Months Ended | | |
Year Ended | |
| | |
June 30, 2024 | | |
June 30, 2023 | | |
December 31, 2023 | |
| Debt Outstanding | |
| | | |
| | | |
| | |
| Mortgages Payable: | |
| | | |
| | | |
| | |
| Fixed Rate Mortgages | |
$ | 495,219 | | |
$ | 449,126 | | |
$ | 501,135 | |
| Unamortized Debt Issuance Costs | |
| (4,189 | ) | |
| (4,329 | ) | |
| (4,652 | ) |
| | |
| | | |
| | | |
| | |
| Mortgages, Net of Unamortized Debt Issuance Costs | |
$ | 491,030 | | |
$ | 444,797 | | |
$ | 496,483 | |
| Loans Payable: | |
| | | |
| | | |
| | |
| Unsecured Line of Credit | |
$ | 50,000 | | |
$ | 100,000 | | |
$ | 70,000 | |
| Other Loans Payable | |
| 28,846 | | |
| 83,753 | | |
| 24,683 | |
| | |
| | | |
| | | |
| | |
| Total Loans Before Unamortized Debt Issuance Costs | |
| 78,846 | | |
| 183,753 | | |
| 94,683 | |
| Unamortized Debt Issuance Costs | |
| (1,479 | ) | |
| (1,319 | ) | |
| (1,204 | ) |
| | |
| | | |
| | | |
| | |
| Loans, Net of Unamortized Debt Issuance Costs | |
$ | 77,367 | | |
$ | 182,434 | | |
$ | 93,479 | |
| Bonds Payable: | |
| | | |
| | | |
| | |
| Series A Bonds | |
$ | 102,670 | | |
$ | 102,670 | | |
$ | 102,670 | |
| Unamortized Debt Issuance Costs | |
| (2,191 | ) | |
| (3,039 | ) | |
| (2,615 | ) |
| Bonds, Net of Unamortized Debt Issuance Costs | |
$ | 100,479 | | |
$ | 99,631 | | |
$ | 100,055 | |
| | |
| | | |
| | | |
| | |
| Total Debt, Net of Unamortized Debt Issuance Costs | |
$ | 668,876 | | |
$ | 726,862 | | |
$ | 690,017 | |
| | |
| | | |
| | | |
| | |
| % Fixed/Floating | |
| | | |
| | | |
| | |
| Fixed | |
| 91.9 | % | |
| 75.0 | % | |
| 90.0 | % |
| Floating | |
| 8.1 | % | |
| 25.0 | % | |
| 10.0 | % |
| Total | |
| 100.0 | % | |
| 100.0 | % | |
| 100.0 | % |
| | |
| | | |
| | | |
| | |
| Weighted Average Interest Rates (1) | |
| | | |
| | | |
| | |
| Mortgages Payable | |
| 4.17 | % | |
| 3.88 | % | |
| 4.17 | % |
| Loans Payable | |
| 6.81 | % | |
| 7.42 | % | |
| 6.98 | % |
| Bonds Payable | |
| 4.72 | % | |
| 4.72 | % | |
| 4.72 | % |
| Total Average | |
| 4.56 | % | |
| 4.88 | % | |
| 4.63 | % |
| | |
| | | |
| | | |
| | |
| Weighted Average Maturity (Years) | |
| | | |
| | | |
| | |
| Mortgages Payable | |
| 4.8 | | |
| 5.2 | | |
| 5.3 | |
| |
(1) |
Weighted
average interest rates do not include the effect of unamortized debt issuance costs. |
| UMH Properties, Inc. | Second Quarter FY 2024 Supplemental Information | 9 |
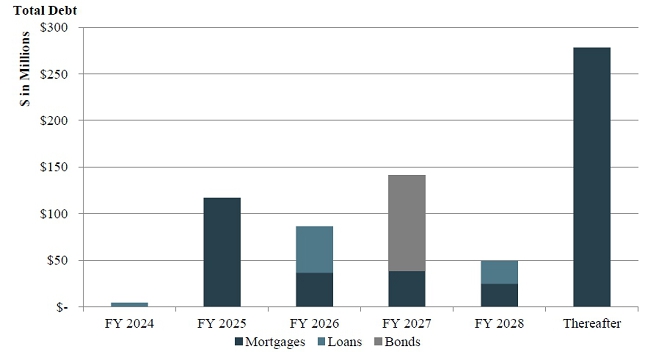
Debt
Maturity
(in
thousands) (unaudited)
| As of June 30, 2024: | |
| | |
| | |
| | |
| | |
| |
| | |
| | |
| | |
| | |
| | |
| |
| Year Ended | |
Mortgages | | |
Loans | | |
Bonds | | |
Total | | |
%
of Total | |
| 2024 | |
$ | -0- | | |
$ | 4,487 | | |
$ | -0- | | |
$ | 4,487 | | |
| 0.6 | % |
| 2025 | |
| 117,008 | | |
| -0- | | |
| -0- | | |
| 117,008 | | |
| 17.3 | % |
| 2026 | |
| 36,567 | | |
| 50,000 | (1) | |
|
-0- | | |
| 86,567 | | |
| 12.8 | % |
| 2027 | |
| 38,524 | | |
| -0- | | |
| 102,670 | (2) | |
| 141,194
| | |
| 20.9 | % |
| 2028 | |
| 24,900 | | |
| 24,359 | | |
| -0- | | |
| 49,259 | | |
| 7.3 | % |
| Thereafter | |
| 278,220 | | |
| -0- | | |
| -0- | | |
| 278,220 | | |
| 41.1 | % |
| | |
| | | |
| | | |
| | | |
| | | |
| | |
| Total Debt Before Unamortized Debt Issuance
Cost | |
| 495,219 | | |
| 78,846 | | |
| 102,670 | | |
| 676,735 | | |
| 100.0 | % |
| | |
| | | |
| | | |
| | | |
| | | |
| | |
| Unamortized Debt Issuance
Cost | |
| (4,189 | ) | |
| (1,479 | ) | |
| (2,191 | ) | |
| (7,859 | ) | |
| | |
| | |
| | | |
| | | |
| | | |
| | | |
| | |
| Total
Debt, Net of Unamortized Debt Issuance Costs | |
$ | 491,030 | | |
$ | 77,367 | | |
$ | 100,479 | | |
$ | 668,876 | | |
| | |
| (1) |
Represents
$50.0 million balance outstanding on the Company’s Line of Credit due November 7, 2026,
with an additional one-year option.
|
| (2) |
Represents
$102.7 million balance outstanding of the Company’s Series A Bonds due February 28, 2027. |
| UMH Properties, Inc. | Second Quarter FY 2024 Supplemental Information | 10 |
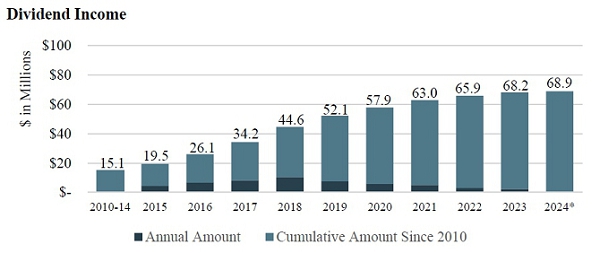
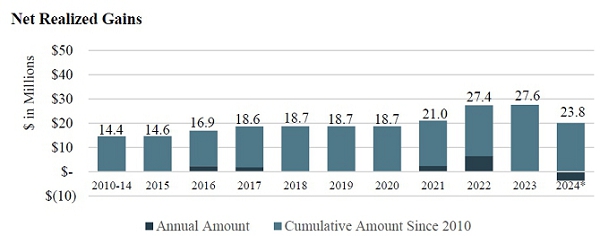
Securities
Portfolio Performance
(in
thousands) (unaudited)
| Year
Ended | |
Securities
Available for Sale | | |
Dividend
Income | | |
Net
Realized Gain (Loss) on Sale of Securities | | |
Net
Realized Gain (Loss) on Sale of Securities & Dividend Income | |
| 2010-2014 | |
| 63,556 | | |
$ | 15,066 | | |
$ | 14,414 | | |
$ | 29,480 | |
| 2015 | |
| 75,011 | | |
| 4,399 | | |
| 204 | | |
| 4,603 | |
| 2016 | |
| 108,755 | | |
| 6,636 | | |
| 2,285 | | |
| 8,921 | |
| 2017 | |
| 132,964 | | |
| 8,135 | | |
| 1,747 | | |
| 9,882 | |
| 2018 | |
| 99,596 | | |
| 10,367 | | |
| 20 | | |
| 10,387 | |
| 2019 | |
| 116,186 | | |
| 7,535 | | |
| -0- | | |
| 7,535 | |
| 2020 | |
| 103,172 | | |
| 5,729 | | |
| -0- | | |
| 5,729 | |
| 2021 | |
| 113,748 | | |
| 5,098 | | |
| 2,342 | | |
| 7,440 | |
| 2022 | |
| 42,178 | | |
| 2,903 | | |
| 6,394 | | |
| 9,297 | |
| 2023 | |
| 34,506 | | |
| 2,318 | | |
| 183 | | |
| 2,501 | |
| 2024* | |
| 28,673 | | |
| 722 | | |
| (3,778 | ) | |
| (3,056 | ) |
| | |
| | | |
| | | |
| | | |
| | |
| | |
| | | |
$ | 68,908 | | |
$ | 23,811 | | |
$ | 92,719 | |
*
Financial Information is as of and for the six months ended June 30, 2024.
| UMH Properties, Inc. | Second Quarter FY 2024 Supplemental Information | 11 |
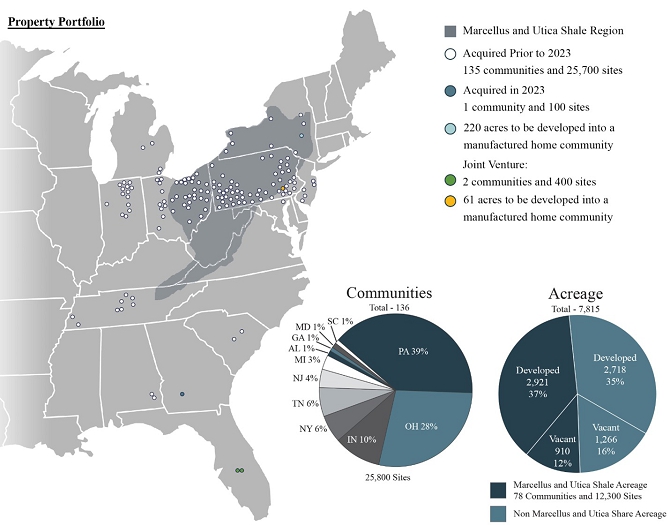
Property
Summary and Snapshot
(unaudited)
| | |
June
30, 2024 | | |
June
30, 2023 | | |
%
Change | |
| | |
| | |
| | |
| |
| Communities (1) | |
| 136 | | |
| 135 | | |
| 0.7 | % |
| Total Sites | |
| 25,787 | | |
| 25,729 | | |
| 0.2 | % |
| Occupied Sites | |
| 22,526 | | |
| 22,096 | | |
| 430
sites, 1.9 | % |
| Occupancy % | |
| 87.4 | % | |
| 85.9 | % | |
| 150
bps | |
| Total Rentals | |
| 10,136 | | |
| 9,632 | | |
| 5.2 | % |
| Occupied Rentals | |
| 9,630 | | |
| 9,048 | | |
| 6.4 | % |
| Rental Occupancy % | |
| 95.0 | % | |
| 93.9 | % | |
| 110
bps | |
| Monthly Rent Per Site | |
$ | 531 | | |
$ | 509 | | |
| 4.3 | % |
| Monthly Rent Per Home Rental Including Site | |
$ | 960 | | |
$ | 905 | | |
| 6.1 | % |
| State | |
Number | | |
Total
Acreage | | |
Developed
Acreage | | |
Vacant
Acreage | | |
Total
Sites | | |
Occupied Sites | | |
Occupancy
Percentage | | |
Monthly
Rent Per Site | | |
Total
Rentals | | |
Occupied
Rentals | | |
Rental
Occupancy
Percentage | | |
Monthly
Rent Per Home
Rental | |
| | |
| | | |
(2) | | |
| | | |
(2) | | |
| | | |
| | | |
| | | |
| | | |
| | | |
| | | |
| | | |
(3) | |
| | |
| | | |
| | | |
| | | |
| | | |
| | | |
| | | |
| | | |
| | | |
| | | |
| | | |
| | | |
| | |
| Alabama | |
| 2 | | |
| 69 | | |
| 62 | | |
| 7 | | |
| 325 | | |
| 132 | | |
| 40.6 | % | |
$ | 193 | | |
| 107 | | |
| 101 | | |
| 94.4 | % | |
$ | 1,045 | |
| Georgia | |
| 1 | | |
| 26 | | |
| 26 | | |
| -0- | | |
| 118 | | |
| 10 | | |
| 8.5 | % | |
$ | 450 | | |
| 10 | | |
| 10 | | |
| 100.0 | % | |
$ | 1,057 | |
| Indiana | |
| 14 | | |
| 1,105 | | |
| 908 | | |
| 197 | | |
| 4,022 | | |
| 3,602 | | |
| 89.6 | % | |
$ | 491 | | |
| 1,946 | | |
| 1,855 | | |
| 95.3 | % | |
$ | 983 | |
| Maryland | |
| 1 | | |
| 77 | | |
| 29 | | |
| 48 | | |
| 63 | | |
| 61 | | |
| 96.8 | % | |
$ | 621 | | |
| -0- | | |
| -0- | | |
| N/A | | |
| N/A | |
| Michigan | |
| 4 | | |
| 241 | | |
| 222 | | |
| 19 | | |
| 1,088 | | |
| 917 | | |
| 84.3 | % | |
$ | 498 | | |
| 385 | | |
| 357 | | |
| 92.7 | % | |
$ | 998 | |
| New Jersey | |
| 5 | | |
| 390 | | |
| 226 | | |
| 164 | | |
| 1,265 | | |
| 1,219 | | |
| 96.4 | % | |
$ | 705 | | |
| 44 | | |
| 38 | | |
| 86.4 | % | |
$ | 1,253 | |
| New York | |
| 8 | | |
| 698 | | |
| 327 | | |
| 371 | | |
| 1,367 | | |
| 1,188 | | |
| 86.9 | % | |
$ | 633 | | |
| 485 | | |
| 462 | | |
| 95.3 | % | |
$ | 1,130 | |
| Ohio | |
| 38 | | |
| 2,044 | | |
| 1,515 | | |
| 529 | | |
| 7,302 | | |
| 6,407 | | |
| 87.7 | % | |
$ | 488 | | |
| 2,973 | | |
| 2,847 | | |
| 95.8 | % | |
$ | 910 | |
| Pennsylvania | |
| 53 | | |
| 2,392 | | |
| 1,901 | | |
| 491 | | |
| 7,968 | | |
| 6,961 | | |
| 87.4 | % | |
$ | 558 | | |
| 3,130 | | |
| 2,955 | | |
| 94.4 | % | |
$ | 957 | |
| South Carolina | |
| 2 | | |
| 63 | | |
| 55 | | |
| 8 | | |
| 322 | | |
| 195 | | |
| 60.6 | % | |
$ | 211 | | |
| 140 | | |
| 121 | | |
| 86.4 | % | |
$ | 1,027 | |
| Tennessee (1) | |
| 8 | | |
| 710 | | |
| 368 | | |
| 342 | | |
| 1,947 | | |
| 1,834 | | |
| 94.2 | % | |
$ | 548 | | |
| 916 | | |
| 884 | | |
| 96.5 | % | |
$ | 963 | |
Total
as of June 30, 2024 (1) | |
| 136 | | |
| 7,815 | | |
| 5,639 | | |
| 2,176 | | |
| 25,787 | | |
| 22,526 | | |
| 87.4 | % | |
$ | 531 | | |
| 10,136 | | |
| 9,630 | | |
| 95.0 | % | |
$ | 960 | |
| (1) |
As
of January 1, 2024, includes Duck River Estates, a newly constructed community. |
| (2) |
Total
and Vacant Acreage of 220 for Mountain View Estates property is included in the above summary. |
| (3) |
Includes
home and site rent charges. |
| UMH Properties, Inc. | Second Quarter FY 2024 Supplemental Information | 12 |
Same
Property Statistics
(in
thousands) (unaudited)
| | |
Three Months
Ended | | |
Six Months
Ended | |
| | |
June
30, 2024 | | |
June
30, 2023 | | |
Change | | |
%
Change | | |
June
30, 2024 | | |
June
30, 2023 | | |
Change | | |
%
Change | |
| Same Property Community Net Operating Income (“NOI”) |
| | |
| | | |
| | | |
| | | |
| | | |
| | | |
| | | |
| | | |
| | |
Rental and Related
Income | |
$ | 50,939 | | |
$ | 46,722 | | |
$ | 4,217 | | |
| 9.0 | % | |
$ | 100,639 | | |
$ | 91,711 | | |
$ | 8,928 | | |
| 9.7 | % |
Community Operating
Expenses | |
| 20,022 | | |
| 18,863 | | |
| 1,159 | | |
| 6.1 | % | |
| 39,690 | | |
| 37,872 | | |
| 1,818 | | |
| 4.8 | % |
| | |
| | | |
| | | |
| | | |
| | | |
| | | |
| | | |
| | | |
| | |
Same
Property Community
NOI | |
$ | 30,917 | | |
$ | 27,859 | | |
$ | 3,058 | | |
| 11.0 | % | |
$ | 60,949 | | |
$ | 53,839 | | |
$ | 7,110 | | |
| 13.2 | % |
| | |
June
30, 2024 | | |
June
30, 2023 | | |
Change | |
| | |
| | |
| | |
| |
| Total Sites | |
| 25,457 | | |
| 25,405 | | |
| 0.2 | % |
| Occupied Sites | |
| 22,333 | | |
| 21,953 | | |
| 380
sites, 1.7 | % |
| Occupancy % | |
| 87.7 | % | |
| 86.4 | % | |
| 130
bps | |
| Number of Properties | |
| 133 | | |
| 133 | | |
| N/A | |
| Total Rentals | |
| 9,980 | | |
| 9,513 | | |
| 4.9 | % |
| Occupied Rentals | |
| 9,485 | | |
| 8,939 | | |
| 6.1 | % |
| Rental Occupancy | |
| 95.0 | % | |
| 94.0 | % | |
| 100
bps | |
| Monthly Rent Per Site | |
$ | 534 | | |
$ | 509 | | |
| 4.9 | % |
| Monthly Rent Per Home Rental Including Site | |
$ | 958 | | |
$ | 903 | | |
| 6.1 | % |
Same
Property includes all properties owned as of January 1, 2023, with the exception of Memphis Blues and Duck River Estates.
| UMH Properties, Inc. | Second Quarter FY 2024 Supplemental Information | 13 |
Acquisitions
Summary
(dollars
in thousands)
Year of
Acquisition | |
Number
of Communities | | |
Sites | | |
Occupancy
% at
Acquisition | | |
Purchase Price | | |
Price Per
Site | | |
Total
Acres | |
| 2021 | |
3 | | |
543 | | |
| 59 | % | |
$ | 18,300 | | |
$ | 34 | | |
113 | |
| 2022 | |
7 | | |
1,480 | | |
| 65 | % | |
$ | 86,223 | | |
$ | 58 | | |
461 | |
| 2023 | |
1 | | |
118 | | |
| -0- | % | |
$ | 3,650 | | |
$ | 31 | | |
26 | |
| UMH Properties, Inc. | Second Quarter FY 2024 Supplemental Information | 14 |
Definitions
Investors
and analysts following the real estate industry utilize funds from operations available to common shareholders (“FFO”), normalized
funds from operations available to common shareholders (“Normalized FFO”), Community NOI, Same Property Community NOI, and
earnings before interest, taxes, depreciation, amortization and acquisition costs (“Adjusted EBITDA excluding Non-Recurring Other
Expense”), variously defined, as supplemental performance measures. While the Company believes net income (loss) available to common
shareholders, as defined by accounting principles generally accepted in the United States of America (U.S. GAAP), is the most appropriate
measure, it considers Community NOI, Same Property Community NOI, Adjusted EBITDA excluding Non-Recurring Other Expense, FFO and Normalized
FFO, given their wide use by and relevance to investors and analysts, appropriate supplemental performance measures. FFO, reflecting
the assumption that real estate asset values rise or fall with market conditions, principally adjusts for the effects of U.S. GAAP depreciation
and amortization of real estate assets. FFO also adjusts for the effects of the change in the fair value of marketable securities and
gains and losses realized on marketable securities. Normalized FFO reflects the same assumptions as FFO except that it also adjusts for
amortization of financing costs and certain one-time charges. Community NOI and Same Property Community NOI provide a measure of rental
operations and do not factor in depreciation and amortization and non-property specific expenses such as general and administrative expenses.
Adjusted EBITDA excluding Non-Recurring Other Expense provides a tool to further evaluate the ability to incur and service debt and to
fund dividends and other cash needs. In addition, Community NOI, Same Property Community NOI, Adjusted EBITDA, excluding Non-Recurring
Other Expense, FFO and Normalized FFO are commonly used in various ratios, pricing multiples, yields and returns and valuation of calculations
used to measure financial position, performance and value.
FFO,
as defined by The National Association of Real Estate Investment Trusts (“Nareit”), is calculated to be equal to net income
(loss) applicable to common shareholders, as defined by U.S. GAAP, excluding gains or losses from sales of previously depreciated real
estate assets, impairment charges related to depreciable real estate assets, the change in the fair value of marketable securities, and
the gain or loss on the sale of marketable securities plus certain non-cash items such as real estate asset depreciation and amortization.
Included in the Nareit FFO White Paper - 2018 Restatement, is an option pertaining to assets incidental to our main business in the calculation
of Nareit FFO to make an election to include or exclude gains and losses on the sale of these assets, such as marketable equity securities,
and include or exclude mark-to-market changes in the value recognized on these marketable equity securities. In conjunction with the
adoption of the FFO White Paper - 2018 Restatement, for all periods presented, we have elected to exclude the gains and losses realized
on marketable securities and change in the fair value of marketable securities from our FFO calculation. Nareit created FFO as a non-GAAP
supplemental measure of REIT operating performance.
Normalized
FFO is calculated as FFO excluding amortization and certain one-time charges.
Normalized
FFO per Diluted Common Share is calculated using diluted weighted shares outstanding of 71.9 million and 70.7 million shares for
the three and six months ended June 30, 2024, respectively, and 61.8 million and 60.8 million shares for the three and six months ended
June 30, 2023, respectively. Common stock equivalents resulting from stock options in the amount of 466,000 shares for the three months
ended June 30, 2024, were included in the computation of Diluted Net Income per Share. Common stock equivalents resulting from stock
options in the amount of 409,000 for the six months ended June 30, 2024, and 524,000 and 658,000 for the three and six months ended June
30, 2023, respectively, were excluded from the computation of Diluted Net Loss per Share as their effect would have been anti-dilutive.
Community
NOI is calculated as rental and related income less community operating expenses such as real estate taxes, repairs and maintenance,
community salaries, utilities, insurance and other expenses.
Same
Property Community NOI is calculated as Community NOI, using all properties owned as of January 1, 2023, with the exception of Memphis
Blues and Duck River Estates.
Adjusted
EBITDA excluding Non-Recurring Other Expense is calculated as net income (loss) plus interest expense, franchise taxes, depreciation,
the change in the fair value of marketable securities and the gain (loss) on sales of marketable securities, adjusted for non-recurring
other expenses.
Community
NOI, Same Property Community NOI, Adjusted EBITDA excluding Non-Recurring Other Expense, FFO and Normalized FFO do not represent
cash generated from operating activities in accordance with U.S. GAAP and are not necessarily indicative of cash available to fund cash
needs, including the repayment of principal on debt and payment of dividends and distributions. Community NOI, Same Property Community
NOI, Adjusted EBITDA excluding Non-Recurring Other Expense, FFO and Normalized FFO should not be considered as substitutes for net income
(loss) applicable to common shareholders (calculated in accordance with U.S. GAAP) as a measure of results of operations, or cash flows
(calculated in accordance with U.S. GAAP) as a measure of liquidity. Community NOI, Same Property Community NOI, Adjusted EBITDA excluding
Non-Recurring Other Expense, FFO and Normalized FFO as currently calculated by the Company may not be comparable to similarly titled,
but variously calculated, measures of other REITs.
| UMH Properties, Inc. | Second Quarter FY 2024 Supplemental Information | 15 |
Press
Release Dated August 6, 2024
| FOR
IMMEDIATE RELEASE |
August
6, 2024 |
| |
Contact:
Nelli Madden |
| |
732-577-9997 |
UMH
PROPERTIES, INC. REPORTS RESULTS FOR THE SECOND QUARTER ENDED JUNE 30, 2024
FREEHOLD,
NJ, August 6, 2024........ UMH Properties, Inc. (NYSE:UMH) (TASE:UMH) reported Total Income for the quarter ended June 30, 2024 of
$60.3 million as compared to $55.3 million for the quarter ended June 30, 2023, representing an increase of 9%. Net Income Attributable
to Common Shareholders amounted to $527,000 or $0.01 per diluted share for the quarter ended June 30, 2024 as compared to a Net Loss
of $4.4 million or $0.07 per diluted share for the quarter ended June 30, 2023. Normalized Funds from Operations Attributable to Common
Shareholders (“Normalized FFO”), was $16.8 million or $0.23 per diluted share for the quarter ended June 30, 2024, as compared
to $13.0 million or $0.21 per diluted share for the quarter ended June 30, 2023, representing a 10% per diluted share increase.
A
summary of significant financial information for the three and six months ended June 30, 2024 and 2023 is as follows (in thousands
except per share amounts):
| | |
Three Months
Ended | |
| | |
June 30, | |
| | |
2024 | | |
2023 | |
| | |
| | |
| |
| Total Income | |
$ | 60,328 | | |
$ | 55,290 | |
| Total Expenses | |
$ | 49,307 | | |
$ | 46,371 | |
| Net Income (Loss) Attributable to Common Shareholders | |
$ | 527 | | |
$ | (4,418 | ) |
| Net Income (Loss) Attributable to Common Shareholders per Diluted Common Share | |
$ | (0.01 | ) | |
$ | (0.07 | ) |
| FFO (1) | |
$ | 16,182 | | |
$ | 12,043 | |
| FFO (1) per Diluted Common Share | |
$ | 0.23 | | |
$ | 0.19 | |
| Normalized FFO (1) | |
$ | 16,807 | | |
$ | 13,049 | |
| Normalized FFO (1)
per Diluted Common Share | |
$ | 0.23 | | |
$ | 0.21 | |
| Basic Weighted Average Shares Outstanding | |
| 71,418 | | |
| 61,236 | |
| Diluted Weighted Average Shares Outstanding | |
| 71,884 | | |
| 61,760 | |
| | |
Six Months
Ended | |
| | |
June 30, | |
| | |
2024 | | |
2023 | |
| | |
| | |
| |
| Total Income | |
$ | 118,008 | | |
$ | 107,897 | |
| Total Expenses | |
$ | 97,715 | | |
$ | 91,611 | |
| Net Loss Attributable to Common Shareholders | |
$ | (5,737 | ) | |
$ | (9,715 | ) |
| Net Loss Attributable to Common Shareholders
per Diluted Common Share | |
$ | (0.08 | ) | |
$ | (0.16 | ) |
| FFO (1) | |
$ | 30,228 | | |
$ | 22,683 | |
| FFO (1) per Diluted Common Share | |
$ | 0.43 | | |
$ | 0.37 | |
| Normalized FFO (1) | |
$ | 31,824 | | |
$ | 24,769 | |
| Normalized FFO (1)
per Diluted Common Share | |
$ | 0.45 | | |
$ | 0.41 | |
| Basic Weighted Average Shares Outstanding | |
| 70,291 | | |
| 60,186 | |
| Diluted Weighted Average Shares Outstanding | |
| 70,700 | | |
| 60,844 | |
| UMH Properties, Inc. | Second Quarter FY 2024 Supplemental Information | 16 |
A
summary of significant balance sheet information as of June 30, 2024 and December 31, 2023 is as follows (in thousands):
| | |
June
30, 2024 | | |
December
31, 2023 | |
| | |
| | |
| |
| Gross Real Estate Investments | |
$ | 1,574,196 | | |
$ | 1,539,041 | |
| Marketable Securities at Fair Value | |
$ | 28,673 | | |
$ | 34,506 | |
| Total Assets | |
$ | 1,441,295 | | |
$ | 1,427,577 | |
| Mortgages Payable, net | |
$ | 491,030 | | |
$ | 496,483 | |
| Loans Payable, net | |
$ | 77,367 | | |
$ | 93,479 | |
| Bonds Payable, net | |
$ | 100,479 | | |
$ | 100,055 | |
| Total Shareholders’ Equity | |
$ | 743,980 | | |
$ | 706,794 | |
Samuel
A. Landy, President and CEO, commented on the results of the second quarter of 2024.
“We
are pleased to announce another solid quarter of operating results. During the quarter, we:
| |
● |
Increased Rental and Related
Income by 9%; |
| |
● |
Increased Sales of Manufactured Homes by 7%; |
| |
● |
Increased Community Net Operating Income (“NOI”)
by 11%; |
| |
● |
Increased Same Property NOI by 11%; |
| |
● |
Increased Same Property Occupancy by 130 basis
points from 86.4% to 87.7%; |
| |
● |
Improved our Same Property expense ratio by
110 basis points from 40.4% in the second quarter of 2023 to 39.3% at quarter end; |
| |
● |
Amended our unsecured credit facility to expand
available borrowings by $80 million from $180 million to $260 million syndicated with BMO Capital Markets Corp., JPMorgan Chase Bank,
NA and Wells Fargo, N.A; |
| |
● |
For the fourth time since 2020, raised our
quarterly common stock dividend by $0.01 representing a 4.9% increase to $0.215 per share or $0.86 annually; |
| |
● |
Issued and sold approximately 2.4 million
shares of Common Stock through our At-the-Market Sale Program at a weighted average price of $15.46 per share, generating gross proceeds
of $36.9 million and net proceeds of $36.1 million, after offering expenses; |
| |
● |
Issued and sold approximately 29,000 shares
of Series D Preferred Stock through our At-the-Market Sale Program at a weighted average price of $23.18 per share, generating gross
proceeds of $670,000 and net proceeds of $659,000, after offering expenses; |
| |
● |
Subsequent to quarter end, issued and sold
approximately 765,000 shares of Common Stock through our At-the-Market Sale Program at a weighted average price of $16.94 per share,
generating net proceeds of $12.8 million, after offering expenses; and |
| |
● |
Subsequent to quarter end, issued and sold
approximately 150,000 shares of Series D Preferred Stock through our At-the-Market Sale Program at a weighted average price of $23.01
per share, generating net proceeds of $3.4 million, after offering expenses.” |
Mr.
Landy stated, “UMH is pleased to report that Normalized FFO for the second quarter increased to $0.23 from $0.21 last year, representing
an increase of approximately 10%. Sequentially, Normalized FFO increased from $0.22 to $0.23, representing an increase of approximately
5%. UMH has intentionally acquired value-added communities with vacant sites over the past 10 years. We have been improving the communities
through our capital improvements, adding approximately 800 homes per year and selling 200 homes per year. These investments have added
to the supply of affordable housing and generated best-in-class operating results.
“Our
same property operating results continue to demonstrate the effectiveness of our business plan. Same property NOI increased by 11.0%
for the quarter and 13.2% for the first six months, compared to the corresponding prior year periods. UMH has now increased same property
NOI by double digits for four consecutive quarters. This increase was driven by an increase in rental and related income of 9.0% and
9.7% for the three and six months, respectively, partially offset by an increase in same property expenses of 6.1% and 4.8%, respectively.
The growth in rental and related income is primarily attributed to a strong increase in occupancy of 380 units and rental rate increases
of 4.9%.
| UMH Properties, Inc. | Second Quarter FY 2024 Supplemental Information | 17 |
“Our
sales for the quarter increased from $8.2 million to $8.8 million, representing an increase of 7%. Notably, our gross margin increased
from 30% last year to 38% this year. Sales demand remains strong, and we anticipate another solid quarter of profitable home sales in
the third quarter.
“We
are initiating guidance for the remainder of 2024, with Normalized FFO in a range of $0.91-0.95 per diluted share for the full year,
or $0.93 at the midpoint. This represents approximately 8% annual normalized FFO growth at the midpoint over full year 2023 Normalized
FFO of $0.86 per diluted share.
“UMH
continues to execute on our long-term business plan of acquiring communities. Our high-quality communities continue to experience strong
demand for our products, which is translating to growing occupancy, net operating income and property value. Our 3,300 vacant sites and
2,200 acres of vacant land give us a runway to generate earnings growth for years to come. We maintain a strong balance sheet to ensure
that we can execute our organic growth plan and be prepared when external acquisition opportunities become available. This strategy has
allowed us to build a first-class portfolio of manufactured housing communities that deliver shareholders a resilient and growing dividend,
greater scale, and improved net asset value per share.”
UMH
Properties, Inc. will host its Second Quarter 2024 Financial Results Webcast and Conference Call. Senior management will discuss the
results, current market conditions and future outlook on Wednesday, August 7, 2024, at 10:00 a.m. Eastern Time.
The
Company’s 2024 second quarter financial results being released herein will be available on the Company’s website at www.umh.reit
in the “Financials” section.
To
participate in the webcast, select the webcast icon on the homepage of the Company’s website at www.umh.reit, in the Upcoming Events
section. Interested parties can also participate via conference call by calling toll free 877-513-1898 (domestically) or 412-902-4147
(internationally).
The
replay of the conference call will be available at 12:00 p.m. Eastern Time on Wednesday, August 7, 2024, and can be
accessed by dialing toll free 877-344-7529 (domestically) and 412-317-0088 (internationally) and entering the passcode 7242441. A
transcript of the call and the webcast replay will be available at the Company’s website, www.umh.reit.
UMH
Properties, Inc., which was organized in 1968, is a public equity REIT that owns and operates 136 manufactured home communities containing
approximately 25,800 developed homesites. These communities are located in New Jersey, New York, Ohio, Pennsylvania, Tennessee, Indiana,
Maryland, Michigan, Alabama, South Carolina and Georgia. UMH also has an ownership interest in and operates two communities in Florida,
containing 363 sites, through its joint venture with Nuveen Real Estate.
Certain
statements included in this press release which are not historical facts may be deemed forward-looking statements within the meaning
of the Private Securities Litigation Reform Act of 1995. Any such forward-looking statements are based on the Company’s current
expectations and involve various risks and uncertainties. Although the Company believes the expectations reflected in any forward-looking
statements are based on reasonable assumptions, the Company can provide no assurance those expectations will be achieved. The risks and
uncertainties that could cause actual results or events to differ materially from expectations are contained in the Company’s annual
report on Form 10-K and described from time to time in the Company’s other filings with the SEC. The Company undertakes no obligation
to publicly update or revise any forward-looking statements whether as a result of new information, future events, or otherwise.
| UMH Properties, Inc. | Second Quarter FY 2024 Supplemental Information | 18 |
Note:
| |
(1) |
Non-GAAP Information: We
assess and measure our overall operating results based upon an industry performance measure referred to as Funds from Operations Attributable
to Common Shareholders (“FFO”), which management believes is a useful indicator of our operating performance. FFO is used
by industry analysts and investors as a supplemental operating performance measure of a REIT. FFO, as defined by The National Association
of Real Estate Investment Trusts (“NAREIT”), represents net income (loss) attributable to common shareholders, as defined
by accounting principles generally accepted in the United States of America (“U.S. GAAP”), excluding gains or losses from
sales of previously depreciated real estate assets, impairment charges related to depreciable real estate assets, the change in the
fair value of marketable securities, and the gain or loss on the sale of marketable securities plus certain non-cash items such as
real estate asset depreciation and amortization. Included in the NAREIT FFO White Paper - 2018 Restatement, is an option pertaining
to assets incidental to our main business in the calculation of NAREIT FFO to make an election to include or exclude gains and losses
on the sale of these assets, such as marketable equity securities, and include or exclude mark-to-market changes in the value recognized
on these marketable equity securities. In conjunction with the adoption of the FFO White Paper - 2018 Restatement, for all periods
presented, we have elected to exclude the gains and losses realized on marketable securities investments and the change in the fair
value of marketable securities from our FFO calculation. NAREIT created FFO as a non-U.S. GAAP supplemental measure of REIT operating
performance. We define Normalized Funds from Operations Attributable to Common Shareholders (“Normalized FFO”), as FFO
excluding certain one-time charges. FFO and Normalized FFO should be considered as supplemental measures of operating performance used
by REITs. FFO and Normalized FFO exclude historical cost depreciation as an expense and may facilitate the comparison of REITs which
have a different cost basis. However, other REITs may use different methodologies to calculate FFO and Normalized FFO and, accordingly,
our FFO and Normalized FFO may not be comparable to all other REITs. The items excluded from FFO and Normalized FFO are significant
components in understanding the Company’s financial performance. |
| |
|
|
| |
|
FFO
and Normalized FFO (i) do not represent Cash Flow from Operations as defined by U.S. GAAP; (ii) should not be considered as alternatives
to net income (loss) as a measure of operating performance or to cash flows from operating, investing and financing activities; and (iii)
are not alternatives to cash flow as a measure of liquidity. FFO and Normalized FFO, as calculated by the Company, may not be comparable
to similarly titled measures reported by other REITs.
|
| |
|
|
| |
|
The
diluted weighted shares outstanding used in the calculation of FFO per Diluted Common Share and Normalized FFO per Diluted Common Share
were 71.9 million and 70.7 million shares for the three and six months ended June 30, 2024, respectively, and 61.8 million and 60.8 million
shares for the three and six months ended June 30, 2023, respectively. Common stock equivalents resulting from stock options in the amount
of 409,000 for the six months ended June 30, 2024, were excluded from the computation of the Diluted Net Loss per Share as their effect
would be anti-dilutive. Common stock equivalents resulting from employee stock options to purchase 4.0 million shares of common stock
amounted to 466,000 shares, for the three months ended June 30, 2024, were included in the computation of Diluted Net Income per Share.
Common stock equivalents resulting from stock options in the amount of 524,000 and 658,000 shares for the three and six months ended
June 30, 2023, respectively, were excluded from the computation of the Diluted Net Loss per Share as their effect would be anti-dilutive.
|
| |
|
|
| |
|
The
reconciliation of the Company’s U.S. GAAP net income (loss) to the Company’s FFO and Normalized FFO for the three and six
months ended June 30, 2024 and 2023 are calculated as follows (in thousands):
|
| | |
Three
Months Ended | | |
Six
Months Ended | |
| | |
June 30, 2024 | | |
June 30, 2023 | | |
June 30, 2024 | | |
June 30, 2023 | |
| Net Income (Loss) Attributable
to Common Shareholders | |
$ | 527 | | |
$ | (4,418 | ) | |
$ | (5,737 | ) | |
$ | (9,715 | ) |
| Depreciation Expense | |
| 15,001 | | |
| 13,751 | | |
| 29,742 | | |
| 27,124 | |
| Depreciation Expense from Unconsolidated Joint
Venture | |
| 204 | | |
| 166 | | |
| 401 | | |
| 325 | |
| (Gain) Loss on Sales of Depreciable Assets | |
| 10 | | |
| (5 | ) | |
| 13 | | |
| (37 | ) |
| (Increase) Decrease in Fair Value of Marketable
Securities | |
| (3,338 | ) | |
| 2,548 | | |
| 2,031 | | |
| 4,943 | |
| Loss on Sales of Marketable
Securities, net | |
| 3,778 | | |
| 1 | | |
| 3,778 | | |
| 43 | |
| FFO Attributable to Common
Shareholders | |
| 16,182 | | |
| 12,043 | | |
| 30,228 | | |
| 22,683 | |
| Amortization of Financing Costs | |
| 607 | | |
| 538 | | |
| 1,163 | | |
| 1,056 | |
| Non-Recurring
Other Expense (a) | |
| 18 | | |
| 468 | | |
| 433 | | |
| 1,030 | |
| Normalized
FFO Attributable to Common Shareholders | |
$ | 16,807 | | |
$ | 13,049 | | |
$ | 31,824 | | |
$ | 24,769 | |
(a)
Consists of non-recurring one-time legal fees ($18 and $51, respectively), and costs associated with the liquidation/sale of inventory
in a particular sales center ($0 and $382, respectively) for the three and six months ended June 30, 2024. Consists of special bonus
and restricted stock grants for the August 2020 groundbreaking Fannie Mae financing, which are being expensed over the vesting period
($431 and $862, respectively) and non-recurring expenses for the joint venture with Nuveen ($3 and $50, respectively), one-time legal
fees ($30 and $50, respectively), fees related to the establishment of the OZ Fund ($4 and $37, respectively), and costs associated with
an acquisition that was not completed ($0 and $31, respectively) for the three and six months ended June 30, 2023.
| UMH Properties, Inc. | Second Quarter FY 2024 Supplemental Information | 19 |
The
following are the cash flows provided by (used in) operating, investing and financing activities for the six months ended June 30, 2024
and 2023 (in thousands):
| | |
2024 | | |
2023 | |
| Operating Activities | |
$ | 37,605 | | |
$ | 53,002 | |
| Investing Activities | |
| (58,758 | ) | |
| (94,396 | ) |
| Financing Activities | |
| 7,598 | | |
| 49,706 | |
| |
(2) |
The following are the assumptions
used in the 2024 Normalized FFO guidance: |
| |
- |
Rent increases of 5%; |
| |
- |
Occupancy of 400 rental units in the second
half of 2024; |
| |
- |
Overall capital needs to fund rental home
purchases, notes, expansions, and improvements of approximately $110-$120 million for the year; |
| |
-
|
Includes the opportunistic
sales of common and preferred stock through our ATM programs; and |
| |
- |
Excludes any potential acquisitions, dispositions,
and development projects. |
# # # #

| UMH Properties, Inc. | Second Quarter FY 2024 Supplemental Information | 20 |
Cover
|
Aug. 06, 2024 |
| Document Type |
8-K
|
| Amendment Flag |
false
|
| Document Period End Date |
Aug. 06, 2024
|
| Entity File Number |
001-12690
|
| Entity Registrant Name |
UMH
Properties, Inc.
|
| Entity Central Index Key |
0000752642
|
| Entity Tax Identification Number |
22-1890929
|
| Entity Incorporation, State or Country Code |
MD
|
| Entity Address, Address Line One |
Juniper
Business Plaza
|
| Entity Address, Address Line Two |
3499 Route 9 North
|
| Entity Address, Address Line Three |
Suite 3-C
|
| Entity Address, City or Town |
Freehold
|
| Entity Address, State or Province |
NJ
|
| Entity Address, Postal Zip Code |
07728
|
| City Area Code |
(732)
|
| Local Phone Number |
577-9997
|
| Written Communications |
false
|
| Soliciting Material |
false
|
| Pre-commencement Tender Offer |
false
|
| Pre-commencement Issuer Tender Offer |
false
|
| Entity Emerging Growth Company |
false
|
| Common Stock, $0.10 par value |
|
| Title of 12(b) Security |
Common
Stock, $0.10 par value
|
| Trading Symbol |
UMH
|
| Security Exchange Name |
NYSE
|
| 6.375% Series D Cumulative Redeemable Preferred Stock, $0.10 par value |
|
| Title of 12(b) Security |
6.375%
Series D Cumulative Redeemable Preferred Stock, $0.10 par value
|
| Trading Symbol |
UMH
PD
|
| Security Exchange Name |
NYSE
|
| X |
- DefinitionBoolean flag that is true when the XBRL content amends previously-filed or accepted submission.
| Name: |
dei_AmendmentFlag |
| Namespace Prefix: |
dei_ |
| Data Type: |
xbrli:booleanItemType |
| Balance Type: |
na |
| Period Type: |
duration |
|
| X |
- DefinitionFor the EDGAR submission types of Form 8-K: the date of the report, the date of the earliest event reported; for the EDGAR submission types of Form N-1A: the filing date; for all other submission types: the end of the reporting or transition period. The format of the date is YYYY-MM-DD.
| Name: |
dei_DocumentPeriodEndDate |
| Namespace Prefix: |
dei_ |
| Data Type: |
xbrli:dateItemType |
| Balance Type: |
na |
| Period Type: |
duration |
|
| X |
- DefinitionThe type of document being provided (such as 10-K, 10-Q, 485BPOS, etc). The document type is limited to the same value as the supporting SEC submission type, or the word 'Other'.
| Name: |
dei_DocumentType |
| Namespace Prefix: |
dei_ |
| Data Type: |
dei:submissionTypeItemType |
| Balance Type: |
na |
| Period Type: |
duration |
|
| X |
- DefinitionAddress Line 1 such as Attn, Building Name, Street Name
| Name: |
dei_EntityAddressAddressLine1 |
| Namespace Prefix: |
dei_ |
| Data Type: |
xbrli:normalizedStringItemType |
| Balance Type: |
na |
| Period Type: |
duration |
|
| X |
- DefinitionAddress Line 2 such as Street or Suite number
| Name: |
dei_EntityAddressAddressLine2 |
| Namespace Prefix: |
dei_ |
| Data Type: |
xbrli:normalizedStringItemType |
| Balance Type: |
na |
| Period Type: |
duration |
|
| X |
- DefinitionAddress Line 3 such as an Office Park
| Name: |
dei_EntityAddressAddressLine3 |
| Namespace Prefix: |
dei_ |
| Data Type: |
xbrli:normalizedStringItemType |
| Balance Type: |
na |
| Period Type: |
duration |
|
| X |
- Definition
+ References
+ Details
| Name: |
dei_EntityAddressCityOrTown |
| Namespace Prefix: |
dei_ |
| Data Type: |
xbrli:normalizedStringItemType |
| Balance Type: |
na |
| Period Type: |
duration |
|
| X |
- DefinitionCode for the postal or zip code
| Name: |
dei_EntityAddressPostalZipCode |
| Namespace Prefix: |
dei_ |
| Data Type: |
xbrli:normalizedStringItemType |
| Balance Type: |
na |
| Period Type: |
duration |
|
| X |
- DefinitionName of the state or province.
| Name: |
dei_EntityAddressStateOrProvince |
| Namespace Prefix: |
dei_ |
| Data Type: |
dei:stateOrProvinceItemType |
| Balance Type: |
na |
| Period Type: |
duration |
|
| X |
- DefinitionA unique 10-digit SEC-issued value to identify entities that have filed disclosures with the SEC. It is commonly abbreviated as CIK. Reference 1: http://www.xbrl.org/2003/role/presentationRef
-Publisher SEC
-Name Exchange Act
-Number 240
-Section 12
-Subsection b-2
| Name: |
dei_EntityCentralIndexKey |
| Namespace Prefix: |
dei_ |
| Data Type: |
dei:centralIndexKeyItemType |
| Balance Type: |
na |
| Period Type: |
duration |
|
| X |
- DefinitionIndicate if registrant meets the emerging growth company criteria. Reference 1: http://www.xbrl.org/2003/role/presentationRef
-Publisher SEC
-Name Exchange Act
-Number 240
-Section 12
-Subsection b-2
| Name: |
dei_EntityEmergingGrowthCompany |
| Namespace Prefix: |
dei_ |
| Data Type: |
xbrli:booleanItemType |
| Balance Type: |
na |
| Period Type: |
duration |
|
| X |
- DefinitionCommission file number. The field allows up to 17 characters. The prefix may contain 1-3 digits, the sequence number may contain 1-8 digits, the optional suffix may contain 1-4 characters, and the fields are separated with a hyphen.
| Name: |
dei_EntityFileNumber |
| Namespace Prefix: |
dei_ |
| Data Type: |
dei:fileNumberItemType |
| Balance Type: |
na |
| Period Type: |
duration |
|
| X |
- DefinitionTwo-character EDGAR code representing the state or country of incorporation.
| Name: |
dei_EntityIncorporationStateCountryCode |
| Namespace Prefix: |
dei_ |
| Data Type: |
dei:edgarStateCountryItemType |
| Balance Type: |
na |
| Period Type: |
duration |
|
| X |
- DefinitionThe exact name of the entity filing the report as specified in its charter, which is required by forms filed with the SEC. Reference 1: http://www.xbrl.org/2003/role/presentationRef
-Publisher SEC
-Name Exchange Act
-Number 240
-Section 12
-Subsection b-2
| Name: |
dei_EntityRegistrantName |
| Namespace Prefix: |
dei_ |
| Data Type: |
xbrli:normalizedStringItemType |
| Balance Type: |
na |
| Period Type: |
duration |
|
| X |
- DefinitionThe Tax Identification Number (TIN), also known as an Employer Identification Number (EIN), is a unique 9-digit value assigned by the IRS. Reference 1: http://www.xbrl.org/2003/role/presentationRef
-Publisher SEC
-Name Exchange Act
-Number 240
-Section 12
-Subsection b-2
| Name: |
dei_EntityTaxIdentificationNumber |
| Namespace Prefix: |
dei_ |
| Data Type: |
dei:employerIdItemType |
| Balance Type: |
na |
| Period Type: |
duration |
|
| X |
- DefinitionLocal phone number for entity.
| Name: |
dei_LocalPhoneNumber |
| Namespace Prefix: |
dei_ |
| Data Type: |
xbrli:normalizedStringItemType |
| Balance Type: |
na |
| Period Type: |
duration |
|
| X |
- DefinitionBoolean flag that is true when the Form 8-K filing is intended to satisfy the filing obligation of the registrant as pre-commencement communications pursuant to Rule 13e-4(c) under the Exchange Act. Reference 1: http://www.xbrl.org/2003/role/presentationRef
-Publisher SEC
-Name Exchange Act
-Number 240
-Section 13e
-Subsection 4c
| Name: |
dei_PreCommencementIssuerTenderOffer |
| Namespace Prefix: |
dei_ |
| Data Type: |
xbrli:booleanItemType |
| Balance Type: |
na |
| Period Type: |
duration |
|
| X |
- DefinitionBoolean flag that is true when the Form 8-K filing is intended to satisfy the filing obligation of the registrant as pre-commencement communications pursuant to Rule 14d-2(b) under the Exchange Act. Reference 1: http://www.xbrl.org/2003/role/presentationRef
-Publisher SEC
-Name Exchange Act
-Number 240
-Section 14d
-Subsection 2b
| Name: |
dei_PreCommencementTenderOffer |
| Namespace Prefix: |
dei_ |
| Data Type: |
xbrli:booleanItemType |
| Balance Type: |
na |
| Period Type: |
duration |
|
| X |
- DefinitionTitle of a 12(b) registered security. Reference 1: http://www.xbrl.org/2003/role/presentationRef
-Publisher SEC
-Name Exchange Act
-Number 240
-Section 12
-Subsection b
| Name: |
dei_Security12bTitle |
| Namespace Prefix: |
dei_ |
| Data Type: |
dei:securityTitleItemType |
| Balance Type: |
na |
| Period Type: |
duration |
|
| X |
- DefinitionName of the Exchange on which a security is registered. Reference 1: http://www.xbrl.org/2003/role/presentationRef
-Publisher SEC
-Name Exchange Act
-Number 240
-Section 12
-Subsection d1-1
| Name: |
dei_SecurityExchangeName |
| Namespace Prefix: |
dei_ |
| Data Type: |
dei:edgarExchangeCodeItemType |
| Balance Type: |
na |
| Period Type: |
duration |
|
| X |
- DefinitionBoolean flag that is true when the Form 8-K filing is intended to satisfy the filing obligation of the registrant as soliciting material pursuant to Rule 14a-12 under the Exchange Act. Reference 1: http://www.xbrl.org/2003/role/presentationRef
-Publisher SEC
-Name Exchange Act
-Number 240
-Section 14a
-Subsection 12
| Name: |
dei_SolicitingMaterial |
| Namespace Prefix: |
dei_ |
| Data Type: |
xbrli:booleanItemType |
| Balance Type: |
na |
| Period Type: |
duration |
|
| X |
- DefinitionTrading symbol of an instrument as listed on an exchange.
| Name: |
dei_TradingSymbol |
| Namespace Prefix: |
dei_ |
| Data Type: |
dei:tradingSymbolItemType |
| Balance Type: |
na |
| Period Type: |
duration |
|
| X |
- DefinitionBoolean flag that is true when the Form 8-K filing is intended to satisfy the filing obligation of the registrant as written communications pursuant to Rule 425 under the Securities Act. Reference 1: http://www.xbrl.org/2003/role/presentationRef
-Publisher SEC
-Name Securities Act
-Number 230
-Section 425
| Name: |
dei_WrittenCommunications |
| Namespace Prefix: |
dei_ |
| Data Type: |
xbrli:booleanItemType |
| Balance Type: |
na |
| Period Type: |
duration |
|
| X |
- Details
| Name: |
us-gaap_StatementClassOfStockAxis=UMH_CommonStock0.10ParValueMember |
| Namespace Prefix: |
|
| Data Type: |
na |
| Balance Type: |
|
| Period Type: |
|
|
| X |
- Details
| Name: |
us-gaap_StatementClassOfStockAxis=UMH_Sec6.375SeriesDCumulativeRedeemablePreferredStock0.10ParValueMember |
| Namespace Prefix: |
|
| Data Type: |
na |
| Balance Type: |
|
| Period Type: |
|
|
UMH Properties (NYSE:UMH-D)
Historical Stock Chart
From Sep 2024 to Oct 2024

UMH Properties (NYSE:UMH-D)
Historical Stock Chart
From Oct 2023 to Oct 2024
