Hot Features

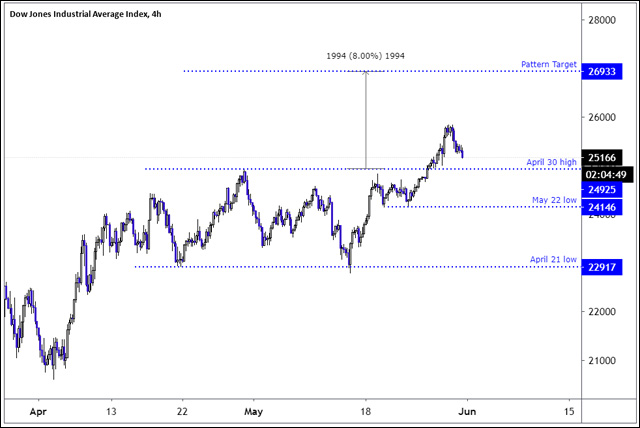
The Dow Jones has seen some strong gains in the last few weeks. Yesterday, the index was up by 13% from its May 13 low. The price has since then traded slightly lower, as traders booked profits. The trend remains nonetheless upwards, and I suspect the price might be able to reach 26855 over the next few weeks.
The reason for why I am bullish is because the Dow spent April 9 to May 25, creating a large rectangle pattern. I also think the reopening of the world economy will cause economic indicators to keep on improving.
However, if we focus on the technicals, then the Dow Jones triggered a rectangle pattern on May 26 as the price traded above the upper limit of the rectangle pattern, the April 29 high of 24925. The difference between the lower support level of the pattern at 22917, and the upper limit at 24925, is 2008. If we add this amount to the breakout point, then we arrive at the 26933 target.
The pattern will remain in play as long as the price does not decisively trades back into the pattern. I think it would do so if the price trades below the May 22 low of 24146.
Traders that spotted the pattern the pattern early are probably enjoying some floating profits. Traders that are not long the Dow Jones already will probably wait for a retest of the breakout point at 24925.
For longer-term traders, these levels matter less, as the trend will remain upwards as long as the stock index trades above the April 21 low of 22917.
Dow Jones Chart
By Alejandro Zambrano, Editor In Chief at Investingcube.com, and Chief Market Strategist at ATFX.