Technical analysis is very important for trading, but many people don’t understand what it is, nor do they know how to apply it to their own trading. The truth is, when applied correctly and objectively, technical analysis works.

So what is technical analysis? It is a trading discipline employed to evaluate investments and identify trading opportunities by analysing statistical trends gathered from trading activity, such as price movement and volume. Unlike fundamental analysts, who attempt to evaluate a security’s intrinsic value, technical analysts focus on patterns of price movements, trading signals and various other analytical charting tools to evaluate a security’s strength or weakness.
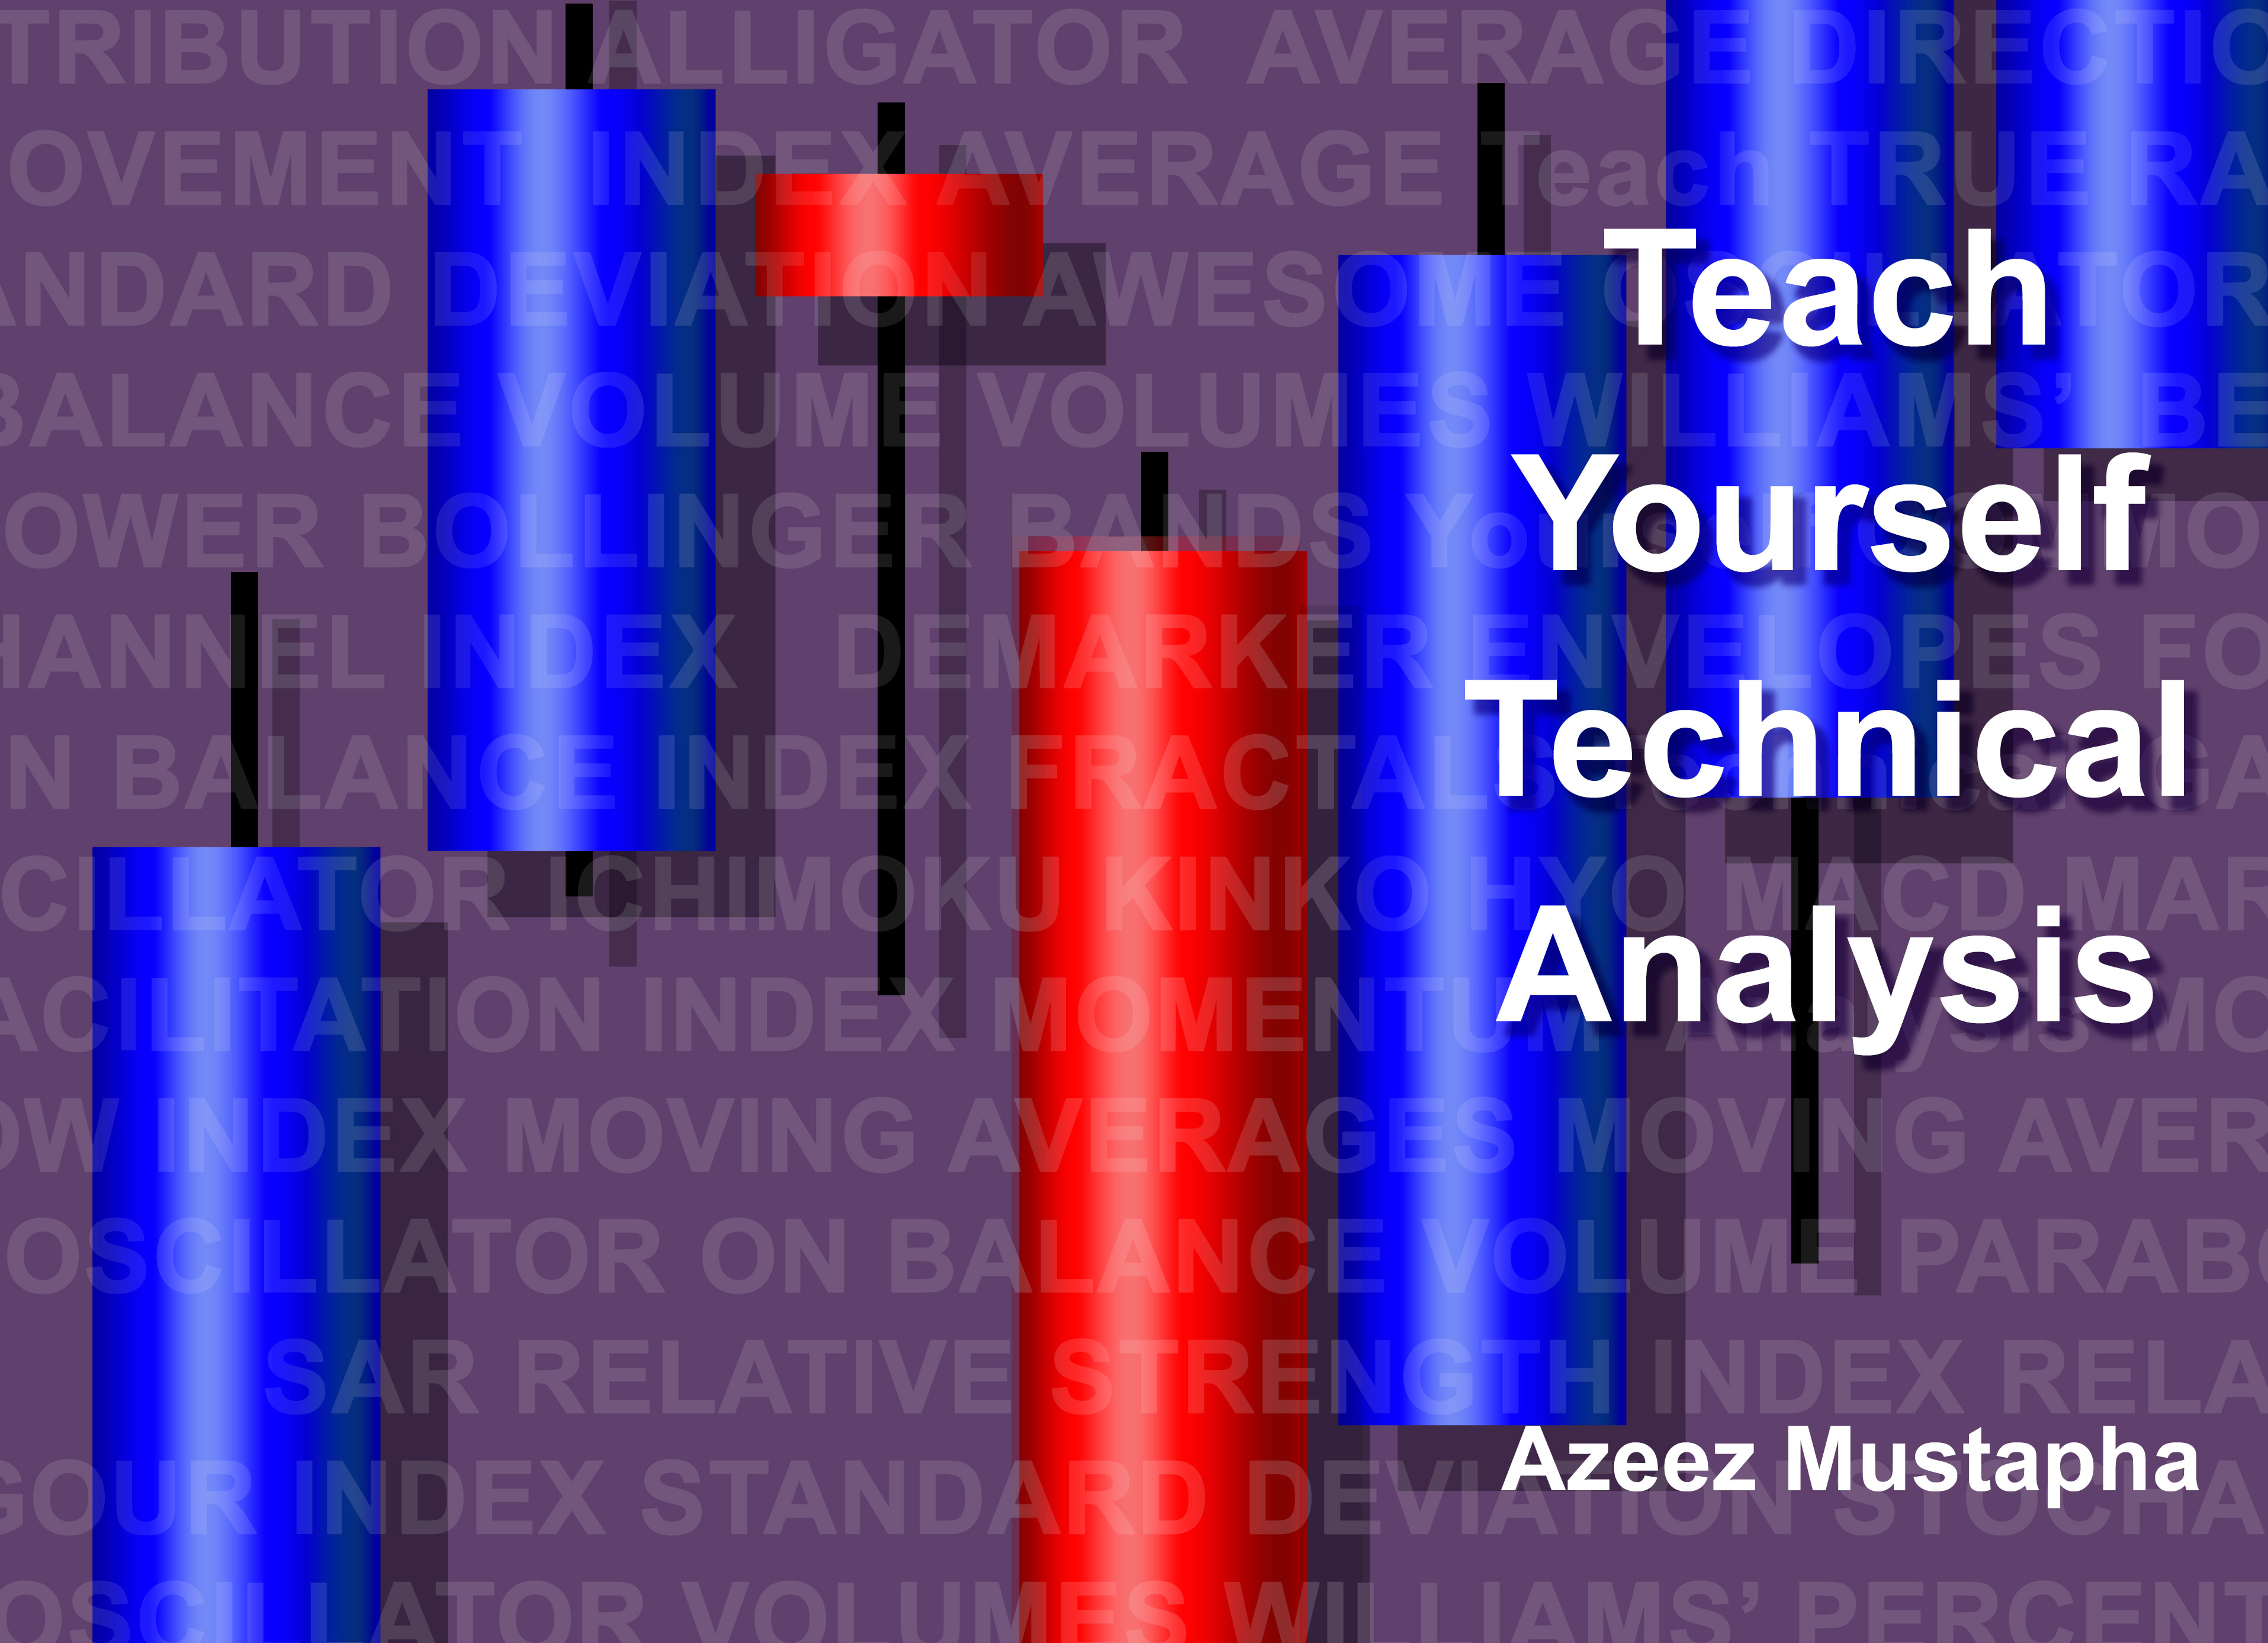
Teach Yourself Technical Analysis explains some of the common technical indicators found on charts, and how to use them in the popular Meta Trader platform. The indicators help in timing entries and exits in the market, as well as confirming and anticipating market biases. The book reveals the parameters of the indicators, applies them to charts, and shows you how each of them can be used to make trading decisions.

Now available almost free of charge!
It covers 30 different indicators, including the Accelerator Oscillator, Bollinger Bands, the DeMarker, Momentum, Moving Averages, Ichimoku Kinko Hyo and Stochastic Oscillator.
With the help of this book you will be able to apply technical analysis to your own speculation and investments, which should boost your success rate and give you satisfactory results.
The contents of this book were originally published in TRADERS’ and have been reproduced by their kind permission.
Get it here almost free of charge: Teach Yourself Technical Analysis


 Hot Features


