Key Highlights
ETH/USD battles the resistance at $1,600
There is an imminent decline as Ether retests the resistance zone

Ethereum (ETH) Current Statistics
The current price: $1,580.53
Market Capitalization: $193,415,767,026
Trading Volume: $19,294,136,500
Key Resistance Zones: $2,500, $3,300, $4,000
Key Support Zones: $2,000, $1,500, $1,000
Ethereum (ETH) Price Analysis October 28, 2022
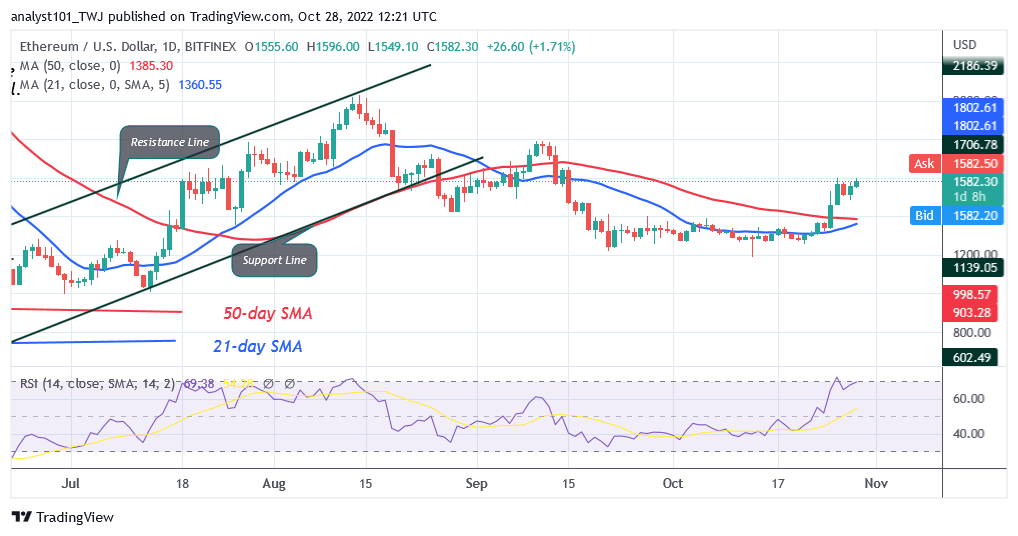
Ethereum (ETH) is in an uptrend as it breaks above the moving average lines. Since October 26, the biggest altcoin has been struggling to break above the resistance at $1,600.The altcoin rose to a high of $1,596, but it is currently being rejected. The cryptocurrency has reversed course and is currently circling above the $1,507 support. In other words, Ether is fluctuating between $1,400 and $1,600 price levels. On the plus side, the market will surge to price levels of $1,800 and $2,019 if buyers manage to overcome the resistance at $1,600. Conversely, the downtrend will restart if Ether retraces and breaks below the $1,400 support. Ether’s price will eventually drop to the range-bound area between $1,220 and $1,400 price levels.
Ethereum Technical Indicators Reading
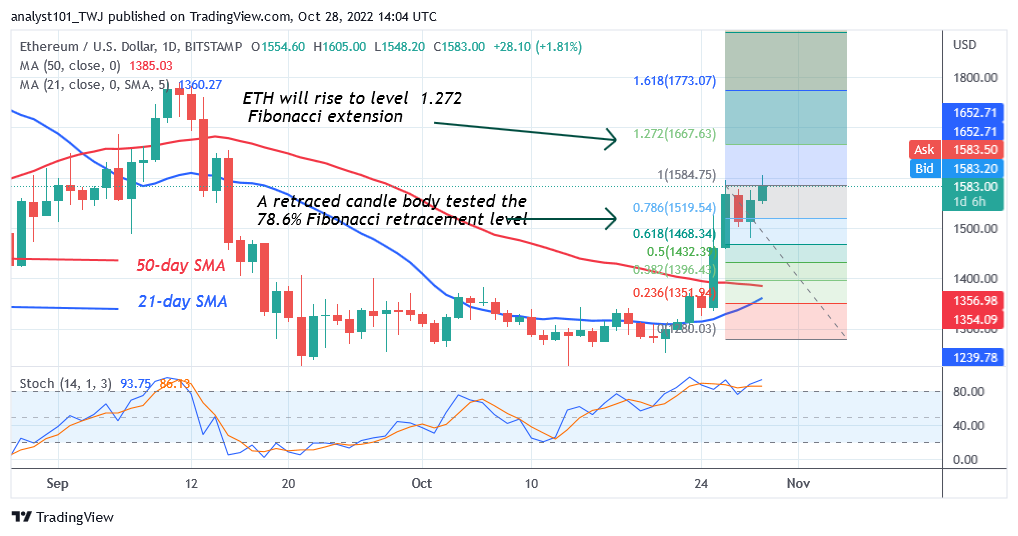
The largest altcoin is currently at level 69, based on data from the Relative Strength Index’s period 14 calculations. It implies that Ether is approaching the overbought region. It is in a bullish trend zone and may continue to increase. The moving average lines are below the price bars, indicating that the value of the currency may increase. Ether is trading in an overbought region above the daily stochastic 80% zone.
Conclusion
Ether’s price is bouncing about below the $1,600 barrier level. A retraced candle body tested the 78.6% Fibonacci retracement line on the upswing of October 26. According to the retracement, ETH is expected to grow before falling at the 1.272 Fibonacci extension level, or $1,667.63.
Learn from market wizards: Books to take your trading to the next level


 Hot Features


