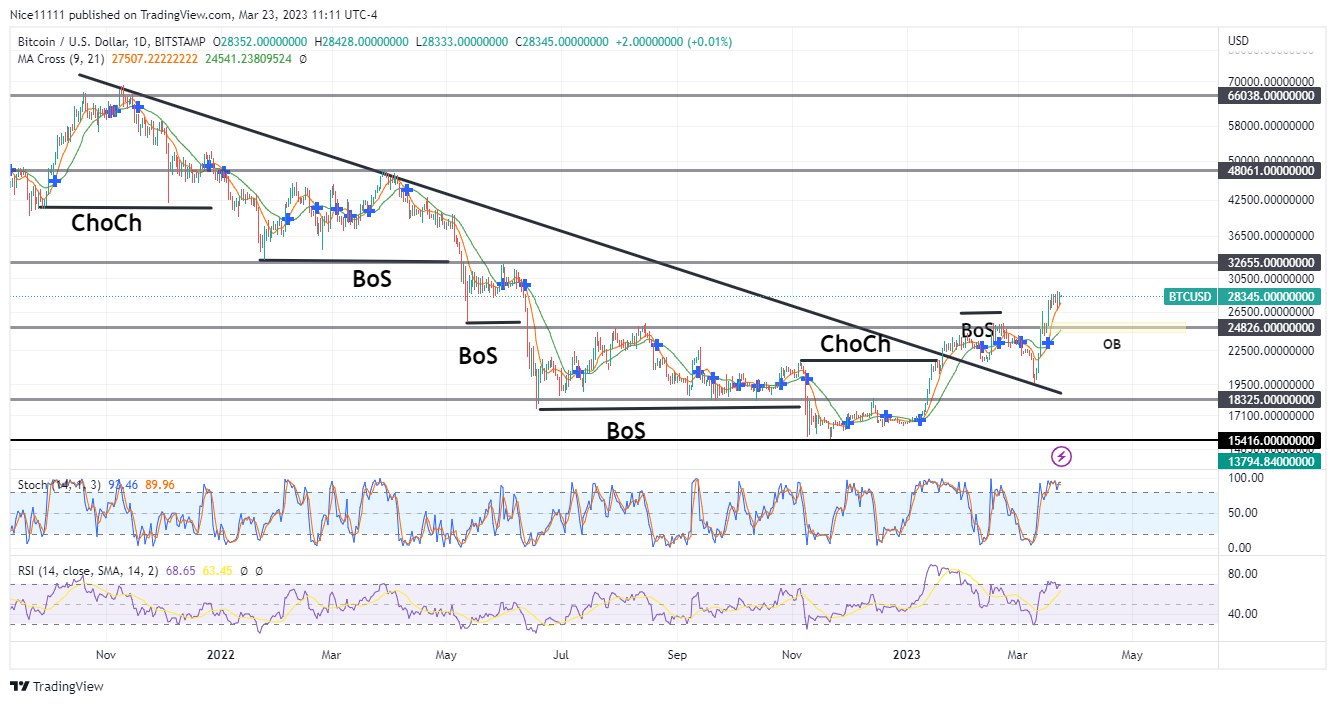
Bitcoin’s demand drove its value to an all-time high of $66000.0 in October 2021. A change of character (ChoCh) pattern was observed at the inception of 2022. The Bulls defended the previous support level of 32655.0 in January. The demand level was broken upon the second strike in May. The previous support level of $32655.0 became resistance after a test of the significant level was used to engineer a market selloff. On the daily chart, the market dipped further, with a bearish break of structure (BoS) witnessed in June and November. In November, the bearish trend came to an end with a test of the $15416.0 Demand level. The market moved sideways until the end of the year.

The new year brought volatility to the market. The Buyers rose aggressively and broke the resistance trendline. The last high, which was formed before the test of the $15416.0 support level, was swept away by a change in market direction. The market retracement to test the downward-sloping trendline after the breakout has fostered an ascent.

BTC Key Levels
Demand Levels: $24826.0, $18325.0, $15416.0
Supply Levels: $32655.0, $48061.0, $66038.0
What Are the Indicators Saying?
The Relative Strength Index and the Stochastic revealed the market was overbought as the price of BTC reached its all-time high at $66000.0. In November, the Moving Averages (periods nine and twenty-one) crossed, indicating that the market was overbought and due for a selloff. The Moving Average Period 9 swerved below the Moving Average Period 21 to confirm the bearish trend. The downward trend halted after the Stochastic and the RSI (Relative Strength Index) indicated the market was oversold at the test of the $15416.0 demand level. A retracement towards $24826.0 is currently anticipated as the Stochastic and the RSI are currently overbought.
Learn from market wizards: Books to take your trading to the next level


 Hot Features


