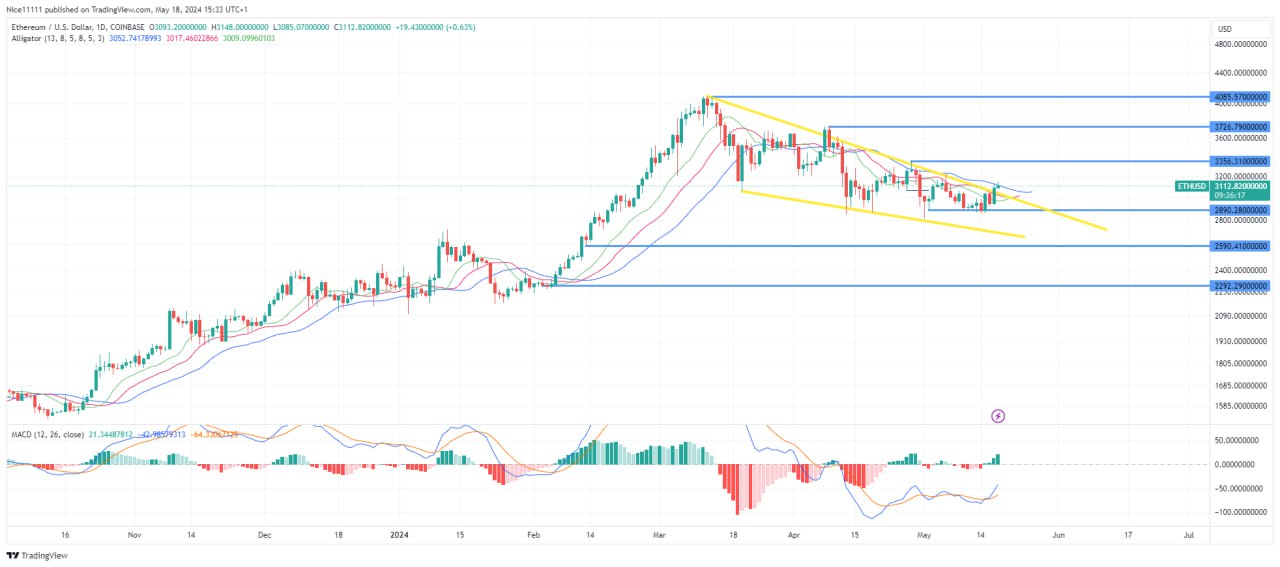
Ethereum’s recent correction appears to have concluded, with multiple bullish signals emerging on the daily timeframe. The price action on the daily chart has formed a bullish flag pattern. The price has broken through the resistance border of the falling wedge, indicating a potential for significant upward movement. Bulls are likely to capitalize on the trendline liquidity positioned above the current price, driving the price higher in the coming days.

ETH/USD Key Levels
- Demand Levels: $2,890.0, $2,590.0, $2,292.0
- Supply Levels: $3,356.0, $3,726.0, $4,085.0
What Are the Indicators Saying?
The MACD (Moving Average Convergence Divergence) revealed that the market was overbought in March, signalling the onset of a bearish trend as the daily candles dipped below the Williams Alligator. The Williams Alligator’s alignment with the resistance border of the falling wedge further supported the downward movement and resistance to market ascent.
Currently, the MACD indicates an oversold market, suggesting an imminent price increase. The rise of daily candles above the Williams Alligator confirms this upward trajectory, reflecting renewed bullish momentum. The price is expected to reach the next resistance level of $3,356.0 shortly as market conditions continue to improve.
Traders are likely to closely monitor these indicators and key levels, anticipating that the bullish trend will sustain its momentum. The confluence of these technical factors points towards a positive outlook for Ethereum in the near term, with the potential for further gains as the bullish signals align.
Learn from market wizards: Books to take your trading to the next level


 Hot Features


