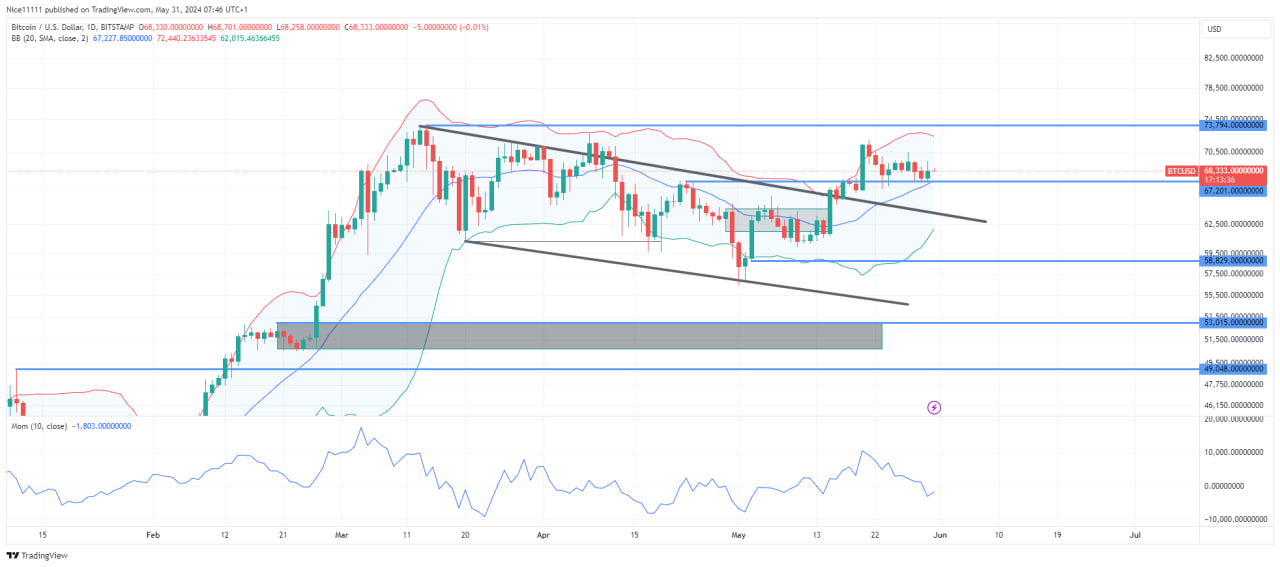
The bullish breakout marks a continuation of this trend. Following the breakout, the market returned to the bullish order block at the demand level of $67,200. The initial bounce off this zone was significant; however, the price is now showing signs of weakness as it has retested the demand level a second time.

Bitcoin has experienced a successful bullish breakout from its bearish channel, reflecting a strong upward trend on the daily chart. The price fluctuations within the channel appear to be corrections within the overall upward trend.
 Bitcoin Key Levels
- Supply Levels: $67,200.0, $73,800.0, $80,000.0
- Demand Levels: $58,830.0, $53,015.0, $49,000.0
Indicators Analysis
The momentum indicator reveals a decline in bullish momentum following the breakout, which explains the second pullback to the demand level. Despite this, the market remains bullish as the last bullish order block on the daily chart has not been invalidated. The price has pulled back to the Moving Average line within the Bollinger Bands, which is anticipated to support the market’s ascent.
This technical analysis suggests that while Bitcoin’s bullish momentum has weakened, the overall trend remains upward. The retest of the demand level at $67,200 is a critical point to monitor, as maintaining this level could provide the necessary support for the next leg up in Bitcoin’s price movement.
Learn from market wizards: Books to take your trading to the next level


 Hot Features


