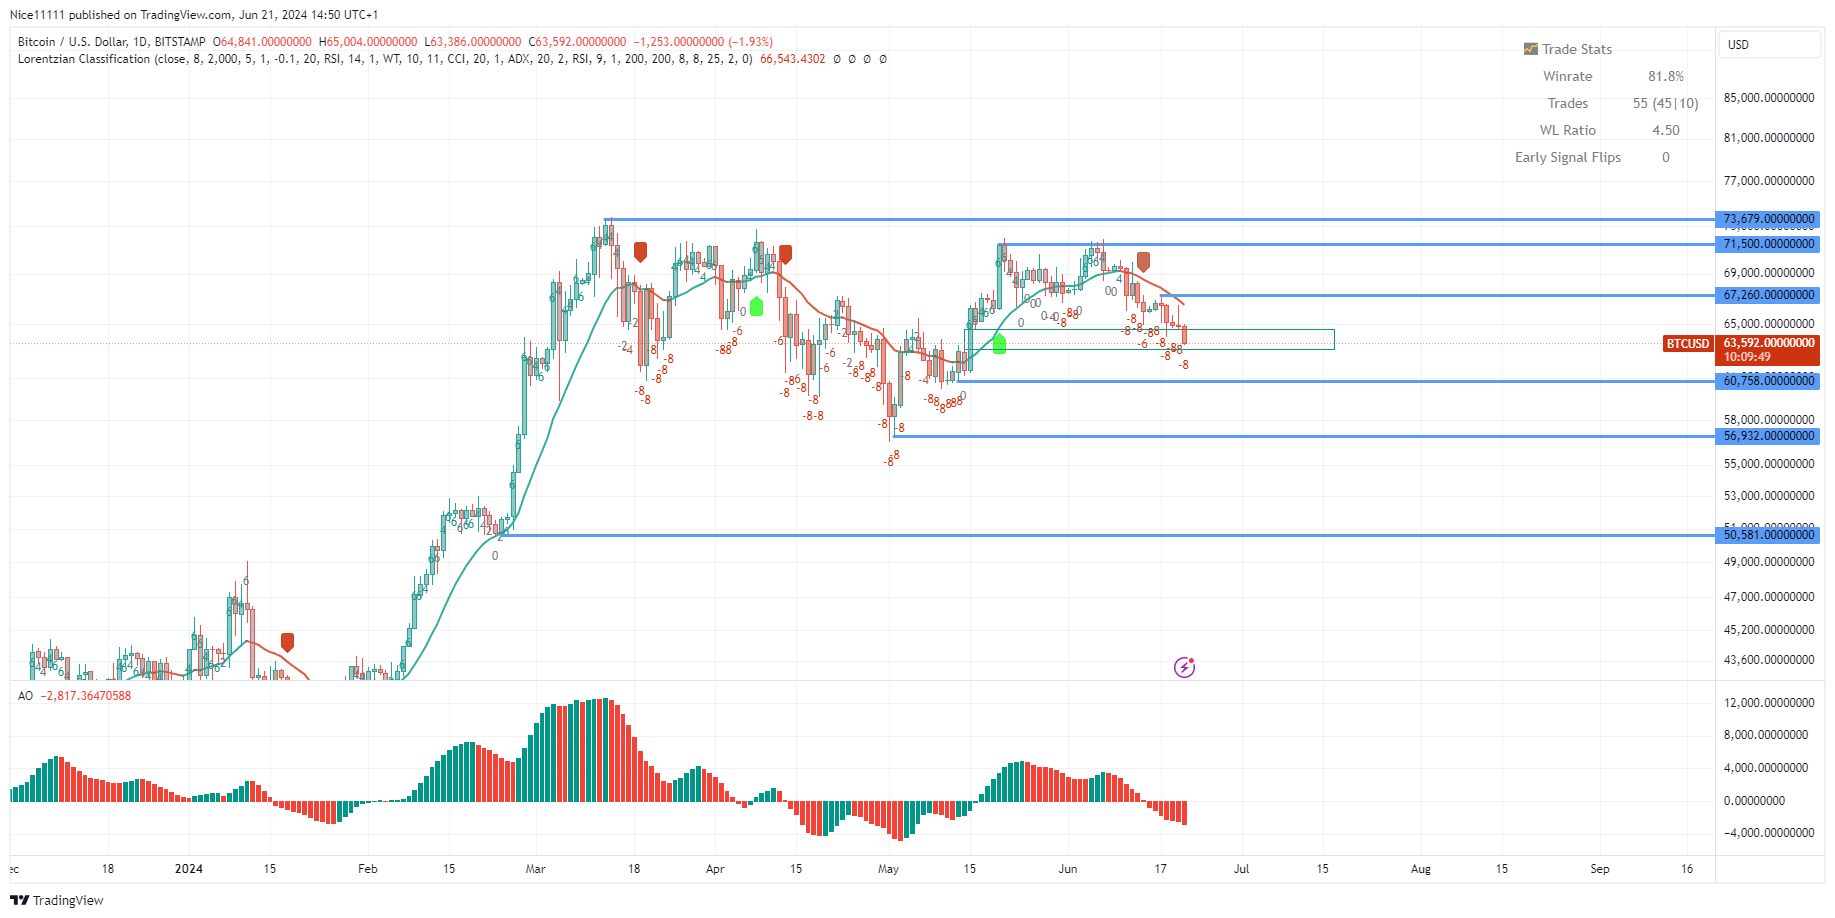
BTCUSD has been in a correction phase since the price hit 73,679.0. This correction appears to be a temporary pause in the long-term bullish trend. Within this consolidation phase, strong microtrends have emerged, offering trading opportunities. The market is now delivering the third microtrend within the ongoing consolidation. The first microtrend was bearish, established with a triple top pattern in April. The second was brief, beginning with the failure of a bearish order block in May, leading to a Change of Character (ChoCh). The current bearish trend has also formed after the break of a double-top neckline.

BTCUSD Key Levels:
Demand Levels: 60,800.0, 56,930.0, 50,580.0
Supply Levels: 67,260.0, 71,500.0, 73,680.0
 What Are the Indicators Saying?
The Awesome Oscillator has consistently followed the trend, showing negative readings for bearish microtrends and positive readings for bullish ones. In addition to the Awesome Oscillator, the Lorentizan Classification Machine Learning indicator further confirmed the current bearish microtrend. This indicator signalled a selloff just as the double top neckline broke in June. The indicator string turned red, dominating the daily candles. This bearish trend has filled a fair value gap above 60,800.0. The next psychological price, which can serve as a target, is at 60,000.0. Until a structural shift, indicators and price action suggest a prevailing downward trend.
Learn from market wizards: Books to take your trading to the next level


 Hot Features


