Ethereum Breaks the Support at $3356.0
By
Azeez Mustapha
PUBLISHED:
Jun 24 2024 @ 07:27
|
Comments (0)
|
More info about Azeez Mustapha
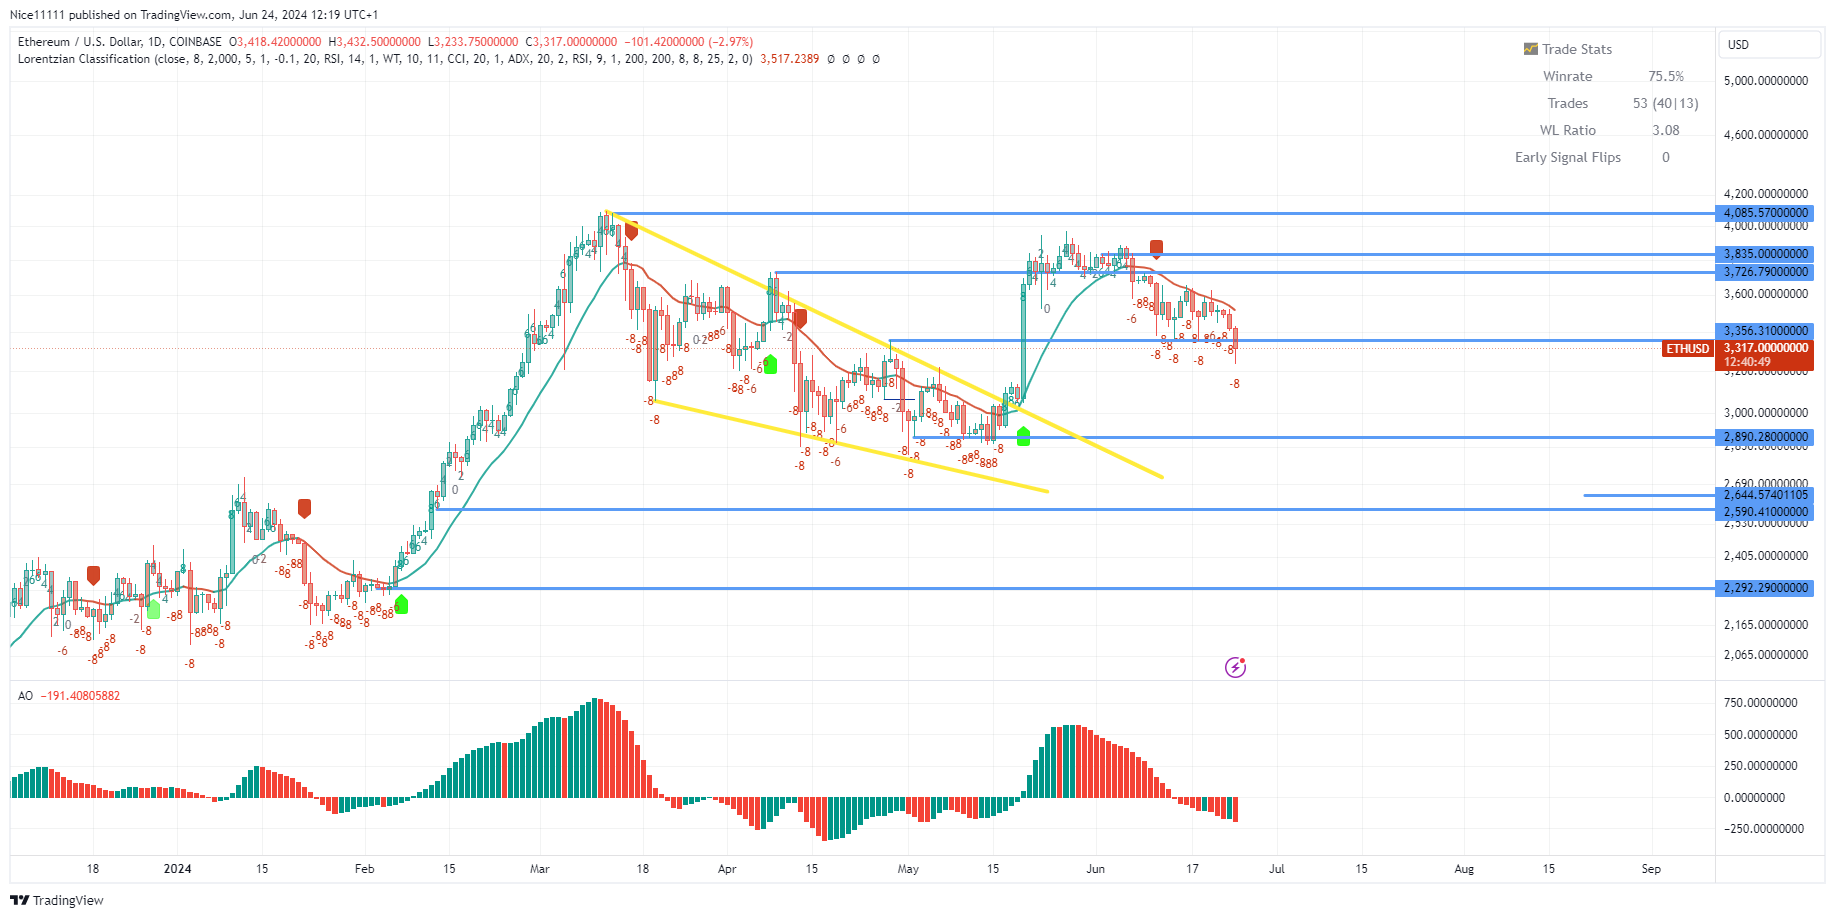
Ethereum experienced an impulsive bullish expansion in May, marked by a breakout from a bullish flag chart pattern visible on the 24-hour chart. This surge pushed the price to 3726.0 before market exhaustion set in, leading to a consolidation phase. The consolidation at this resistance level was characterized by a triple-top bearish reversal pattern. Eventually, the price dipped to 3356.0. The swing high from the correction phase in April has provided support, preventing further declines. The previous resistance zone now serves as support. The price tested the support level of 3356.0 twice before Ethereum broke the support at $3356.0
©
Ethereum Key Levels:
- Demand Levels: 3356.0, 2890.3, 2292.0
- Supply Levels: 3727.0, 4086.0, 4500.0
 What Are the Indicators Saying?
The Awesome Oscillator revealed a lack of bullish momentum and market weakness following the bullish expansion to 3726.0. The indicator’s green bars gradually turned red, becoming shorter as the price fell below $3726.80. Upon breaking the key level of 3726.90 to the downside in June, the Lorentizan Classification Machine Learning indicator signalled a sell. Currently, both the indicators and price action show market weakness. It is important to remain patient and wait for positive changes before riding the next impulsive wave, as trading during a correction phase increases risks. The break of the support at $3356.0 shows the continuation of the downtrend.
CLICK HERE TO REGISTER FOR FREE ON ADVFN, the world's leading stocks and shares information website, provides the private investor with all the latest high-tech trading tools and includes live price data streaming, stock quotes and the option to access 'Level 2' data on all of the world's key exchanges (LSE, NYSE, NASDAQ, Euronext etc).
This area of the ADVFN.com site is for independent financial commentary. These blogs are provided by independent authors via a common carrier platform and do not represent the opinions of ADVFN Plc. ADVFN Plc does not monitor, approve, endorse or exert editorial control over these articles and does not therefore accept responsibility for or make any warranties in connection with or recommend that you or any third party rely on such information. The information available at ADVFN.com is for your general information and use and is not intended to address your particular requirements. In particular, the information does not constitute any form of advice or recommendation by ADVFN.COM and is not intended to be relied upon by users in making (or refraining from making) any investment decisions. Authors may or may not have positions in stocks that they are discussing but it should be considered very likely that their opinions are aligned with their trading and that they hold positions in companies, forex, commodities and other instruments they discuss.


 Hot Features