I bought BHP (LSE:BLT) shares at £10.43 in September 2015 for my Modified price earnings ratio portfolio, at only 7.5 times average earnings per share for the previous ten years.

It had fallen from £26 over five years due to worries over the world market price for iron ore and other commodities sold by BHP. You can see in the table that prices were down in the dumps across the board in 2015.
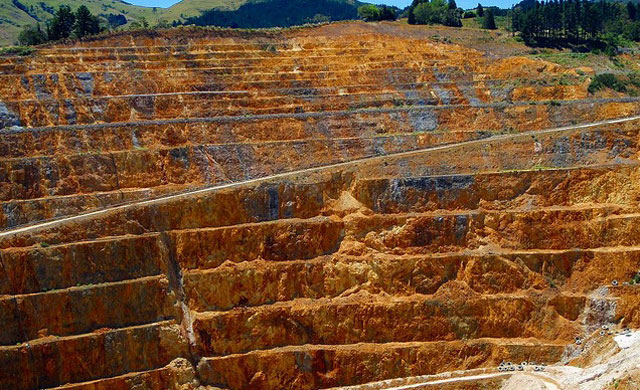
Even at these levels BHP remained profitable because when it came to digging out iron ore, its principal source of income, BHP had very low cost per tonne compared with rivals, way below the price it could sell it to customers.
While I was taking a chance on mean-reversion in commodity prices I also made sure that there was a good backstop position if commodity prices declined further – they were very unlikely to decline below BHP’s cost per tonne of output, even if they did decline below the cost of competitors’ production and transportation.
Approximate price levels for the commodities BHP sells
|
2010/11 |
2012/13 | 2014/15 | 2015/16 | H1 FY2017 |
July 2017 |
|
| Iron ore (tonne) |
$170 |
$130 | $55 | $51.37 | $55 |
$62 |
| Copper (lb) |
$4.50 |
$3.30 | $2.40 | $2.22 | $2.41 |
$2.70 |
| Oil (barrel) |
$110 |
$110 | $50 | $39 | $45 |
$50 |
| Metallurgical coal (tonne) |
$300 |
$170 | $100 |
$81.6 |
$150 |
$150 |
| Energy coal (tonne) |
$80 |
$60 | $64 | $53.42 | $74 |
$75 |
| Gas (mmBTU) |
$4.5 |
$3.8 | $3.32 | $2.23 | $3.21 |
$2.98 |
| Nickel (tonne) |
$10,581 |
$10,180 |
Now that commodity prices have risen a little and BHP shares are at £13.67 (a rise of one-third including dividends) the question is what should I do now? Should I buy some more?
(Previous Newsletters on BHP: 29th Sept to 5th October 2015)
Cyclically adjusted price earnings ratio
Let’s start with a fundamental measure of value, the cyclically adjusted price earnings ratio, CAPE – current share price divided by the average earnings per share over ten years.
| Year ending June |
Earnings per share (US cents) reported |
Earnings per share (US cents) adjusted |
| 2008 |
275.3 |
248 |
| 2009 |
105.6 |
95 |
| 2010 |
228.6 |
206 |
| 2011 |
429.1 |
386 |
| 2012 |
289.6 |
261 |
| 2013 |
210.9 |
239 |
| 2014 |
260.0 |
256 |
| 2015 |
35.9 |
36 |
| 2016 |
-120.0 |
-120.0 |
| 2017 first half x 2 |
120.4 |
120.4 |
| Average over 10 years | 183.5c or £1.40 | 172.7c or £1.32 |
CAPE is £13.67/£1.32 = 10.4, or £13.67/£1.40 = 9.8. These numbers are significantly below the average for UK shares (about 15), and so BHP still passes the first test for purchase.
Dividends
The income flow from BHP has been a very important element in the returns investors have received. There was quite a shock last year when the directors went against their long-standing policy of never cutting the dividend – they lowered it from 124c to only 30c.
However, hard work on re………………………To read the rest of this article, and more like it, subscribe to my premium newsletter Deep Value Shares – click here http://newsletters.advfn.com/deepvalueshares/subscribe-1


 Hot Features


