ADVFN Logo ADVFN

We could not find any results for:
Make sure your spelling is correct or try broadening your search.

Trending Now

Toplists

It looks like you aren't logged in.
Click the button below to log in and view your recent history.

Hot Features

Registration Strip Icon for default Register for Free to get streaming real-time quotes, interactive charts, live options flow, and more.

AUD/JPY Turns Lower At The Top Of Its Range

Share On Facebook
share on Linkedin
Print

Since the end of January, AUD/JPY has traded in a sideways range between 77.44 – 79.84. It’s unclear at this stage which side it will eventually break out of but, we see potential for AUD/JPY to trade lower from the highs of its range. Indeed, it appears to have favoured traders who sold near the highs or bought near the lows of the range, and with prices now trading lower, it appears this pattern intends to hold.
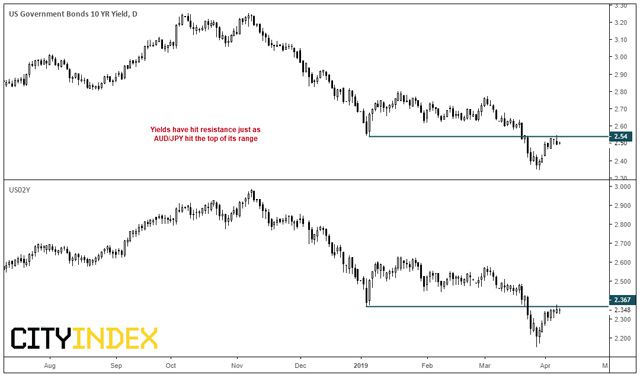
Interestingly, AUD/JPY has hit resistance at the top of its range just as the US10Y and US2Y have hit resistance levels. Given they both remain within a downtrend and, like AUD/JPY, are considered a barometer of risk, then we see potential for sentiment to turn lower. That said, if we see US yields break higher then it leaves the potential for AUD/JPY to also break higher in tandem and out of rage. Therefore, it could pay to watch yields in tandem with AUD/JPY at this potentially pivotal moment for risk.

AUD/JPY is currently trading lower for the session after printing a bearish pinbar on Friday. Furthermore, the stochastic oscillator is overbought territory and on the verge of providing a bearish sell-signal. With the market ranging, conditions are ideal for oscillators which tend to provide more false signals during a strong trend. If the range holds and sentiment turns lower, we could well see AUD/JPY head back towards the February lows. Bears could look to fade into any retracement below 79.26 (Friday’s low) for a more attractive entry level. However, given the range is around 240 pips, it could also serve well to trade from the daily chart.


City Index: Spread Betting, CFD and Forex Trading on 12,000+ global markets including Indices, Shares, Forex and Bitcoin. Click here to find out more.


CLICK HERE TO REGISTER FOR FREE ON ADVFN, the world's leading stocks and shares information website, provides the private investor with all the latest high-tech trading tools and includes live price data streaming, stock quotes and the option to access 'Level 2' data on all of the world's key exchanges (LSE, NYSE, NASDAQ, Euronext etc).

This area of the ADVFN.com site is for independent financial commentary. These blogs are provided by independent authors via a common carrier platform and do not represent the opinions of ADVFN Plc. ADVFN Plc does not monitor, approve, endorse or exert editorial control over these articles and does not therefore accept responsibility for or make any warranties in connection with or recommend that you or any third party rely on such information. The information available at ADVFN.com is for your general information and use and is not intended to address your particular requirements. In particular, the information does not constitute any form of advice or recommendation by ADVFN.COM and is not intended to be relied upon by users in making (or refraining from making) any investment decisions. Authors may or may not have positions in stocks that they are discussing but it should be considered very likely that their opinions are aligned with their trading and that they hold positions in companies, forex, commodities and other instruments they discuss.

Leave A Reply

 
Do you want to write for our Newspaper? Get in touch: newspaper@advfn.com