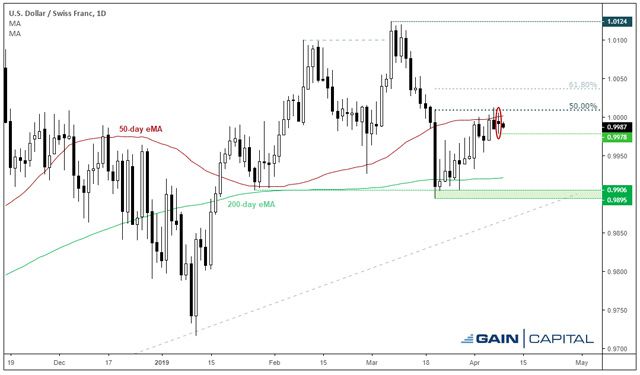
Near the end of March, we outlined USD/CHF’s potential to rebound before its next leg lower. With the rebound having since occurred, we’re now watching closely for signs of bearish momentum to return.
Part of the rationale for an ‘eventual’ break lower was based on the tendency for April to be the worst month of the year for DXY (USD index). If DXY is approaching a typically tough month, then it points towards broad-based weakness for the greenback and alleviates pressure from other markets.
Just over a week into April, it’s interesting to note that DXY has printed a series of bearish candles near recent highs on the daily chart, whilst EUR/USD is beginning to recover from its lows.

Back to USD/CHF, we suspect that recent price action appears corrective which suggests bearish momentum could be set to return. The rise from the 0.9895 low appears on the erratic side, with overlapping candles and abundance of longer wicks. This contrasts with the predominantly bearish candles we saw (with little overlap) as it tumbled from its 1.0124 highs. Moreover, as it’s taken 13 trading days to recover 50% of losses it endured over just 10, it suggests bulls haven’t fully regained control.
A spinning top Doji shows a hesitancy to break higher and the ‘rebound’ has paused near its 50-day average and 50-day eMA. However, as corrections can be a messy affair which leaves potential for another attempt to break higher, we’d prefer to see evidence of bearish momentum returning before assuming a top is in.

Switching to the four-hour chart, a break below 0.9972 would also invalidate the correction line and opens-up a run towards the support zone (where the 200-day average also resides). Whereas a break above this week’s high assumes a deeper correction and could better serve bulls on the well. Either way, we’re watching how price develops as it makes its way towards the triangle’s apex.
City Index: Spread Betting, CFD and Forex Trading on 12,000+ global markets including Indices, Shares, Forex and Bitcoin. Click here to find out more.


 Hot Features


