Whilst Australian employment held up, it doesn’t let inflation off the hook as a weak print tomorrow could see rate cut calls resurface.
We’ve seen a few mixed messages from RBA of late. On the 10th of April, Guy Debelle sent AUD briefly higher when he reiterated higher growth expectations and that the RBA does not expect to cut interest rates. Yet when the RBA minutes revealed they’d set out the scene to cut rates (low inflation and higher unemployment) traders appeared less confident of Debelle’s remarks and likely their forecasts too. Still, whilst last week’s employment data dispelled immediate concerns of a cut it doesn’t let CPI off the hook, as a weak inflation print tomorrow could see rate-cut calls resurface. That said, the winning doomsday scenario for Aussie bears is to see CPI falter and unemployment unexpectedly rise. And without that, larger, directional moves may be harder to come by over the foreseeable future alongside a neutral Fed.

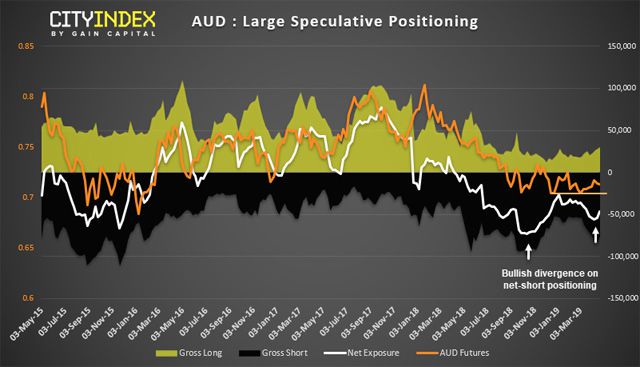
In terms of positioning from the weekly COT report, large speculators have been net short AUD/USD for 12-months. Yet bearish momentum has lost its potency and, barring the flash-crash early January, the declined has failed to test 70c. Furthermore, bullish interest is slowly picking up and gross longs now sitting at a 7-month high whilst a bullish divergence has formed between the net-short index and price action. So, perhaps it’s not time to completely write AUD off just yet, although being weekly data there’s plenty of time to monitor AUD’s potential for a bullish reversal.

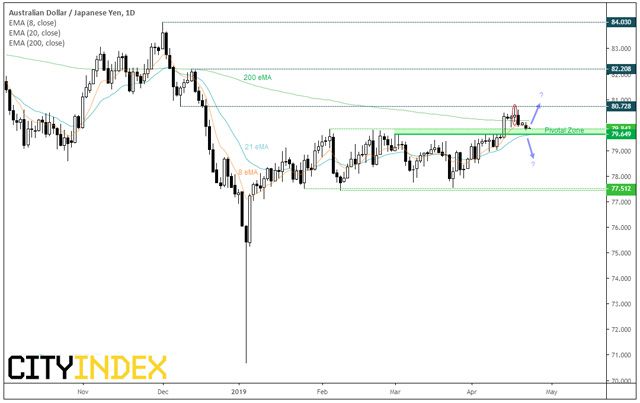
Switching back to the daily timeframe, we note that AUD/JPY is sitting on a pivotal level ahead of tomorrow’s CPI data. We had higher hopes for its initial breakout, yet momentum turned when it tested 80.73 resistance and now sits on the Feb highs. Given the Rikshaw man doji at the highs and turn of momentum back below the 200 eMA, we should be on guard for prices to break lower back within range and deem the original breakout a fakeout.
Alternatively, bullish setups could appear more favourable with a break above 80.73. It would be preferable to see prices build a base around current levels and respect for the original breakout level but, with the 8-day eMA turning lower, it appears touch and go as to whether it can build that base before breaking higher. Let price action be your guide.
City Index: Spread Betting, CFD and Forex Trading on 12,000+ global markets including Indices, Shares, Forex and Bitcoin. Click here to find out more.


 Hot Features


