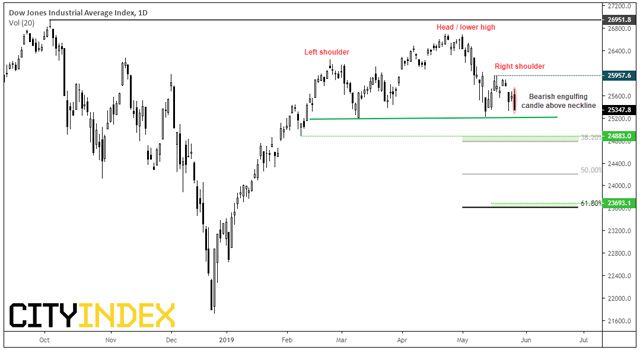
If you’re a bull – don’ t move. Bears, lean right on in as a break of this neckline could confirm a larger, bearish reversal on the Dow Jones Industrial index (DJIA).

Last week we questioned the ‘rebound’ on the DJI. Citing unfavourable seasonality, false breaks on the S&P500 and Nasdaq along with a potential ‘right shoulder’ on DJI, it suggested a potential head and shoulders reversal could be forming. Fast forward to yesterday’s close and the right shoulder is shaping up nicely with a bearish engulfing candle stalling just above the neckline.
- If we are to see a break lower, we could use the support zone between the 38.2% Fibonacci level and 24,883 low as an initial (or intraday) target.
- Alternatively, we could see if the neckline breaks and then is respected before considering a swing trade short.
- If successful, the reversal pattern projects a target just above the 61.8% Fibonacci level.

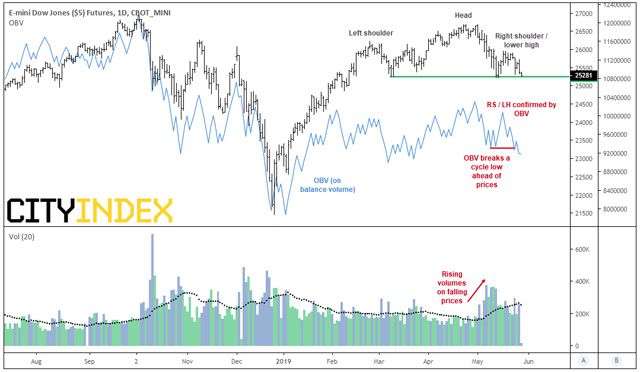
Moreover, volumes on the futures market also suggest bearish pressure is rising.
- Volumes were rising as prices fell, following its peak (head)
- OBV (on balance volume) confirmed the right shoulder / lower high and tracked the right shoulder to confirm the balance of bullish and bearish volume throughout
- OBV has broken its cycle low ahead of prices breaking its own neckline, which can sometimes occur ahead of a breakout.
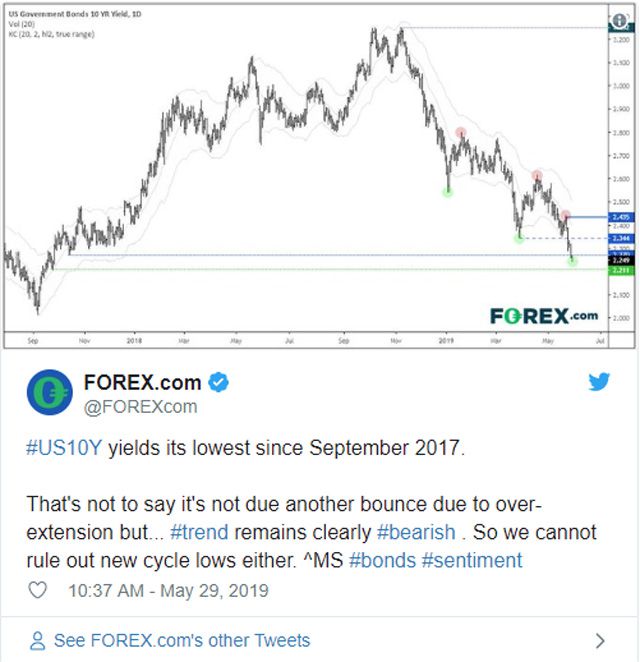
It’s interesting to note that DJI has stalled above its neckline as the US10Y yield hit a new cycle low (currently its lowest since September 2017). Currently trading beneath its lower Keltner channel, the argument for over-extension is on the rise – and we can see how it can bounce back if too far beneath it. If yields to rise from current levels, this could provide opportunity for DJI to remain above tis neckline but, given the bearish trend on yields, we suspect it could just be delaying the inevitable and for DJI’s neckline to eventually break. Either way, let price action be your guide.

City Index: Spread Betting, CFD and Forex Trading on 12,000+ global markets including Indices, Shares, Forex and Bitcoin. Click here to find out more.


 Hot Features


