Form 6-K - Report of foreign issuer [Rules 13a-16 and 15d-16]
September 11 2023 - 5:29PM
Edgar (US Regulatory)
UNITED STATES
SECURITIES AND EXCHANGE COMMISSION
Washington, D.C. 20549
Form 6-K
Report of Foreign Private Issuer
Pursuant to Rules 13a-16 or 15d-16 under
the Securities Exchange Act of 1934
For the month of September 2023
Commission File Number: 001-38836
BIOCERES CROP
SOLUTIONS CORP.
(Translation of registrant’s name into English)
Ocampo 210 bis, Predio CCT, Rosario
Province of Santa Fe, Argentina
(Address of principal executive offices)
Indicate by check mark whether the registrant files or will file annual
reports under cover Form 20-F or Form 40-F.
Form 20-F x
Form 40-F ¨
Indicate by check mark if the registrant is submitting the Form 6-K
in paper as permitted by Regulation S-T Rule 101(b)(1): ¨
Indicate by check mark if the registrant is submitting the Form 6-K
in paper as permitted by Regulation S-T Rule 101(b)(7): ¨
Exhibit List
SIGNATURES
Pursuant to the requirements of the Securities Exchange Act of 1934,
the registrant has duly caused this report to be signed on its behalf by the undersigned, thereunto duly authorized.
| |
BIOCERES CROP SOLUTIONS CORP. |
| |
(Registrant) |
| |
|
|
| Dated: September 11, 2023 |
By: |
/s/ Federico Trucco |
| |
Name: |
Federico Trucco |
| |
Title: |
Chief Executive Officer |
Exhibit 99.1
| FISCAL
FOURTH QUARTER
& FULL YEAR
2023
Financial and Operating Results |
| BIOCERES CROP SOLUTIONS FOURTH QUARTER 2023
1
Bioceres Crop Solutions Reports
Fiscal Fourth Quarter and Full Year 2023
Financial and Operational Results
FY23 revenues up 25% and Adjusted EBITDA at $81.1 million
ROSARIO, Argentina – September 11, 2023 – Bioceres Crop Solutions Corp. (Bioceres) (NASDAQ:
BIOX), a leader in the development and commercialization of productivity solutions designed to
regenerate agricultural ecosystems while making crops more resilient to climate change, announced
financial results for the fiscal fourth quarter and fiscal year ended June 30, 2023. Financial results
are expressed in U.S. dollars and are presented in accordance with International Financial Reporting
Standards. All comparisons in this announcement are year-over-year (YoY), unless otherwise noted.
FINANCIAL & BUSINESS HIGHLIGHTS
• Fiscal year results reflect continued growth in both revenues and Adjusted EBITDA, amidst a
challenging external context. FY23 revenues were $419.8 million, a 25% year-over-year increase,
and a 12% increase compared to the pro forma figures, which include historical revenues from
Pro Farm. LTM Adjusted EBITDA reached $81.1 million, a 31% year-over-year increase compared
to $61.9 million in Baseline Business EBITDA during FY22, and 80% growth compared to the
reported pro forma metric, which includes negative profitability from Pro Farm and inventory
ramp-up costs during FY22.
• Revenues in 4Q23 were $104.7 million, almost flat when compared to the year-ago reported
number, and a 9% decrease compared with 4Q22 pro forma revenues. Quarterly sales were
affected by a delayed transition into wetter El Niño weather in Argentina and industry-wide
headwinds in the U.S. and Brazilian markets. Adjusted EBITDA was $10.4 million for the quarter.
• Pro Farm business achieved positive EBITDA contribution for the quarter and the full fiscal year,
achieving the stated goal for the twelve months post-merger.
• HB4 Wheat revenues were $15.8 million, a 28% increase compared to the prior year number.
Number of on-boarded multipliers/distributors up 8X, positioning commercial network to meet
stated FY24 guidance.
• Agreement with Moolec Science to supply up to 20,000 tons of HB4 soy grain enables increased-value recognition of sustainability-linked soy inventories. |
| BIOCERES CROP SOLUTIONS FOURTH QUARTER 2023
2
• EU partnership with Corteva expanded to MBI-306 bioinsecticidal platform in seed treatments.
Upon product registration in Europe, Corteva will be the exclusive distributor through Corteva’s
sales team and together with Pioneer® brand seed products.
MANAGEMENT REVIEW
Mr. Federico Trucco, Bioceres´ Chief Executive Officer, commented: “While fiscal year 2023 was
challenging due to external conditions, it was one during which we proved the resiliency of our
organization, adjusting business plans to ensure we continued to outperform. We grew profitability,
as evidenced by a 31% increase in Adjusted EBITDA year-over-year and more impressively on a pro-forma basis, with the legacy business of Marrone Bio Innovations positively impacting EBITDA during
the fourth fiscal quarter.”
“We also continued to advance HB4, receiving key regulatory approvals that allowed us to transition
into conventional seed channels. Indeed, eight times more multipliers are taking over the inventory
ramp-up and go-to-market responsibilities for HB4 wheat ─ a key step towards meeting our stated
fiscal year 2024 guidance.”
“Finally, our agreement with Corteva Seed Applied Technologies for MBI-306 in Europe will allow us
to at least double the size of our business in the European region and further validates our position
as a leading provider of biological seed care solutions to players such as Syngenta and Albaugh,
among others.”
Mr. Enrique Lopez Lecube, Bioceres´ Chief Financial Officer, noted: “We are proud to build upon our
2022 momentum during 2023, once again delivering growth across revenues and EBITDA, which
stand at $420 million and $81 million respectively. Despite factors outside of our control – including
a drought of historical magnitude in Argentina, floods in California and industry-wide headwinds –
which dampened second and fourth quarter results, our strong performance for the year is
testament to our successful revenue diversification strategy.”
“We delivered on our initial Pro Farm acquisition goals, with the assets contributing to EBITDA by the
fourth quarter and on an LTM basis – setting the stage for future topline growth with new product
introductions and geographic expansion of existing lines in collaboration with our partners.”
“Fiscal 2023 performance underscores our ability to maintain disciplined operational execution in
the face of challenging industry conditions as well as the robustness of our long-term strategy,
supported by a unique portfolio of technologies and a diversified commercial approach. We look
forward to leveraging these factors to continue to generate long-term value for our shareholders.” |
| BIOCERES CROP SOLUTIONS FOURTH QUARTER 2023
3
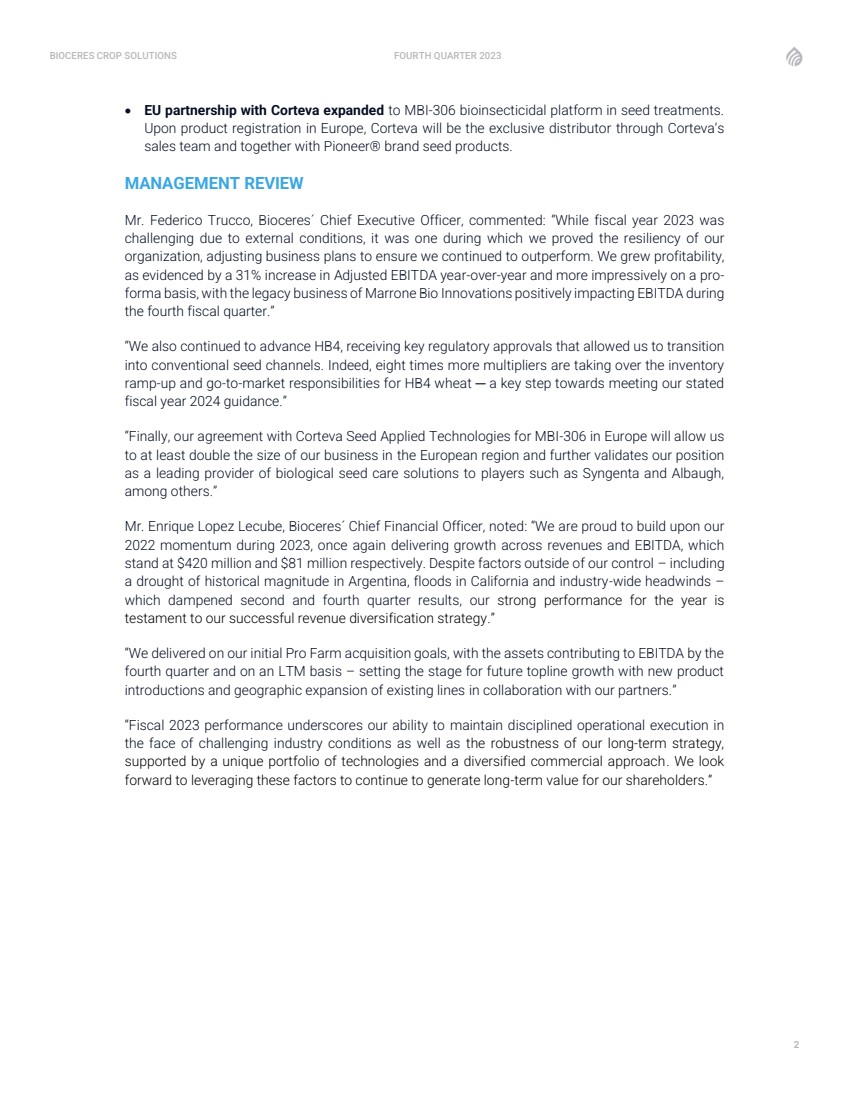
KEY FINANCIAL METRICS
(In millions of U.S. dollars, unless where otherwise stated)
Table 1: 4Q23 & FY23 Key Financial Metrics
4Q22
Pro forma1
4Q23 % Change FY22
Pro forma1
FY23 % Change
Revenue by Segment
Crop Protection 57.1 45.1 (21%) 207.1 205.8 (1%)
Seed and Integrated Products 21.7 20.8 (4%) 51.3 56.7 10%
Crop Nutrition 36.1 38.8 7% 116.7 157.3 35%
Total Revenue 115.0 104.7 (9%) 375.1 419.8 12%
Gross Profit 41.0 40.5 (1%) 149.4 184.6 24%
Gross Margin 36% 39% 298 bps 40% 44% 415 bps
4Q22
Pro forma1
4Q23 % Change FY22
Pro forma1
FY23 % Change
Adjusted EBITDA 11.8 10.4 (12%) 45.1 81.1 80%
1. Financials presented for 4Q22 and FY22 correspond to pro forma reported financials, including Pro Farm
FY23 Summary: Both revenues and Adjusted EBITDA grew in FY23, despite challenging external
conditions in the U.S., Brazil and Argentina, all key end markets. Reported sales increased by 25%
year-over-year, and by 12% on a pro forma basis, to $419.8 million, benefiting from efforts in product
and geographic diversification, with categories such as inoculants, biostimulants and micro-beaded
fertilizers leading the growth. Gross profit grew by 24% with an overall gross margin of 44% as sales
growth was led by high margin product categories. Adjusted EBITDA was $81.1 million, an 80%
increase compared with the pro forma Adjusted EBITDA metric from FY22. Removing the negative
impact from Pro Farm and inventory ramp-up costs on FY22 Adjusted EBITDA, the basis for
comparison increases to $61.9M and implies a 31% year-over-year growth in Adjusted EBITDA.
4Q23 Summary: 4Q23 revenues declined by 9% given strong year-ago comparables and a slower
than expected transition from dry La Niña weather to El Niño in Argentina, which negatively impacted
sales of lower-margin crop protection products. The Seed and Integrated Products category also
saw a slight decline as a result of some seed treatment products sales that now fall under the
Syngenta agreement and are reported under the Crop Nutrition segment. By contrast, Crop Nutrition
sales increased, as micro-beaded fertilizers resumed growth in Argentina and sales of Pro Farm
biostimulants doubled. Gross profit fell by less than sales due to favorable product mix in both Crop
Protection and Crop Nutrition. Adjusted EBIDTA in 4Q23 was $10.4 million. |
| BIOCERES CROP SOLUTIONS FOURTH QUARTER 2023
4
FOURTH QUARTER & FULL FISCAL YEAR FINANCIAL RESULTS
Change in functional currency. As of 1Q23, the functional currency for the main Argentine operating
subsidiaries was changed to the U.S. dollar. As a result of this change, IAS 29 adjustments are no
longer applicable to those subsidiaries, and we no longer present the “comparable” metrics that were
previously used to remove the distortionary effects of IAS 29. All commentary refers to reported
figures.
Pro forma financial information. As of 1Q23, Pro Farm results are included in our reporting. Pro
Farm products have been integrated into Bioceres’ previously existing segments. Legacy
bioprotection products are included in the Crop Protection segment, and legacy biostimulant
products are included in the Crop Nutrition segment. To ease comparison, all revenue, gross profit
and Adjusted EBITDA numbers are presented against pro forma 4Q22 metrics that include Pro Farm
numbers estimated under IFRS, unless otherwise stated.
Revenues
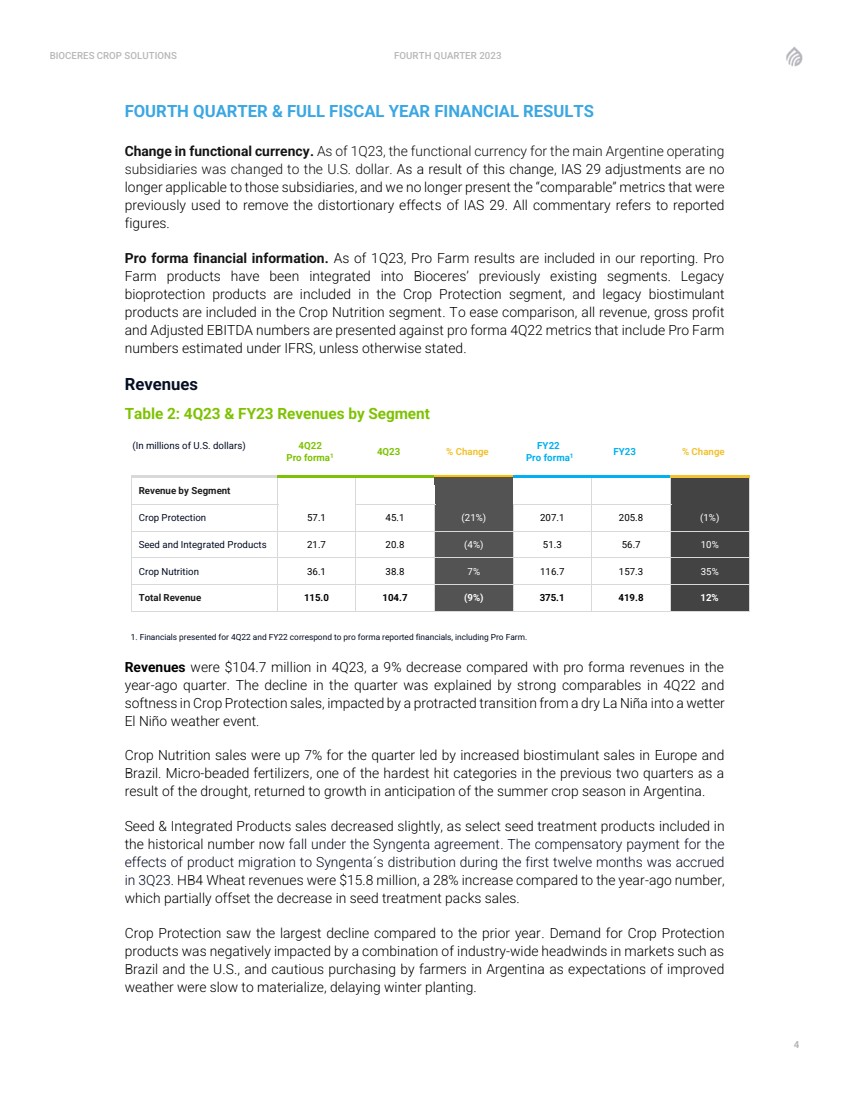
Table 2: 4Q23 & FY23 Revenues by Segment
(In millions of U.S. dollars) 4Q22
Pro forma1
4Q23 % Change FY22
Pro forma1
FY23 % Change
Revenue by Segment
Crop Protection 57.1 45.1 (21%) 207.1 205.8 (1%)
Seed and Integrated Products 21.7 20.8 (4%) 51.3 56.7 10%
Crop Nutrition 36.1 38.8 7% 116.7 157.3 35%
Total Revenue 115.0 104.7 (9%) 375.1 419.8 12%
1. Financials presented for 4Q22 and FY22 correspond to pro forma reported financials, including Pro Farm.
Revenues were $104.7 million in 4Q23, a 9% decrease compared with pro forma revenues in the
year-ago quarter. The decline in the quarter was explained by strong comparables in 4Q22 and
softness in Crop Protection sales, impacted by a protracted transition from a dry La Niña into a wetter
El Niño weather event.
Crop Nutrition sales were up 7% for the quarter led by increased biostimulant sales in Europe and
Brazil. Micro-beaded fertilizers, one of the hardest hit categories in the previous two quarters as a
result of the drought, returned to growth in anticipation of the summer crop season in Argentina.
Seed & Integrated Products sales decreased slightly, as select seed treatment products included in
the historical number now fall under the Syngenta agreement. The compensatory payment for the
effects of product migration to Syngenta´s distribution during the first twelve months was accrued
in 3Q23. HB4 Wheat revenues were $15.8 million, a 28% increase compared to the year-ago number,
which partially offset the decrease in seed treatment packs sales.
Crop Protection saw the largest decline compared to the prior year. Demand for Crop Protection
products was negatively impacted by a combination of industry-wide headwinds in markets such as
Brazil and the U.S., and cautious purchasing by farmers in Argentina as expectations of improved
weather were slow to materialize, delaying winter planting. |
| BIOCERES CROP SOLUTIONS FOURTH QUARTER 2023
5
For the full fiscal year FY23, revenues were $419.8 million, a 25% growth compared with revenues
reported in FY22, and a 12% increase compared to pro forma revenues that include FY22 revenues
from Pro Farm. Top line expansion was achieved despite a strong historical comparison in FY22,
and a number of external factors that challenged growth such as weather conditions in two of
Bioceres’ key markets – a drought of historical magnitude in Argentina and equally extreme floods
in California – and negative industry dynamics in the U.S. and Brazil.
Crop Nutrition saw the largest year-on-year increase, driven by growth in biostimulants, inoculants
and micro-beaded fertilizers. Seed and Integrated Products saw expansion in HB4 sales as well as
seed treatment packs. The Crop Protection segment remained almost flat, having faced the greatest
headwinds in terms of weather and high channel inventories in several geographies.
Gross Profit & Margin
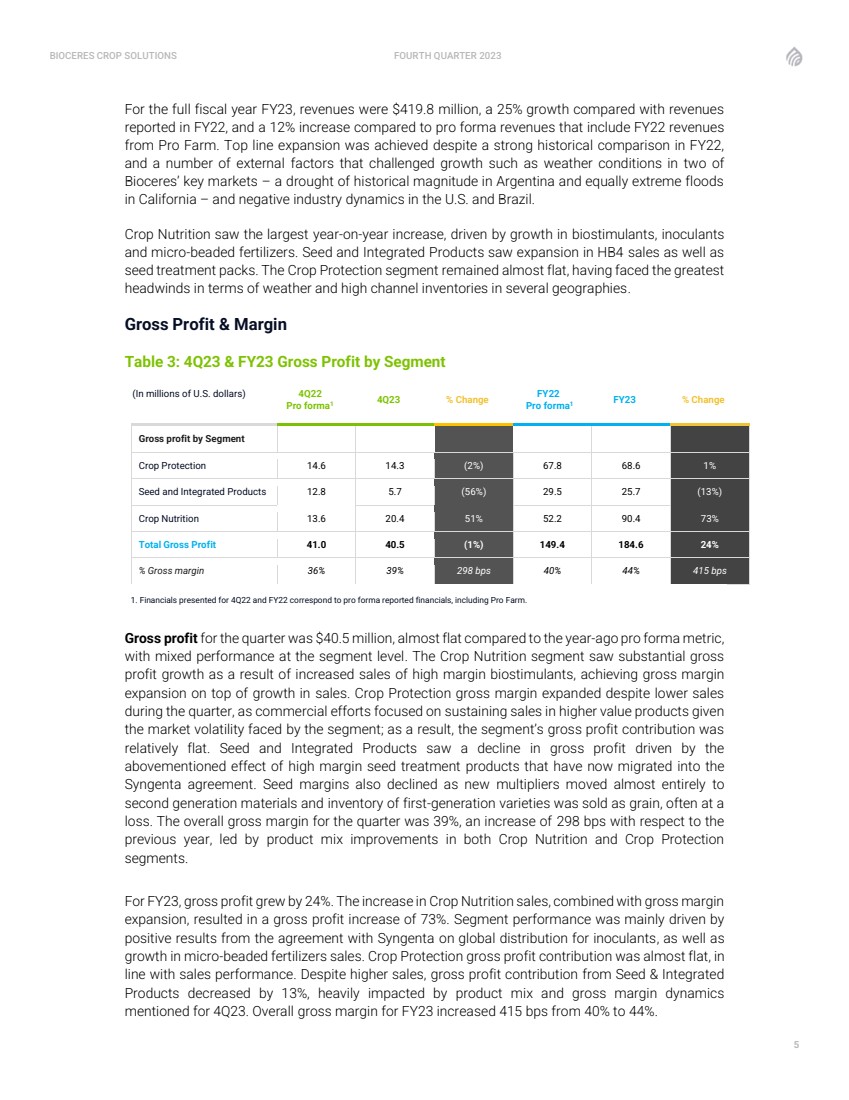
Table 3: 4Q23 & FY23 Gross Profit by Segment
(In millions of U.S. dollars) 4Q22
Pro forma1
4Q23 % Change FY22
Pro forma1
FY23 % Change
Gross profit by Segment
Crop Protection 14.6 14.3 (2%) 67.8 68.6 1%
Seed and Integrated Products 12.8 5.7 (56%) 29.5 25.7 (13%)
Crop Nutrition 13.6 20.4 51% 52.2 90.4 73%
Total Gross Profit 41.0 40.5 (1%) 149.4 184.6 24%
% Gross margin 36% 39% 298 bps 40% 44% 415 bps
1. Financials presented for 4Q22 and FY22 correspond to pro forma reported financials, including Pro Farm.
Gross profit for the quarter was $40.5 million, almost flat compared to the year-ago pro forma metric,
with mixed performance at the segment level. The Crop Nutrition segment saw substantial gross
profit growth as a result of increased sales of high margin biostimulants, achieving gross margin
expansion on top of growth in sales. Crop Protection gross margin expanded despite lower sales
during the quarter, as commercial efforts focused on sustaining sales in higher value products given
the market volatility faced by the segment; as a result, the segment’s gross profit contribution was
relatively flat. Seed and Integrated Products saw a decline in gross profit driven by the
abovementioned effect of high margin seed treatment products that have now migrated into the
Syngenta agreement. Seed margins also declined as new multipliers moved almost entirely to
second generation materials and inventory of first-generation varieties was sold as grain, often at a
loss. The overall gross margin for the quarter was 39%, an increase of 298 bps with respect to the
previous year, led by product mix improvements in both Crop Nutrition and Crop Protection
segments.
For FY23, gross profit grew by 24%. The increase in Crop Nutrition sales, combined with gross margin
expansion, resulted in a gross profit increase of 73%. Segment performance was mainly driven by
positive results from the agreement with Syngenta on global distribution for inoculants, as well as
growth in micro-beaded fertilizers sales. Crop Protection gross profit contribution was almost flat, in
line with sales performance. Despite higher sales, gross profit contribution from Seed & Integrated
Products decreased by 13%, heavily impacted by product mix and gross margin dynamics
mentioned for 4Q23. Overall gross margin for FY23 increased 415 bps from 40% to 44%. |
| BIOCERES CROP SOLUTIONS FOURTH QUARTER 2023
6
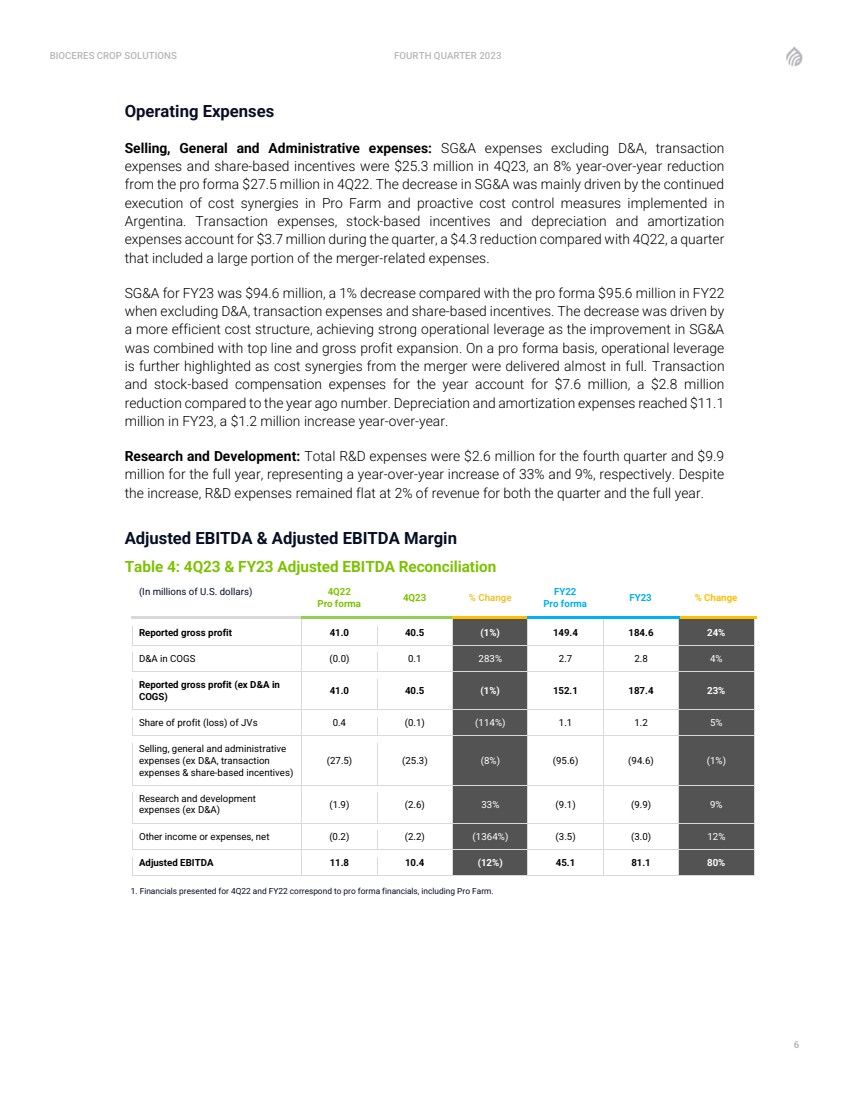
Operating Expenses
Selling, General and Administrative expenses: SG&A expenses excluding D&A, transaction
expenses and share-based incentives were $25.3 million in 4Q23, an 8% year-over-year reduction
from the pro forma $27.5 million in 4Q22. The decrease in SG&A was mainly driven by the continued
execution of cost synergies in Pro Farm and proactive cost control measures implemented in
Argentina. Transaction expenses, stock-based incentives and depreciation and amortization
expenses account for $3.7 million during the quarter, a $4.3 reduction compared with 4Q22, a quarter
that included a large portion of the merger-related expenses.
SG&A for FY23 was $94.6 million, a 1% decrease compared with the pro forma $95.6 million in FY22
when excluding D&A, transaction expenses and share-based incentives. The decrease was driven by
a more efficient cost structure, achieving strong operational leverage as the improvement in SG&A
was combined with top line and gross profit expansion. On a pro forma basis, operational leverage
is further highlighted as cost synergies from the merger were delivered almost in full. Transaction
and stock-based compensation expenses for the year account for $7.6 million, a $2.8 million
reduction compared to the year ago number. Depreciation and amortization expenses reached $11.1
million in FY23, a $1.2 million increase year-over-year.
Research and Development: Total R&D expenses were $2.6 million for the fourth quarter and $9.9
million for the full year, representing a year-over-year increase of 33% and 9%, respectively. Despite
the increase, R&D expenses remained flat at 2% of revenue for both the quarter and the full year.
Adjusted EBITDA & Adjusted EBITDA Margin
Table 4: 4Q23 & FY23 Adjusted EBITDA Reconciliation
(In millions of U.S. dollars) 4Q22
Pro forma 4Q23 % Change
FY22
Pro forma FY23 % Change
Reported gross profit 41.0 40.5 (1%) 149.4 184.6 24%
D&A in COGS (0.0) 0.1 283% 2.7 2.8 4%
Reported gross profit (ex D&A in
COGS) 41.0 40.5 (1%) 152.1 187.4 23%
Share of profit (loss) of JVs 0.4 (0.1) (114%) 1.1 1.2 5%
Selling, general and administrative
expenses (ex D&A, transaction
expenses & share-based incentives)
(27.5) (25.3) (8%) (95.6) (94.6) (1%)
Research and development
expenses (ex D&A) (1.9) (2.6) 33% (9.1) (9.9) 9%
Other income or expenses, net (0.2) (2.2) (1364%) (3.5) (3.0) 12%
Adjusted EBITDA 11.8 10.4 (12%) 45.1 81.1 80%
1. Financials presented for 4Q22 and FY22 correspond to pro forma financials, including Pro Farm. |
| BIOCERES CROP SOLUTIONS FOURTH QUARTER 2023
7
Adjusted EBITDA was $10.4 million in 4Q23, compared with $11.8 million in 4Q22 on a pro forma
basis. Despite a relatively flat gross profit performance and an improvement in SG&A expenses, other
expenses in the quarter and softer JV results drove a slight year-over-year EBITDA decline. Notably,
Pro Farm business achieved positive EBITDA for the quarter, meeting our stated goal for the twelve
months post-merger.
Adjusted EBITDA for FY23 was $81.1 million, a 31% increase compared with $61.9 million in FY22
Baseline Business EBITDA, which removes the negative impact of Pro Farm and HB4 inventory ramp-up costs from last year’s pro forma metric, improving the basis against which FY23 results are
compared. The robust improvement in Adjusted EBITDA against the FY22 baseline business was
primarily driven by gross profit expansion in Crop Nutrition. Pro Farm’s positive EBITDA evolution
builds on top of the baseline business performance, raising the improvement in Adjusted EBITDA to
80% when compared against the pro forma FY22 metric.
Financial Income and Loss
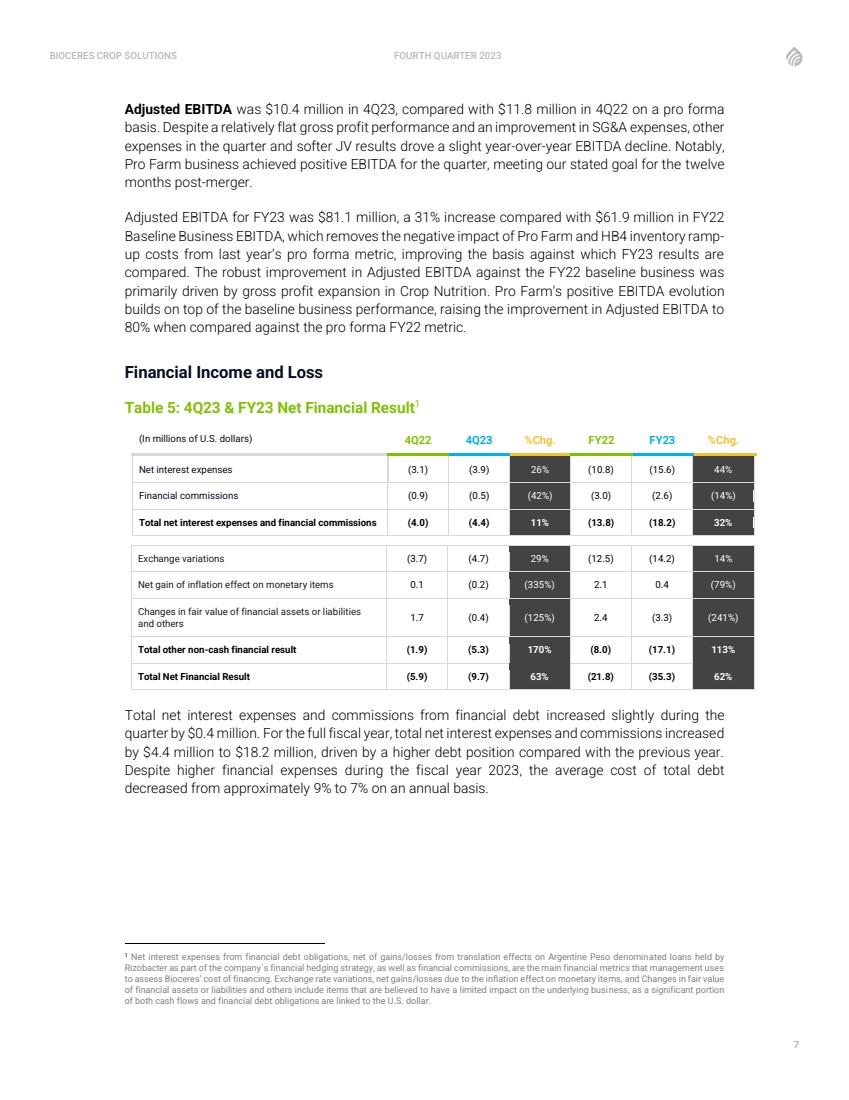
Table 5: 4Q23 & FY23 Net Financial Result1
(In millions of U.S. dollars) 4Q22 4Q23 %Chg. FY22 FY23 %Chg.
Net interest expenses (3.1) (3.9) 26% (10.8) (15.6) 44%
Financial commissions (0.9) (0.5) (42%) (3.0) (2.6) (14%)
Total net interest expenses and financial commissions (4.0) (4.4) 11% (13.8) (18.2) 32%
Exchange variations (3.7) (4.7) 29% (12.5) (14.2) 14%
Net gain of inflation effect on monetary items 0.1 (0.2) (335%) 2.1 0.4 (79%)
Changes in fair value of financial assets or liabilities
and others 1.7 (0.4) (125%) 2.4 (3.3) (241%)
Total other non-cash financial result (1.9) (5.3) 170% (8.0) (17.1) 113%
Total Net Financial Result (5.9) (9.7) 63% (21.8) (35.3) 62%
Total net interest expenses and commissions from financial debt increased slightly during the
quarter by $0.4 million. For the full fiscal year, total net interest expenses and commissions increased
by $4.4 million to $18.2 million, driven by a higher debt position compared with the previous year.
Despite higher financial expenses during the fiscal year 2023, the average cost of total debt
decreased from approximately 9% to 7% on an annual basis.
1 Net interest expenses from financial debt obligations, net of gains/losses from translation effects on Argentine Peso denominated loans held by
Rizobacter as part of the company´s financial hedging strategy, as well as financial commissions, are the main financial metrics that management uses
to assess Bioceres’ cost of financing. Exchange rate variations, net gains/losses due to the inflation effect on monetary items, and Changes in fair value
of financial assets or liabilities and others include items that are believed to have a limited impact on the underlying business, as a significant portion
of both cash flows and financial debt obligations are linked to the U.S. dollar. |
| BIOCERES CROP SOLUTIONS FOURTH QUARTER 2023
8
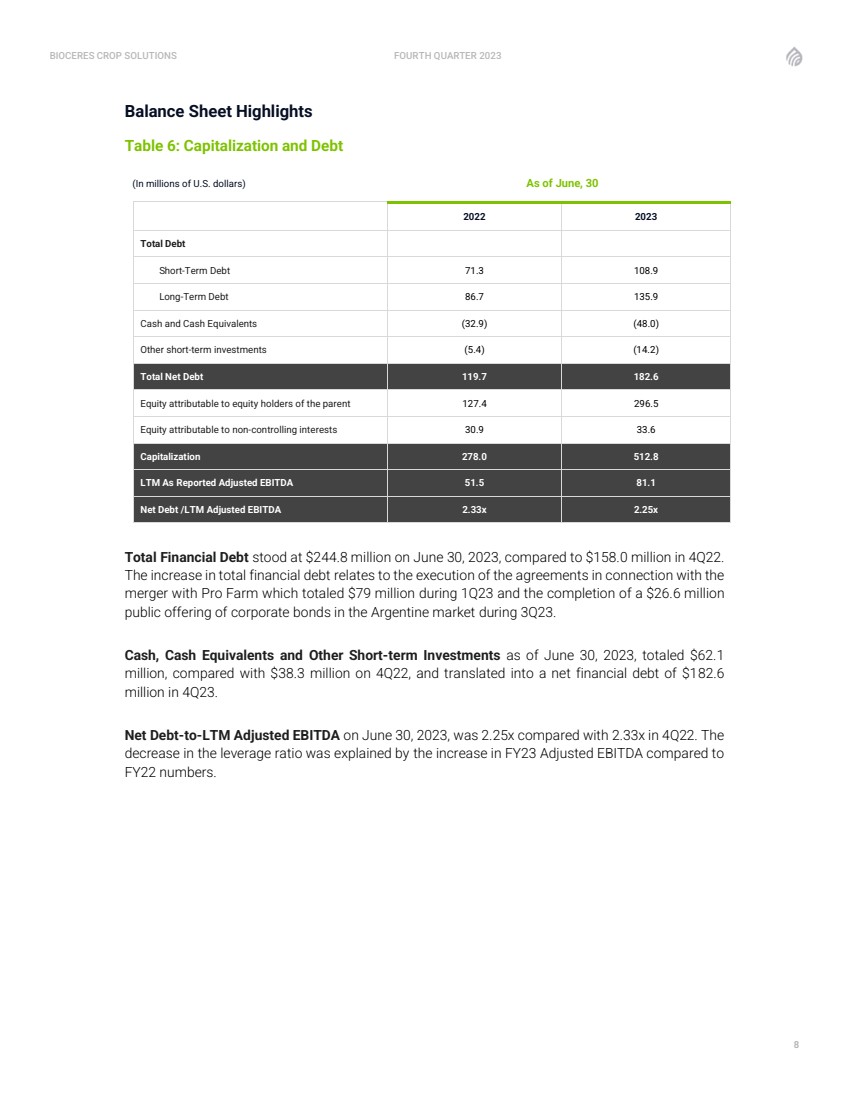
Balance Sheet Highlights
Table 6: Capitalization and Debt
(In millions of U.S. dollars) As of June, 30
2022 2023
Total Debt
Short-Term Debt 71.3 108.9
Long-Term Debt 86.7 135.9
Cash and Cash Equivalents (32.9) (48.0)
Other short-term investments (5.4) (14.2)
Total Net Debt 119.7 182.6
Equity attributable to equity holders of the parent 127.4 296.5
Equity attributable to non-controlling interests 30.9 33.6
Capitalization 278.0 512.8
LTM As Reported Adjusted EBITDA 51.5 81.1
Net Debt /LTM Adjusted EBITDA 2.33x 2.25x
Total Financial Debt stood at $244.8 million on June 30, 2023, compared to $158.0 million in 4Q22.
The increase in total financial debt relates to the execution of the agreements in connection with the
merger with Pro Farm which totaled $79 million during 1Q23 and the completion of a $26.6 million
public offering of corporate bonds in the Argentine market during 3Q23.
Cash, Cash Equivalents and Other Short-term Investments as of June 30, 2023, totaled $62.1
million, compared with $38.3 million on 4Q22, and translated into a net financial debt of $182.6
million in 4Q23.
Net Debt-to-LTM Adjusted EBITDA on June 30, 2023, was 2.25x compared with 2.33x in 4Q22. The
decrease in the leverage ratio was explained by the increase in FY23 Adjusted EBITDA compared to
FY22 numbers. |
| BIOCERES CROP SOLUTIONS FOURTH QUARTER 2023
9
FOURTH QUARTER & FULL FISCAL YEAR 2023 EARNINGS CONFERENCE CALL
Management will host a conference call and question-and-answer session, which will be
accompanied by a presentation available during the webcast or accessed via the investor relations
section of the company’s website.
To access the call, please use the following information:
Date: Monday September 11, 2023
Time: 4:30 p.m. EST, 1:30 p.m. PST
Registration link: Click here
US Toll Free dial-in number: 1-833-470-1428
International dial-in numbers: Click here
Conference ID: 337704
Webcast: Click here
Please dial in 5-10 minutes prior to the start time to register and join.
The conference call will be broadcast live and available for replay here and via the investor relations
section of the company’s website here.
A replay of the call will be available through September 18, 2023, following the conference.
Toll Free Replay Number: 1-866-813-9403
International Replay Number: +44 204 525 0658
Replay ID: 389518
About Bioceres Crop Solutions Corp.
Bioceres Crop Solutions Corp. (NASDAQ: BIOX) is a leader in the development and commercialization
of productivity solutions designed to regenerate agricultural ecosystems while making crops more
resilient to climate change. To do this, Bioceres’ solutions create economic incentives for farmers
and other stakeholders to adopt environmentally friendlier production practices. The company has
a unique biotech platform with high-impact, patented technologies for seeds and microbial ag-inputs,
as well as next generation Crop Nutrition and Protection solutions. Through its HB4® program, the
company is bringing digital solutions to support growers’ decisions and provide end-to-end
traceability for production outputs. For more information, visit here.
Contact
Bioceres Crop Solutions
Paula Savanti
Head of Investor Relations
investorrelations@biocerescrops.com |
| BIOCERES CROP SOLUTIONS FOURTH QUARTER 2023
10
Forward-Looking Statements
This communication includes “forward-looking statements” within the meaning of the “safe harbor”
provisions of the United States Private Securities Litigation Reform Act of 1995. Forward-looking
statements may be identified by the use of words such as “forecast,” “intend,” “seek,” “target,”
“anticipate,” “believe,” “expect,” “estimate,” “plan,” “outlook,” and “project” and other similar
expressions that predict or indicate future events or trends or that are not statements of historical
matters. Such forward-looking statements include estimated financial data and, among others,
statements related to the expected or potential impact of the novel coronavirus (COVID-19)
pandemic, and the related responses by governments, clients and the company, on our business,
financial condition, liquidity position and results of operations, and any such forward-looking
statements, whether concerning the COVID-19 pandemic or otherwise, involve risks, assumptions
and uncertainties. These forward-looking statements include, but are not limited to, whether (i) the
health and safety measures implemented to safeguard employees and assure business continuity
will be successful, (ii) the uncertainty related to COVID-19 in the farming community will be short
lived, and (iii) we will be able to coordinate efforts to ramp up inventories. Such forward-looking
statements are based on management’s reasonable current assumptions, expectations, plans and
forecasts regarding the company’s current or future results and future business and economic
conditions more generally. Such forward-looking statements involve risks, uncertainties and other
factors, which may cause the actual results, levels of activity, performance or achievement of the
company to be materially different from any future results expressed or implied by such forward-looking statements, and there can be no assurance that actual results will not differ materially from
management’s expectations or could affect the company’s ability to achieve its strategic goals,
including the uncertainties relating to the impact of COVID-19 on the company’s business,
operations, liquidity and financial results and the other factors that are described in the sections
entitled “Risk Factors” in the company's Securities and Exchange Commission filings updated from
time to time. The preceding list is not intended to be an exhaustive list of all of our forward-looking
statements. Therefore, you should not rely on any of these forward-looking statements as
predictions of future events. All forward-looking statements contained in this release are qualified in
their entirety by this cautionary statement. Forward-looking statements speak only as of the date
they are or were made, and the company does not intend to update or otherwise revise the forward-looking statements to reflect events or circumstances after the date of this release or to reflect the
occurrence of unanticipated events, except as required by law.
Use of non-IFRS financial information
The company supplements the use of IFRS financial measures with non-IFRS financial measures,
including Adjusted EBITDA, Adjusted EBITDA Margin, Net debt, Net interest expenses, Comparable
figures which exclude the impact of IAS29 as explained below and pro forma numbers which are
inclusive of historical Pro Farm financials.
The non-IFRS measures should not be considered in isolation or as a substitute for measures of
performance prepared in accordance with IFRS and may be different from non-IFRS measures used
by other companies. In addition, the non-IFRS measures are not based on any comprehensive set of
accounting rules or principles. Non-IFRS measures have limitations in that they do not reflect all of
the amounts associated with our results of operations as determined in accordance with IFRS. This
non-IFRS financial measures should only be used to evaluate the company’s results of operations in
conjunction with the most comparable IFRS financial measures. In addition, other companies may
report similarly titled measures, but calculate them differently, which reduces their usefulness as a
comparative measure. Management utilizes these non-IFRS metrics as performance measures in
evaluating and making operational decisions regarding our business. |
| BIOCERES CROP SOLUTIONS FOURTH QUARTER 2023
11
Adjusted EBITDA and Adjusted EBITDA margin
The company defines Adjusted EBITDA as profit/(loss) exclusive of financial income/(costs), income
tax benefit/(expense), depreciation, amortization, share-based compensation, inventory purchase
allocation and one-time transactional expenses.
Management believes that Adjusted EBITDA provides useful supplemental information to investors
about the company and its results. Adjusted EBITDA is among the measures used by the
management team to evaluate the company’s financial and operating performance and make day-to-day financial and operating decisions. In addition, adjusted EBITDA and similarly titled measures
are frequently used by competitors, rating agencies, securities analysts, investors and other parties
to evaluate companies in the same industry. Management also believes that adjusted EBITDA is
helpful to investors because it provides additional information about trends in the company’s core
operating performance prior to considering the impact of capital structure, depreciation,
amortization and taxation on results. Adjusted EBITDA should not be considered in isolation or as a
substitute for other measures of financial performance reported in accordance with IFRS. Adjusted
EBITDA has limitations as an analytical tool, including:
• Adjusted EBITDA does not reflect changes in, including cash requirements for working capital
needs or contractual commitments.
• Adjusted EBITDA does not reflect financial expenses, or the cash requirements to service interest
or principal payments on indebtedness, or interest income or other financial income.
• Adjusted EBITDA does not reflect income tax expense or the cash requirements to pay income
taxes.
• Although depreciation and amortization are non-cash charges, the assets being depreciated or
amortized often will need to be replaced in the future, and adjusted EBITDA does not reflect any cash
requirements for these replacements.
• Although share-based compensation is a non-cash charge, adjusted EBITDA does not consider the
potentially dilutive impact of share-based compensation; and
• Other companies may calculate adjusted EBITDA and similarly titled measures differently, limiting
its usefulness as a comparative measure.
The company compensates for the inherent limitations associated with using adjusted EBITDA
through disclosure of these limitations, presentation in the combined financial statements in
accordance with IFRS and reconciliation of adjusted EBITDA to the most directly comparable IFRS
measure, income/(loss) for the period or year. |
| BIOCERES CROP SOLUTIONS FOURTH QUARTER 2023
12
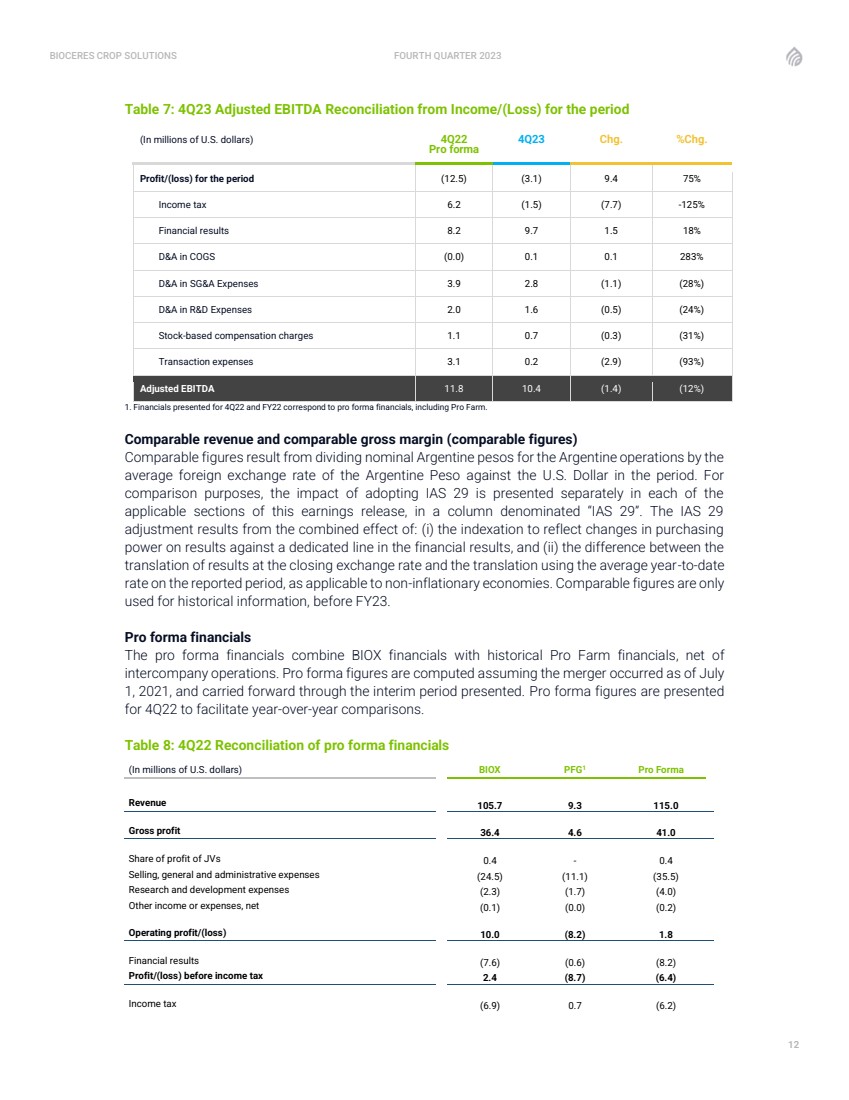
Table 7: 4Q23 Adjusted EBITDA Reconciliation from Income/(Loss) for the period
(In millions of U.S. dollars) 4Q22
Pro forma
4Q23 Chg. %Chg.
Profit/(loss) for the period (12.5) (3.1) 9.4 75%
Income tax 6.2 (1.5) (7.7) -125%
Financial results 8.2 9.7 1.5 18%
D&A in COGS (0.0) 0.1 0.1 283%
D&A in SG&A Expenses 3.9 2.8 (1.1) (28%)
D&A in R&D Expenses 2.0 1.6 (0.5) (24%)
Stock-based compensation charges 1.1 0.7 (0.3) (31%)
Transaction expenses 3.1 0.2 (2.9) (93%)
Adjusted EBITDA 11.8 10.4 (1.4) (12%)
1. Financials presented for 4Q22 and FY22 correspond to pro forma financials, including Pro Farm.
Comparable revenue and comparable gross margin (comparable figures)
Comparable figures result from dividing nominal Argentine pesos for the Argentine operations by the
average foreign exchange rate of the Argentine Peso against the U.S. Dollar in the period. For
comparison purposes, the impact of adopting IAS 29 is presented separately in each of the
applicable sections of this earnings release, in a column denominated “IAS 29”. The IAS 29
adjustment results from the combined effect of: (i) the indexation to reflect changes in purchasing
power on results against a dedicated line in the financial results, and (ii) the difference between the
translation of results at the closing exchange rate and the translation using the average year-to-date
rate on the reported period, as applicable to non-inflationary economies. Comparable figures are only
used for historical information, before FY23.
Pro forma financials
The pro forma financials combine BIOX financials with historical Pro Farm financials, net of
intercompany operations. Pro forma figures are computed assuming the merger occurred as of July
1, 2021, and carried forward through the interim period presented. Pro forma figures are presented
for 4Q22 to facilitate year-over-year comparisons.
Table 8: 4Q22 Reconciliation of pro forma financials
(In millions of U.S. dollars) BIOX PFG1 Pro Forma
Revenue 105.7 9.3 115.0
Gross profit 36.4 4.6 41.0
Share of profit of JVs 0.4 - 0.4
Selling, general and administrative expenses (24.5) (11.1) (35.5)
Research and development expenses (2.3) (1.7) (4.0)
Other income or expenses, net (0.1) (0.0) (0.2)
Operating profit/(loss) 10.0 (8.2) 1.8
Financial results (7.6) (0.6) (8.2)
Profit/(loss) before income tax 2.4 (8.7) (6.4)
Income tax (6.9) 0.7 (6.2) |
| BIOCERES CROP SOLUTIONS FOURTH QUARTER 2023
13
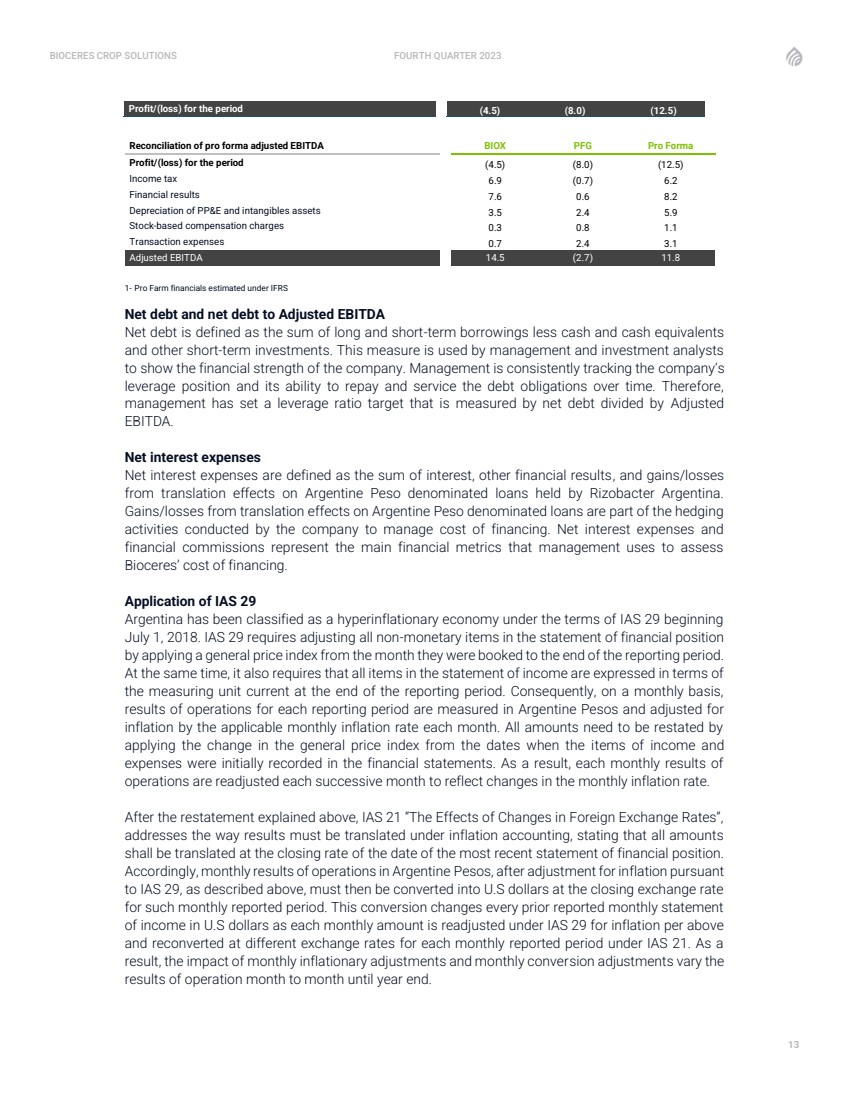
Profit/(loss) for the period (4.5) (8.0) (12.5)
Reconciliation of pro forma adjusted EBITDA BIOX PFG Pro Forma
Profit/(loss) for the period (4.5) (8.0) (12.5)
Income tax 6.9 (0.7) 6.2
Financial results 7.6 0.6 8.2
Depreciation of PP&E and intangibles assets 3.5 2.4 5.9
Stock-based compensation charges 0.3 0.8 1.1
Transaction expenses 0.7 2.4 3.1
Adjusted EBITDA 14.5 (2.7) 11.8
1- Pro Farm financials estimated under IFRS
Net debt and net debt to Adjusted EBITDA
Net debt is defined as the sum of long and short-term borrowings less cash and cash equivalents
and other short-term investments. This measure is used by management and investment analysts
to show the financial strength of the company. Management is consistently tracking the company’s
leverage position and its ability to repay and service the debt obligations over time. Therefore,
management has set a leverage ratio target that is measured by net debt divided by Adjusted
EBITDA.
Net interest expenses
Net interest expenses are defined as the sum of interest, other financial results, and gains/losses
from translation effects on Argentine Peso denominated loans held by Rizobacter Argentina.
Gains/losses from translation effects on Argentine Peso denominated loans are part of the hedging
activities conducted by the company to manage cost of financing. Net interest expenses and
financial commissions represent the main financial metrics that management uses to assess
Bioceres’ cost of financing.
Application of IAS 29
Argentina has been classified as a hyperinflationary economy under the terms of IAS 29 beginning
July 1, 2018. IAS 29 requires adjusting all non-monetary items in the statement of financial position
by applying a general price index from the month they were booked to the end of the reporting period.
At the same time, it also requires that all items in the statement of income are expressed in terms of
the measuring unit current at the end of the reporting period. Consequently, on a monthly basis,
results of operations for each reporting period are measured in Argentine Pesos and adjusted for
inflation by the applicable monthly inflation rate each month. All amounts need to be restated by
applying the change in the general price index from the dates when the items of income and
expenses were initially recorded in the financial statements. As a result, each monthly results of
operations are readjusted each successive month to reflect changes in the monthly inflation rate.
After the restatement explained above, IAS 21 “The Effects of Changes in Foreign Exchange Rates”,
addresses the way results must be translated under inflation accounting, stating that all amounts
shall be translated at the closing rate of the date of the most recent statement of financial position.
Accordingly, monthly results of operations in Argentine Pesos, after adjustment for inflation pursuant
to IAS 29, as described above, must then be converted into U.S dollars at the closing exchange rate
for such monthly reported period. This conversion changes every prior reported monthly statement
of income in U.S dollars as each monthly amount is readjusted under IAS 29 for inflation per above
and reconverted at different exchange rates for each monthly reported period under IAS 21. As a
result, the impact of monthly inflationary adjustments and monthly conversion adjustments vary the
results of operation month to month until year end. |
| BIOCERES CROP SOLUTIONS FOURTH QUARTER 2023
14
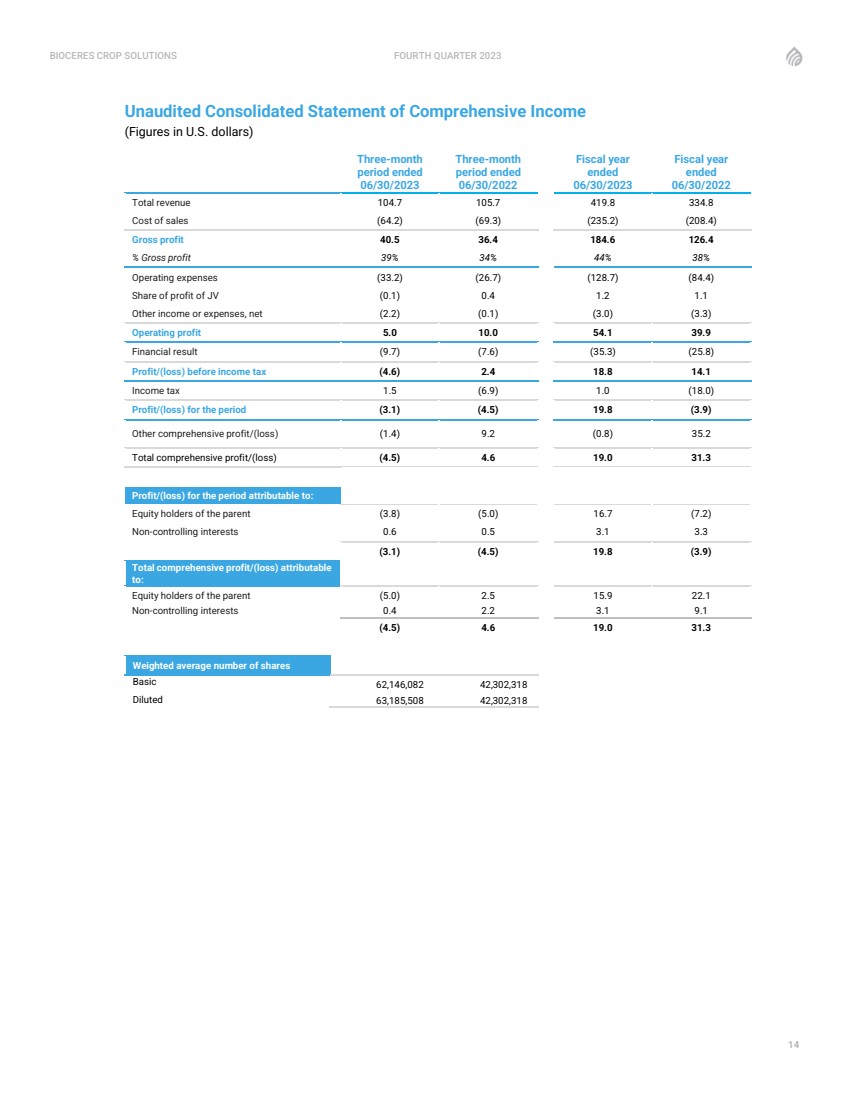
Unaudited Consolidated Statement of Comprehensive Income
(Figures in U.S. dollars)
Three-month
period ended
06/30/2023
Three-month
period ended
06/30/2022
Fiscal year
ended
06/30/2023
Fiscal year
ended
06/30/2022
Total revenue 104.7 105.7 419.8 334.8
Cost of sales (64.2) (69.3) (235.2) (208.4)
Gross profit 40.5 36.4 184.6 126.4
% Gross profit 39% 34% 44% 38%
Operating expenses (33.2) (26.7) (128.7) (84.4)
Share of profit of JV (0.1) 0.4 1.2 1.1
Other income or expenses, net (2.2) (0.1) (3.0) (3.3)
Operating profit 5.0 10.0 54.1 39.9
Financial result (9.7) (7.6) (35.3) (25.8)
Profit/(loss) before income tax (4.6) 2.4 18.8 14.1
Income tax 1.5 (6.9) 1.0 (18.0)
Profit/(loss) for the period (3.1) (4.5) 19.8 (3.9)
Other comprehensive profit/(loss) (1.4) 9.2 (0.8) 35.2
Total comprehensive profit/(loss) (4.5) 4.6 19.0 31.3
Profit/(loss) for the period attributable to:
Equity holders of the parent (3.8) (5.0) 16.7 (7.2)
Non-controlling interests 0.6 0.5 3.1 3.3
(3.1) (4.5) 19.8 (3.9)
Total comprehensive profit/(loss) attributable
to:
Equity holders of the parent (5.0) 2.5 15.9 22.1
Non-controlling interests 0.4 2.2 3.1 9.1
(4.5) 4.6 19.0 31.3
Weighted average number of shares
Basic 62,146,082 42,302,318
Diluted 63,185,508 42,302,318 |
| BIOCERES CROP SOLUTIONS FOURTH QUARTER 2023
15
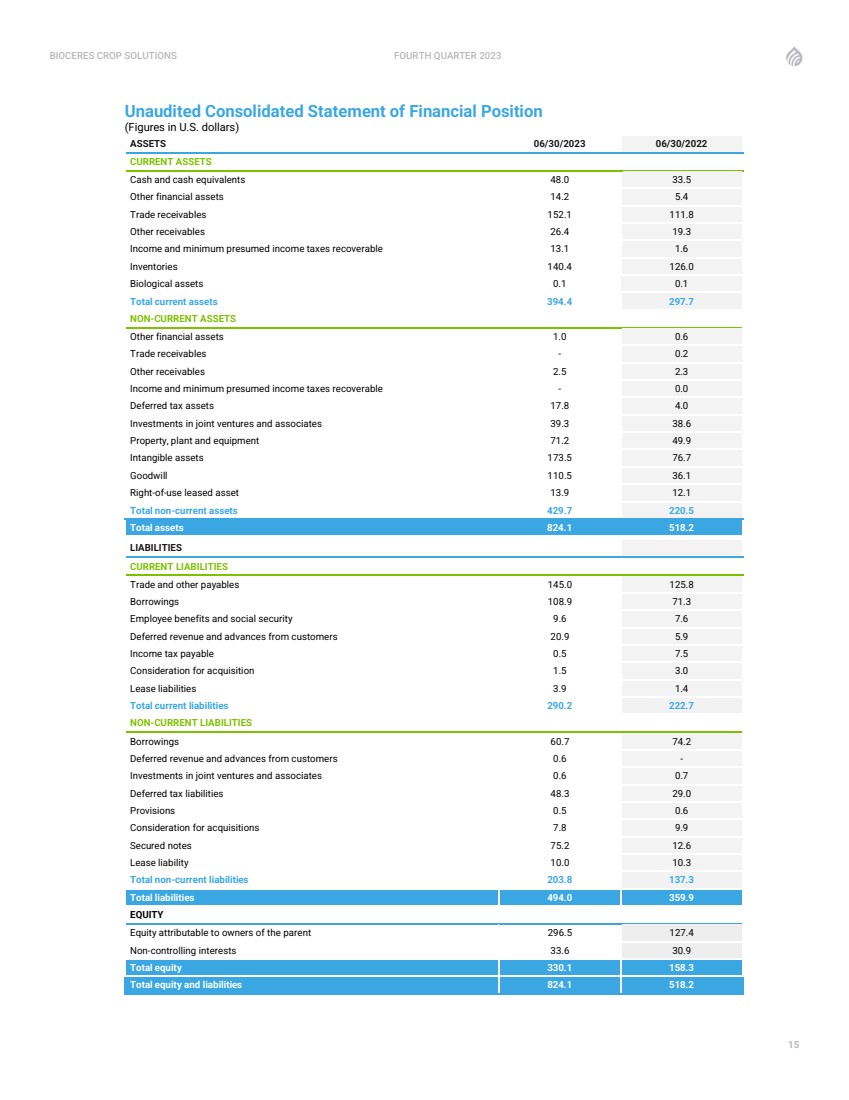
Unaudited Consolidated Statement of Financial Position
(Figures in U.S. dollars)
ASSETS 06/30/2023 06/30/2022
CURRENT ASSETS
Cash and cash equivalents 48.0 33.5
Other financial assets 14.2 5.4
Trade receivables 152.1 111.8
Other receivables 26.4 19.3
Income and minimum presumed income taxes recoverable 13.1 1.6
Inventories 140.4 126.0
Biological assets 0.1 0.1
Total current assets 394.4 297.7
NON-CURRENT ASSETS
Other financial assets 1.0 0.6
Trade receivables - 0.2
Other receivables 2.5 2.3
Income and minimum presumed income taxes recoverable - 0.0
Deferred tax assets 17.8 4.0
Investments in joint ventures and associates 39.3 38.6
Property, plant and equipment 71.2 49.9
Intangible assets 173.5 76.7
Goodwill 110.5 36.1
Right-of-use leased asset 13.9 12.1
Total non-current assets 429.7 220.5
Total assets 824.1 518.2
LIABILITIES
CURRENT LIABILITIES
Trade and other payables 145.0 125.8
Borrowings 108.9 71.3
Employee benefits and social security 9.6 7.6
Deferred revenue and advances from customers 20.9 5.9
Income tax payable 0.5 7.5
Consideration for acquisition 1.5 3.0
Lease liabilities 3.9 1.4
Total current liabilities 290.2 222.7
NON-CURRENT LIABILITIES
Borrowings 60.7 74.2
Deferred revenue and advances from customers 0.6 -
Investments in joint ventures and associates 0.6 0.7
Deferred tax liabilities 48.3 29.0
Provisions 0.5 0.6
Consideration for acquisitions 7.8 9.9
Secured notes 75.2 12.6
Lease liability 10.0 10.3
Total non-current liabilities 203.8 137.3
Total liabilities 494.0 359.9
EQUITY
Equity attributable to owners of the parent 296.5 127.4
Non-controlling interests 33.6 30.9
Total equity 330.1 158.3
Total equity and liabilities 824.1 518.2 |
Bioceres Crop Solutions (NASDAQ:BIOX)
Historical Stock Chart
From Jul 2024 to Aug 2024

Bioceres Crop Solutions (NASDAQ:BIOX)
Historical Stock Chart
From Aug 2023 to Aug 2024
