false
0000314203
0000314203
2023-11-01
2023-11-01
iso4217:USD
xbrli:shares
iso4217:USD
xbrli:shares
UNITED STATES
SECURITIES AND EXCHANGE COMMISSION
Washington, D.C. 20549
FORM 8-K/A
(Amendment No. 1)
CURRENT REPORT
Pursuant to Section 13 or 15(d) of the
Securities Exchange Act of 1934
Date of Report (Date of earliest event reported):
November 1, 2023
McEWEN MINING INC.
(Exact name of registrant as specified in
its charter)
| Colorado |
|
001-33190 |
|
84-0796160 |
(State or other jurisdiction
of incorporation) |
|
(Commission
File Number) |
|
(IRS Employer
Identification No.) |
150 King Street West, Suite 2800
Toronto, Ontario, Canada M5H 1J9
(Address of principal executive offices, including zip code)
(866) 441-0690
(Registrant’s Telephone Number, Including Area Code)
Check the appropriate box below if the Form 8-K filing
is intended to simultaneously satisfy the filing obligation of the registrant under any of the following provisions:
¨
Written communications pursuant to Rule 425 under the
Securities Act (17 CFR 230.425)
¨
Soliciting material pursuant to Rule 14a-12 under the
Exchange Act (17 CFR 240.14a-12)
¨
Pre-commencement communications pursuant to Rule 14d-2(b) under
the Exchange Act (17 CFR 240.14d-2(b))
¨
Pre-commencement communications pursuant to Rule 13e-4(c) under
the Exchange Act (17 CFR 240.13e-4(c))
Securities registered pursuant to Section 12(b) of
the Act:
| Title of Each Class: |
|
Trading Symbol(s): |
|
Name of Each Exchange on Which Registered: |
| Common Stock |
|
MUX |
|
New York Stock Exchange |
Indicate by check mark whether the registrant is an emerging growth
company as defined in Rule 405 of the Securities Act of 1933 (17 CFR §230.405) or Rule 12b-2 of the Securities Exchange
Act of 1934 (17 CFR §240.12b-2).
Emerging growth
company ¨
If an emerging
growth company, indicate by check mark if the registrant has elected not to use the extended transition period for complying with
any new or revised financial accounting standards provided pursuant to Section 13(a) of the Exchange Act. ¨
Explanatory Note
This
Amendment No. 1 to the Current Report on Form 8-K of McEwen Mining Inc. (the “Company”), filed with the Securities
and Exchange Commission on October 6, 2023 (the “Original Filing”), is being filed solely to file a revised Exhibit 96.1,
Technical Report Summary for the Company's Los Azules Copper Project, as amended on November 1,
2023, and related consents. No other changes have been made to the Original Filing or any other exhibit.
| Item 9.01 | Financial Statements and Exhibits |
(d) Exhibits. The following exhibits are furnished or filed
with this report, as applicable:
Cautionary Statement
With the exception of historical matters, the matters discussed in
the Technical Report Summary for the Los Azules Copper Project, effective May 9, 2023, as amended on November 1,
2023 (the “2023 TRS”) attached as an exhibit hereto includes forward-looking statements within the meaning of applicable securities
laws that involve risks and uncertainties that could cause actual results to differ materially from projections or estimates contained
therein. Such forward-looking statements include, among others, statements regarding future production and cost estimates, exploration,
development, construction and production activities. Factors that could cause actual results to differ materially from projections or
estimates include, among others, future drilling results, metal prices, economic and market conditions, operating costs, receipt of permits,
and receipt of working capital, as well as other factors described in the Company’s Annual Report on Form 10-K for the year
ended December 31, 2022, and other filings with the United States Securities and Exchange Commission. Most of these factors are beyond
the Company’s ability to predict or control. The Company disclaims any obligation to update any forward-looking statement made in
the 2023 TRS attached as an exhibit hereto, whether as a result of new information, future events, or otherwise, except as required by
applicable law. Readers are cautioned not to put undue reliance on forward-looking statements.
SIGNATURES
Pursuant to the requirements of the Securities Exchange Act of 1934,
the registrant has duly caused this report to be signed on its behalf by the undersigned hereunto duly authorized.
| |
McEWEN MINING INC. |
| |
|
|
| Dated: November 3, 2023 |
By: |
/s/ Carmen Diges |
| |
|
Carmen Diges, General Counsel |
EXHIBIT 23.1
CONSENT OF STANTEC CONSULTING INTERNATIONAL LTD.
In connection with the McEwen Mining Inc. Current
Report on Form 8-K filed with the Securities and Exchange Commission on October 6, 2023 and any amendments or supplements and/or
exhibits thereto, including without limitation Amendment No. 1 thereto (collectively, the “Form 8-K”), the undersigned
consents to the following:
| (i) | the filing and use of the technical report summary titled “SEC
S-K 229.1304 Technical Report Summary Initial Assessment – Individual Disclosure Los Azules Copper Project – Argentina”
(the “TRS”), with an effective date of May 9, 2023, an original date of August 25, 2023, and an amended date of
November 1, 2023, as an exhibit to and referenced in the Form 8-K; |
| (ii) | the incorporation by reference of the TRS in the Registration Statements of McEwen Mining Inc. on Form S-8 (Nos. 333-144563,
333-144569, 333-112269, 333-179143, 333-179144, 333-204693, and 333-222609) and Form S-4 (File No. 333-226858) (the “Registration
Statements”); |
| (iii) | the use of and references to our name, including our status as an expert or “qualified person” (as defined in Subpart
1300 of Regulation S-K promulgated by the Securities and Exchange Commission), in connection with the TRS, Form 8-K and the Registration
Statements; and |
| (iv) | any extracts from or summaries of the TRS included or incorporated by reference in the Form 8-K and the Registration Statements,
and the use of any information derived, summarized, quoted or referenced from the TRS, or portions thereof, that were prepared by us,
that we supervised the preparation of, and/or that were reviewed and approved by us, that is included or incorporated by reference in
the Form 8-K and the Registration Statements. |
Dated: November 3, 2023
| By: |
/s/ Stantec Consulting International Ltd. |
|
| Name: |
Stantec Consulting International Ltd. |
|
EXHIBIT 23.2
CONSENT OF SAMUEL ENGINEERING INC.
In connection with the McEwen Mining Inc. Current
Report on Form 8-K filed with the Securities and Exchange Commission on October 6, 2023 and any amendments or supplements and/or
exhibits thereto, including without limitation Amendment No. 1 thereto (collectively, the “Form 8-K”), the undersigned
consents to the following:
| (i) | the filing and use of the technical report summary titled “SEC
S-K 229.1304 Technical Report Summary Initial Assessment – Individual Disclosure Los Azules Copper Project – Argentina”
(the “TRS”), with an effective date of May 9, 2023, an original date of August 25, 2023, and an amended date of
November 1, 2023, as an exhibit to and referenced in the Form 8-K; |
| (ii) | the incorporation by reference of the TRS in the Registration Statements of McEwen Mining Inc. on Form S-8 (Nos. 333-144563,
333-144569, 333-112269, 333-179143, 333-179144, 333-204693, and 333-222609) and Form S-4 (File No. 333-226858) (the “Registration
Statements”); |
| (iii) | the use of and references to our name, including our status as an expert or “qualified person” (as defined in Subpart
1300 of Regulation S-K promulgated by the Securities and Exchange Commission), in connection with the TRS, Form 8-K and the Registration
Statements; and |
| (iv) | any extracts from or summaries of the TRS included or incorporated by reference in the Form 8-K and the Registration Statements,
and the use of any information derived, summarized, quoted or referenced from the TRS, or portions thereof, that were prepared by us,
that we supervised the preparation of, and/or that were reviewed and approved by us, that is included or incorporated by reference in
the Form 8-K and the Registration Statements. |
Dated: November 3, 2023
| By: |
/s/
Samuel Engineering Inc. |
|
| Name: |
Samuel Engineering Inc. |
|
EXHIBIT 23.3
CONSENT OF KNIGHT PIESOLD LTD.
In connection with the McEwen Mining Inc. Current
Report on Form 8-K filed with the Securities and Exchange Commission on October 6, 2023 and any amendments or supplements and/or
exhibits thereto, including without limitation Amendment No. 1 thereto (collectively, the “Form 8-K”), the undersigned
consents to the following:
| (i) | the filing and use of the technical report summary titled “SEC
S-K 229.1304 Technical Report Summary Initial Assessment – Individual Disclosure Los Azules Copper Project – Argentina”
(the “TRS”), with an effective date of May 9, 2023, an original date of August 25, 2023, and an amended date of
November 1, 2023, as an exhibit to and referenced in the Form 8-K; |
| (ii) | the incorporation by reference of the TRS in the Registration Statements of McEwen Mining Inc. on Form S-8 (Nos. 333-144563,
333-144569, 333-112269, 333-179143, 333-179144, 333-204693, and 333-222609) and Form S-4 (File No. 333-226858) (the “Registration
Statements”); |
| (iii) | the use of and references to our name, including our status as an expert or “qualified person” (as defined in Subpart
1300 of Regulation S-K promulgated by the Securities and Exchange Commission), in connection with the TRS, Form 8-K and the Registration
Statements; and |
| (iv) | any extracts from or summaries of the TRS included or incorporated by reference in the Form 8-K and the Registration Statements,
and the use of any information derived, summarized, quoted or referenced from the TRS, or portions thereof, that were prepared by us,
that we supervised the preparation of, and/or that were reviewed and approved by us, that is included or incorporated by reference in
the Form 8-K and the Registration Statements. |
Dated: November 3, 2023
| By: |
/s/ Knight Piesold
Ltd. |
|
| Name: |
Knight Piesold Ltd. |
|
EXHIBIT 23.4
CONSENT OF SRK CONSULTING UK LIMITED
In connection with the McEwen Mining Inc. Current
Report on Form 8-K filed with the Securities and Exchange Commission on October 6, 2023 and any amendments or supplements and/or
exhibits thereto, including without limitation Amendment No. 1 thereto (collectively, the “Form 8-K”), the undersigned
consents to the following:
| (i) | the filing and use of the technical report summary titled “SEC
S-K 229.1304 Technical Report Summary Initial Assessment – Individual Disclosure Los Azules Copper Project – Argentina”
(the “TRS”), with an effective date of May 9, 2023, an original date of August 25, 2023, and an amended date of
November 1, 2023, as an exhibit to and referenced in the Form 8-K; |
| (ii) | the incorporation by reference of the TRS in the Registration Statements of McEwen Mining Inc. on Form S-8 (Nos. 333-144563,
333-144569, 333-112269, 333-179143, 333-179144, 333-204693, and 333-222609) and Form S-4 (File No. 333-226858) (the “Registration
Statements”); |
| (iii) | the use of and references to our name, including our status as an expert or “qualified person” (as defined in Subpart
1300 of Regulation S-K promulgated by the Securities and Exchange Commission), in connection with the TRS, Form 8-K and the Registration
Statements; and |
| (iv) | any extracts from or summaries of the TRS included or incorporated by reference in the Form 8-K and the Registration Statements,
and the use of any information derived, summarized, quoted or referenced from the TRS, or portions thereof, that were prepared by us,
that we supervised the preparation of, and/or that were reviewed and approved by us, that is included or incorporated by reference in
the Form 8-K and the Registration Statements. |
Dated: November 3, 2023
| By: |
/s/ SRK Consulting
UK Limited |
|
| Name: |
SRK Consulting UK Limited |
|
EXHIBIT 23.5
CONSENT OF W. DAVID TYLER, SME-RM
In connection with the McEwen Mining Inc. Current
Report on Form 8-K filed with the Securities and Exchange Commission on October 6, 2023 and any amendments or supplements and/or
exhibits thereto, including without limitation Amendment No. 1 thereto (collectively, the “Form 8-K”), the undersigned
consents to the following:
| (i) | the filing and use of the technical report summary titled “SEC
S-K 229.1304 Technical Report Summary Initial Assessment – Individual Disclosure Los Azules Copper Project – Argentina”
(the “TRS”), with an effective date of May 9, 2023, an original date of August 25, 2023, and an amended date of
November 1, 2023, as an exhibit to and referenced in the Form 8-K; |
| (ii) | the incorporation by reference of the TRS in the Registration Statements of McEwen Mining Inc. on Form S-8 (Nos. 333-144563,
333-144569, 333-112269, 333-179143, 333-179144, 333-204693, and 333-222609) and Form S-4 (File No. 333-226858) (the “Registration
Statements”); |
| (iii) | the use of and references to my name, including my status as an expert or “qualified person” (as defined in Subpart 1300
of Regulation S-K promulgated by the Securities and Exchange Commission), in connection with the TRS, Form 8-K and the Registration
Statements; and |
| (iv) | any extracts from or summaries of the TRS included or incorporated by reference in the Form 8-K and the Registration Statements,
and the use of any information derived, summarized, quoted or referenced from the TRS, or portions thereof, that were prepared by me,
that I supervised the preparation of, and/or that were reviewed and approved by me, that is included or incorporated by reference in the
Form 8-K and the Registration Statements. |
Dated: November 3, 2023
| By: |
/s/ W. David Tyler |
|
| Name: |
W. David Tyler, SME-RM |
|
Exhibit 96.1


Signature
Page
This report
titled “SEC S-K 229.1304 Technical Report Summary Initial Assessment – Individual Disclosure Los Azules Copper Project –
Argentine” with an effective date of May 9, 2023, was prepared and signed by:

This
report was authored by the qualified persons (each a “QP” and collectively, the “QPs”) listed in Table 2.1. Each
QP and their respective Company only assumes responsibility for those sections or areas of the report that are referenced opposite
their name in Table 2.1. None of such QPs, however, accept any responsibility or liability for the sections or areas of this report that
were prepared by other QPs.

Engineering u Project Controls u Estimating u Construction Management |
|
| i |
Table
of Contents
| 1.0 |
EXECUTIVE
Summary |
1-1 |
| |
|
|
| 1.1 |
OWNERSHIP STRUCTURE |
1-9 |
| 1.2 |
LOCATION |
1-10 |
| 1.3 |
PROPERTY |
1-13 |
| 1.4 |
EXPLORATION & DRILLING |
1-15 |
| 1.5 |
mineral resource estimates |
1-15 |
| 1.6 |
mining |
1-16 |
| 1.7 |
Metallurgical Testwork and
Recovery Methods |
1-17 |
| 1.8 |
project economics |
1-20 |
| 1.9 |
key project risks &
opportunities |
1-22 |
| 1.10 |
qualified persons recommendations
and conclusions |
1-24 |
| |
|
|
| 2.0 |
introduction |
2-27 |
| |
|
|
| 2.1 |
2023 technical REPORT summary
(TRS) Update Overview |
2-27 |
| 2.2 |
Qualified Persons |
2-28 |
| 2.3 |
Personal Inspection of Los
Azules Property |
2-29 |
| |
|
|
| 3.0 |
property description |
3-31 |
| |
|
|
| 3.1 |
location |
3-31 |
| 3.2 |
property and title in argentina |
3-31 |
| 3.3 |
oWNERSHIP OF THE LOS AZULES
PROJECT |
3-32 |
| 3.4 |
ROYALTIES AND RETENTIONS |
3-43 |
| 3.5 |
BACK-IN RIGHTS |
3-43 |
| 3.6 |
ENVIRONMENTAL LIABILITIES |
3-43 |
| 3.7 |
PERMITTING REQUIREMENTS |
3-44 |
| 3.8 |
PERMITTING REGULATIONS |
3-44 |
| 3.9 |
GLACIER PROTECTION LEGISLATION |
3-45 |
| 3.10 |
ENVIRONMENTAL BASELINE STUDIES |
3-46 |
| |
|
|
| 4.0 |
Accessibility, Climate,
Local Resources, Infrastructure and Physiography |
4-48 |
| |
|
|
| 4.1 |
accessibility |
4-48 |
| 4.2 |
surface rights |
4-48 |
| 4.3 |
climate and length of operating
season |
4-48 |
| 4.4 |
local resources and infrastructure |
4-51 |
| 4.5 |
topography, elevation and
vegetation |
4-52 |
| 4.6 |
Availability of Area for
Mine and Processing Facilities |
4-53 |
| |
|
|
| 5.0 |
History |
5-54 |
| |
|
|
| 5.1 |
property history |
5-54 |
Engineering u Project Controls u Estimating u Construction Management |
|
| ii |
| 6.0 |
geological setting, mineralization,
and deposit |
6-57 |
| |
|
|
| 6.1 |
regional geology |
6-57 |
| 6.2 |
property geology |
6-60 |
| 6.3 |
other mineralization |
6-64 |
| 6.4 |
deposit types |
6-65 |
| |
|
|
| 7.0 |
exploration |
7-69 |
| |
|
|
| 7.1 |
exploration history |
7-69 |
| 7.2 |
Geological Mapping and Studies |
7-69 |
| 7.3 |
GEOPHYSICS |
7-69 |
| 7.4 |
SURVEYS AND INVESTIGATIONS |
7-74 |
| 7.5 |
FUTURE EXPLORATION |
7-75 |
| 7.6 |
drilling |
7-76 |
| 7.7 |
True Thickness of Mineralization |
7-85 |
| 7.8 |
Hydrogeology |
7-85 |
| 7.9 |
ADEQUACY STATEMENT ON SECTION
7 |
7-85 |
| |
|
|
| 8.0 |
sample preparation, analyses,
and security |
8-86 |
| |
|
|
| 8.1 |
Introduction |
8-86 |
| 8.2 |
Sampling Methods |
8-86 |
| 8.3 |
Sample Preparation and Analyses |
8-90 |
| 8.4 |
CONTROL SAMPLES |
8-93 |
| 8.5 |
CONCLUSIONS |
8-100 |
| |
|
|
| 9.0 |
data verification |
9-101 |
| |
|
|
| 9.1 |
Drill Site Inspection, Los
Azules Project Site |
9-101 |
| 9.2 |
Core Logging compound, los
azules project site |
9-102 |
| 9.3 |
Core Warehouse, Calingasta |
9-102 |
| 9.4 |
Alex Stewart Assay Lab,
Mendoza |
9-103 |
| 9.5 |
Global Database Manager,
Database Curator & Exploration Manager, San Juan |
9-103 |
| 9.6 |
CRM (Resource Estimation),
San Francisco |
9-104 |
| 9.7 |
Mine Technical Services
(MTS) Database Audits |
9-104 |
| 9.8 |
Geological Modelling |
9-104 |
| |
|
|
| 10.0 |
mineral processing and
metallurgical testing |
10-105 |
| |
|
|
| 10.1 |
introduction |
10-105 |
| 10.2 |
current metallurgical testwork
programs |
10-107 |
| 10.3 |
Nuton™ TECHNOLOGY
Testing |
10-130 |
| 10.4 |
Adequacy of data and use |
10-133 |
| |
|
|
| 11.0 |
mineral
resource estimates |
11-134 |
| |
|
|
| 11.1 |
Introduction |
11-134 |
Engineering u Project Controls u Estimating u Construction Management |
|
| iii |
| 11.2 |
Available
Data |
11-137 |
| 11.3 |
Geologic Model |
11-137 |
| 11.4 |
Compositing |
11-142 |
| 11.5 |
Exploratory Data Analysis |
11-142 |
| 11.6 |
Bulk Density |
11-156 |
| 11.7 |
Evaluation of Outlier Grades |
11-157 |
| 11.8 |
Variography |
11-159 |
| 11.9 |
Model Setup and Limits |
11-162 |
| 11.10 |
Interpolation Parameters |
11-162 |
| 11.11 |
Validation |
11-163 |
| 11.12 |
Resource Classification |
11-169 |
| 11.13 |
Mineral Resources |
11-172 |
| 11.14 |
adequacy STATEMENT on section
11 |
11-180 |
| |
|
|
| 12.0 |
mineral reserve estimates |
12-182 |
| 13.0 |
mining methods |
13-183 |
| |
|
|
| 13.1 |
Introduction |
13-183 |
| 13.2 |
Economic Pit Limit Evaluations |
13-186 |
| 13.3 |
Mining Phases and Pit Design |
13-195 |
| 13.4 |
LOS AZULES MINE PRODUCTION
SCHEDULE |
13-205 |
| 13.5 |
Mining Equipment |
13-207 |
| 13.6 |
Mine Workforce |
13-210 |
| 13.7 |
Hydrogeology and Pit Dewatering |
13-210 |
| |
|
|
| 14.0 |
processing and recovery
methods |
14-212 |
| |
|
|
| 14.1 |
introduction |
14-212 |
| 14.2 |
heap leach (sx/ew) process
flowsheet |
14-213 |
| 14.3 |
adequacy statement ON SECTION
14 |
14-223 |
| |
|
|
| 15.0 |
infrastructure |
15-224 |
| |
|
|
| 15.1 |
introduction |
15-224 |
| 15.2 |
access to los azules |
15-225 |
| 15.3 |
power supply to los azules |
15-231 |
| 15.4 |
camp facilities |
15-232 |
| 15.5 |
transportation |
15-234 |
| 15.6 |
Water Consumption |
15-235 |
| 15.7 |
water supply |
15-236 |
| |
|
|
| 16.0 |
market studies and contracts |
16-239 |
| |
|
|
| 16.1 |
Copper Market Outlook –
Supply vs Demand |
16-239 |
| 16.2 |
copper market outlook -
Prices |
16-240 |
| 16.3 |
Mineral Resource Estimate |
16-242 |
| 16.4 |
marketing |
16-242 |
Engineering u Project Controls u Estimating u Construction Management |
|
| iv |
| 16.5 |
cathode
or concentrate transportation |
16-243 |
| 16.6 |
Contracts |
16-243 |
| |
|
|
| 17.0 |
ENVIRONMENTAL
STUDIES, PERMITTING AND PLANS, NEGOTIATIONS, OR AGREEMENTS WITH LOCAL INDIVIDUALS OR GROUPS |
17-244 |
| |
|
|
| 17.1 |
ENVIRONMENTAL BASELINE STUDIES |
17-244 |
| 17.2 |
geochemistry |
17-248 |
| 17.3 |
ENVIRONMENTAL MANAGEMENT
AND MONITORING PLANS |
17-253 |
| 17.4 |
PROJECT PERMITTING |
17-254 |
| 17.5 |
SOCIAL/COMMUNITY |
17-254 |
| 17.6 |
CLOSURE PLANNING |
17-254 |
| |
|
|
| 18.0 |
capital and operating
costs |
18-261 |
| |
|
|
| 18.1 |
capital cost estimation |
18-261 |
| 18.2 |
Project Development Execution
Plan And Schedule |
18-264 |
| 18.3 |
Operating Cost Estimation |
18-267 |
| |
|
|
| 19.0 |
economic analysis |
19-271 |
| |
|
|
| 19.1 |
CAUTIONARY statement |
19-271 |
| 19.2 |
Methodology Used |
19-272 |
| 19.3 |
Financial Model Parameters |
19-272 |
| 19.4 |
Economic Results |
19-275 |
| 19.5 |
Sensitivity Analysis |
19-276 |
| 19.6 |
Mine Life and Capital Payback |
19-282 |
| |
|
|
| 20.0 |
adjacent properties |
20-283 |
| 21.0 |
other relevant data and
information |
21-284 |
| 22.0 |
interpretation and conclusions |
22-285 |
| |
|
|
| 22.1 |
Overall Risks and Opportunities
Summary |
22-285 |
| 22.2 |
PHASE 2 Upside Potentials |
22-287 |
| 22.3 |
Metallurgy and Mineral Processing |
22-292 |
| 22.4 |
sample preparation, analyses,
and security |
22-294 |
| 22.5 |
MINERAL RESOURCE ESTIMATES |
22-295 |
| 22.6 |
Pit Geotechnical |
22-296 |
| 22.7 |
MINE PLAN AND MINING METHODS |
22-298 |
| 22.8 |
ENVIRONMENTAL STUDIES, PERMITTING
AND SOCIAL OR COMMUNITY IMPACT |
22-299 |
| 22.9 |
PIT DEWATERING AND WATER
AVAILABILITY |
22-299 |
| 22.10 |
MINE ROCK STORAGE FACILITIES |
22-300 |
| |
|
|
| 23.0 |
recommendations |
23-302 |
| |
|
|
| 23.1 |
Overall recommendations |
23-302 |
| 23.2 |
metallurgy and mineral processing |
23-304 |
| 23.3 |
pit geotechnical |
23-305 |
Engineering u Project Controls u Estimating u Construction Management |
|
| v |
| 23.4 |
PIT DEWATERING
AND WATER AVAILABILITY |
23-306 |
| 23.5 |
MINE ROCK STORAGE FACILITIES |
23-307 |
| |
|
|
| 24.0 |
REFERENCES |
24-308 |
| 25.0 |
Reliance on information
provided by the registrant |
25-312 |
| 26.0 |
APPENDICES |
26-313 |
| |
|
|
| 26.1 |
Appendix A – units
of measure and abbreviations and acronyms |
26-313 |
Engineering u Project Controls u Estimating u Construction Management |
|
| vi |
List
of Tables
| Table
1.1: Project Phase 1 Life of Mine Economic Summary (After Taxes) |
1-2 |
| Table
1.2: Exploration Drilling by Year and by Company |
1-15 |
| Table
1.3: Mineral Resource Summary |
1-16 |
| Table
1.4: Initial Capital Costs by Case |
1-20 |
| Table
1.5: Life of Mine Operating Cost Summary |
1-20 |
| Table
1.6: Project Economic Summary by Case |
1-21 |
| Table
1.7: Average First 8 Years and LOM Cash Costs* |
1-22 |
| Table
1.8: Expected Costs for Feasibility Study Development |
1-26 |
| Table
2.1: Summary of Qualified Persons |
2-29 |
| Table
3.1: Andes Corporación Minera S.A. - Mining Right Descriptions |
3-37 |
| Table
7.1: Exploration Drilling by Year and by Company |
7-76 |
| Table
7.2: Examples of Significant Drilling Results Prior to 2022 |
7-80 |
| Table
7.3: Examples of Significant Copper, Gold and Silver Drilling Results From 2022 Campaign |
7-83 |
| Table
10.1: Event Timings and Associated Lithologies |
10-110 |
| Table
10.2: Event Timings and Material Types in the Ultimate Pit |
10-111 |
| Table
10.3: Event Timings and Material Types in 5 Year Pit |
10-111 |
| Table
10.4: Oxide/LIX Head Assays |
10-113 |
| Table
10.5: Supergene Head Assays |
10-113 |
| Table
10.6: Primary Head Assays |
10-115 |
| Table
10.7: Supergene Bottle Roll Results |
10-116 |
| Table
10.8: Primary Bottle Roll Results |
10-117 |
| Table
10.9: Column Head Assays |
10-119 |
| Table
10.10: Material Shipped to Hazen to undergo Nuton Testing |
10-130 |
| Table
10.11: Bundoora Column Test Matrix |
10-132 |
| Table
10.12: Hazen Column Test Matrix |
10-132 |
| Table
11.1: Indicated Resources for the Los Azules Project |
11-136 |
| Table
11.2: Inferred Resources for the Los Azules Project |
11-136 |
| Table
11.3: Chronological Geological Events used in Model Construction |
11-138 |
Engineering u Project Controls u Estimating u Construction Management |
|
| vii |
| Table
11.4: Sequence of Alteration Effecting the Los Azules Deposit |
11-140 |
| Table
11.5: Mineral Zonation Criteria |
11-141 |
| Table
11.6: Geologic Events Altering and Effecting the Los Azules Deposit |
11-141 |
| Table
11.7: Total Copper Statistics by Location and Mineral Zone |
11-147 |
| Table
11.8: Total Copper Statistics by Lithology and Sector |
11-148 |
| Table
11.9: Basic Statistics – CuCN by Mineral Zone |
11-153 |
| Table
11.10: Basic Statistics for Gold Grades by Mineral Zone |
11-155 |
| Table
11.11: Basic Statistics for Silver Grades by Mineral Zone |
11-156 |
| Table
11.12: Basic statistics of Density by Mineral Zone |
11-156 |
| Table
11.13: Potential Effect of Capping on Copper, Gold, and Silver Content |
11-158 |
| Table
11.14: Variogram Model Parameters for Copper, Gold, and Silver |
11-161 |
| Table
11.15: Block Model Origin and Dimensions |
11-162 |
| Table
11.16: Search Strategy for Copper Estimation, Pass 1 to 3 |
11-162 |
| Table
11.17: Search Strategy for Copper Estimation, Pass 4 to 6 |
11-163 |
| Table
11.18: Comparison of Resource and NN Estimates in The Block Model |
11-165 |
| Table
11.19: 2017 Estimate of Los Azules Mineral Resources |
11-172 |
| Table
11.20: NSR Parameters for Leach Recovery |
11-173 |
| Table
11.21: NSR Parameters for Mill/Flotation Process |
11-174 |
| Table
11.22: Open Pit Design Parameters |
11-176 |
| Table
11.23: Indicated Resources for the Los Azules Project |
11-177 |
| Table
11.24: Inferred Resources for the Los Azules Project |
11-177 |
| Table
11.25: Inferred Material under the Cryogenic Geoforms |
11-177 |
| Table
13.1: Heap-Leach Net Smelter Return Inputs for the IA Mine Plan |
13-187 |
| Table
13.2: Overall Suggested IA Pit Slope Angles, by Overall Pit Depth |
13-190 |
| Table
13.3: Pit Optimization Input Parameters |
13-192 |
| Table
13.4: In-situ Pit Quantities by Resource Classification |
13-196 |
| Table
13.5: Pit Quantities by Phase |
13-204 |
| Table
13.6: MRSF Parameters |
13-207 |
| Table
13.7: Annual Mine Equipment Productive Hours |
13-208 |
| Table
13.8: MS Haulage Inputs |
13-208 |
Engineering u Project Controls u Estimating u Construction Management |
|
| viii |
| Table
13.9: Mine Labor |
13-210 |
| Table
14.1: Potential Process Materials Distribution – Leach Only Pit Shell |
14-213 |
| Table
14.2: General Design Criteria |
14-217 |
| Table
14.3: Average Leach Cycle Times |
14-217 |
| Table
14.4: Base Case Leach Pad Plan and Estimated Copper Production – Year 1 through Year 18 |
14-221 |
| Table
14.5: Projected Process Facilities Average Electric Power Usage |
14-223 |
| Table
15.1: Southern Access Road Upgrade Estimate (RyAC, 2023) |
15-231 |
| Table
15.2: Projected Camp Staffing Requirements |
15-233 |
| Table
15.3: Life of Mine Average Water Consumption by Case |
15-236 |
| Table
15.4: Estimated water supply by source |
15-237 |
| Table
17.1: Summary of future environmental and social work plan |
17-247 |
| Table
17.2: Water Quality Standards from Decree 1.426 Law 24.585 |
17-249 |
| Table
17.3: Project Facilities |
17-255 |
| Table
18.1: Initial Capital Costs |
18-261 |
| Table
18.2: Base Case Sustaining Capital Plan |
18-263 |
| Table
18.3: Life of Mine Operating Cost Summary |
18-267 |
| Table
18.4: Mine Operating Costs 175ktpa Base Case |
18-268 |
| Table
18.5: Mine Operating Costs 125ktpa Alternative Case |
18-268 |
| Table
18.6: Life of Mine Operating Cost Summary |
18-269 |
| Table
18.7: Consolidated G&A (San Juan, Calingasta, Los Azules Site) |
18-270 |
| Table
19.1: Common Model Inputs |
19-272 |
| Table
19.2: Life of Mine Capital Cost Summary ($000s) |
19-273 |
| Table
19.3: Life of Mine Operating Cost Summary |
19-274 |
| Table
19.4: Project Economic Summary |
19-275 |
| Table
19.5: Copper Price Sensitivity |
19-276 |
| Table
19.6: CAPEX Sensitivity (Initial + Sustaining) |
19-279 |
| Table
19.7: OPEX Sensitivity |
19-280 |
| Table
22.1: Nuton Opportunity Capital Cost Summary for 35Mtpa Case |
22-288 |
| Table
22.2: Nuton Opportunity Operating Cost Summary for 35Mpta case |
22-288 |
Engineering u Project Controls u Estimating u Construction Management |
|
| ix |
| Table
22.3: Nuton™ Opportunity Economic Summaries |
22-289 |
| Table
22.4: Copper Concentrator Opportunity Capital Cost Summary |
22-290 |
| Table
22.5: Life of Mine Leach/Mill OPEX ($/t processed) |
22-291 |
| Table
22.6: Copper Concentrator Opportunity Economic Summary |
22-292 |
| Table
23.1: Expected Costs for Feasibility Study Development |
23-304 |
| Table
26.1: Units of Measure |
26-313 |
| Table
26.2: Abbreviations and Acronyms |
26-316 |
Engineering u Project Controls u Estimating u Construction Management |
|
| x |
List
of Figures
| Figure
1.1: C1 Cash Costs by Current Producer and Selected Development Projects |
1-3 |
| Figure
1.2: Estimated Carbon Intensity vs Copper Equivalent Production Centiles 2022-2040 (Scope 1 & 2 Emissions) - Wood Mackenzie 2022 |
1-9 |
| Figure
1.3: Location of Los Azules in the High Andes (Hatch, 2017) |
1-10 |
| Figure
1.4: Overall Site Plan (Samuel, 2023) |
1-12 |
| Figure
1.5: Los Azules Project Property Limits (V&G Report, 2023) |
1-14 |
| Figure
1.6: Simplified Process Flowsheet (Samuel, 2023) |
1-19 |
| Figure
3.1: Los Azules Ownership Structure (McEwen Mining, 2023) |
3-35 |
| Figure
3.2: Map of Mineral Claims (Minas), Easements (Servidumbres) and Surface (Superficie) Ownership (Vargas & Galindez/McEwen 2022) |
3-39 |
| Figure
3.3: ACMSA Owned Propiedad Minera (Mining Rights) and Campo Superficiario (Surface Rights) (McEwen, 2022) |
3-41 |
| Figure
3.4: Map of mineral concessions and surface rights (campos) within or adjacent to project area (Vargas & Galindez/McEwen, 2022) |
3-42 |
| Figure
4.1: Monthly Temperature Data Apr-17-Jun-18, Nov-19 (McEwen 2022) |
4-49 |
| Figure
4.2: Monthly Total Precipitation Data – no data recorded Apr-17-Jun-18, Nov-19 (McEwen 2022) |
4-50 |
| Figure
4.3: Monthly Wind Speed Data – no data recorded Apr-17-Jun-18, Nov-19 (McEwen 2022) |
4-51 |
| Figure
6.1: Physiographic features of San Juan Province, Argentina (Rojas 2010) |
6-58 |
| Figure
6.2: Regional geology of the Andean Cordillera of Argentina and Chile (Rojas 2010) |
6-59 |
| Figure
6.3: Model for Los Azules (pink: potassic alteration, green: chloritic alteration, blue: sericitic alteration, yellow: advanced argillic
lithocap), (Sillitoe, 2014) |
6-61 |
| Figure
6.4: Early Mineralized Porphyry (magenta) with supergene enrichment zone (red) defined as the Soluble Cu ratio >50%. (McEwen Copper,
2022) |
6-63 |
| Figure
6.5: Kinematic structural interpretation of Los Azules porphyry copper deposit (Pratt 2010) |
6-64 |
| Figure
6.6: Part of the Central Chile Segment of the Miocene-early Pliocene Porphyry Copper Belt (Rojas 2008) |
6-66 |
| Figure
6.7: Diagram Showing Spatial Relationships between a Porphyry Copper System and the Surrounding Environment (Sillitoe 2010) |
6-67 |
Engineering u Project Controls u Estimating u Construction Management |
|
| xi |
| Figure
6.8: Example Cross-Section (Section 40) of the Deposit showing the Main Lithological Units |
6-68 |
| Figure
6.9: Generalized Volcano-Stratigraphic Column of the Los Azules Copper Porphyry Deposit |
6-68 |
| Figure
7.1: Magnetic Map of Los Azules (Reduced to Pole) and IP lines. (Rojas, 2008 after Xstrata, 2003). Note: Red box indicates
the mag low across the Ballena Ridge |
7-71 |
| Figure
7.2: Section 58,400N Showing 2D IP Inversion Anomaly (Southwest Target) (McEwen 2012) |
7-73 |
| Figure
7.3: Total Magnetic Field Map of Los Azules. (Quantec, 2012). Note: Dashed red box indicates the mag low across the Ballena
Ridge seen above in Figure 7.1 – the solid red box indicates the discontinuous mag low to the southwest |
7-74 |
| Figure
7.4: Plan Showing Locations of drill holes at Los Azules (CRM 2022) |
7-77 |
| Figure
7.5: Logging and inspection of drill core |
7-78 |
| Figure
7.6: Geotechnical logging and data collection |
7-79 |
| Figure
8.1: Dedicated static photo booth for consistent photography of core |
8-87 |
| Figure
8.2: An example of the labelling of core boxes for photography |
8-87 |
| Figure
8.3: The securing and loading of the core boxes for shipment to Calingasta |
8-88 |
| Figure
8.4: The hyperspectral scanning unit and the hydraulic core splitter |
8-88 |
| Figure
8.5: Showing the sequence of bagging, tagging, sealing, and securing the samples for dispatch |
8-89 |
| Figure
8.6: Total Copper Assays vs Re-Assays |
8-91 |
| Figure
8.7: Cyanide Soluble Copper Assays vs Re-Assays |
8-92 |
| Figure
8.8: Diagnostic charts for standards used at Los Azules 2007-2022 |
8-96 |
| Figure
8.9: Control charts for the blanks at Los Azules 2004-2022 |
8-98 |
| Figure
8.10: QQ plots for core duplicates 2012-2022 |
8-99 |
| Figure
8.11: QQ plot for the pulp duplicates in the 2022 campaign |
8-100 |
| Figure
9.1: Transferring Core to Core Box |
9-101 |
| Figure
9.2: Drill Pad Preparation |
9-102 |
| Figure
9.3: Core storage racks at Calingasta |
9-103 |
| Figure
10.1: Spatial Representation of Phase 1 Metallurgical Samples in the 5 Year Pit (SE, 2023) |
10-108 |
Engineering u Project Controls u Estimating u Construction Management |
|
| xii |
| Figure
10.2: Spatial Representation of Phase 1 Metallurgical Samples in the Ultimate Pit (SE, 2023) |
10-109 |
| Figure
10.3: 19 mm Supergene Column Soluble Copper Recovery |
10-121 |
| Figure
10.4: 12.7 mm Supergene Column Soluble Copper Recovery |
10-122 |
| Figure
10.5: 19 mm Supergene Column Total Copper Recovery |
10-123 |
| Figure
10.6: 12.7 mm Supergene Column Total Copper Recovery |
10-124 |
| Figure
10.7: 19 mm Column Gross Acid Consumption |
10-125 |
| Figure
10.8: 12.7 mm Column Gross Acid Consumption |
10-126 |
| Figure
10.9: 19 mm pH |
10-127 |
| Figure
10.10: 12.7 mm pH |
10-128 |
| Figure
11.1: Drill Hole Location Map |
11-137 |
| Figure
11.2: Plan view of the lithology model under construction |
11-139 |
| Figure
11.3: Oblique section view of the completed lithological model looking North |
11-140 |
| Figure
11.4: Plan Map of Drilling Showing Location of Central Structure |
11-143 |
| Figure
11.5: Relationship Between Composite Copper Grades and Structure |
11-144 |
| Figure
11.6: Average Copper by Distance and Mineral Zone |
11-145 |
| Figure
11.7: Average Copper by Mineral Zone, Lithology and Distance |
11-146 |
| Figure
11.8: Cross Contact Composite Comparison |
11-150 |
| Figure
11.9: Detailed Cross Contact Composite Grade / Distance Analysis |
11-151 |
| Figure
11.10: Box Plots of CuCN by Mineral Zone |
11-152 |
| Figure
11.11: Average CuCN grades by Distance from Central Structure |
11-152 |
| Figure
11.12: Scatter plots of Total Copper VS Cyanide Soluble Copper |
11-153 |
| Figure
11.13: Graph Showing Relationship Between Copper Grades and Depth |
11-154 |
| Figure
11.14: Scatter plots of Precious Metals vs Total Copper |
11-155 |
| Figure
11.15: Experimental Data and Modeled Variogram |
11-160 |
| Figure
11.16: Scatter Plots of Large Block Comparison of Samples VS Model Grades |
11-166 |
| Figure
11.17: East-West Swath Plots of Total and Cyanide Soluble Copper Grades in the NN Model |
11-167 |
| Figure
11.18: North-South Swath Plots of Total and Cyanide Soluble Copper Grades in the NN Model |
11-168 |
Engineering u Project Controls u Estimating u Construction Management |
|
| xiii |
| Figure
11.19: Total and Cyanide Soluble Copper Related to Depth from the Top of the Enriched Zone |
11-169 |
| Figure
11.20: Comparison of Indicated and Inferred limits before and after Smoothing |
11-171 |
| Figure
11.21: Plan View of the Resource Pit with Geoforms Outlines |
11-172 |
| Figure
11.22: Plan View of the Resource Pits with Slope Angles |
11-176 |
| Figure
11.23: Grade / Tonnage Curves for Leach NSR |
11-179 |
| Figure
11.24: Grade / Tonnage Curves for Mill NSR |
11-180 |
| Figure
13.1: Long Section through the Los Azules Mineralization Looking East – with Mining Phase Outlines |
13-184 |
| Figure
13.2: Cross Section through the Los Azules Mineralization Looking North West– with Mining Phase Outlines |
13-185 |
| Figure
13.3: Cryogenic Landform Locations on the Los Azules Property, with 50 m Topography Contours |
13-188 |
| Figure
13.4: Factor of Safety with Slope Angle and Pit Depth |
13-189 |
| Figure
13.5: Slope Zones for ultimate selected pit shell |
13-191 |
| Figure
13.6: Pit-by-Pit graph Economic Pit Optimization for the 175 ktpa production case |
13-194 |
| Figure
13.7: Pit Area Prior to Mining, with 50 m Topography Contours |
13-197 |
| Figure
13.8: Largest Selected Leach Only Pit, with 50 m Topography Contours |
13-198 |
| Figure
13.9: Cross Section Plan |
13-200 |
| Figure
13.10: Cross Section 1 with Pit Phasing and Leach NSR Values |
13-201 |
| Figure
13.11: Cross Section 2 with Pit Phasing and Leach NSR Values |
13-202 |
| Figure
13.12: Cross Section 3 with Pit Phasing and Leach NSR Values |
13-203 |
| Figure
13.13: Los Azules Mine Production Schedule |
13-206 |
| Figure
13.14: Fleet Size for the Primary Mining Fleet |
13-209 |
| Figure
14.1: Heap Leach Process Flowsheet |
14-214 |
| Figure
14.2: Heap Leach Pad General Layout |
14-219 |
| Figure
14.3: PLS Collection |
14-220 |
| Figure
15.1: Regional Infrastructure (Google Earth 2022) |
15-225 |
| Figure
15.2: Existing Access & Infrastructure (ACMSA, 2022) |
15-226 |
| Figure
15.3: Access Roads Photos (McEwen, 2023) |
15-227 |
| Figure
15.4: Site Access Road Profiles (McEwen) |
15-229 |
Engineering u Project Controls u Estimating u Construction Management |
|
| xiv |
| Figure
15.5: Southern Access Road Route & Design Basis Sections (RyAC, 2023) |
15-230 |
| Figure
15.6: Mine Camp Concept - Isometric view showing Solar Arc |
15-233 |
| Figure
15.7: Mine Camp Concept - Oblique View |
15-234 |
| Figure
15.8: The Rio Salinas at the Proposed Campsite |
15-238 |
| Figure
16.1: Future Copper Market Demand Scenarios (from S&P Global) |
16-240 |
| Figure
16.2: Long-term Copper Pricing (CIBC, May 2023) |
16-241 |
| Figure
16.3: Copper Prices 1990 to Present (source: International Monetary Fund) |
16-242 |
| Figure
18.1: Conceptual Project Execution Schedule |
18-266 |
| Figure
18.2: Mine Operating Cost Breakdown |
18-268 |
| Figure
19.1: LOM Operating Costs per Tonne Mineralized Material (Samuel Engineering 2023) |
19-274 |
| Figure
19.2: Copper Price per Pound Sensitivity on NPV @ 8% (Pre-tax, 175k Cu Case) (Samuel Engineering 2023) |
19-278 |
| Figure
19.3: Copper Price per Pound Sensitivity on IRR (Pre-tax) (Samuel Engineering 2023) |
19-279 |
| Figure
19.4: Multiple % Sensitivity on NPV @ 8% (Pre-tax) (Samuel Engineering 2023) |
19-280 |
| Figure
19.5: Multiple % Sensitivity on NPV @ 8% (Post-tax) (Samuel Engineering 2023) |
19-281 |
| Figure
19.6: Multiple % Sensitivity on IRR (Pre-tax) (Samuel Engineering 2023) |
19-282 |
| Figure
20.1: Regional Adjacent Properties |
20-283 |
| Figure
23.1: Feasibility Study Development Timeline |
23-303 |
Engineering u Project Controls u Estimating u Construction Management |
|
| xv |

The Los Azules Project is among the largest undeveloped
copper deposits on the globe. Los Azules presents a multi-generational opportunity to design, build and operate a copper mine that is
globally significant, technologically advanced, embraces regenerative design principles, and minimizes carbon footprint.
This report is a Technical Report Summary (TRS)
which summarizes the findings of the Preliminary Study completed for the Los Azules Project in accordance with The United States Securities
Exchange Commission (SEC) 17 CFR Part §229.1300 (S-K 1300) Standard Instructions for Regulation S-K subpart 1300 SEC S-K §229.
1304 and §229.601(b)(96). This TRS is intended to meet the requirements of S-K 1300 as considered for an Initial Assessment (IA)
level of study and disclosure as defined in the regulations and supporting reference documents. The purpose of this TRS is to report the
study results, updated mineral resources, additional technical work completed, and the subject project estimated costs and economic potential.
The effective date of this report is May 9, 2023, concurrent with the updated final resource estimates published herein.
This TRS supersedes the current report on file
titled: SEC S-K 229.1304 INITIAL ASSESSMENT INDIVIDUAL DISCLOSURE FOR THE LOS AZULES PROJECT, ARGENTINA, prepared by Mining Plus US Corporation
with an effective date of April 01, 2021 (report revision date of February 25, 2022).
All currency shown in this report is expressed
in May 2023 United States Dollars unless otherwise noted. Metric units of measure are used unless otherwise specified.
This Technical Report Summary is prepared for
McEwen Mining Inc. (McEwen Mining) trading under the symbol NYSE/TSX: MUX for the purposes of disclosing current updates and information
related to its 51.9% owned subsidiary McEwen Copper Inc. (McEwen Copper), which controls the Los Azules copper property located in Argentina.
Los Azules is an exploration and development project presently consisting of a large porphyry copper deposit located in the Andes Cordilleran
region of San Juan Province, Argentina near the border with Chile (the “Project”).
The Project is at the exploration stage of investigation;
consequently, this study is preliminary in nature and includes Inferred mineral resources in one of the conceptual mine plans and mine
production schedules presented. Inferred mineral resources are considered too speculative geologically and in other technical aspects
to enable them to be categorized as mineral reserves under the standards set forth in S-K 1300. There is no certainty that the estimates
in this IA will be realized.
McEwen Mining is obligated to report material
information pursuant to its dual listings on the New York Stock Exchange (NYSE) and Toronto Stock Exchange (TSX). A corresponding Technical
Report was also completed in accordance with Canadian National Instrument 43-101 (NI 43-101) based on the same information and data. Information
related to the project described under the NI 43-101 reporting rules is included in this report for clarity and to avoid confusion between
reports. Two open pit-based mine plans were developed and are described in this TRS; one includes only material classified as Measured
& Indicated Resources as required by S-K 1300 and a second mine plan including inferred resources within the pit comparable to what
is reported in the corresponding NI 43-101 report.
| Project Los Azules – S-K 1300 Technical Report Summary | Project No.: 21139-03 | 1-1 |
This 2023 IA incorporates an updated development
strategy with the following two phases: Phase 1 considers mining and processing resources associated with the oxide and supergene copper
mineralization in the near surface portion of the deposit using heap leaching methods. Phase 2 of the project considers the continued
development of the deposit’s primary copper mineralization found beneath the supergene copper layer. The focus of this 2023 IA is
the initial Phase 1 project with limited concepts presented for Phase 2. For clarity, the economic outcomes for the cases presented in
this report include only Phase 1.
The Phase 1 implementation scheme for the Project
is an open pit mine initially processing materials with crushing, bio-heap leaching and solvent extraction and electrowinning (SX/EW)
facilities to produce LME Grade A copper cathodes for sale in Argentina or for export. Phase 1 preliminary mining plans excluding Inferred
Mineral Resources extract a total of 8.2 billion pounds (3,732 ktonnes) of contained copper from the Measured & Indicated resources,
of which 6.0 billion lbs. (2,721 ktonnes) is recoverable to copper cathodes. The total copper recovery expected is approximately 73% and
considers scale-up efficiencies and production distribution over a two-year timeframe from placement of material on the leach pad.
Based on consensus estimates and independent analysis,
long-term metal pricing used in this report (except for mineral resource estimation) and project economic analysis are Copper (Cu) - $3.75/pound;
Gold (Au) - $1,700/ounce; and Silver (Ag) - $20.00/ounce. The 2023 updated financial outcomes for the Phase 1 initial project mine and
facilities are shown in Table 1.1 below (expressed in Q1 2023 United States Dollars, after taxes).
| Table 1.1: Project Phase 1 Life of Mine Economic Summary (After Taxes) |
| Project Metric |
Units |
Base Case
175k tpa Cu |
NI 43-101
Including Inferred
175k tpa Cu |
| Mine Life (including stockpile) |
Yr |
17 |
27 |
| Strip Ratio |
|
1.29 |
1.16 |
| Copper Production – cathode Cu |
ktonnes |
2,721 |
3,938 |
| Initial Capital Cost |
USD Millions |
$2,448 |
$2,462 |
| Sustaining Capital Cost |
USD Millions |
$1,878 |
$2,243 |
| C1 Costs (Life of Mine) |
USD/lb Cu |
$0.93 |
$1.07 |
| All-in Sustaining Costs (AISC) |
USD/lb Cu |
$1.54 |
$1.64 |
| Internal Rate of Return (IRR) |
% |
21.5% |
21.2% |
| Net Present Value (NPV) @ 8% |
USD Millions |
$2,234 |
$2,659 |
| Pay Back Period |
Yr |
3.4 |
3.2 |
C1 cash costs are defined as the cash cost incurred
at each processing stage, from mining through to recoverable copper delivered to the market, net of any by-product credits. C1 cash costs
per pound of copper produced and all-in sustaining costs per pound of copper produced are non-GAAP ratios. If it were in production today,
the average C1 cash costs at Los Azules would be in the lowest cost quartile among copper producers. Figure 1.1 shows global cost data
from S&P Capital IQ and SE showing how the Los Azules Base Case and Alternative Case average C1 cash costs compare to producing copper
mines in 2022.
| Project Los Azules – S-K 1300 Technical Report Summary | Project No.: 21139-03 | 1-2 |
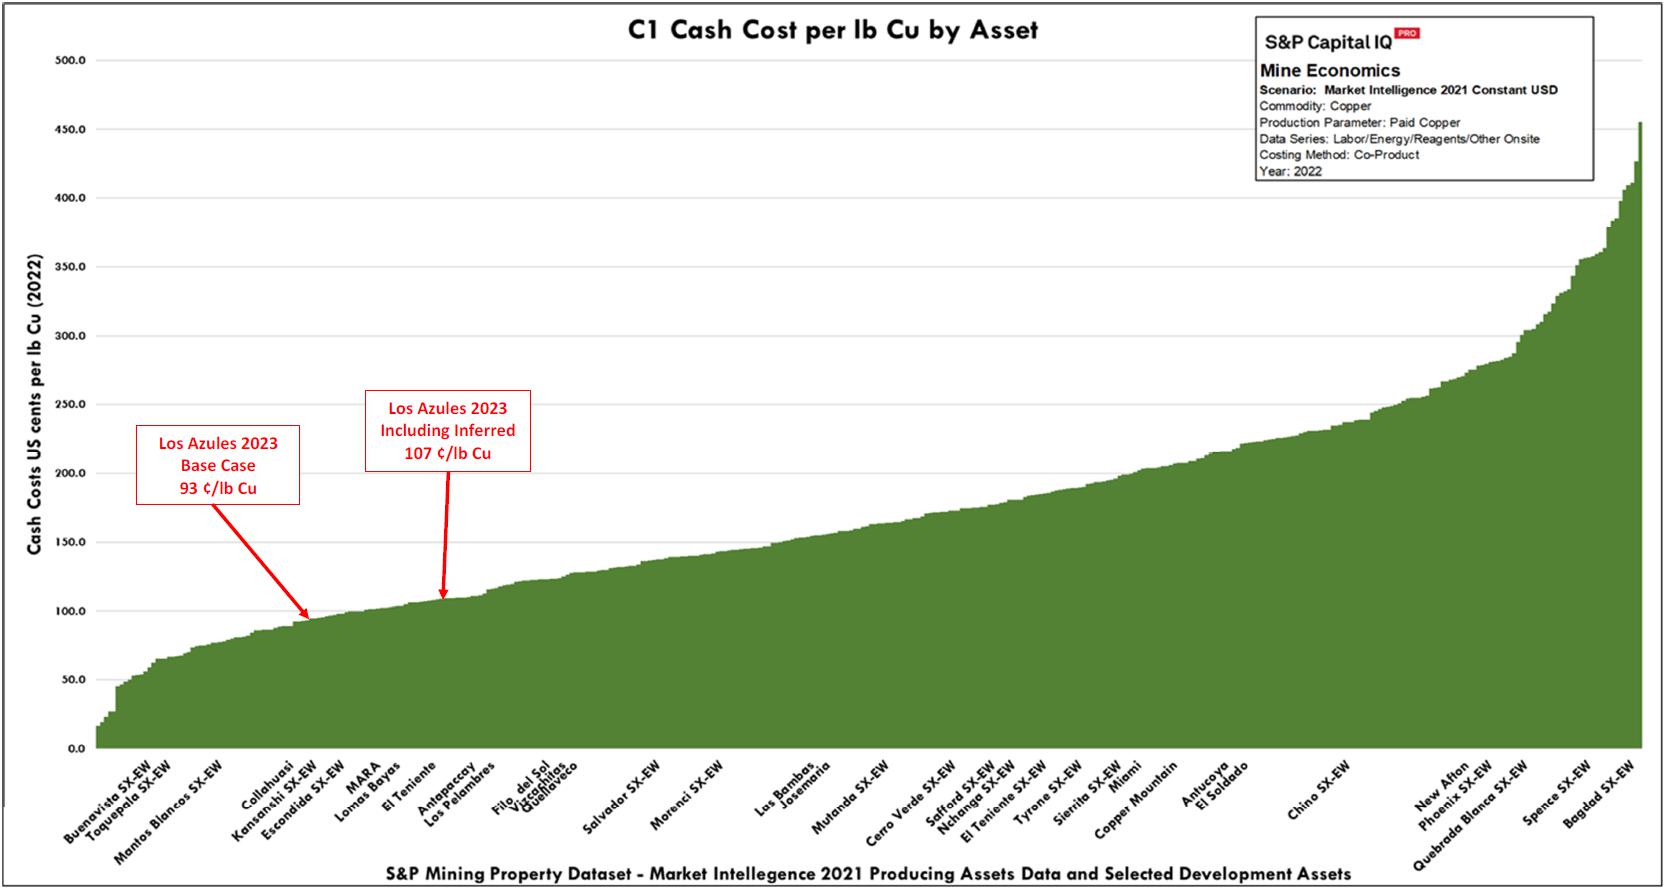
(Source: S&P Capital IQ Mine Economics Market
Intelligence 2022 Data, SE Analysis)
Figure 1.1: C1 Cash Costs by Current Producer
and Selected Development Projects
| Project Los Azules – S-K 1300 Technical Report Summary | Project No.: 21139-01 | 1-3 |
The opportunity to process primary sulfides directly
through a heap leach rather than building a traditional copper concentrator in the future is the envisioned approach to the Los Azules
development plan. The primary sulfides are currently not considered economically suitable for commercial heap leaching operation.
Continuing the benefits of a hydrometallurgical
approach is the preferred path of the project for Phase 2, along with ongoing development work efforts. Metallurgical work evaluating
NutonTM bio-leaching technology is being developed to potentially replace the need for a future milling operation in favor
of continued leaching and copper cathode production for the life of the mining operations. Potential scenarios for the future operations
employing the NutonTM bio-leaching technology are presented and discussed in Section 22.2.1 of this report.
Although Nuton LLC, a Rio Tinto Venture, has completed
larger scale testing at several global project sites and has developed proprietary modeling techniques to predict results, there are no
commercial applications of the Nuton™ technology operating at the time of this report. Based on preliminary small-scale testing
by Nuton and economic modeling inputs, these options provide the opportunity to extend the mine life to more than 50 years in some instances
and increasing copper produced by more than 30% while adding significant additional value at lower LOM operating costs.
A significant testing program will be required
to validate these preliminary estimates; therefore, these results are not considered suitable for inclusion at this time in the initial
project phase cases presented and are only included as a demonstration of the potential future opportunity.
A conventional mill and flotation/concentrator
option was considered to process primary copper mineralization to demonstrate economic viability employing conventional methods and support
reserves estimation confidence. Details for this option can be found in Section 22.2.2.
The next steps for the Los Azules Project are
continuing with infill resource drilling, variability and confirmatory metallurgical testing, environmental baseline studies, and commencing
critical preliminary engineering such as hydrogeologic field investigations and geotechnical drilling at the heap leach pad site, tailings
dam site and within the pit wall slopes to support a feasibility study.
| Project Los Azules – S-K 1300 Technical Report Summary | Project No.: 21139-03 | 1-4 |
A NEW VISION AND APPROACH
Copper is a key ingredient in the solutions to
global climate change, including initiatives in the automotive sector as the industry transitions to electric cars and the energy sector
as it moves to more renewable forms. Los Azules aspires to be the world’s first Regenerative Copper Mine, providing valuable materials
for a renewably powered world.
Guiding regenerative principles were developed
to reframe the approach to sustainable innovation within the mining industry and set forth high-reaching goals that are being explored
for all facets of the mining processes considered for Los Azules. The project development seeks to significantly reduce the environmental
footprint of mining operations and their associated greenhouse gas emissions by integrating the latest renewable and environmentally responsible
technologies and processes. The project aims to obtain 100% of its energy from renewable sources (wind, hydro, and solar) in a combination
of offsite and onsite installations. Where possible, the project is also seeking to have long-term net positive impacts on the greater
Andean ecosystem, the lives of miners, and the citizens of nearby communities, while contributing positively to the local and national
economy of Argentina.
The project concepts allow for early adoption
of emerging technologies under development and are anticipated to be commercially viable over the mine life. By being ‘future ready’
the project will be poised to adopt newly emerging technologies and infrastructure opportunities
Key project initiatives aimed at achieving these
goals are described below.
Respecting the Lands We Use
The Los Azules Project is committed to responsible
stewardship of the land and minimizing disturbance of local glacial morphologies and wetlands (“vegas” in the local terminology)
wherever possible. Careful consideration of how activities are conducted and where they are located is a key aspect to meeting these commitments,
both in the short and long term. Minimizing land use and disturbance by consolidating uses to the extent possible is considered in the
site layouts, individual site areas, facilities/buildings, and access to the mine site.
Although the vegas in the pit and leach pad areas
will be impacted, minimizing the footprint of the site facilities, re-routing, and diverting water courses to downstream connections are
key design feature for the mine and leaching areas water management plans to minimize these impacts. The leach pad design includes an
underdrainage for non-contact water coming from upstream sources to flow through the same valley and to the Rio Salinas. Longer term,
the water courses will be restored during reclamation of the mine site at the completion of activities to bring the area as close to its
original state as possible.
Transforming Water Use and Quality
Climate change, population growth and the industrial
and agricultural use of water are some of the factors that affect water availability. In addition, the expansion of urban infrastructure
exerts pressure on the quantity and quality of natural water courses. Long-term water solutions must be flexible, adaptable, and environmentally
sustainable, working within the ‘carrying capacity’ of its place and climate. Increasing the efficiency of water use is equivalent
to increasing productivity or, in other words, reducing the intensity of use by maximizing the value of uses and, in this way, improving
allocation among different competing utilization.
| Project Los Azules – S-K 1300 Technical Report Summary | Project No.: 21139-03 | 1-5 |
Selecting a hydrometallurgical process option
for Los Azules could reduce effective water usage by 75% to 80% over a milling/concentrator alternative. Additionally, alternatives for
improving precipitation/snow capture, site dust control, reuse/recycle and passive water treatment strategies are being developed at Los
Azules.
Transforming the Energy/Carbon Nexus
An extensive review of power generation and supply
options for the project was undertaken to consider the options for renewable energy. YPF Sociedad Anónima (“YPF S.A.”
or “YPF”) owns and operates power generation facilities in Argentina based on wind, solar, geothermal, and hydroelectric sources
through its subsidiary YPF-LUZ. YPF-LUZ has a rate structure based on 100% renewables sourced power generation that can be used as the
project basis, eliminating hydrocarbon-based generation and associated emissions. The YPF-LUZ electric power supply option was selected
for the Los Azules Project at a small premium over other hydrocarbon-based power options.
In addition to energy supply, the reduction of
energy consumption is also a key aspect to regenerative mining.
Processing with the End Game in Mind
Given the context above, the most appropriate
technology selection for Los Azules to minimize water usage is a hydrometallurgical approach, which is the basis for the Phase 1 project
development. The hydrometallurgical option also provides lower overall project impacts from:
| · | Reduced energy usage by 35% over a concentration alternative to produce copper cathodes. The electric
load reduction is about 25%. |
| · | Lower transport requirements for product based on copper content of cathodes (99.99% Cu) versus concentrates
(25%-35% Cu) and concentrate smelting options located outside of Argentina/South America. |
| · | More efficient and minimized use of land for heap leach pad versus tailings storage facilities from concentration
tailings discharge. |
| · | On-site generation of sulfuric acid, using by-product sulfur supplied from local Argentinian sources,
employing waste heat capture for on-site power generation and process heating – reduces grid based electric power requirements and
eliminates hydrocarbon-based alternatives. |
| · | Establishment of the infrastructure to be a rapid adopter of emerging heap leaching technologies for primary
copper mineral resources when encountered – avoiding the future need for concentration methods as is the current industry practice. |
| Project Los Azules – S-K 1300 Technical Report Summary | Project No.: 21139-03 | 1-6 |
Moving Rock and Decarbonizing Mining Operations
Maximizing electrification, coupled with renewable
power supply is aimed at significantly reducing environmental impacts.
The initial mining concepts will use trolley-assisted
diesel-electric mine haulage and support equipment initially to significantly reduce diesel emissions. However, the project will select
equipment and methods to rapidly transition to fossil fuel-free alternatives as rapidly as the technology and manufacturing capacities
allow. The transition would also include in-pit conveying alternatives to minimize fleet requirements. The ultimate vision is a fully
electric mine and the elimination of emissions associated with fossil-fuels.
A Mining Camp for Maximum Livability –
the healthiest, greenest mine camp in the world.
The long-term permanent mine camp has been strategically
located to optimize multiple variables. Worker safety, comfort, well-being, as well as the distance from the mine operations and access
to the main road are major considerations. In addition, the specific layout and orientation have been selected to support passive heating
and cooling strategies and solar energy generation, which are key considerations.
The Los Azules camp and mine will be forming a
microgrid in a remote location, although Los Azules in closer to basic infrastructure than most other mines in the region. Even though
the camp will be connected to offsite energy production, it is being sized for net-positive energy production, making it a candidate for
International Living Future Institute’s (ILFI) Net Zero Energy certification (living-future.org), the world’s most rigorous
green building standards. The camp will pursue ILFI certification based on the alignment with the Living Building Certification “Water
Petal”.
The camp will also be designed to provide space
for growing food in a self-sustaining environment. Finally, the camp will provide waste management systems to provide reuse of waste materials,
either through direct reusing, recycling, composting, and eliminating single-use plastics and packaging.
Minimizing the Carbon Footprint from Mine
to Market
Copper mining emits an average 2.3-2.5 tonnes
of carbon dioxide equivalent per tonne of copper metal produced (t CO2-e/t Cu), while smelting adds another 1.65 tonnes (Source: “Metals
recycling to be a key plank for cutting emissions” by Pratima Desai, Reuters, July 14, 2021). By employing modern, low emission
technologies, the Los Azules Project intends to improve upon the standards set forth by “The Copper Mark” and set a new standard
for CO2 emissions per unit of copper produced.
The Greenhouse Gas (“GHG”) Protocol
Corporate Standard classifies a company’s GHG emissions into three ‘scopes’. Scope 1 emissions are direct emissions
from owned or controlled sources. Scope 2 emissions are indirect emissions from the generation of purchased energy. Scope 3 emissions
are all indirect emissions (not included in scope 2) that occur in the value chain of the reporting company, including both upstream and
downstream emissions.
| Project Los Azules – S-K 1300 Technical Report Summary | Project No.: 21139-03 | 1-7 |
Figure 1.2 Estimated Carbon Intensity versus Copper
Equivalent Production Centiles 2022-2040 for mine site emission chart presents the relative estimated emissions for copper assets on an
equivalent copper basis as obtained from the Emissions Benchmarking Tool – (Metals)™, a product of Wood Mackenzie Limited
(“WoodMac”). The WoodMac database includes 394 individual global mining assets and covers Scope 1 and 2 emissions determined
using the published methodology on their website. The highlighted assets represent comparable major Argentinian projects as included in
the WoodMac modeled information. The Los Azules Project metrics in the WoodMac data (red line highlighted) reflects the estimated emissions
for the prior project concept. The WoodMac average Scope 1 and Scope 2 emissions intensity for all 394 included assets the period between
2022 and 2040 is 1,980 kg CO2-e/t Cu Eq. (kilograms of Carbon Dioxide Equivalent per tonne of Copper Equivalent produced). Carbon Dioxide
Equivalent means having the same global warming potential as any another greenhouse gas. For the 57 copper SX/EW assets included, the
average Scope 1 and Scope 2 emissions intensity for the period between 2022 and 2040 is 1,723 kg CO2-e/t Cu Eq.
Based on the current project concepts considered
for implementation at Los Azules, notably:
| · | Electrical energy sourced from 100% renewables (YPF Luz basis), |
| · | Incorporation of site and mine electrification concepts (trolley assist for mine haulage, battery electric
vehicles where possible), |
| · | Regenerative design concepts for support infrastructure, and |
| · | Hydrometallurgical extraction processes to produce copper cathodes. |
The carbon intensity per unit of copper equivalent
production (Cu Eq) was estimated by Whittle Consulting Pty Ltd (“WCPL”) using the GHG Protocol Corporate Accounting and Reporting
Revised Standard principles (published by the World Resources Institute (WRI), a U.S.-based environmental NGO, and the World Business
Council for Sustainable Development (WBCSD), a Geneva-based coalition of 170 international companies) which provides requirements and
guidance for companies and other organizations preparing a corporate-level GHG emissions inventory).
WCPL’s estimations based on the preliminary
information developed, the predicted carbon intensity for the Los Azules initial Base Case project is estimated to be to be 670 kg CO2e/tCu
Eq for Scope 1 & 2 emissions. The estimated Scope 1-3 emissions for the Base Cases is approximately 902 kg CO2e/tCu Eq,
assuming transport of copper cathodes to port facilities in either Chile or Argentina.
Figure 1.2 also shows the relative position of
the Los Azules base case developed in 2023 and the prior Los Azules 2017 Project concept against the WoodMac average Scope 1 & 2 emissions
intensity for all 394 included assets. Of significant importance is the improvement in the project compared to the prior concept and the
project position in the lower 10% range of projects globally. Full electrification could drive emissions even more towards the lowest
in the industry.
Continued implementation of newer and less impactful
technologies, fully electric mine and equipment, EV use for materials and supplies transport to site, and broader employment of regeneration
applications throughout the mine site to further off-set carbon emissions is expected to deliver on McEwen Copper’s commitment to
achieve net-zero carbon emissions from the Los Azules Project by 2038, well ahead of its peers.
| Project Los Azules – S-K 1300 Technical Report Summary | Project No.: 21139-03 | 1-8 |
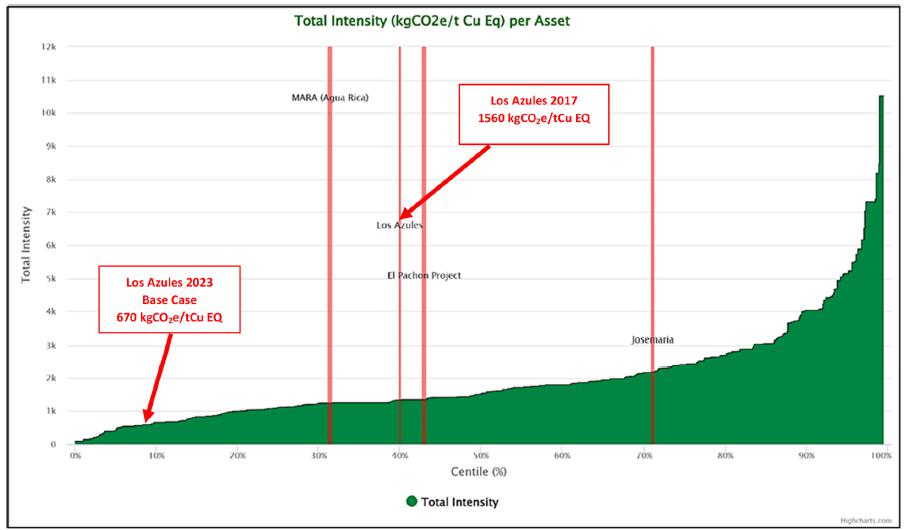
Figure 1.2: Estimated Carbon Intensity vs
Copper Equivalent Production Centiles 2022-2040 (Scope 1 & 2 Emissions) - Wood Mackenzie 2022
NOTE: “The data and information provided
by Wood Mackenzie should not be interpreted as advice and you should not rely on it for any purpose. You may not copy or use this data
and information except as expressly permitted by Wood Mackenzie in writing. To the fullest extent permitted by law, Wood Mackenzie accepts
no responsibility for your use of this data and information except as specified in a written agreement you have entered with Wood Mackenzie
for the provision of such data and information.”
This subsection was prepared by J. Sorensen, FAusIMM,
Samuel Engineering (Source Q1 2023 public filings).
McEwen Mining was organized under the laws of
the State of Colorado on July 24, 1979, and is listed on the New York Stock Exchange (NYSE) and on the Toronto Stock Exchange (TSX) under
the symbol MUX. The Company’s head office is in Toronto, Canada. As of May 2023, the Company owns a 51.9% interest in the Los Azules
copper deposit in San Juan, Argentina through its subsidiary, McEwen Copper Inc. (“McEwen Copper”) which owns a 100% interest
in the Los Azules Copper Project in San Juan, Argentina, and the Elder Creek Exploration Project in Nevada, USA.
McEwen Copper has 28,885,000 common shares outstanding,
and its shareholders are: McEwen Mining Inc. 51.9%, FCA Argentina S.A. (Stellantis) 14.2%, Nuton LLC (Rio Tinto) 14.2%, Robert R. McEwen
13.8%, Victor Smorgon Group 3.5%, and other shareholders 2.4%.
| Project Los Azules – S-K 1300 Technical Report Summary | Project No.: 21139-03 | 1-9 |
The Los Azules Project is a porphyry copper development
project located in the Andes Cordilleran region of San Juan Province, Argentina along the border with Chile. The Project falls within
the Calingasta Department of the San Juan Province. The Project is approximately 80 km west-northwest of the town of Calingasta, in the
San Juan Province of Argentina at approximately 31° 06’ 25” south latitude and 70° 13’ 25” west longitude.
The mine development is located approximately 6 km east of the border with Chile (Figure 1.3). Calingasta is located 173 km by road west
of the city of San Juan along Route 12.
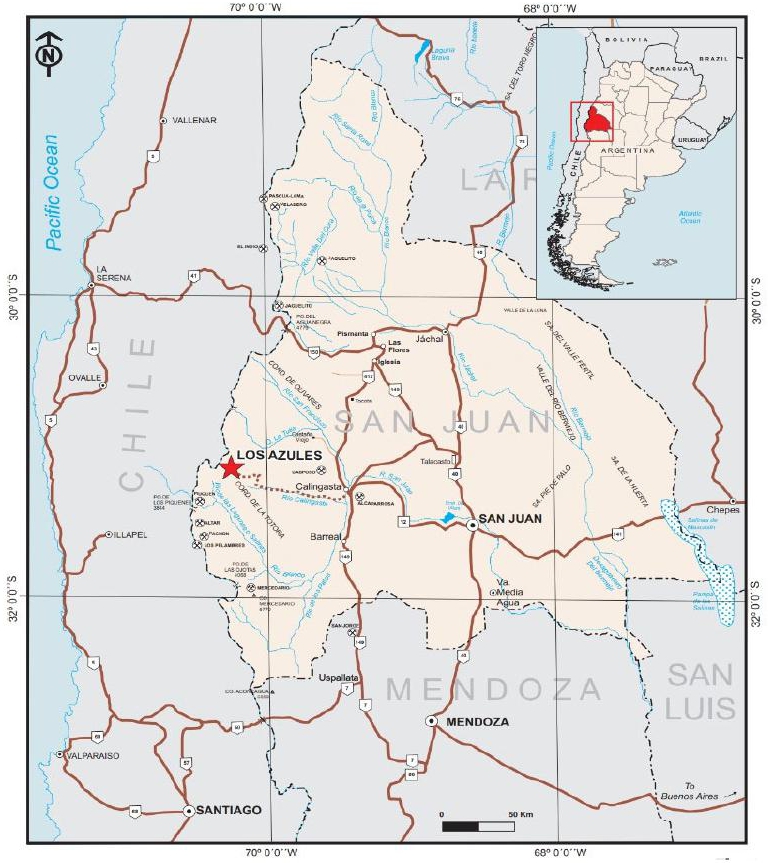
Figure 1.3: Location of Los Azules in the
High Andes (Hatch, 2017)
| Project Los Azules – S-K 1300 Technical Report Summary | Project No.: 21139-03 | 1-10 |
The terrain elevation at the project site ranges
between 3,200 meters above sea level (masl) at the proposed camp location and up to 4,500 masl on the high peaks in proximity to the Project.
The proposed pit and facilities are located between 3,200 and 3,600 masl. The Project area is remote, and no infrastructure is present.
There are no nearby towns, Indigenous residents, or settlements. Seasonal exploration work typically commences in October or November
and terminates in April or May. Exploration operations are supported by means of two temporary camps within the Project site area.
The facilities and site arrangements contemplated
for the Los Azules Project are shown in Figure 1.4. Facilities are located to stay within the surface and mining rights currently held
by McEwen Copper.
| Project Los Azules – S-K 1300 Technical Report Summary | Project No.: 21139-03 | 1-11 |
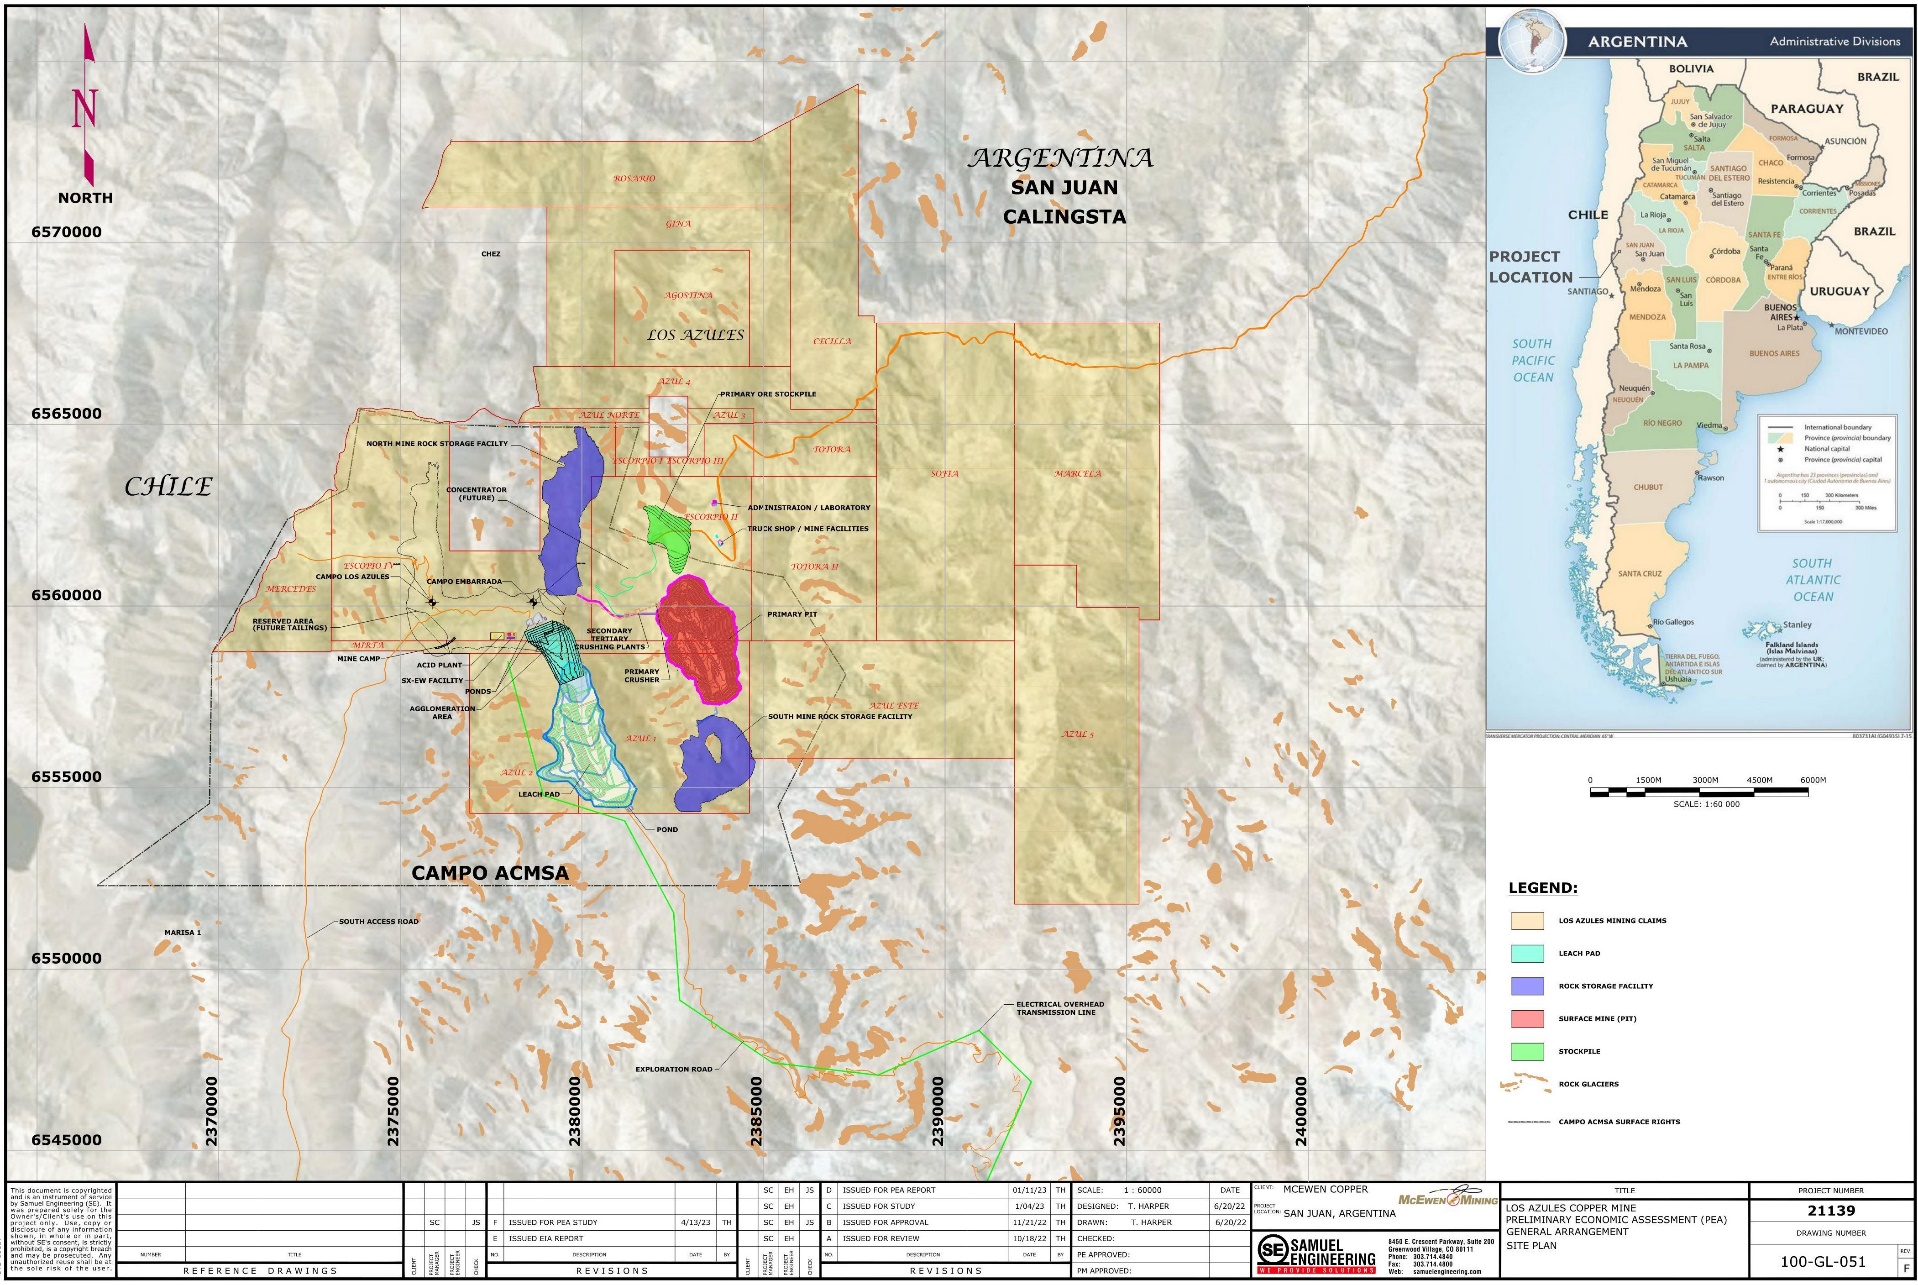
Figure 1.4: Overall Site Plan (Samuel, 2023)
| Project Los Azules – S-K 1300 Technical Report Summary | Project No.: 21139-01 | 1-12 |
There are no covered or uncovered “white
glaciers” (classic ice glaciers) in the Project, although there are several small rock glaciers (or cryogenic geoforms) near the
Project area that are not impacted by exploration or the proposed future development activities.
A preliminary seismic risk assessment of the Los
Azules site was completed in April 2019. The area where the Los Azules Project is located corresponds to Seismic Zone 4, considered very
high. The highest seismic event recorded near the Project was magnitude 7.5 in 1977 affecting the entire province of San Juan.
Drill core storage and processing facilities are
in the town of Calingasta. These facilities will be upgraded during the next phases of work to increase the storage capacity and provide
accommodation and staging of workers traveling to/from the project site.
The nearest mining projects to the Los Azules
Project site are the Altar copper-gold project site owned by Aldebaran Resources Inc. located approximately 40 km south and the El Pachon
copper-gold project site owned by Glencore plc located approximately 90 km south of Los Azules. To the north, the distance to Filo del
Sol owned by Filo Corp. and Josemaria owned by Lundin Mining is approximately 300 km.
The information in this section relies upon a
legal review and opinion report Re: “Incorporation and good standing status of Andes Corporación Minera S.A. (ACMSA) and
of its mining rights” dated January 11th, 2023, by Abogado (lawyer) Jose Vargas Gei of Vargas & Galindez (V&G), a Mendoza
based legal firm.
The Los Azules Project is comprised of properties
(the “Properties”) owned by Andes Corporación Minera S.A. (ACSMA), an Argentine subsidiary of McEwen Mining through
its ownership in McEwen Copper. ACMSA is duly registered before the Dirección de Personas Jurídicas of the province of Mendoza,
by Resolution #2025 dated November 2nd, 2005.
There are two types of tenure under Argentine
mining regulations: Cateos (Exploration Permits) and Minas (Mining Permits). Exploration Permits are licenses which allow the property
holder to explore the property for a period following a grant that is proportional to the size of the property. Mining Permits are licenses
which allow the holder to exploit the property subject to regulatory environmental approval. To convert an exploration permit (Cateo)
to a mining concession (Mina), some or all the area of a cateo must be declared as MD (Manfestación de Descubrimiento) and then
converted to a Mina. Minas are mining concessions which permit mining on a commercial basis.
McEwen Copper controls approximately 31,746 ha
of mining rights (Minas) around the Los Azules deposit. In addition, McEwen Copper owns sufficient surface rights for the Project pursuant
to an agreement with CCM S.A., on March 3rd, 2010, whereby ACMSA acquired the surface rights set out in Figure 1.5 (18,000 hectares in
green outline).
The international border with Chile forms the
limits of the owned property on the west side (shown as a black dashed line Figure 1.5). The surface rights limits of the property are
represented by the green line in Figure 1.5. Based on the V&G review and opinion, ACMSA has good and valid, legal, and beneficial
title to the mining rights shown in Figure 1.5.
| Project Los Azules – S-K 1300 Technical Report Summary | Project No.: 21139-01 | 1-13 |
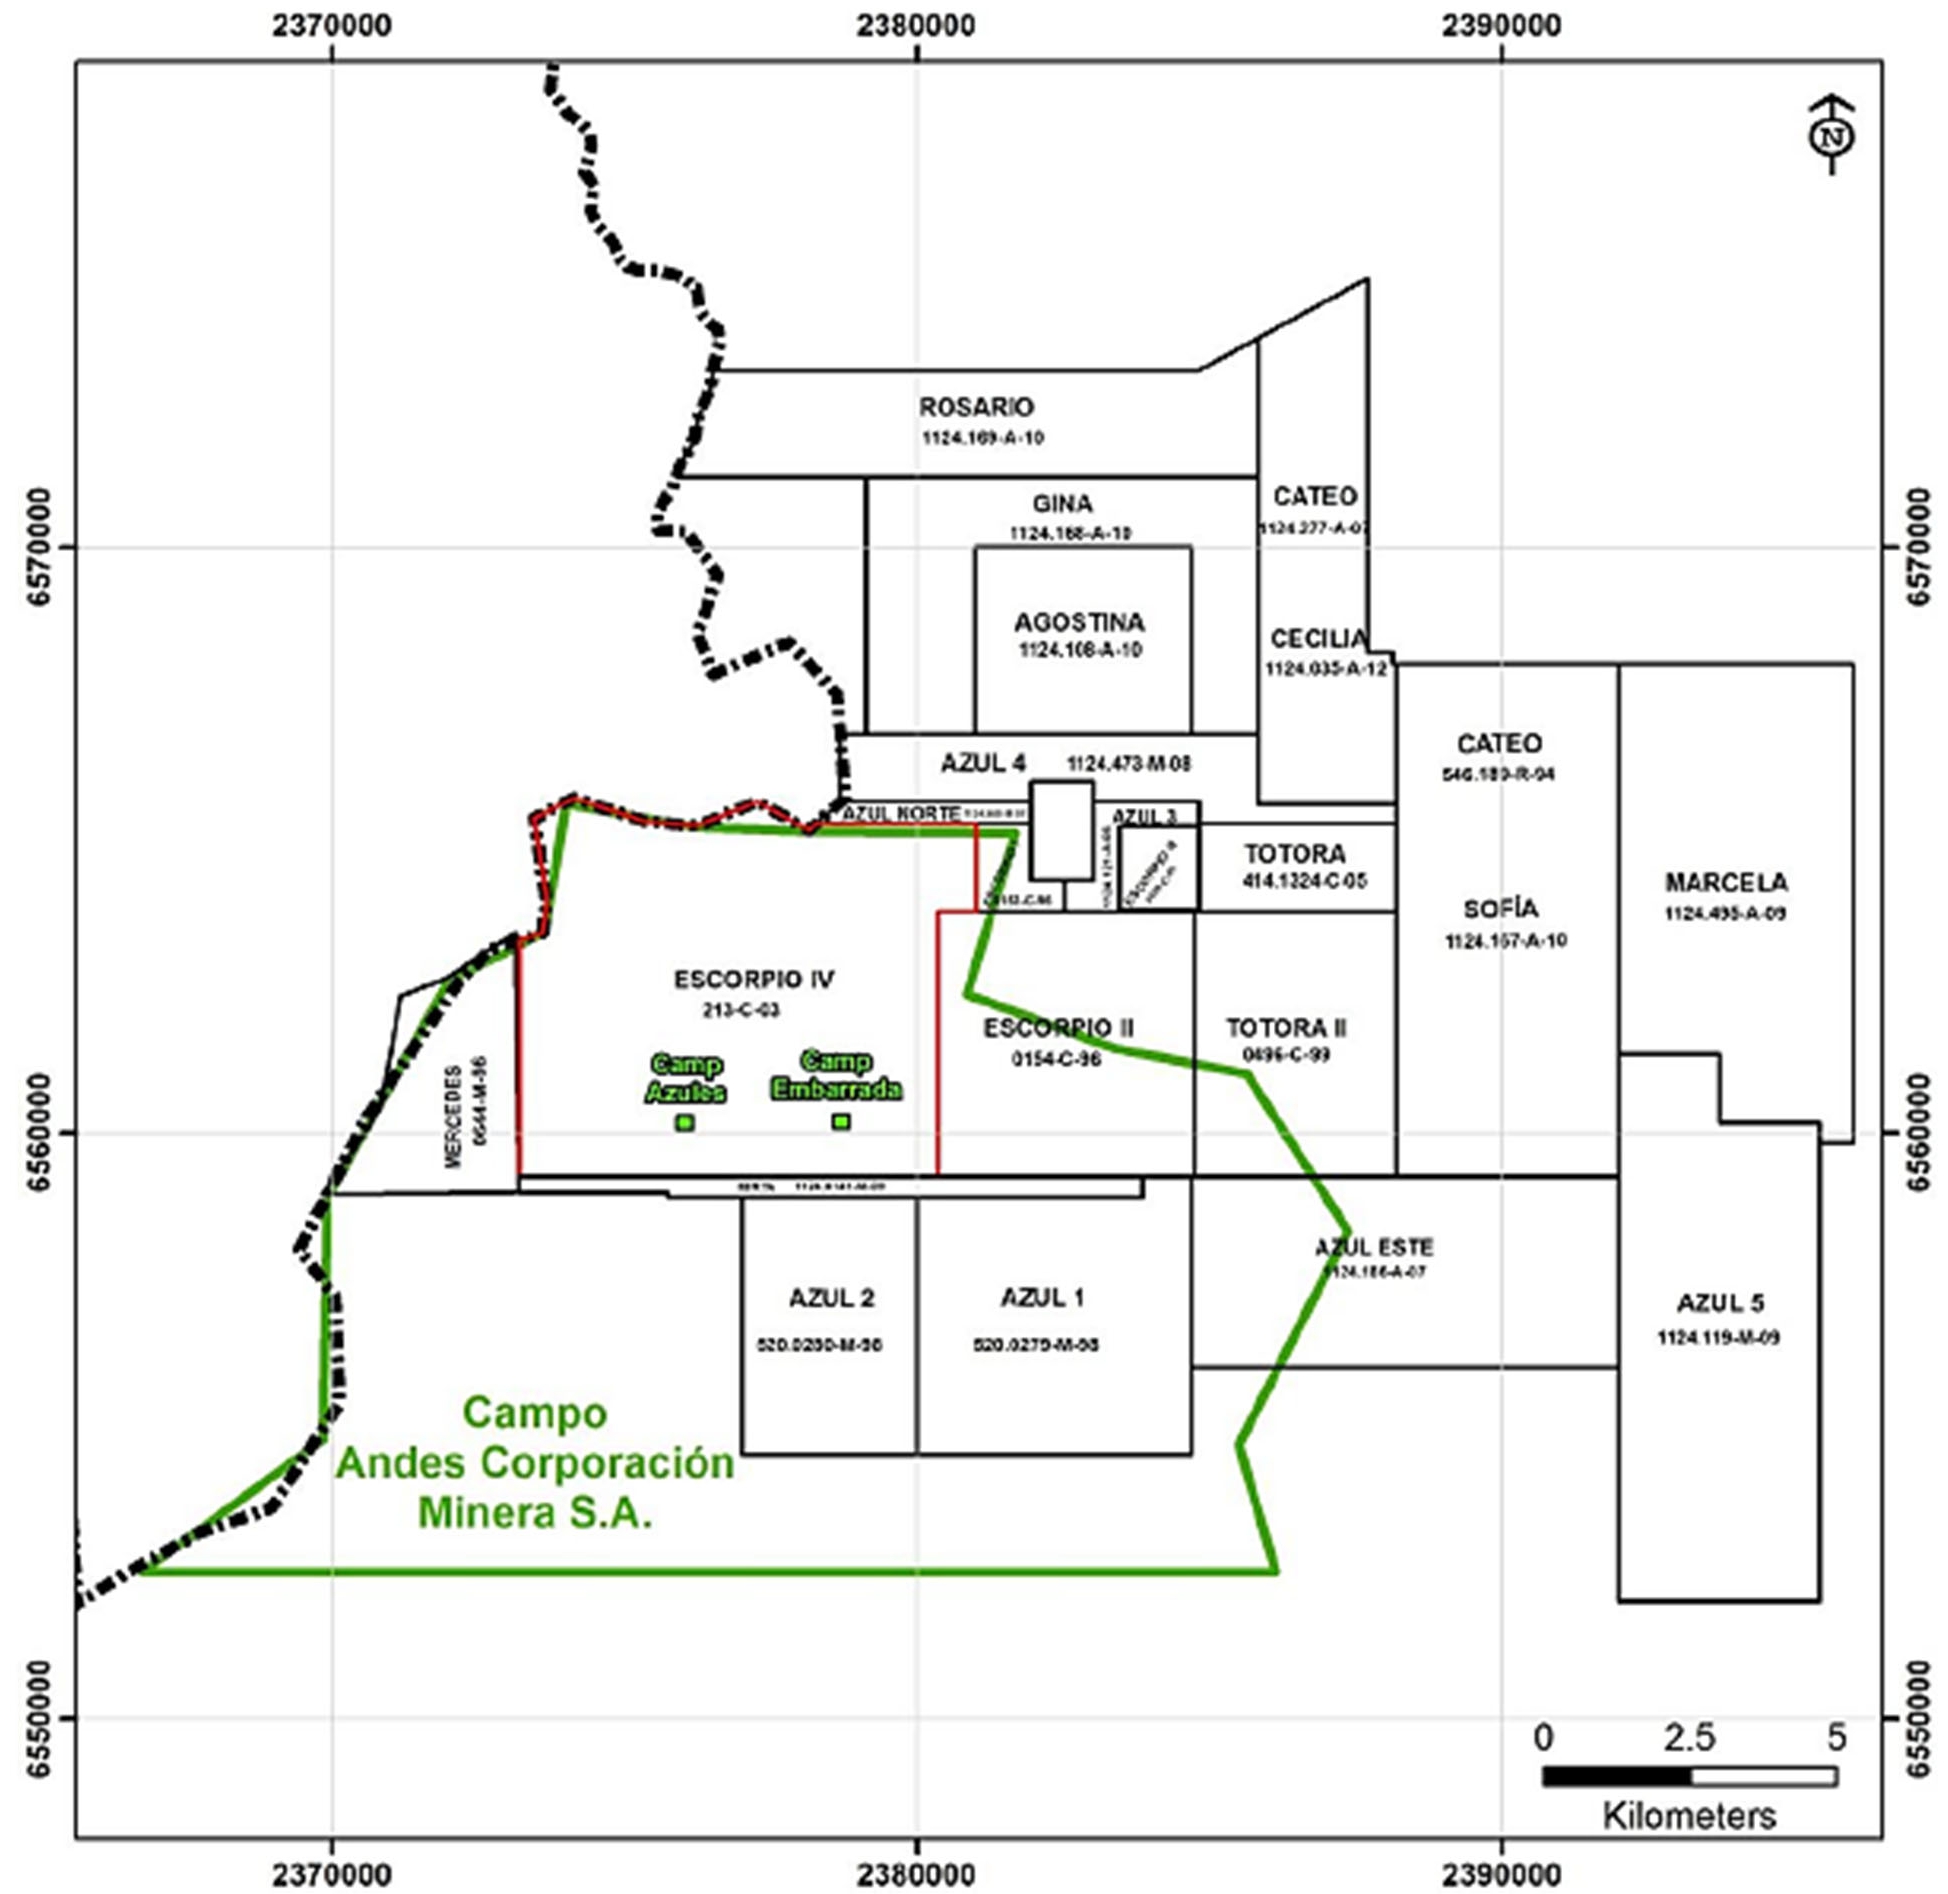
Figure 1.5: Los Azules Project Property Limits
(V&G Report, 2023)
| Project Los Azules – S-K 1300 Technical Report Summary | Project No.: 21139-01 | 1-14 |
| 1.4 | EXPLORATION & DRILLING |
Exploration at Los Azules commenced in the mid-1990’s
and has included various studies of geology, geophysics, and geochemistry, as well as drilling with both reverse circulation and diamond
core drills, sampling and analysis of surface and drill core samples, and road construction. Drilling programs have been undertaken at
Los Azules between 1998 and 2023 by three different mineral exploration companies including BMG, MIM Argentina (now Glencore) and Minera
Andes/McEwen Mining and McEwen Copper. Drilling included reverse circulation programs mostly for gold exploration and diamond drilling
focusing on supergene and hypogene porphyry-style copper mineralization. Descriptions of these programs are detailed in the following
sections. Table 1.2 provides a summary of the drilling information.
| Table 1.2: Exploration Drilling by Year and by Company |
| Year |
Company |
No. of holes |
Meters |
| 1998 –1999 |
Battle Mountain Gold |
24 |
5,681 |
| 2004 |
Glencore Xstrata (MIM) |
4 |
864 |
| 2003 – 2011 |
Minera Andes |
127 |
34,270 |
| 2011 – 2023 |
McEwen Mining |
284 |
75,849 |
| Total |
|
439(1) |
116,664 |
| 1. | This table includes all drilling that has occurred on the property. Some holes were redrilled due to drilling difficulties and are
not included in the database. Holes that were started in one season and completed the following season are counted in the year they were
started, but the meters drilled in each season are shown for the respective seasons. The drilling reflects all holes to the effective
date of May 9th, 2023. |
| 1.5 | mineral resource estimates |
The mineral resources have been classified according
to guidelines and logic summarized within disclosure requirements and policies for mining properties with current industry and global
regulatory practices and standards, as embodied by the Committee for Reserves International Reporting Standards (“CRIRSCO”)
referred to in S-K 1300. Resources were classified as Indicated or Inferred by considering geology, sampling, and grade estimation aspects
of the model.
The extent of mineralization along the strike
exceeds 4 km and the distance across strike is approximately 2.2 km. The deposit is open at depth. Over the approximately 2.5 km strike
length where mineralization is strongest, the average drill spacing is approximately 150 meters to 200 meters but there are localized
areas where drilling is on 100-meter spacing. The assay database considers 162 drillholes and 56,528 meters of assay interval data. Resource
estimation work was performed using Datamine Studio modeling software.
As of the date of publication, 47 holes and approximately
18,318 meters of drilling (mostly infill) have been completed but were not included in the database for resource estimation, data for
which was cut off on date December 31st, 2022.
The Indicated and Inferred resources for the enriched
and primary zones are presented in Table 1.3. Mineral resources are determined using an NSR cut-off value to cover the processing cost
for each recovery methodology. For supergene and primary material going to the leach pile, the cutoff was $2.74/t. For supergene going
to the mill, the cutoff was $5.46/t and primary material going to the mill was $5.43/t. The resource is further constrained by a pit shell
that demonstrates the reasonable prospects of eventual economic extraction (RPEEE) of this material.
| Project Los Azules – S-K 1300 Technical Report Summary | Project No.: 21139-01 | 1-15 |
Generalized technical and economic parameters
include a long-term copper price of $4.00/lb, and a variable resource pit slope between 20° and 42°, depending on depth. Other
parameters used in the resource pit development are detailed in Section 11.13.
Resources are reported in two categories related
to processing amenability: 1) materials that are suited for processing in a commercially proven conventional, ambient conditions, copper
bio-leaching scheme (Leach); and 2) materials that are better suited to processing either in a more advanced bio-leaching scheme such
as NutonTM technology or traditional milling/concentrator approach (Leach+ or Mill).
| Table 1.3: Mineral Resource Summary |
| |
|
|
Million
tonnes (M tonnes) |
Average Grade |
Contained Metal |
|
Cu% -
tot. |
Cu% -
sol. |
Au
(g/t) |
Ag
(g/t) |
Cu
(Blbs.) |
Au
(Moz.) |
Ag
(Moz.) |
| Indicated |
Supergene |
Leach |
944.2 |
0.46 |
0.30 |
- |
- |
9.54 |
- |
- |
| Mill or Leach+ |
73.0 |
0.13 |
- |
0.09 |
1.10 |
0.21 |
0.20 |
2.58 |
| Primary |
Mill or Leach+ |
218.1 |
0.25 |
- |
0.036 |
1.06 |
1.19 |
0.25 |
7.43 |
| Total |
Mill or Leach+ |
291.1 |
0.22 |
- |
0.049 |
1.07 |
1.40 |
0.46 |
10.01 |
| Total Indicated |
|
Leach, Mill or Leach+ |
1,235.3 |
0.40 |
|
|
|
10.94 |
0.46 |
10.01 |
| Inferred |
Supergene |
Leach |
695.7 |
0.32 |
0.19 |
- |
- |
4.91 |
- |
- |
| Mill or Leach+ |
525.6 |
0.30 |
- |
0.05 |
1.44 |
3.45 |
0.87 |
24.40 |
| Primary |
Mill or Leach+ |
3,288.0 |
0.25 |
- |
0.03 |
1.18 |
18.35 |
3.37 |
124.67 |
| Total |
Mill or Leach+ |
3,813.6 |
0.26 |
- |
0.035 |
1.22 |
21.79 |
4.24 |
149.07 |
| Total Inferred |
|
Leach, Mill or Leach+ |
4,509.3 |
0.31 |
|
|
|
26.70 |
4.24 |
149.07 |
Note: Mineral Resources do have demonstrated economic
viability. No values are presented where the process recovery method does not consider this aspect of the materials.
The Los Azules Deposit grades, geometry, and depth
make it suitable for conventional, large-scale truck-shovel open pit mining methods. This includes the use of equipment such as blasthole
drills, diesel hydraulic excavators, electric shovels, large off-highway haul trucks, and associated operations support equipment.
One copper cathode production rate case was assessed
during the mine engineering and planning process. This 175k tpa Cu cathode production scenario is the ‘base case’.
The ultimate pit shell limit and intermediate
pit shells (or phases) were developed with the use of Geovia Whittle™ pit optimization software. Using Net Smelter Return (NSR),
surface restrictions / constraints, pit slope geotechnical parameters, mining parameters, and production rates resulted in a series of
economic pit optimizations that were evaluated to define pushbacks and the ultimate pit. The Los Azules Deposit also contains mineralized
material that may be economic for producing a milled copper concentrate product, but this material was not considered for base case pit
optimization or mine schedule.
| Project Los Azules – S-K 1300 Technical Report Summary | Project No.: 21139-01 | 1-16 |
Open pit mining would take place in phases from
an initial starter pit, allowing for a shorter pre-strip and earlier access to mineralized material for leaching. For the 175k tpa Cu
cathode production base case, the material mined over the two-year pre-production period is 115M tonnes of which 17.4M tonnes is mineralized
material that is either stockpiled or crushed and placed on the heap leach pad. There is a ramp-up in annual production to year 5, when
peak annual material movement is reached at 130M tonnes. Material movement tonnage stays at approximately 130M tonnes through to year
11 and declines to 50M tonnes in year 17.
Approximately 58.6M tonnes of lower grade mineralized
material is stockpiled during these periods of which 41.8M tonnes are reclaimed and placed into the crusher feed in years 15-17. The remaining
16.8M tonnes are predominantly primary copper mineralization and will be processed in the Phase 2 project.
| 1.7 | Metallurgical Testwork and Recovery Methods |
Copper mineralization is complex and varied at
Los Azules, consisting primarily of chalcocite, chalcopyrite, bornite and covellite with little oxide mineralization, typically chalcocite
dominant with some covellite in the supergene materials and chalcopyrite dominant with some bornite in the primary materials. Metallurgical
characterization testing has been completed as part of this study in the form of sequential assay (sulfuric acid and cyanide steps) for
the resources considered, column testing and bottle roll testing. The sequential assay method used at Los Azules for both the resource
assay and metallurgical programs provides an indication of the copper mineralization present in the form of acid soluble copper (CuAS)
and cyanide soluble copper (CuCN), both assays combined provide an approximation for leachable/soluble copper (CuSOL) component of the
total copper assay (CuT).
Historical testing for McEwen Copper was conducted
on samples from the resource in several phases. C. H. Plenge Laboratory (Plenge) in Lima, Peru, performed several scoping level investigations
from 2008 to 2012. A mineral liberation analysis (MLA) was completed at Thompson Creek Metals Company in Challis, Idaho; in 2012 on rougher
flotation samples from the Plenge lock-cycle testing. Additional samples from the resource were tested at the SGS Research Limited (SGS)
to support a Preliminary Economic Assessment (PEA) by Hatch in 2017.
The current metallurgical program consists of
three concurrent phases of work, aimed at supporting a feasibility study level of investigation in future. In the current Phase 1 program
work, existing drill core was selected for testing by lithology and material type to reflect economically processable material in the
resource for this study. Phases 2 and 3 will utilize new metallurgical core obtained from the ongoing drilling program to investigate
the potential metallurgical variability of the deposit and focus on the initial 3-5 years of material to be mined.
As of the effective date of this report, the initial
columns for the current Phase 1 program are still on-going pending final analyses. As such, results are considered preliminary until tail
assays can be obtained to provide a calculated head assay and related recovery.
Heap leach copper extraction is derived by two
(2) different methods, one for leachable/soluble copper (CuSOL) and residual copper (CuRES) as derived from sequential copper assay methodology.
The projected extraction for CuSOL is 100% for leachable/soluble recovery and 15% for CuRES. Residual copper assay is the difference between
total assayed copper (CuT) and CuSOL. For the 19mm column tests in the current program, the total copper extraction ranged from 86% to
72% in 180 days and averaged 80% overall.
| Project Los Azules – S-K 1300 Technical Report Summary | Project No.: 21139-01 | 1-17 |
Copper recovered to cathodes considers a heap
efficiency and inventory factor of 90% of the long-term extractable copper extended over a two-year leach cycle period based on general
experience. Soluble copper recovery exceeding 100% implies partial leaching of material which was not categorized as “soluble”
based on the sequential assaying method and data available. Based on the resource assay data and column results, the apparent soluble
copper (CuSOL) recovery to cathodes is approximately 107%, with total copper (CuT) recovery at 73%.
Based on current bottle roll results and the current
column consumption, an average gross acid consumption is 18 kg/t of material. Net acid consumption is a function of recoverable copper
with acid produced as a result of the electrowinning process and calculated in the process cost model annually.
The Phase 1 project Base Case option considers
a processing facility to nominally produce 175,000 tonnes per annum (tpa) of copper cathodes from higher grade, highly leachable (soluble)
copper content materials. An expansion of the mining rates and materials handling facilities is required by Year 4 to and again in Year
7 to maintain copper production as the copper grade drops. An additional solvent extraction train will be required in Year 8. This initial
processing facility will function through to the completion of mining for the initial project phase in Year 15 with lower grade stockpile
reprocessing and residual leaching operations to Year 18.
All Primary copper mineralized material mined
during the initial project phases will be stockpiled for future processing routes that may include a mill/concentrator or alternative
bio-leaching technologies.
| Project Los Azules – S-K 1300 Technical Report Summary | Project No.: 21139-01 | 1-18 |
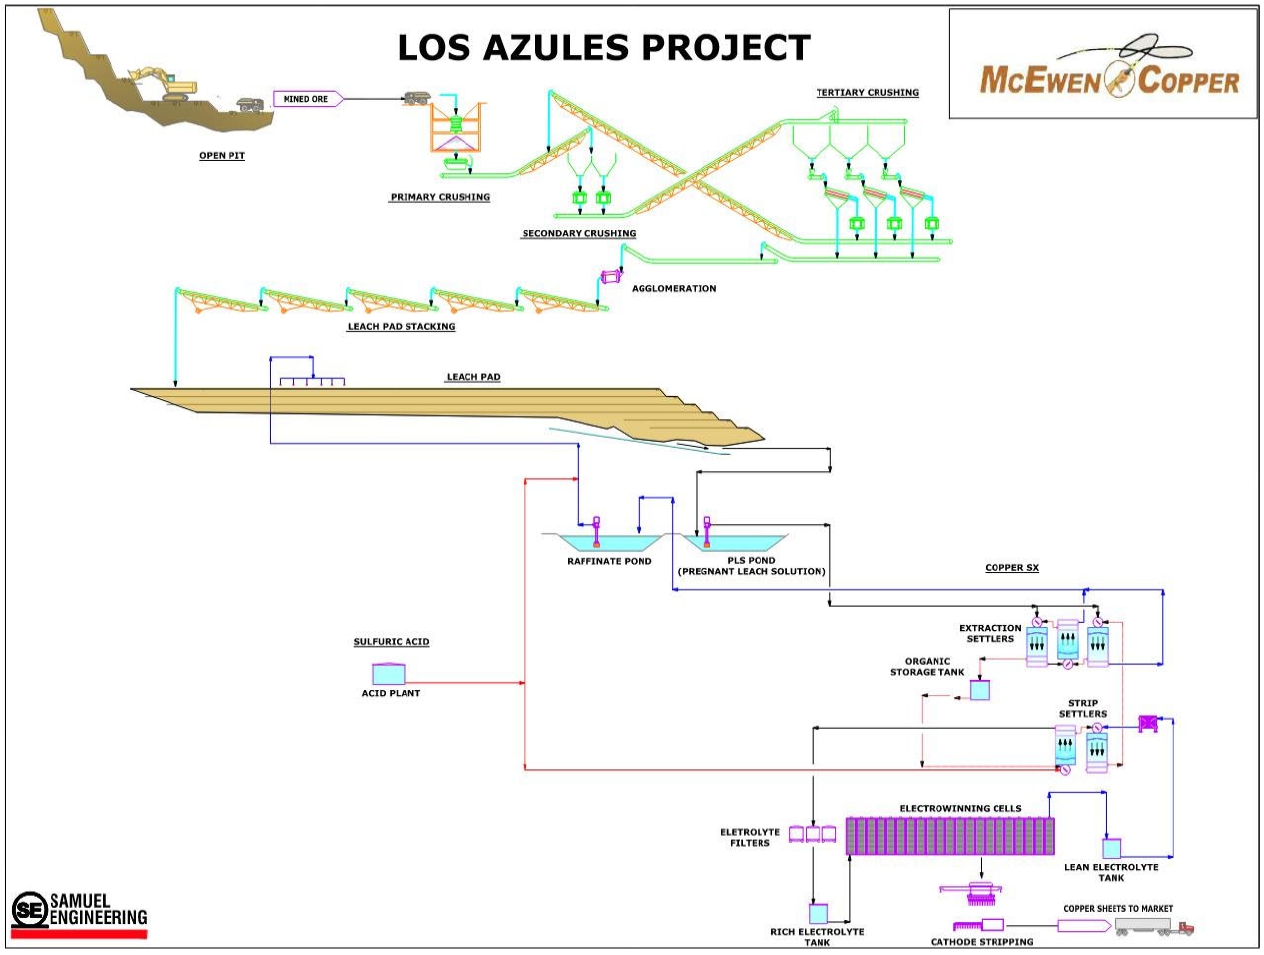
Figure 1.6: Simplified Process Flowsheet (Samuel,
2023)
| Project Los Azules – S-K 1300 Technical Report Summary | Project No.: 21139-01 | 1-19 |
The project initial capital costs are based on
budgetary cost quotations and regional contractor estimates for major equipment and facilities obtained in Q4 2022 and Q1 2023. The capital
costs for the project are summarized below and should be viewed with an expected level of accuracy for a preliminary analysis at +40%/-20%
consistent with AACE International Recommended Practice No. 47R-11 for an Estimate Class 5. Owner’s Costs include the initial mine
fleet, preproduction stripping costs and preoperational costs for early crushing and material placement on the leach pad.
| Table 1.4: Initial Capital Costs by Case |
|
Capital Cost
Level 1 Summary |
Base Case
175k tpa Cu |
| WBS Area |
Total (USD) |
| 100 - Mining |
$65,600,000 |
| 200 - Ore Storage & Handling |
$234,500,000 |
| 400 - Heap Leaching |
$158,500,000 |
| 500 – SX/EW Facilities |
$250,400,000 |
| 600 - Acid Plant |
$94,900,000 |
| 800 - Ancillary Facilities |
$23,300,000 |
| 900 - Site Development & Yard Utilities |
$126,700,000 |
| 2000 – Off-Sites |
$167,400,000 |
| Total Direct Costs |
$1,121,300,000 |
| Common Indirect Costs |
$379,300,000 |
| Owners Costs |
$454,000,000 |
| Subtotal |
$1,954,600,000 |
| Contingency |
$493,700,000 |
| Total Capital Cost |
$2,448,300,000 |
The project life of mine direct operating costs
per tonne processed and per pound of copper produced are summarized below. Costs vary with open pit development, feed head grades, acid
requirements in leaching, power consumption increases over time and actual copper production.
| Table 1.5: Life of Mine Operating Cost Summary |
| OPEX SUMMARY |
Life of Mine |
Units |
Base Case
175k tpa Cu |
| Mining OPEX |
Per Lb Cu |
$/lb Cu |
$0.47 |
| Per tonne processed |
$/t |
$4.13 |
| Processing OPEX |
Per Lb Cu |
$/lb Cu |
$0.32 |
| Per tonne processed |
$/t |
$2.84 |
| G&A |
Per Lb Cu |
$/lb Cu |
$0.12 |
| Per tonne processed |
$/t |
$1.02 |
| Selling Costs |
Per Lb Cu |
$/lb Cu |
$0.02 |
| Per tonne processed |
$/t |
$0.17 |
| TOTAL OPEX (C1 Costs)* |
Per Lb Cu |
$/lb Cu |
$0.93 |
| Per tonne processed |
$/t |
$8.16 |
*Note: Numbers may not add exactly
due to rounding
| Project Los Azules – S-K 1300 Technical Report Summary | Project No.: 21139-01 | 1-20 |
Based on consensus estimates and independent analysis,
long-term metal pricing used in this report (except for mineral resource estimation) and project economic analysis are Copper (Cu) - $3.75/pound;
Gold (Au) - $1,700/ounce; and Silver (Ag) - $20.00/ounce. The 2023 updated financial outcomes for the Phase 1 initial project mine and
facilities are shown in Table 1.6 below (expressed in Q1 2023 United States Dollars). C1 cash costs are defined as the cash cost incurred
at each processing stage, from mining through to recoverable copper delivered to the market, net of any by-product credits. C1 cash
costs per pound of copper produced and all-in sustaining costs per pound of copper produced are non-GAAP ratios.
| Table 1.6: Project Economic Summary by Case |
| Project Metric |
Units |
Base Case
175k tpa Cu |
| Mine Life (including stockpile rehandle) |
Years |
17 |
| Processing Life |
Years |
18 |
| Tonnes Processed |
Thousand tonnes |
702.3 |
| Tonnes Waste Mined |
Thousand tonnes |
906.8 |
| Strip Ratio |
|
1.29 |
| Total Copper Grade |
% Cu |
0.518% |
| Soluble Copper Grade (CuSOL) |
% CuSOL |
0.362% |
| Copper Recovery (Total Copper) |
% |
72.8% |
| Soluble Copper Recovery1 |
% |
107% |
| Copper Production (LOM avg.)2 |
tonnes/yr |
159,800 |
| Copper Production (Yr 1-5) |
tonnes/yr |
185,500 |
| Copper Production – cathode Cu |
Thousand tonnes |
2,721 |
| Initial Capital Cost |
USD Millions |
$2,448 |
| Sustaining Capital Cost |
USD Millions |
$1,878 |
| Closure Costs |
USD Millions |
$180 |
| C1 Costs (Life of Mine) |
USD/lb Cu |
$0.93 |
| All-in Sustaining Costs (AISC) |
USD/lb Cu |
$1.54 |
| Initial Capex/tpa (LOM avg.) |
USD/tpa Cu |
$15,295 |
| LOM Capex/LOM tonnes Cu |
USD/tonne Cu |
$1,590 |
| Before Taxes |
|
|
| Net Cumulative Cashflow |
USD Millions |
$10,702 |
| Internal Rate of Return (IRR) |
% |
27.0% |
| Net Present Value (NPV) @ 8% |
USD Millions |
$3,747 |
| After Taxes |
|
|
| Net
Cumulative Cashflow |
USD Millions |
$6,940 |
| Internal Rate of Return (IRR) |
% |
21.5% |
| Net Present Value (NPV) @ 8% |
USD Millions |
$2,234 |
| Pay Back Period |
Years |
3.4 |
Notes:
| 1. | Soluble copper recovery exceeding 100% implies partial leaching of material which was not categorized
as “soluble” based on the sequential assaying method and data available. |
| 2. | Life of Mine production averages include low grade stockpile rehandling and leaching production at the
end of mining material from the open pit for each case. |
| Project Los Azules – S-K 1300 Technical Report Summary | Project No.: 21139-01 | 1-21 |
A summary of the 8 Year and LOM Cash Cost can
be seen in Table 1.7.
| Table 1.7: Average First 8 Years and LOM Cash Costs* |
| Category |
UoM |
175k tpa Cu Production Case |
| First 8 years |
LOM |
| Gross Revenue |
US$/lb Cu |
3.75 |
3.75 |
| Selling Expenses |
US$/lb Cu |
(0.02) |
(0.02) |
| Mining Cost |
US$/lb Cu |
(0.44) |
(0.47) |
| Processing Cost |
US$/lb Cu |
(0.24) |
(0.32) |
| Local G&A |
US$/lb Cu |
(0.10) |
(0.12) |
| C1 Costs |
US$/lb Cu |
(0.80) |
(0.93) |
| Unrecovered VAT |
US$/lb Cu |
(0.03) |
(0.01) |
| Royalty |
US$/lb Cu |
(0.27) |
(0.29) |
| C3 Costs |
US$/lb Cu |
(1.11) |
(1.23) |
| Sustaining Capex |
US$/lb Cu |
(0.49) |
(0.31) |
| All-in Sustaining Costs |
US$/lb Cu |
(1.60) |
(1.54) |
| AISC Margin |
% |
57% |
59% |
*Note: Numbers may not add exactly
in every case due to rounding
| 1.9 | key project risks & opportunities |
This subsection was prepared by J. L. Sorensen,
FAusIMM, QP, Samuel Engineering and reviewed by the respective QP for each area.
This report is a Technical Report Summary (TRS)
that summarizes the findings of the Initial Assessment completed for the Los Azules Project in accordance with Securities Exchange Commission
17 CFR Part 229 Standard Instructions for Filing Forms Regulation S-K subpart 1300 (S-K 1300) and is intended to meet the requirements
of S-K 1300 as considered for an Initial Assessment (IA) level of study and disclosure as defined in the regulations and supporting reference
documents. The effective date of this report is May 9, 2023, concurrent with the updated final resource estimates published herein.
Based on the results of this preliminary assessment,
contributing authors have identified important risks and opportunities related to the Los Azules Project development. Below are what is
believed to be the most significant “key” risks and opportunities. A complete list and description of the interpretations,
conclusions, and recommendations to advance the Project is provided in Sections 22 and 23.
| Project Los Azules – S-K 1300 Technical Report Summary | Project No.: 21139-01 | 1-22 |
Risks
| · | The Project is at the exploration stage of investigation; consequently, this study is at the scoping level
of accuracy, preliminary in nature, and includes only Indicated mineral resources in the conceptual mine plan and the mine production
schedule. Inferred mineral resources are considered too speculative geologically and in other technical aspects to have the economic considerations
applied to them that would enable them to be categorized as mineral reserves under the standards set forth in S-K 1300. |
| · | Significant additional investigation and work is required to improve the confidence level of the analysis
to support a project development decision. There is no certainty that the results, project development plans or estimates in this IA will
be realized. |
| · | Potential new national laws under consideration by the Federal Government concerning the disturbance of
wetlands (“vegas” in the local terminology) in Argentina is a significant risk if enacted prior to permitting completion.
The established permitting processes consider impacts and mitigations on a case-by-case basis within each Province, whereas a national
law could restrict case by case and Provincial laws and processes. |
| · | The requirement to avoid impacting localized rock glaciers poses a risk to longer term mining opportunities,
including some of those in the Phase 2 options considered in this report. Site investigations to confirm the characterization of the known
geomorphologic structures should be completed in continued field programs to appropriately evaluate them and determine if avoidance impact
constraints should apply. |
| · | Limited information is available on the geotechnical characteristics and hydrology/hydrogeologic conditions
affecting the open pit design and pit slopes, leach pad foundation design, water resources and management, and other site facilities.
These areas pose both a risk to the facilities considered in this document and areas for potential opportunity. |
| · | The preliminary nature of the metallurgical and geo-metallurgical aspects of the deposit poses a risk
to the metallurgical performance expectations considered. Significant additional work is required to improve the confidence level of the
analysis to support a project development decision. |
| · | Metal price assumptions were considered based on current market conditions at the time of the report and
pose both a risk and opportunity to future economic expectations. |
| · | While estimates in this report utilize U.S. dollars, certain expenses, such as labor, operating supplies,
and property and equipment, may be denominated in Canadian dollars or Argentine pesos. As a result, currency exchange fluctuations and
foreign exchange regulations may impact actual operating costs. The appreciation of non-U.S. dollar currencies against the U.S. dollar
increases costs and the cost of purchasing property and equipment in U.S. dollar terms in Canada and Argentina can adversely impact operating
results and cash flows from the Project. |
| · | Future changes in legal requirements and laws at the federal, provincial or municipal levels may impact
the ability to obtain all required permits in a timely manner, on reasonable terms or on terms that provide sufficient resources to develop
the Project according to the timetable and benchmarks conceptualized in this report. |
| Project Los Azules – S-K 1300 Technical Report Summary | Project No.: 21139-01 | 1-23 |
Opportunities
| · | The resource is presently limited by the drilling and associated information developed to date. Resources
with limited drilling information due to access in the areas under the vegas (localized vegetated areas) is an opportunity to increase
the near surface Indicated resource base within the current deposit. Additionally, opportunities for expansion of the resource base peripherally
and at depth are apparent from the work completed. These should be investigated during the feasibility study drilling program. |
| · | The open pit is presently constrained by the requirement to avoid impacting localized cryogenic geoforms
currently identified as rock glaciers. Site investigations to confirm the character of these geomorphologic structures should be completed
during field programs. A longer-term opportunity may exist to reclassify areas where no evidence of glacial activity is found. |
| · | Within the glacier constraints, limited information is available on the geotechnical characteristics and
hydrogeologic conditions affecting the open pit design and pit slopes. Generalized technical parameters include a variable pit slope between
30° and 42° depending on depth. Additional work to better understand these key areas represents an opportunity to reconsider the
mine design parameters, potentially reducing stripping requirements and allow access to more of the deposit resources by extending and
deepening the open pit. An initial analysis indicates that 10% to 15% additional resource is possible with a significant decrease in stripping
required as the mine extends past the current base case. |
| · | Incorporation of developing leaching technologies has the potential to improve copper recovery, reduce
leaching times and minimize acid consumption requirements. Nuton™ technology is currently being evaluated in this capacity. This
would also have the potential to unlock the primary copper resources more economically versus a mill/concentrator alternative and negate
the need for a tailing’s storage facility. |
| 1.10 | qualified persons recommendations and conclusions |
This subsection was prepared by J. L. Sorensen,
FAusIMM, QP, Samuel Engineering and reviewed by the respective QP for each area.
Based on the results of this Initial Assessment,
contributing authors recommend that McEwen Copper complete additional work to further de-risk the Project, including more advanced stages
of drilling to complete the work necessary for a Feasibility Study based on the findings reported. Key issues and items are included below.
A complete list of these tasks and, summary of the interpretations, conclusions, and recommendations to advance the Project are provided
in Sections 22 and 23.
Adequate work has been completed through the prior
studies to define the project options going forward to select an option for Feasibility Study delineation, however metallurgical, geotechnical,
geological, hydrological, and other aspects are not developed beyond a preliminary level of study at this time.
Given the resources developed to date, project
technical options considered and permitting basis to date, a Preliminary Feasibility Study (PFS) is considered an optional step and a
Feasibility Study (FS) level of project definition is recommended to expedite the project development timeline and to also comply with
the requirements of the property ownership agreements with the Provincial Mining Ministry.
| Project Los Azules – S-K 1300 Technical Report Summary | Project No.: 21139-01 | 1-24 |
As of the effective date of this report, the initial
Feasibility Study resource drilling, geotechnical, hydrogeologic and metallurgical test work programs were started and in progress. The
recommended technical program to complete the work deemed necessary to support the completion of a Feasibility Study is as follows:
| · | Complete an in-fill resource definition drilling program targeting Measured resource classification for
the initial five years of the project and areas within the initial project supergene resource to Indicated classification as considered
in this IA. The program delineated for execution includes an additional 32,000 meters of diamond drilling with the objective of converting
the resource classification for the initial 5 years of mining to predominantly Measured from the Indicated and Inferred resources defined
in this report. |
| · | Complete the site geotechnical, seismic, glacier, hydrology and hydrogeologic investigations to a feasibility
study level of definition. The program delineated included 16,000 meters of geotechnical drilling, 9,250 meters of hydrogeologic drilling,
9,700 meters of condemnation and other miscellaneous drilling, reestablishment of local surface water monitoring and field surveys. |
| · | Complete confirmatory metallurgical test work and geometallurgical definition for the initial project
process. The program delineated includes 6,000 meters of additional metallurgical PQ core (and/or equivalent HQ core) drilling and sampling
to obtain approximately 90 tonnes of material, additional column leaching metallurgical testing for both conventional and augmented bio-leaching
technologies. The metallurgical work includes site testing of the leach concepts with materials from the bulk sampling campaign. Additional
testing on primary mineralization materials for potential milling options is also considered. |
| · | Update resource/geologic models and estimations, mine plans and schedules based on the additional data
collected. |
| · | Update leach pad, processing and site/off-site infrastructure facilities designs to feasibility level
development and support ongoing permitting requirements. Finalize concepts for power supply, site access and logistics. |
| · | Confirm critical consumables availability and pricing, including sulfur and sulfuric acid, fuels and water. |
| · | Update execution plans, costs and financial estimates and assumptions based on the updated project definition. |
| · | Expand the inclusion of regenerative design considerations to further improve the carbon footprint and
social handprint features of the project. |
A Feasibility Study level of definition is estimated
to take 18-20 months to complete from the effective date of this report and assuming continuance of the work areas in progress.
Based on current information from work in progress,
the estimated cost is approximately $232 million including estimates for McEwen Copper/ACMSA costs. The study cost areas are broken out
in the below Table 1.8 for the recommended program to complete the Feasibility Study and other expenditures planned during the same timeframe
except where noted. As of the date of publication, approximately $43.4 million has already been incurred in 2023, which should be deducted
from the 2023 total shown for a forward-looking cost estimate.
| Project Los Azules – S-K 1300 Technical Report Summary | Project No.: 21139-01 | 1-25 |
| Table 1.8: Expected Costs for Feasibility Study Development |
| Cost Category (USD Millions) |
2023 |
2024 |
TOTAL |
| Drilling* |
$48.3 |
$32.8 |
$81.1 |
| McEwen Copper/ACMSA/McEwen Mining |
$21.7 |
$16.5 |
$38.2 |
| Camps/Site Services/Roads* |
$34.6 |
$13.7 |
$48.4 |
| Feasibility Study/Engineering |
$9.8 |
$13.5 |
$23.3 |
| Calingasta Development |
$1.5 |
$0.1 |
$1.6 |
| Contingency |
$2.0 |
$8.0 |
$10.0 |
| Cost |
$117.9 |
$84.7 |
$202.6 |
| Estimated VAT* |
$18.8 |
$10.9 |
$29.8 |
| Total |
$136.8 |
$95.6 |
$232.4 |
|
Note: * Items account for costs only attributable
to the Feasibility Study and do not extend through December 2024.
Numbers may not add exactly due to rounding. |
| Project Los Azules – S-K 1300 Technical Report Summary | Project No.: 21139-01 | 1-26 |
| 2.1 | 2023 technical REPORT summary (TRS) Update Overview |
This report is a Technical Report Summary (TRS)
which summarizes the findings of the Preliminary Study completed for the Los Azules Project in accordance with United States Securities
Exchange Commission (SEC) 17 CFR Part 229 Standard Instructions for Filing Forms Regulation S-K. The report complies with 17 CFR Part
§229.1300 (S-K 1300) Standard Instructions for Regulation S-K subpart 1300 SEC S-K §229. 1304 and §229.601(b)(96) and is
intended to meet the requirements of S-K 1300 as considered for an Initial Assessment (IA) level of study and disclosure as defined in
the regulations and supporting reference documents. The purpose of this TRS is to report the study results, mineral resources, and the
subject project estimated costs and economic potential. The effective date of this report is May 9, 2023, concurrent with the updated
final resource estimates published herein.
This TRS supersedes the current report on file
titled: SEC S-K 229.1304 INITIAL ASSESSMENT INDIVIDUAL DISCLOSURE FOR THE LOS AZULES PROJECT, ARGENTINA, prepared by Mining Plus US Corporation
with an effective date of April 01, 2021.
All currency shown in this report is expressed
in May 2023 United States Dollars unless otherwise noted.
The Los Azules deposit is a classic Andean-style
porphyry copper deposit. The large hydrothermal alteration system is at least 5 km long and 4 km wide and is elongated in a north-northwest
direction along a major structural corridor. The altered zone surrounds and includes the Los Azules deposit area, which is approximately
4 km long by 2.5 km wide. The limits of the mineralization along strike to the North and at depth have not been entirely constrained by
drilling. Primary or hypogene copper mineralization extends to at least 1,000 m below the present surface. Near surface, leached primary
sulfides (mainly pyrite and chalcopyrite) were redeposited below the water table in a sub-horizontal zone of supergene enrichment as secondary
chalcocite and covellite. Hypogene bornite appears at deeper levels together with chalcopyrite. Gold, silver, and molybdenum are present
in trace amounts, but copper is by far the most important economic constituent at Los Azules.
The Project is at the exploration stage of investigation;
consequently, this study is at the scoping level of accuracy, preliminary in nature, and includes Inferred mineral resources in the conceptual
mine plan and the mine production schedule. Inferred mineral resources are considered too speculative geologically to have the economic
considerations applied to them that would enable them to be categorized as mineral reserves under the standards set forth in S-K 1300.
There is no certainty that the estimates in this updated IA will be realized.
This Technical Report provides information related
to an updated resource estimation, revised processing flowsheet concepts and updated project economics since the last previously disclosed
S-K 1300 Technical Report Summary in 2021. This report has been prepared in collaboration with McEwen Copper and other qualified contributors
to assess the current potential economic viability of the Los Azules property.
This 2023 IA update supersedes the prior reports
and reflects a revised development philosophy, processing flowsheet, updated resource model and estimations, metallurgical information,
mine plans and economic parameters such as current capital and operating costs and associated new financial inputs and model. The main
differences between this 2023 updated study and the most recent previously disclosed Technical Report Summary are:
| Project Los Azules – S-K 1300 Technical Report Summary | Project No.: 21139-01 | 2-27 |
| · | Updated post-pandemic costs and financial metrics. |
| · | A multi-phased implementation approach to the Los Azules development with a focus on sustainable and regenerative
design approaches to the project execution and operation. |
| · | 100% renewable energy power sourced from an Argentinian provider. |
| · | Broader consideration of heap leachable copper resources than previously studied. |
| · | Revised site general arrangement for initial heap leach operations and future mill operations with filtered
dry deposition of tailings for the life of operations. |
| · | On-site generation of sulfuric acid supplied with sulfur supplied from local Argentinian sources and waste
heat capture for on-site power generation of a portion of the site requirements and make-up water heating. |
| · | Revision to production of copper cathodes initially and future copper concentrate production. |
| · | Supplying the Argentinian refined copper consumption needs, off-take options with investor groups (Stellantis
& Nuton) and exporting of copper cathodes and/or concentrates directly through ports in Argentina or Chile as the preferred logistics
solution. |
This IA is triggered by McEwen Copper’s
intention to publicly disclose the engineering and optimization studies completed by Samuel Engineering Inc. and Stantec Consulting International
Ltd. in conjunction with McEwen Copper during 2021 - 2023. The results from the updated IA and the Los Azules property are material to
McEwen Copper.
The quality of information, conclusions and estimates
contained herein are consistent with the level of effort involved in the authors’ services based on: (i) information available at
the time of preparation; (ii) data supplied by outside sources and (iii) the assumptions, conditions and qualifications set forth in this
report. This report is intended to be read as a whole and sections should not be read or relied upon out of context.
This report was authored by the qualified persons
(each a “QP” and collectively, the “QPs”) listed in Table 2.1. Each QP only assumes responsibility for those sections
or areas of the report that are referenced opposite their name in Table 2.1. None of such QPs, however, accept any responsibility or liability
for the sections or areas of this report that were prepared by other QPs.
The QPs believe the report complies with 17 CFR
Part §229.1300 (S-K 1300) Standard Instructions for Regulation S-K subpart 1300 SEC S-K §229. 1304 and §229.601(b)(96)
and meets the requirements of S-K 1300 as considered for an Initial Assessment (IA) level of study and reporting disclosure as defined
in the regulations and supporting reference documents.
A summary of the QPs, as defined in S-K 1300,
responsible for each section of the report and their respective company affiliation is provided in Table 2.1.
| Project Los Azules – S-K 1300 Technical Report Summary | Project No.: 21139-01 | 2-28 |
| Table 2.1: Summary of Qualified Persons |
| Qualified Person (QP) |
Company |
Areas of Responsibility |
Report Sections |
| Allan L. Schappert, CPG, SME-RM |
Stantec Consulting International Ltd. |
Mineral Resource Estimates, Geology, Sample Preparation, Exploration & Drilling |
1, 6, 7, 8, 9, 11, 22.4-22.5, 23 |
| Bruno Borntraeger, PE |
Knight Piesold Ltd. |
Heap Leaching Design, Environmental Studies & Permitting |
3.6-3.10, 17.1, 17.3-17.6, 22.8 |
| W. David Tyler, SME-RM |
McEwen Copper Inc. |
Property, Ownership, Surface Rights, Project Infrastructure, Market Studies & Contracts |
1, 3.1-3.5, 4, 5, 15.1-15.6, 16, 20, 22, 23 |
| James L. Sorensen, FAusIMM |
Samuel Engineering Inc. |
Process, Mineral Processing, Metallurgical Testing & Recovery, Project Infrastructure, Project & Study Execution, |
1, 2, 3.1-3.3, 10, 14, 15.1-15.3, 15.5-15.6, 18, 22.1-22.3, 23.1-23.2, 24, 25 and 26 |
| Richard F. Reinke, P. Geo. |
Stantec Consulting International Ltd. |
Water Supply & Pit Dewatering |
13.7, 15.7 |
| Robert J. Bowell PhD, C. Chem, C. Geo, P. Geo |
SRK Consulting UK Limited |
Geochemistry |
17.2 |
| Steven Guy Bundrock, P. Eng. |
Stantec Consulting International Ltd. |
Mine Rock Storage Facility |
22.6, 22.10, 23.3, 23.5 |
| Satjeet Pandher, P. Eng. |
Stantec Consulting International Ltd. |
Mining |
1.6, 13, 18, 19, 22.7, 23.1 |
| Steven Alan Pozder, PE, MBA |
Samuel Engineering Inc. |
Economic Analysis |
1, 2, 19, 22, 23 |
| All |
All |
Information relating to areas of responsibility for Sections: |
1, 2, 22, 23 |
| 2.3 | Personal Inspection of Los Azules Property |
The author considers the foregoing personal inspections
to constitute a “current personal inspection” in accordance with S-K 1300 for the current level of study.
Mr. Allan Schappert (CPG, SME-RM) of Stantec Consulting
International Ltd., QP, visited the Los Azules property during the period from 24 April – 15 May 2022. The purpose of the visit
was to observe, review, and comment on all aspects of data collection, recording, and analysis in preparation of the Mineral Resource
Estimate. Activities and discussions included the following: visit and inspection of operating drill sites; care, custody, and control
procedures of core boxes; core logging facilities at Los Azules camp; core storage and sampling procedures at the Calingasta warehouse;
a tour of the independent assay lab in Mendoza; review of historical and current QA/QC protocols with a review of recent results.
Mine Technical Services (MTS) conducted two phases
of database audits (2021 and 2022) including a site visit by Todd Wakefield and Francisco Ramos between April 18 – 27, 2022. Discussions
of their findings and a review of their recommendations were made. Stantec Consulting International Ltd. geological QP supported McEwen
Copper’s decision to undertake an extensive re-assaying program of existing core to augment the database prior to the updated estimate.
| Project Los Azules – S-K 1300 Technical Report Summary | Project No.: 21139-01 | 2-29 |
A site visit was performed 08 April 2022 to 13
April 2022 with a team physically on the site 09 April 2022 through 12 April 2022 and attended by the following Stantec Consulting International
Ltd. individuals.
| · | Jason Reynolds – Geotechnical Leader |
| · | Carrie Loar – Geology Senior Reviewer |
| · | Julia Loffler – Lead Geologist |
| · | Andrew Burgin – Geotechnical Designer |
SRK Geochemists Rob Bowell and Brooke Clarkson
visited the Los Azules core warehouse facility in Calingasta, November 7-9, 2022, and were accompanied by Hugo Bracamonte from McEwen
Copper. The focus of the visit was to examine the drill core from the intervals selected for geochemical characterization. Field logging
included a description of the lithology, alteration, mineralogy, and structure.
Bruno Borntraeger, PE of Knight Piesold (KP),
QP for the leach pad design visited the site January 29-31, 2023. The visit focused on leach pad site locations and field-testing requirements
for the geotechnical design of the leach pad.
David Tyler (SME-RM) is the McEwen Copper Project
Director for the Los Azules Project and has the responsibility for the study work. Mr. Tyler has visited the Los Azules site several times
in 2022 and 2023.
| Project Los Azules – S-K 1300 Technical Report Summary | Project No.: 21139-01 | 2-30 |
The Los Azules Project is a porphyry copper development
project located in the Frontal Andes Cordilleran region of San Juan Province, Argentina along the border with Chile. The project falls
within the Calingasta Department of the San Juan Province. The Project is approximately 80 km west-northwest of the small town of Calingasta,
in the San Juan Province of Argentina at approximately 31° 06' 25" south latitude and 70° 13' 25" west longitude. Calingasta
is located 173 km by road west of the Provincial Capital city of San Juan along Route 12.
The terrain elevation at the project site ranges
between 3,200 meters above sea level (masl) at the proposed camp location and up to 4,500 masl on the high peaks in proximity to the Project.
The Project area is remote, and no infrastructure is present. There are no nearby towns, Indigenous residents, or settlements. Seasonal
exploration work typically commences in October or November and terminates in May or early-June. Exploration operations are supported
by means of two temporary camps within the Project site area.
The mine development is located approximately
6 km east of the border with Chile (Figure 1.3).
McEwen Copper controls approximately 32,700 ha
of mining rights and 18,000 ha of surface rights around the Los Azules Project. Aerial photography and global positioning were utilized
to locate the property in the field; the coordinates of the corners of the property are established in the government documents granting
the mining rights.
The Los Azules Project is currently accessed by
120 km of unimproved road with eight river crossings and two mountain passes (both above 4,100 m elevation). This access is subject to
snow accumulation and is passable only from November through to May. This 2023 update describes in Section 15 “Infrastructure”
a potential future northern access route within McEwen Copper owned lands that is less affected by snow. Also described is an airstrip
currently permitted for construction.
| 3.2 | property and title in argentina |
The laws, procedures, and terminology regarding
mineral title in Argentina differ from those in the United States and in Canada. Mineral rights in Argentina are separate from surface
ownership and are owned and administered by the provincial governments. The following summarizes some of the relevant provisions of the
Argentine Mining Code and Argentinean mining law terminology to aid in understanding the McEwen Mining land holdings in Argentina.
The provinces are the owners of the natural resources
located within their territories and each province retains the power to administer and regulate mineral rights according to the federal
Mining Code and supplemental provincial laws and regulations.
Surface rights are separate from mineral rights,
and they are treated separately under Argentine law. The Mining Code establishes that mining is in the public interest and therefore surface
owners cannot prevent the granting of mining rights and properties or commencement and/or continuity of mining activities on their property,
but surface owners have a right to collect an indemnity because of the use of the land by the miner and the damages derived from mining
activities. Land over which a mining concession has been granted is legally subject to different types of easements (e.g., right of way,
occupation of land, use of water, etc.), provided that an indemnity is paid to the owner of such land.
| Project Los Azules – S-K 1300 Technical Report Summary | Project No.: 21139-01 | 3-31 |
Mineral rights are considered forms of real property
and can be sold, leased, or assigned to third parties on a commercial basis. “Cateos” (exploration permit) and “Minas”
(mining concession) can be forfeited if minimum work requirements are not performed or if annual payments are not made. Generally, notice
and an opportunity to remedy defaults are provided to the owner of such rights.
Grants of mining rights, including water rights,
are subject to the rights of prior users. Further, the mining code contains environmental and safety provisions administered by the provinces.
Prior to conducting operations, applicants must submit an environmental impact report (“Informe de Impacto Ambiental” or IIA
in Spanish) to the provincial mining authority describing the proposed operation and the methods to be used to prevent undue environmental
damage. When the provincial mining authority approves the IIA it issues a permit in the form of an official declaration (“Declaratorio
de Impacto Ambiental” or DIA in Spanish). The IIA must be updated every two years, with a report on the results of the protection
measures taken. If protection measures are deemed inadequate, additional environmental protection may be required. Mine operators are
liable for environmental damage. Violations of environmental standards may cause exploration or mining operations to be shut down but
without prejudice to mining title.
| 3.3 | oWNERSHIP OF THE LOS AZULES PROJECT |
McEwen Mining was organized under the laws of
the State of Colorado on July 24, 1979, and is listed on the New York Stock Exchange (NYSE) and on the Toronto Stock Exchange (TSX) under
the symbol MUX. The Company’s head office is in Toronto, Canada. As of May 2023, the Company owns a 51.9% interest in McEwen Copper
which owns a 100% interest in the Los Azules Copper Project in San Juan, Argentina, and the Elder Creek exploration project in Nevada,
USA. The relevant ownership structure is shown in Figure 3.1, as provided by McEwen Mining.
The Los Azules Project is comprised of properties
(the “Properties”) owned by Andes Corporación Minera S.A. (ACSMA), an Argentine subsidiary of McEwen Mining through
its ownership in McEwen Copper.
ACMSA controls approximately 31,746 ha of mining
rights (Minas) around the Los Azules deposit. In addition, ACMSA owns sufficient surface rights for the Project pursuant to an agreement
with CCM S.A., whereby ACMSA acquired 18,000 ha in surface rights. In 2018, ACMSA filed a request to group all the Mining Permits together,
file #1124.553-A-2018, in such way that, once all surveys are approved, all the Mining Permits be considered as one larger Mining Permit.
This will allow investments to be distributed across the larger permit group and eliminate the need to spend on each individual Mina.
It is expected that this request by ACMSA could be favorably resolved during 2023. These Properties are the subject of this Technical
Report. Specific property details are discussed in Section 3 of this report.
FCA Argentina S.A., a subsidiary of Stellantis
N.V. (“Stellantis”), invested ARS $30 billion in Argentina to acquire shares of McEwen Copper in a transaction that closed
on February 24th, 2023. In connection with the Transaction, McEwen Copper and certain of its affiliates entered into an Investor Rights
Agreement with Stellantis (the "Stellantis IRA”) and a Copper Cathodes and Concentrates Purchase Rights Agreement (the “CCCPRA”),
which are described below.
| Project Los Azules – S-K 1300 Technical Report Summary | Project No.: 21139-01 | 3-32 |
The Stellantis IRA provides for the following
principal terms:
| · | Stellantis will have the right to nominate one director to the Board of McEwen Copper, |
| · | Stellantis will have the opportunity to provide local currency funding, in certain circumstances, for
advancement of the Los Azules Project, |
| · | Comprehensive scientific, technical and strategic planning information rights, |
| · | Pre-emptive right to maintain their ownership percentage in any follow-on equity offering, |
| · | Agreement of McEwen Mining and Robert R. McEwen to not trigger Drag Along Rights in the event of a bid
for McEwen Copper prior to the planned initial public offering (IPO), and |
| · | McEwen Copper commits to achieve net-zero carbon emissions from the Los Azules Project by 2038. |
The CCCPRA provides an option to Stellantis and
its affiliates that, if exercised to its maximum extent, would allow them to purchase a percentage of the copper cathodes or copper concentrates
or both produced from the Los Azules Project, in each case equal to their equity ownership percentage in McEwen Copper at the time of
exercise.
Nuton LLC, a Rio Tinto Venture (“Nuton”),
has invested a further USD $25 million to acquire shares of McEwen Copper in a transaction that closed on August 31st, 2022. In connection
with the transaction, McEwen Copper entered into a collaboration agreement with Nuton (the "Nuton Collaboration Agreement”),
to advance our understanding of the potential application of heap leach technology at Los Azules, including the testing of Nuton™
Technologies for compatibility with Los Azules copper mineralization. Leaching has many potential economic and environmental benefits
over a conventional milling scenario, including lower water and energy consumption, no large tailings storage facility or dam, and typically
lower capital and operating costs.
The principal terms of the Nuton Collaboration
Agreement include:
| · | McEwen Copper and Nuton will jointly undertake copper leach testing using Nuton™ technologies with
samples from Los Azules. McEwen Copper has agreed to grant exclusivity to Nuton for one year in the area of novel, patented or trade secret
leaching technology, while it will continue its independent test work and studies using conventional leach technologies. |
| · | Nuton will have the right to select one nominee who will be appointed as a director or observer to the
Board of McEwen Copper. This right will continue for as long as Nuton holds greater than 7.5% of the issued and outstanding shares of
McEwen Copper. |
| · | McEwen Copper has agreed to limit related party transactions in certain situations until the earlier
of the planned IPO (or alternative liquidity event) or Nuton ceasing to hold 7.5%. |
| · | Customary standstill and lock-up agreement between the Investor and its affiliates and McEwen Copper
and its affiliates. |
Nuton has invested a further USD $30 million to
acquire additional shares of McEwen Copper in a transaction that closed on March 15th, 2023.
In connection with the second Nuton transaction,
McEwen Copper and certain of its affiliates entered into an Amended Collaboration Agreement (the "New Nuton Collaboration Agreement”)
and a Copper Cathodes and Concentrates Purchase Rights Agreement (the “CCCPRA”), which are described below.
| Project Los Azules – S-K 1300 Technical Report Summary | Project No.: 21139-01 | 3-33 |
The New Nuton Collaboration Agreement provides
for the following additional rights beyond those in the original Nuton™ Collaboration Agreement.
| · | Nuton will have the opportunity to provide local currency funding, in certain circumstances, for advancement
of the Los Azules Project, |
| · | Comprehensive scientific, technical, and strategic planning information rights, |
| · | Extension of exclusivity over investigating other novel, trade secret or patented copper heap leach technologies
until August 10, 2024, |
| · | Pre-emptive rights to maintain their ownership percentage in any follow-on equity offering, |
| · | Agreement of McEwen Mining and Robert R. McEwen to not trigger Drag Along Rights in the event of a bid
for McEwen Copper prior to the planned initial public offering (IPO). |
The CCCPRA provides an option to Nuton that is
equivalent to that of Stellantis described above.
After closing the second Nuton Transaction, McEwen
Copper has 28,885,000 common shares outstanding on a fully diluted basis, and its shareholders are: McEwen Mining Inc. 51.9%, Stellantis
14.2%, Nuton 14.2%, Robert R. McEwen 13.8%, Victor Smorgon Group 3.5%, and other shareholders 2.4%.
| Project Los Azules – S-K 1300 Technical Report Summary | Project No.: 21139-01 | 3-34 |
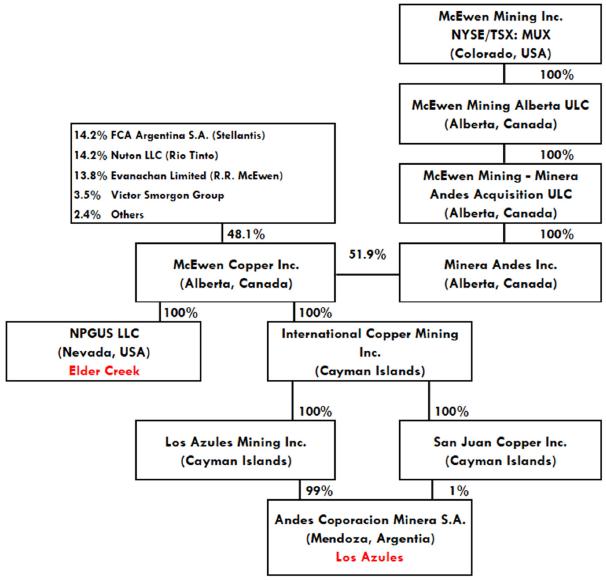
Figure 3.1: Los Azules Ownership Structure
(McEwen Mining, 2023)
| Project Los Azules – S-K 1300 Technical Report Summary | Project No.: 21139-01 | 3-35 |
Los Azules Mineral Rights
In 1994, Minera Andes S.A. (MASA), an Argentine
subsidiary of Minera Andes, was granted the Cateo to explore the Cordon de Los Azules (file # 545.957-D-94). This cateo was divided and
converted into two MDs on October 17, 1998, known as Azul 1 and Azul 2. These MDs cover part of the southern portion of the Project. In
2009 MASA transferred these two MDs to Andes Corporación Minera S.A. (ACSMA). The central portion of the Project is covered by
MD Mirta and the northern portion by Escorpio II, all owned by ACSMA.
The Los Azules Project is comprised of properties
(the “Properties”) owned by ACSMA, an Argentine subsidiary of McEwen Mining through its ownership in McEwen Copper. The information
in the section relies upon a legal review and opinion report Re: “Incorporation and good standing status of Andes Corporación
Minera S.A. (ACMSA) and of its mining rights” dated January 11, 2023, by Abogado Jose Vargas Gei of Vargas & Galindez (V&G),
a Mendoza-based legal firm.
Based on the V&G review and opinion, the following
conclusions were included in their memorandum.
| a. | ACMSA has good and valid, legal, and beneficial title to the mining rights listed on Table 3.1. Mining rights coordinates are listed
on APPENDIX X. |
| b. | The mining rights listed on Exhibit A are all in good standing and comply with applicable regulations. |
| c. | The annual canon for each mining right is paid up to the first semester of 2023 (see Table 3.1, for amount of canon paid for each
mining right per year). |
| d. | ACMSA has invested in Los Azules over 300 times the annual canon payment, reaching the minimum amount required by Article 217 of the
MC, considering Los Azules Project as a whole unit. |
| e. | Los Azules Project is subject to the payment mentioned in sections m) and n) below. |
| f. | No inactivity has occurred on the mining rights listed on Exhibit A and Exhibit B for more than four (4) years. |
| g. | “Labor Legal” [allowed exploration work] has been performed and the “Survey” has been performed on all mining
rights. The Mining regulatory authority has observed these surveys and is discussing with the Company ways to improve them. |
| h. | Pursuant to Resolution #3011, dated December 20, 2016, the Departamento de Hidráulica authorized ACMSA to use 316.8 m3
(cubic meters) of water for the benefit of Los Azules Project. This permit is renewable. |
| i. | ACMSA has good and valid legal and beneficial title to the following easements (see Exhibit D): |
| o | File #520.0439-M-97 (exploration access road) |
| o | File #0680-F28-M-96 (southern access road) |
| o | File #1124.218-A-18 (northern access road) |
| o | File #1124.660-M-12 (Candadito camp) |
| j. | ACMSA has requested the following easements, not yet granted (see Exhibit D): |
| o | File #1124.354-A-2018 (power line) |
| o | File #1124.544-A-2022 (surface occupation Illanes Mery property) |
| o | File #1124.231-A-2010 (surface occupation Estomonte property) |
| Project Los Azules – S-K 1300 Technical Report Summary | Project No.: 21139-01 | 3-36 |
| k. | The 5th Environmental Impact Report update for exploration filed by ACMSA for Los Azules Project has been approved by Resolution #317-MM-2021,
dated June 3, 2021, and Resolution #352-MM-2021, dated June 17, 2021, both by the Ministerio de Minería of the province of San
Juan. |
| l. | Glacial and periglacial studies have been carried out by the consulting firm Mountain Pass Consulting and have been incorporated into
the Environmental Impact Report referred to above. |
| m. | Pursuant to the Los Azules Option Agreement, dated November 2, 2007, entered into between MIM Argentina Exploraciones S.A., Xstrata
Queensland Limited, Minera Andes S.A. and Minera Andes Inc. (the latter later acquired by US Gold Corporation and the business combination
later renamed McEwen Mining Inc.), once a Feasibility Assessment is completed on “Los Azules” project, including properties
named Mercedes and Mirta, a payment of USD $500,000 is due to Ms. Dina Myriam Elizondo de Bosque and Mr. Hugo Arturo Bosque. |
| n. | Pursuant to a Transfer Agreement, dated October 16, 2014, between TNR Gold Corp., Compañía Minera Solitario Argentina
S.A., Los Azules Mining Inc., ACMSA and McEwen Mining Inc., ACMSA agreed to pay Compañía Minera Solitario Argentina S.A.
a 0.4% net smelter return royalty in respect of Los Azules Project. |
| o. | As of the date of this opinion, there are no material claims against ACM. |
The challenge by ACMSA for the peripheral properties
under threat of forfeiture, Gina, Sofia, Torora II, and Marcela, was resolved in the company’s favor and the forfeited rights were
returned by the Mining Council on December 29, 2022.
As of January 17, 2023, the powerline easement
was granted by the provincial government.
A list of those land holdings is detailed in Table
3.1 and are also shown on Figure 3.2. The size of the property covered by those tenements, once actually granted, however, may differ
from those set out below.
| Table 3.1: Andes Corporación Minera S.A. - Mining Right Descriptions |
| Exhibit A Properties |
|
Mining
Right Name |
File Number |
Legal
Status |
Annual Mining
Canon ($AR) |
Legal Work |
Surface (ha) |
Comments Field Work |
| Agostina |
1124.108-A-10 |
Registered |
$ 228,000.00 |
11/15/2010 |
1,184.00 |
In approval process |
| Azul 2 |
520.0280-M-98 |
Registered |
$ 247,000.00 |
9/8/1999 |
1,299.90 |
In approval process |
| Azul 3 |
1124.121-A-06 |
Registered |
$ 38,000.00 |
3/15/2013 |
166.76 |
In approval process |
| Azul 4 |
1124.473-M-08 |
Registered |
$ 19,000.00 |
1/22/2014 |
903.06 |
In approval process |
| Azul 5 |
1124.119-A-09 |
Registered |
$ 570,000.00 |
11/15/2010 |
3,001.32 |
In approval process |
| Azul Este |
1124.186-A-07 |
Registered |
$ 456,000.00 |
5/27/2008 |
2,372.48 |
In approval process |
| Azul Norte |
1124.668-M-07 |
Registered |
$ 38,000.00 |
11/15/2010 |
131.94 |
In approval process |
| Cecilia |
1124.035-A-12 |
Registered |
$ 342,000.00 |
11/8/2013 |
1,702.26 |
In approval process |
| Escorpio I |
0153-C-96 |
Registered |
$ 38,000.00 |
6/19/2008 |
168.81 |
In approval process |
| Escorpio III |
0155-C-96 |
Registered |
$ 38,000.00 |
11/1/2013 |
199.45 |
In approval process |
| Mercedes |
0644-M-96 |
Registered |
$ 171,000.00 |
6/4/1999 |
836.06 |
In approval process |
| Rosario |
1124.169-A-10 |
Registered |
$ 342,000.00 |
11/15/2010 |
1,768.44 |
In approval process |
| Project Los Azules – S-K 1300 Technical Report Summary | Project No.: 21139-01 | 3-37 |
| Table 3.1: Andes Corporación Minera S.A. - Mining Right Descriptions |
| Exhibit A Properties |
|
Mining
Right Name |
File Number |
Legal
Status |
Annual Mining
Canon ($AR) |
Legal Work |
Surface (ha) |
Comments Field Work |
| Totora |
414.1324-C-05 |
Registered |
$ 114,000.00 |
9/14/2010 |
504.86 |
In approval process |
| Gina |
1124.168-A-10 |
Registered |
$ 646,000.00 |
11/15/2010 |
1,762.99 |
In approval process |
| Sofia |
1124.167-A-10 |
Registered |
$ 646,000.00 |
2/17/2011 |
3,324.97 |
In approval process |
| Totora II |
520.496-C-99 |
Registered |
$ 304,000.00 |
9/26/2005 |
1,561.12 |
In approval process |
| Marcela |
1124.495-A-09 |
Registered |
$ 570,000.00 |
8/13/2010 |
2,952.77 |
In approval process |
| Exhibit B Properties |
| Azul 1 |
520.0279-M-98 |
Registered |
$ 399,000.00 |
11/1/1999 |
2,098.20 |
Process completed. Pending formal resolution |
| Escorpio II |
0154-C-96 |
Registered |
$ 380,000.00 |
5/5/2008 |
1,991.00 |
Process completed. Pending formal resolution |
| Escorpio IV* |
425.213-C-03 |
Registered |
$ 665,000.00 |
12/13/2005 |
4,411.71 |
In approval process |
| Mirta |
1124.0141-M-09 |
Registered |
$ 76,000.00 |
10/20/2010 |
354.40 |
Process completed. Pending formal resolution |
| |
|
Total Canon |
$ 6,327,000.00 |
Total Hectares |
32,696.50 |
|
| *The reported hectares will be reduced to 3500 with the approval of the measurement, due to legal limitations. |
| *NOTE: |
Escorpio IV was originally requested, by the previous owner, as a 4,411.71
hectares mining permit. However, mining law sets a limit to the size of the mining permits held by companies of 3,500 hectares. Consequently,
Escorpio IV, when acquired by ACMSA, was 911.71 hectares above the legal limit. This led ACMSA to release the central area of Escorpio
IV, as suggested by its geologists, as it being an area that does not affect ACMSA plans for Los Azules Project. The mineral claim
locations are shown Figure 3.2. |
| |
|
| |
By law, the released area is granted to Instituto de Exploraciones y
Explotaciones Mineras (IPEEM, a provincial mining company), that, following certain procedures, can grant this area to private companies
to be explored and exploited. |
| Project Los Azules – S-K 1300 Technical Report Summary | Project No.: 21139-01 | 3-38 |
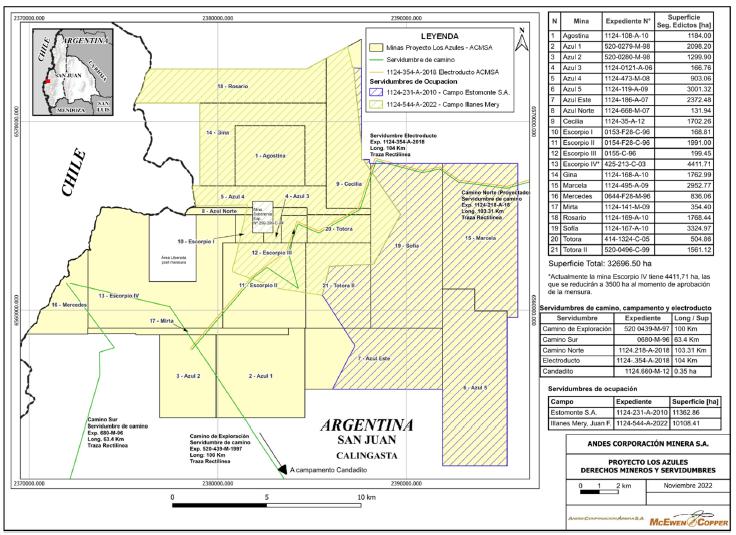
Figure 3.2:
Map of Mineral Claims (Minas), Easements (Servidumbres) and Surface (Superficie) Ownership (Vargas & Galindez/McEwen 2022)
As for the mining
right at the project center, labeled Soberania (File # 259,299-C-84), ACMSA and three other persons have claimed the right to this mine
simultaneously. To date, the award of the mining right has not been resolved, but it is expected that to be resolved in favor of ACMSA,
since the request and technical arguments of ACMSA are more relevant than those of the third parties.
The 21 mining rights
have been grouped into a Mining Group, which is in process under file No. 1124.553-A-2018. According to Argentine laws, it is necessary
to have approved measurements of each mining right to constitute a Mining Group, so these measurements are in process and this approval
is expected during the year 2023.
An exploitation
plan was filed in January 2023 and subsequently an Environmental Impact Statement for the exploitation was filed in April 2023 with the
government of San Juan. This plan and EIS were in support of the maintenance of the ACMSA mining rights. The exploitation plan committed
ACMSA to begin the development of the mine within 5 years, or before January 2028.
It should be noted
that no facilities are foreseen in either the Soberania or the released area of the Escorpio IV mining rights. Figure 1.4 shows the layout
of site facilities relative to the surface and mining rights.
| Project Los Azules – S-K 1300 Technical Report Summary | Project No.: 21139-01 | 3-39 |
Los Azules Surface Rights
In January 2010,
Andes Corp. purchased 18,000 ha of surface rights in the Los Azules area. The purchase of this property, located near the Argentina/Chile
border region, was subject to government approval. The approval was granted on August 31, 2010, by Resolution #907 of the Ministerio
del Interior. Figure 3.3 shows the purchased surface rights. The surface rights currently held by ACMSA cover the area currently being
explored by McEwen Copper. The area represented by the surface rights are also considered to be more than adequate for potential development
of the mine, associated processing facilities and infrastructure considered in this technical report.
| Project Los Azules – S-K 1300 Technical Report Summary | Project No.: 21139-01 | 3-40 |
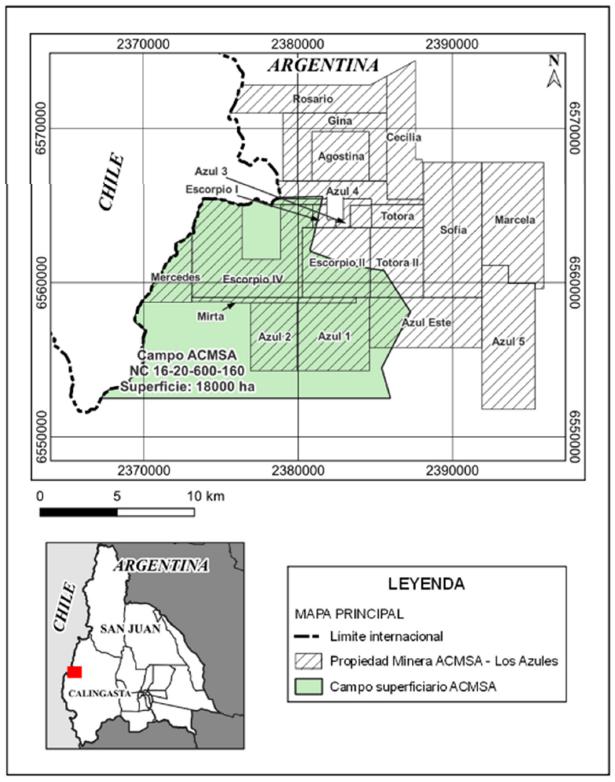
Figure 3.3:
ACMSA Owned Propiedad Minera (Mining Rights) and Campo Superficiario (Surface Rights) (McEwen, 2022)
The green area
in Figure 3.3 indicates the limits of McEwen Mining surface rights (land holdings) relative to the mining rights. The western boundary
of the property is the border with Chile. Below, Figure 3.4 shows the surface right owners within and adjacent to the Los Azules Project,
with the land held by Illanes Mery colored in orange, Campo Cortez Monroy to the south in yellow, Cortez Angel to the north in green,
and the Estomonte property to the east in peach color.
| Project Los Azules – S-K 1300 Technical Report Summary | Project No.: 21139-01 | 3-41 |
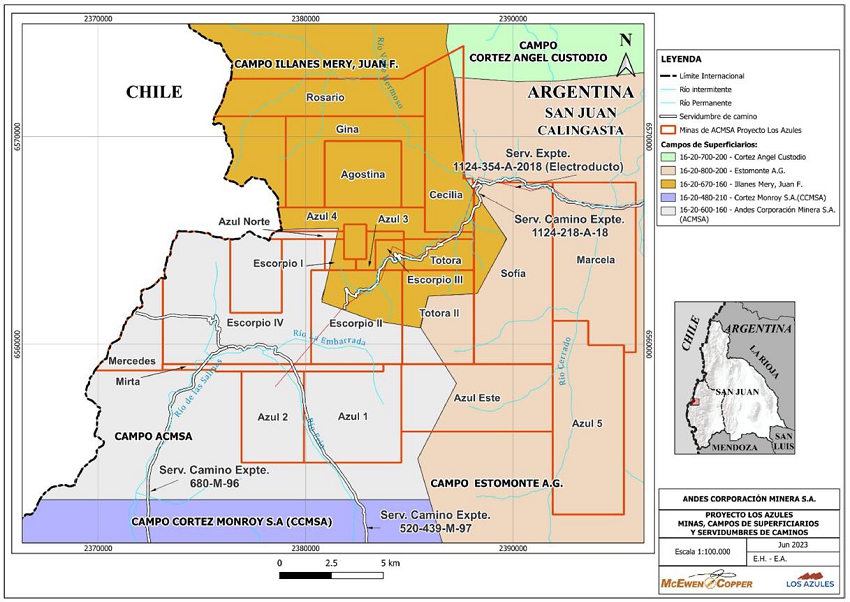
Figure 3.4:
Map of mineral concessions and surface rights (campos) within or adjacent to project area (Vargas & Galindez/McEwen, 2022)
| Project Los Azules – S-K 1300 Technical Report Summary | Project No.: 21139-01 | 3-42 |
None of the mineral
concessions that are not owned by McEwen but that fall within the McEwen owned surface rights will have any impact upon the development
of the Los Azules Project. All Los Azules facilities are located on lands where McEwen has both the surface and mining rights.
| 3.4 | ROYALTIES AND RETENTIONS |
There are no outstanding
royalties, payments, or other agreements or encumbrances to which the property is subject to other than a one-time USD $500,000 payment
to be made to Hugo Bosque upon delivery of a feasibility study.
San Juan Province
charges a 3% royalty based on the “mine head value”. The 3% is charged on the sale price less some costs (excluding depreciation
of fixed assets and extraction costs). In other words, deductible expenses include: i) transport and freight costs; ii) crusher, milling
and process (beneficiation) costs; iii) commercialization cost; iv) administrative cost (not related extraction cost) and v) smelting
and refining costs. However, since July 2011, the Province of San Juan, through an agreement with the mining companies in operation,
modified the calculation of the "mine head value" by a taxable base on gross sales, without any deductions. This change in
the methodology has not been reflected in the legislation, and is implemented through agreements according to a series of conditions
(e.g., metal prices, tax burden, etc.)
In addition, the
Province of San Juan has an unlegislated practice of negotiating a voluntary contribution to a trust (“fideicomiso” in Spanish),
usually 1.2% or 1.5% and on the same calculation basis as mining royalties (on gross sales, without deductions). These contributions
are intended to finance infrastructure projects in the province, especially in the local area impacted by the mining operation.
TNR Gold Corp has
a 0.4% NSR across the project, and McEwen has a 1.25% NSR.
There are no back-in
rights.
| 3.6 | ENVIRONMENTAL LIABILITIES |
At the present
time, there are no known environmental liabilities at the Project site, since it is an exploration project. Reclamation activities are
comprised of re-grading the drill pad sites, access roads at site and some portions of the main access road to the Project site.
There are two principal
activities that have environmental impacts in the Project area. One is the overgrazing of pasture lands and the second is access roads
and drill platforms on the property.
Seasonal grazing
by “veranadas” from Chile takes place on sparse foraging resources and wetlands in the Project area. The “veranadas”
with large animal herds (primarily goats) have affected:
| · | Vegetation
coverage on the grazing land. |
| · | Erosion
of the borders of streams. |
| · | The
surface drainage capacity due to compaction. |
| Project Los Azules – S-K 1300 Technical Report Summary | Project No.: 21139-01 | 3-43 |
There are numerous
previously existing excavation areas for exploration roads in the Project and surrounding areas, including drilling platforms.
| 3.7 | PERMITTING REQUIREMENTS |
Argentine laws
and regulations differentiate between prospecting, exploration, and exploitation activities. It is understood that exploration activities
include mapping, sampling (including bulk samples), geophysics, trenching and drilling, whereas prospecting activities include only mapping
and sampling.
There are different
sectorial permits that are required to conduct mining activities, but the most relevant ones are the ones associated with environmental
permits. The provisions related to environmental protection applicable to mining activity were established in 1995 by the General Environmental
Law and have been incorporated in Title Thirteen of the Mining Code.
The federal government
is empowered to issue Minimum Environmental Protection Standard Laws (MEPSL), applicable in the whole country by the respective local
authorities. The provinces are allowed to supplement and regulate the MEPSL with more stringent local or provincial environmental regulations.
Exploration and Prospecting
Requirements
The main permit
for the exploration phase at Los Azules is the Environmental Impact Declaration (Declaracion de Impacto Ambiental or DIA in Spanish),
which must be updated at least every two years with the provincial mining authority. An EIA must be presented for each phase of the project
development: prospecting, exploration, and exploitation (including industrialization, storage, transportation, and marketing of minerals).
The last DIA renewal was received on June 2, 2021, and the resolution was issued on June 17, 2021.
Ancillary permits
for water usage (domestic, drilling and dust mitigation), archeological research and investigation, hazardous waste, sewage, and domestic
waste facilities are renewed on an annual basis before the commencement of the exploration season. The permit renewals are expected to
be approved on time as per prior exploration seasons. All necessary permits have been obtained for the work currently being carried out
on the Project.
| 3.8 | PERMITTING REGULATIONS |
There are five
main legal requirements that impact the Project during the different stages of development: environmental regulation, mining regulation,
hazardous waste regulation, health and safety regulation and the Mining Investment Law.
Environmental Regulation
Environmental regulations
applicable to mining have four sources:
| · | Environmental
specific regulations applicable to mining arising from the Mining Code, |
| · | Environmental
laws issued by Federal Congress as MEPSL applicable to all activities including mining, |
| · | Local
environmental regulations issued by the provinces the MEPSL and applicable to all activities
including mining, |
| Project Los Azules – S-K 1300 Technical Report Summary | Project No.: 21139-01 | 3-44 |
| · | Additional
local/provincial environmental legislation if this does not contradict or is less stringent
than a MEPSL. |
Lack of compliance
or other infringement of the environmental obligation may result in penalties ranging from fines to suspension of works or closure of
the mine, but without effect upon title or ownership of the mining concession.
Mine Regulation
The acquisition,
exploitation and use of minerals are regulated by the Mining Code (National Law 1919) and Provincial Law 688-M. In addition, the province
of San Juan has adopted National Law 24585, environmental protection for mining activities.
Hazardous Waste Regulation
Other regulations
affecting the Project are related to Hazardous Waste regulations set forth in National Law 24051, adopted by the province of San Juan.
This law regulates the generation, handling, transportation, treatment, and disposal of hazardous waste materials.
Health and Safety Regulation
Health and safety
regulations require that a mining company must hire an Occupational Hazard Insurer (ART, as per the acronym in Spanish) to identify and
evaluate occupational hazards and to design preventive and emergency programs. For the mining sector, companies must give priority to
riskier occupational activities and employee training.
Mining Investment Law
Mining Investment
Law 240196 includes article 23, which relates to the preservation of the environment. To prevent and correct any impacts to the environment
due to mining activities, companies may establish a special accounting provision for that purpose. The annual amount shall be left to
the criterion of the company but shall be considered deductible for income tax purposes up to a sum equivalent to 5% of the operational
costs of material extraction.
Archaeological Sites
Archeological sites
are managed by the Ministry of Culture of the province of San Juan. Sites can be removed by applying to the Ministry for a permit that
describes the tasks to be carried out, prepared by qualified professionals. A site plan of the proposed work area should also be submitted
with the permit application. A permit is expected to take two months to obtain, and the work plan should be submitted one year in advance.
| 3.9 | GLACIER PROTECTION LEGISLATION |
In 2010, Argentina
passed Federal Legislation to protect its water resources contained in glaciers prohibiting activities that could affect these resources.
| Project Los Azules – S-K 1300 Technical Report Summary | Project No.: 21139-01 | 3-45 |
| · | Federal
legislation mandates cataloguing all glaciers in the territory and their status of conservation
or impact. |
| · | The
legislation created a conflict regarding federal versus provincial (state) ownership of the
natural resources, which sits now in front of the Supreme Court. |
Following suit
in July 2010, the province of San Juan enacted Provincial Law 8144, “Glacier Protection Law”, in a compromise with Federal
Law, which, among other things, restricts disturbance of glaciers by mining activities. In addition, the Federal Congress issued a MESPL
on the protection of glaciers and periglacial environment (Law 26639), which is separate from the provincial law.
Since 2011, several
independent studies have been conducted by the Company.
| · | No
uncovered, or “white glaciers” or ice glaciers, have been identified on Los Azules
property; however, several small cryogenic geoforms identified as “rock glaciers”
have been mapped onsite. |
| · | The
company believes it is in full compliance with the law, not having disturbed any glaciers
that could be deemed a water resource. |
| · | The
provincial inventory has been completed with no rock glaciers having been found to be affected
by exploration activities at Los Azules. |
| · | None
of these rock glaciers will be impacted by the company’s future exploration activities
or the development of a mining project. |
| · | The
water storage and watershed contribution from any rock glaciers mapped will be evaluated
as part of the Environmental Baseline Studies required for permitting. |
The Los Azules
exploration area was audited by a multi-agency environmental audit team in March 2013. There were no adverse findings and the audit results
indicated that McEwen Mining is in full compliance in all areas protected by the provincial law.
In 2016, the Provincial
Government began to catalogue the glaciers present in the provincial territory to determine if any impacts have taken place or if any
glaciers could impede mineral development in the province.
| 3.10 | ENVIRONMENTAL BASELINE STUDIES |
Between 2007 –
2012 Ausenco Vector has monitored and collected environmental baseline data on surface and groundwater volumes and quality, soils, flora
and fauna, archeology, and weather. Several other consultants have been involved for all environmental aspects. Ausenco Vector has also
studied the boggy wetlands, locally referred to as “vegas”.
Ausenco Vector
implemented a plan to relocate or compensate the vegas where they may be impacted by the project. The plan did not produce satisfactory
results. Andes Corporación Minera S.A. requested to the provincial environmental authority to propose an alternative compensation
criterion, however, there has not been any response from the authority to date.
Dr. Andres Meglioli,
of Mountain Pass LLC, has been monitoring cryogenic geoforms in the project area since 2011.
| Project Los Azules – S-K 1300 Technical Report Summary | Project No.: 21139-01 | 3-46 |
The environmental
baseline data on surface and groundwater volumes and quality as well as the flora and fauna data collection and additional studies on
the vegas (including a compensation proposal) have been conducted since 2013 by the Instituto de Investigaciones Hidraulicas, a research
center of the National University of San Juan, through their senior biologists Juan C. Acosta and Hector J. Villavicencio. These are
ongoing studies contracted by McEwen Copper. After each drilling season, a report is prepared by the consultants and issued to McEwen
Copper that summarizes the work completed through the season.
In late 2017 and
throughout 2018, McEwen Copper, in conjunction with consultants and specialists, performed full-year baseline studies for fauna, flora,
and hydrology that will require extended site access through all seasons and support using mules and helicopters. Geotechnical studies,
such as water permeability tests, may also be performed to enhance the existing data set.
In 2022, additional
environmental baseline work was undertaken with the objective of completing an IIA (Informe Impacto Ambiental) equivalent to the English
EIA for exploitation of the mine. All of this and prior baseline data was included in the IIA documentation that McEwen Copper submitted
to the authorities in April of 2023.
| Project Los Azules – S-K 1300 Technical Report Summary | Project No.: 21139-01 | 3-47 |
| 4.0 | Accessibility, Climate, Local Resources,
Infrastructure and Physiography |
Access to the site
is through provincial routes to mining access easements granted under Argentine law. The province of San Juan is bisected by RN 40, which
extends the length of Argentina.
The main access
to the Los Azules Project from Villa Calingasta (Calingasta Department – Province of San Juan), is through Provincial Route No.
437 from the intersection with Provincial Route No. 406 to La Alumbrera, an approximate distance of 25 km. From there, the mining road
begins. This is the Exploration Road, which includes the Candadito support camp that is covered by an easement granted under file No.
1124.660-A-2012. The route has a length of 87 km and is covered by a road easement recorded in administrative file No. 520-0439-M-97
on behalf of ACMSA.
According to Argentine
law, mineral rights supersede the overlying surface rights, and the holder of the latter is legally unable to impede access to the exploration
or extraction of underlying mineralization. Fair compensation is provided to the surface rights holder for access and usage of the land
in conjunction with exploration activities and mining operations. In January 2010, “Minera Andes”, a company 100% owned by
McEwen Mining Inc., purchased 18,000 ha of surface rights covering the Los Azules Deposit and the associated surface facilities, as they
are currently envisioned. The extent of surface rights and the proposed surface facilities are illustrated in the Los Azules General
Arrangement in Figure 1.4.
| 4.3 | climate and length of operating season |
Typically, the
field season at Los Azules starts in December and runs through to the end of May due to limited access. However, last year, access to
the site was maintained through mid-June, and depending upon the winter snowpack conditions, it is possible in some years to access the
site as early as October as was the case in the last two drill seasons.
A weather station
was installed near the camp site in mid-2010 to obtain local climatic information. The station is powered by a solar panel and collects
meteorological parameters at 30-minute intervals. The station was manufactured by Coastal Environmental and is built around the ZENO®
3200 datalogger. Data communication is via an Iridium satellite modem. Data is downloaded using a companion base station located in the
United States. The weather station uses a stand-alone tower with sensors to obtain the following parameters:
| · | Wind
direction (degrees) |
| · | Standard
deviation of wind direction (degrees) |
| · | Barometric
pressure (mPa) |
| · | SW
solar radiation (W/m2) |
| Project Los Azules – S-K 1300 Technical Report Summary | Project No.: 21139-01 | 4-48 |
| · | Accumulative
precipitation (mm) in precipitation bucket. |
| · | Contents
of precipitation bucket (mm3) |
| · | Snow
depth (mm) (installed Q2 2013) |
Two new weather
stations were purchased and installed this season to provide better coverage over the site.
Considering the
types of recorded parameters, the Los Azules meteorological station meets the World Meteorological Organization (WMO) standards for a
Principal Climatological Station.
Figure 4.1, Figure
4.2 and Figure 4.3, which were obtained from the site meteorological station, present monthly weather data for temperature, total precipitation,
and wind speed. Snowfall accumulations are recorded by the station as snow-water equivalent. Snowfall in the Project area is light, although
heavy winter accumulations are common on the two high passes on the access road.
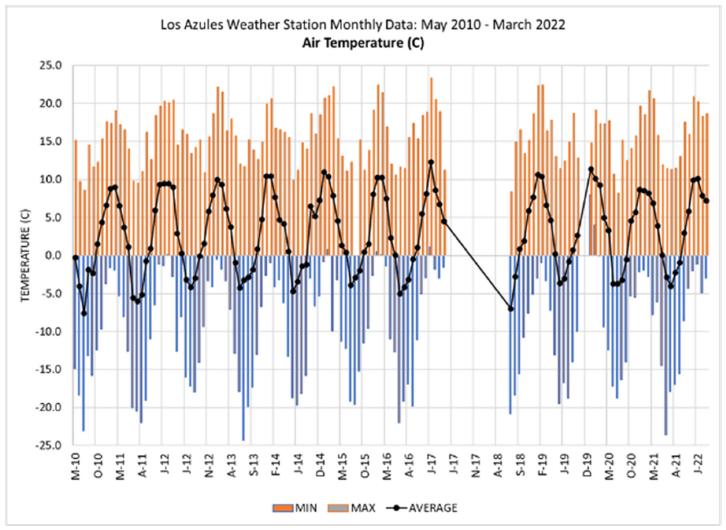
Figure 4.1:
Monthly Temperature Data Apr-17-Jun-18, Nov-19 (McEwen 2022)
| Project Los Azules – S-K 1300 Technical Report Summary | Project No.: 21139-01 | 4-49 |
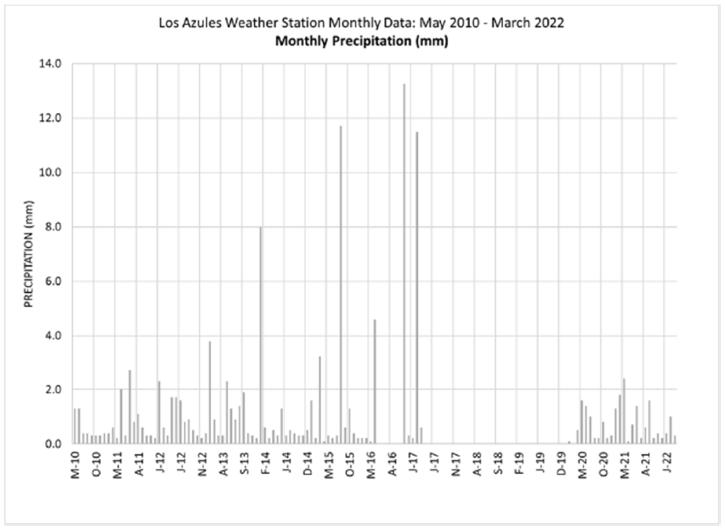
Figure 4.2:
Monthly Total Precipitation Data – no data recorded Apr-17-Jun-18, Nov-19 (McEwen 2022)
| Project Los Azules – S-K 1300 Technical Report Summary | Project No.: 21139-01 | 4-50 |
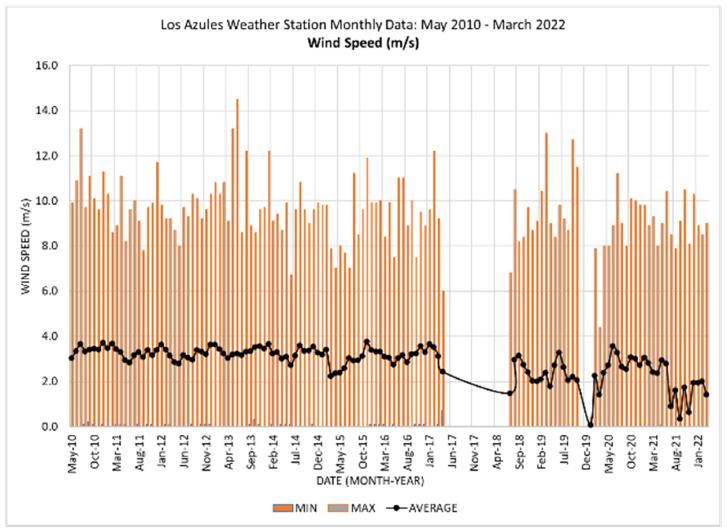
Figure 4.3:
Monthly Wind Speed Data – no data recorded Apr-17-Jun-18, Nov-19 (McEwen 2022)
| 4.4 | local resources and infrastructure |
The Project area
is remote, and no infrastructure is present in the Project area. There are no nearby towns and/or settlements. Exploration operations
are carried out by means of two-man camps within the Project development area.
Available Personnel
Historically, Villa
Calingasta was a mining town whose economy was supported by the exploitation of alum deposits, which is used in water purification and
gold mining at the Casposo mine. The United Nations Development Program (UNDP) and other national and international agencies have established
programs to help remediate certain environmental liabilities associated with the alum mining activity.
The current principal
economic activity of the area is agriculture with fruit trees (apple and walnut) as the principal activity, in addition to employment
in the public sector. Lesser activities include the following:
| · | Wood
manufacturing activities. |
| Project Los Azules – S-K 1300 Technical Report Summary | Project No.: 21139-01 | 4-51 |
| · | Tourism
(hotels, restaurants). |
| · | Commercial
activities (shops). |
| · | Public
service (health, safety, education). |
According to the
Argentine National Census Bureau (INDEC) 2010 census, the population of the Calingasta Department (subdepartment) was 8,453 people. In
2015, the population was estimated to be 9,151 and was projected to be 9,641 by 2022. The 2022 census was not available at the time of
writing this report.
Power
The 2022 PEA considers
the cost of connection at the existing Calingasta substation and routing a 220 kV powerline parallel to the Exploration Road. A study
by Energía Provincial Sociedad del Estado (Provincial Energy Society of the State, EPSE), a state-owned company, showed that the
province was well suited to support the development of projects providing renewable energy to the province and projects.
For the initial
phase of the project, an indicative price was received by YPF Luz that could provide 100% renewable power to the project for a cost of
$67 per MWh for a 5-year contract.
Water
Surface water is
available on the property in adequate amounts for McEwen Mining’s exploration activities. Preliminary hydrological evaluations
conducted by Ausenco Vector have indicated that there are sufficient sources of water to operate the Los Azules mining and processing
facilities and to provide the necessary fresh water needed to house employees at the mine site.
| 4.5 | topography, elevation and vegetation |
The Project is
in a broad valley, formed by faulting and glaciation, and is bounded by steep ridges to the east and west. The deposit is centered on
La Ballena Ridge (English translation: the whale), a low NNW-SSE trending ridge. The Project area is rugged and ranges in elevation from
3,500 to nearly 4,500 masl. Vegetation is sparse and is absent at higher elevations.
Long, narrow vegetated
areas (“vegas” in Spanish) occupy the valley floors on either side of La Ballena. The vegas areas are fed by ephemeral spring-water
and snowmelt, but also reflect the groundwater regime as well, with standing water levels at approximately 3,600 m in elevation. Springs
are noted at approximately 3,790 m in elevation upstream of the vegas along the west side of La Ballena Ridge. Groundwater-fed springs
and marshes are also noted around the range to the west of La Ballena between 3,800 and 3,900 m in elevation and along the eastern flank
of the Cordillera de la Totora. The vegas areas feed the westerly flowing Rio La Embarrada, which joins the Frío River to the
west before turning south into the Rio de las Salinas, a main tributary to the San Juan River.
Deposits of glacial
debris (morainal materials) and scree account for much of the surface area covering the Los Azules Deposit and adjacent mountainsides.
In the area of the deposit, these materials locally exceed 60 m in thickness, but on La Ballena Ridge, the cover is less, starting at
10 m thickness.
| Project Los Azules – S-K 1300 Technical Report Summary | Project No.: 21139-01 | 4-52 |
| 4.6 | Availability of Area for Mine and Processing
Facilities |
The area around
Los Azules provides limited options for siting of the Heap Leach Facility (HLF), Filtered Tailings Storage Facility (FTSF), Mine Rock
Storage Facility (MRSF), low-grade process stockpile, the processing facilities and other infrastructure needed. All facilities and permanent
infrastructure considered in this PEA are located within areas where ACMSA has both mining and surface rights, or a current easement
at this time.
The exact location
of the project development surface facilities is yet to be finalized and requires hydrogeologic and geotechnical site investigations
to support detailed design work to be performed.
The proposed Site
General Arrangement of the various project facilities is presented in Figure 1.4. This is further described in Sections 13, 14, and 15.
| Project Los Azules – S-K 1300 Technical Report Summary | Project No.: 21139-01 | 4-53 |
There are no formal
records of exploration in the Project area prior to 1980. The only important active project in the area prior to 1980 was the El Pachón
Porphyry Copper Project, now owned by Glencore plc (Glencore), which is located approximately 90 km south of Los Azules. Evidence of
prospecting (small trenches or pits) exists on some of the concessions.
In 1994, Minera
Andes, through its subsidiary Minera Andes S.A. (MASA), acquired lands in the southern portion of the Los Azules area. Battle Mountain
Gold Company (BMG) acquired lands immediately to the north through an option from Solitario Argentina S.A. (SASA). For the next couple
of years, both companies independently explored for gold on their respective land holdings.
In 1998, a new
access road was constructed by BMG while it conducted airborne geophysical surveys, mapping, trenching, and drilling several reverse
circulation (RC) holes. A large hydrothermal alteration zone associated with dacite porphyry intrusions and stockwork structural zones
was recognized in the Project area and Minera Andes signed a Letter of Intent with BMG to form a joint venture to explore the combined
land package.
In 1999, Minera
Andes and BMG signed a definitive joint venture agreement. BMG subsequently drilled additional RC holes and porphyry copper mineralization
was intersected close to the property boundary; however, no drilling was done on the Minera Andes properties.
In 2000, BMG merged
with Newmont Mining Corporation (NMC). No further work was done by BMG/NMC, and the joint venture was allowed to dissolve without BMG
earning any interest in the Minera Andes or Solitario lands. At that time, capitalizing on a surveying error, Mr. Hugo Bosque, an attorney
from San Juan, acquired a small strip of land between the Minera Andes and Solitario lands.
In 2003, MIM Argentina
S.A. (MIM) optioned the Bosque and Solitario lands and began exploration work. Independently, Minera Andes began exploration on its own
lands at Los Azules.
In 2005, a Letter
of Intent was drafted between Minera Andes and Xstrata Copper (successor to MIM) for earn-in rights on the combined land package. More
exploration occurred over the next couple of years.
International Copper
Mining, Inc was incorporated in British Columbia, Canada on March 2, 2006, to hold ownership of exploration properties including the
Los Azules property.
On November 2,
2007, Minera Andes Inc. entered into an Option Agreement with Xstrata whereby the exclusive right was granted to Minera Andes to explore
and evaluate the area called “Los Azules” which included several properties owned by Xstrata as defined in the Option Agreement.
On May 15, 2009,
the parties to the Option Agreement, together with Andes Corp. and Los Azules Mining, Inc. (LAMI), each wholly owned subsidiaries of
Minera Andes, signed an Assignment and Amending Agreement whereby Minera Andes properties “Azul 1” and “Azul 2”
were transferred to Andes Corp. together with the right to acquire from Xstrata 100% interest in and to the Los Azules properties (as
defined in the Option Agreement). In addition, Minera Andes S.A. assigned and transferred to LAMI all of MASA’s right, title, benefit,
and interest in, to and under the Option Agreement (as defined in the Assignment and Amending Agreement).
| Project Los Azules – S-K 1300 Technical Report Summary | Project No.: 21139-01 | 5-54 |
On May 29, 2009,
Los Azules Mining Inc., exercised the option, by delivery of an Earn-in Notice (pursuant to the Option Agreement as amended by the Assignment
and Amending Agreement) to acquire 100% interest in Los Azules properties (as defined in the Option Agreement). Therefore, Xstrata subsequently
transferred to Andes Corp. all its properties located in the Los Azules area.
On September 30,
2009, Xstrata elected not to exercise its option to acquire a 51% interest in the Project and has no remaining interests in Los Azules.
In January 2012,
Minera Andes Inc., was acquired by US Gold Corporation, which was subsequently renamed McEwen Mining.
Certain portions
of the northern part of the Project that were formerly held by Xstrata and transferred to Minera Andes following the termination of the
Option Agreement were subject to an underlying option agreement between Xstrata and a subsidiary of TNR Gold Corp. This agreement was
the subject of litigation in the Supreme Court of British Columbia, Canada.
The final Transfer
Agreement between TNR Gold Corp (along with Compañia Minera Solitario Argentina S.A.), and McEwen Mining (including Los Azules
Mining Inc. and Andes Corporacion Minera S.A.) was executed on October 16, 2014, superseding the prior settlement agreement and transferred
all rights on the Solitario Properties from TNR to McEwen Mining in exchange for an NSR royalty of 0.4% and TNR relinquishing the back-in
right. The NSR terms are subject to a Net Smelter Returns Royalty Agreement executed on October 29, 2014, between Compañia Minera
Solitario Argentina S.A. and Andes Corporacion Minera S.A.
International Copper
was continued from the province of British Columbia to the province of Alberta on December 31, 2012, as International Copper ULC. The
Corporation was converted to a limited liability corporation and changed its name to McEwen Copper Inc. by way of articles of amendment
dated August 20, 2021. At the creation of McEwen Copper Inc., the company held a 100% interest in the Los Azules Copper Project. McEwen
Mining Inc. also transferred a 100% interest in the Elder Creek Exploration Project to McEwen Copper to create a copper investment vehicle.
In 2018, ACMSA
filed a request to group all the Mining Permits together, file #1124.553-A-2018, in such a way that, once all surveys are approved, all
the Mining Permits be considered as one larger Mining Permit. If successful, this would allow investments to be distributed across the
larger permit group and eliminate the need to spend on each individual Mina.
In July 2021, a
private placement financing was initiated for McEwen Copper seeking to raise USD $80 million at a price of USD $10.00 per common share.
This financing, subsequently closed in full, in three tranches on August 23rd, 2021, June 21st, 2022, and August 31st, 2022, respectively.
On August 23rd, 2021, a company controlled by Robert R. McEwen (Chairman and Chief Executive Officer of McEwen Mining) purchased 4,000,000
shares for USD $40,000,000. On June 21st, 2022, the Victor Smorgon Group purchased 1,000,000 shares for $10,000,000 and other investors
purchased 500,000 shares for an additional $5,000,000. On August 30th, 2022, Nuton LLC (a Rio Tinto Venture) purchased 2,500,000 shares
for USD $25,000,000 and other investors purchased 185,000 shares for an additional USD $1,850,000. In total, 8,185,000 shares were sold
in the private placement for gross proceeds to McEwen Copper of USD $81,850,000.
| Project Los Azules – S-K 1300 Technical Report Summary | Project No.: 21139-01 | 5-55 |
During 2022, a
1.25% net smelter return (NSR) royalty was created encumbering the Los Azules Project, which is held by McEwen Mining Inc.
As of December
31, 2022, McEwen Copper had 25,685,000 common shares issued and outstanding on a fully diluted basis, of which 17,500,000 common shares
were owned (68.1%) by its parent company McEwen Mining Inc., and 8,185,000 common shares were owned by third parties and some affiliates.
The challenge by
ACMSA for the peripheral properties under threat of forfeiture, Gina, Sofia, Torora II, and Marcela, was resolved in the company’s
favor and the forfeited rights were returned by the Mining Council on December 29, 2022.
FCA Argentina S.A.,
a subsidiary of Stellantis N.V. (“Stellantis”), invested ARS $30 billion in Argentina to acquire shares of McEwen Copper
in a two-part transaction that closed on February 24th, 2023.
Nuton invested
$55 million to acquire shares of McEwen Copper in two transactions which closed on August 31, 2022, and March 15th, 2023.
Both the Stellantis
and Nuton investments included investor rights and product purchase rights, discussed in detail in Section 1.1.
As of 2023, ACSMA/McEwen
Copper continues to hold 100% of the Los Azules development, associated land holdings and mineral concessions and easements, while continuing
to perform seasonal infill drilling and studies with a view to eventual project development.
| Project Los Azules – S-K 1300 Technical Report Summary | Project No.: 21139-01 | 5-56 |
| 6.0 | geological setting, mineralization, and
deposit |
This section relies
heavily on geological studies conducted by Richard Sillitoe (2014) and Vázquez (2015) as well as other references cited in the
section. A description of the techniques used in the geological modelling used as a base for the mineral resource estimate is provided
later in Section 11.3.
Los Azules is a
porphyry copper deposit located in western San Juan Province in west-central Argentina. This region is characterized by a series of north-south
elongated mountain ranges that rise in altitude from east to west to form the rugged Andean Cordillera along the border between Argentina
and Chile. Los Azules lies within the highest altitude Cordillera Principal at an elevation of about 3,700 masl (Figure 6.1).
The Cordillera
Principal is composed of strongly folded, faulted, and elevated Paleozoic-Mesozoic sedimentary and volcanic lithologies (Gondwanide orogeny)
overlain by extensive Upper Miocene ignimbrites (Andean orogeny) as shown in Figure 6.2. Eocene to early Miocene volcaniclastic strata
in the region accumulated in an extensional basin followed by plutonic intrusion and contractional deformation from 19 Mya to 16 Mya.
These units were overlain and intruded by 16 Mya to 7 Mya volcanic flows and pyroclastic units with comagmatic 12 Mya to 8 Mya plutons
and porphyry systems. This was followed by a compressional event at 8 Mya to 5 Mya with important crustal shortening, thickening, and
regional uplift (Sillitoe and Perello, 2005). Figure 6.2 also shows the relative locations of other major mining projects in the area.
| Project Los Azules – S-K 1300 Technical Report Summary | Project No.: 21139-01 | 6-57 |
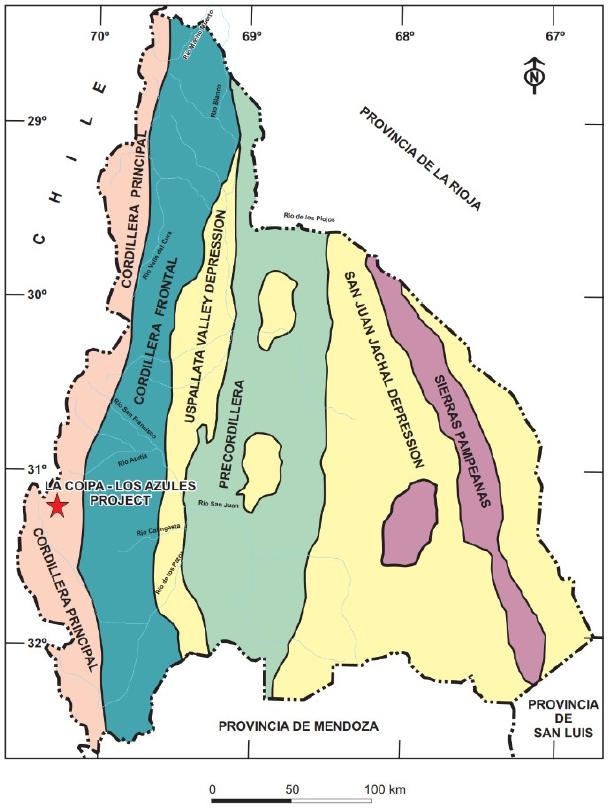
Figure 6.1:
Physiographic features of San Juan Province, Argentina (Rojas 2010)
| Project Los Azules – S-K 1300 Technical Report Summary | Project No.: 21139-01 | 6-58 |
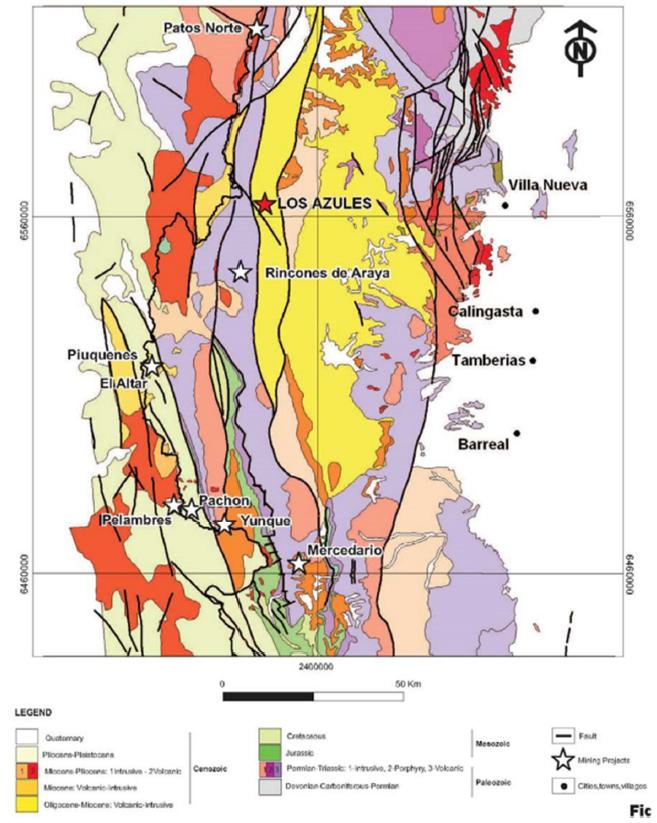
Figure 6.2:
Regional geology of the Andean Cordillera of Argentina and Chile (Rojas 2010)
| Project Los Azules – S-K 1300 Technical Report Summary | Project No.: 21139-01 | 6-59 |
Los Azules has
been geologically mapped on at least four separate occasions (Rojas, 2007; Zurcher, 2009; Almandoz, 2010; Pratt, 2010). The entire area
comprising the Los Azules Deposit is covered by thick scree or valley fill, so none of the rocks or structures are exposed in outcrop,
although some near-surface exposures have been exposed in shallow trenching at the crest of the La Ballena Ridge. Consequently, the interpretation
of the structures and intrusive bodies is based almost entirely upon drill hole data.
In many respects,
the Los Azules Deposit is a classic Andean-style porphyry copper deposit. In the bedrock below the surface cover, a barren leached zone
overlies a zone of secondary supergene enrichment of variable copper grades and thickness, and primary hypogene mineralization extends
to at least 1,000 m below the present surface. The Los Azules hydrothermal alteration system is at least 5 km long and 4 km wide and
is elongated in an NNW direction along a major structural corridor. The system disappears below volcanic cover to the north, so the overall
extent is unknown. The altered zone surrounds the Los Azules Deposit, which is approximately 4 km long by 2.5 km wide. The limits of
the mineralization along strike and at depth have not been entirely constrained by drilling. In fact, many of the holes in the core resource
area have been terminated in mineralization that exceeds the resource cut-off grade.
Hypogene minerals
include chalcopyrite, lesser bornite, chalcocite-digenite, idaite and trace molybdenite, magnetite and lesser hematite, usually deposited
on igneous mafic minerals. Chalcopyrite is the most important hypogene copper mineral in the upper levels of the deposit, and hypogene
bornite appears at deeper levels together with chalcopyrite. Copper sulfides rarely exceed 2% to 3% of rock volume. Intervals of 0.1%
to 0.35% copper are common in hypogene mineralization. Silver (approximately 1 gram/tonne), anomalous gold (up to approximately 150 parts
per billion) and molybdenum (up to approximately 600 parts per million) are reported in some intersections.
Circulation of
meteoric ground water leached primary sulfides (mainly pyrite and chalcopyrite) from the host rocks over the past several million years,
and the leached copper was redeposited below the water table in a sub-horizontal zone, or blanket, of supergene enrichment as secondary
chalcocite and covellite. The intensity of secondary enrichment diminishes with depth, except along major structures where it may extend
to great depth.
Starting at the
boundary between the barren leached zone and the supergene mineralization, secondary enrichment mineralization gradually transitions
to predominately hypogene mineralization at depth.
Sillitoe (2014)
examined about 9,000 m (approximately 25% at the time) of the available drill core and proposed a revised geologic interpretation for
Los Azules, which is shown in Figure 6.3.
Vázquez
(2015) subsequently relogged 44,000 m from 98 drill holes representing essentially all the drill core available at that time. Vázquez
confirmed Sillitoe’s interpretation, and he also refined the temporal sequence and spatial distribution of distinct phases of alteration
and mineralization.
| Project Los Azules – S-K 1300 Technical Report Summary | Project No.: 21139-01 | 6-60 |
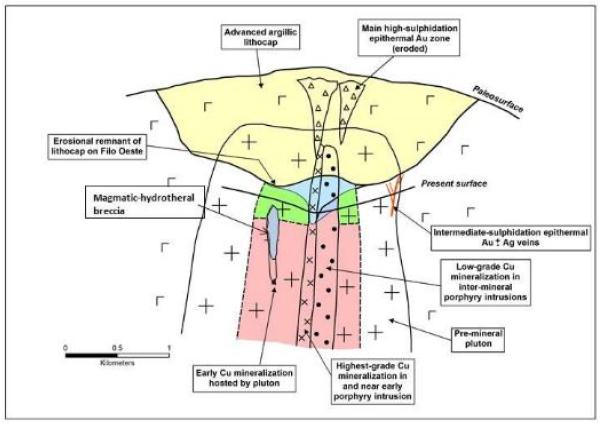
Figure 6.3:
Model for Los Azules (pink: potassic alteration, green: chloritic alteration, blue: sericitic alteration, yellow: advanced argillic lithocap),
(Sillitoe, 2014)
Sillitoe recognized
the presence and importance of an early mineralized porphyry dike phase of igneous intrusion. Much of the hypogene mineralization as
well as the supergene mineralization is associated with this phase; later dikes are not as well mineralized. Sillitoe referred to the
later dikes as “inter-mineral” stage dikes.
Vásquez
established the following chronological sequence of igneous and hydrothermal events at Los Azules, and these will be described in the
following sections.
| 1. | Intrusion
of dioritic stock or pre-mineral pluton (DIO / PMP). |
| 2. | Pervasive
chlorite-magnetite alteration accompanied by chalcopyrite mineralization in the upper levels
of the pluton grading into potassic alteration with chalcopyrite and bornite mineralization
at depth. |
| 3. | Intrusion
of the early mineralized porphyry dike phase (EMP). |
| 4. | Intrusion
of the later “inter-mineral” phase porphyry dikes (IMP) and formation of magmatic-
hydrothermal breccia bodies. |
| 5. | Late sericite
alteration accompanied by pyrite and chalcopyrite. |
| 6. | Formation
of erratic quartz veins containing base and precious metals. |
The most relevant
geologic features to the current project considered are briefly discussed in the following sub-sections.
| Project Los Azules – S-K 1300 Technical Report Summary | Project No.: 21139-01 | 6-61 |
Supergene Enrichment
Supergene mineralization
at Los Azules comprises a sub-horizontal chalcocite-covellite supergene blanket (“enriched” zone) that grades downwards through
a partially enriched zone of incomplete replacement (mixed hypogene-supergene sulfides) into underlying hypogene sulfide mineralization.
A sterile oxidized leached cap overlays the supergene blanket. Sillitoe considered that the enriched zone is immature because of the
relative youthfulness of the supergene processes, which was probably active only since about 4 Mya –5 Mya.
The leached cap
ranges from 0 m to 180 m thick and consists of oxidized and argillic-altered rock. Limonitic boxworks and disseminated spots of jarosite,
goethite, and hematite are common. Hematite is more abundant in the southern structural block; jarosite is best developed over the central
block, while goethite appears more widespread in the northern block (Zurcher, 2008a). Primary magnetite is altered to hematite, and ferrimolybdite
also occurs (after molybdenite), but copper minerals and sulfides are mostly absent (Rojas, 2008). Copper oxides are reported from the
margins of the leached zone and include brochantite, minor cuprite, copper pitch, and copper wad. Copper grades in the leached cap range
between 0.01% and 0.10%.
Beneath the leached
cap, a thin mixed sulfide-oxide zone gives way to a supergene sulfide zone where hypogene sulfides are replaced by chalcocite and minor
covellite. The supergene copper blanket is best developed in the central and central-northern structural sectors and is characterized
by a more jarositic oxide cap in the pyritic phyllic-altered zone located directly above the potassic alteration zone. Supergene (earthy)
chalcocite and minor covellite partially (or rarely) completely replace hypogene sulfides, but pyrite usually survives. Traces of native
copper and gypsum after anhydrite occur in the underlying potassic alteration zone.
The thickness of
the supergene chalcocite blanket typically varies between 60 m and 250 m but can penetrate to more than 400 m down structures. The intensity
of supergene mineralization gradually decreases with depth from the top of the zone, and there is typically no distinct lower limit or
boundary to the zone of enriched mineralization (Sim and Davis, 2015). Also, see Section 14 for a geostatistical review and explanation.
Copper values in
the supergene enriched zone vary between 0.4% Cu to greater than 1.0% in the north-central part of the system and decrease to 0.2% to
0.4% Cu in the south and peripheries. Supergene mineralization is the most important mineralization of economic interest at Los Azules.
Cyanide soluble
copper data is used to interpret the distribution of supergene enrichment mineralization. Mineralization with a ratio of cyanide soluble
copper content to total copper content >50% is “enriched”. See Section 11.3.6 for further details on the Copper Mineral
Zonation Model. The limits may be modified slightly in places to match mineralization observed in the drill core. Figure 6.4 shows the
enriched mineralization and the early mineralized dike. Lithology, alteration zones, and structures have been removed from the illustration
for clarity, except the early mineralized porphyry dike. Supergene mineralization penetrates all lithologies and alteration types, and
supergene mineralization appears to extend to greater depths along fault structures.
| Project Los Azules – S-K 1300 Technical Report Summary | Project No.: 21139-01 | 6-62 |
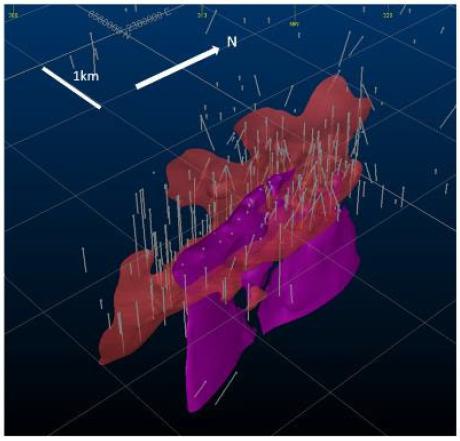
Figure 6.4: Early Mineralized Porphyry (magenta)
with supergene enrichment zone (red) defined as the Soluble Cu ratio >50%. (McEwen Copper, 2022)
Structural Geology
Triassic volcanic country rocks at Los Azules
are deformed into an anticline or monocline with the steep limb in west and the flat limb in the east (Pratt, 2010). The anticlinal axis
strikes north and may coincide with the NNW-striking structural corridor that controlled the locations of volcanic-intrusive centers in
the region during the upper Miocene (Rojas, 2008). Near Los Azules, this structural corridor appears to control the locations of porphyry
dikes, hydrothermal alteration, and mineralization zones along a seven-kilometer strike length including the Los Azules Porphyry System
(Rojas, 2008).
The porphyritic dikes at Los Azules were emplaced
along numerous, strong north-northwest and northwest striking faults (Zurcher, 2008a). Based on the few surface exposures, Zürcher
proposed a steep easterly dip for most of the north-northwest striking faults. Sillitoe and Vásquez both noted that evidence from
diamond drill core indicates that these structures were active as faults during as well as after the deposition of the mineralization
because post-mineral movement is evidenced by slickensides in areas with supergene mineralization.
Pratt (2010) interpreted a kinematic structural
model of the Los Azules Porphyry Copper Deposit. The Piuquenes Fault is part of the north-northwest striking “Vegas” fault
system described by Rojas (2008). The northwest-striking faults were named Azules by Rojas (2008). Porphyry-related quartz veins (blue)
and deeper level and older (than epithermal) alunite and vuggy quartz silicified ribs (red) are shown in Figure 6.5.
| Project Los Azules – S-K 1300 Technical Report Summary | Project No.: 21139-01 | 6-63 |
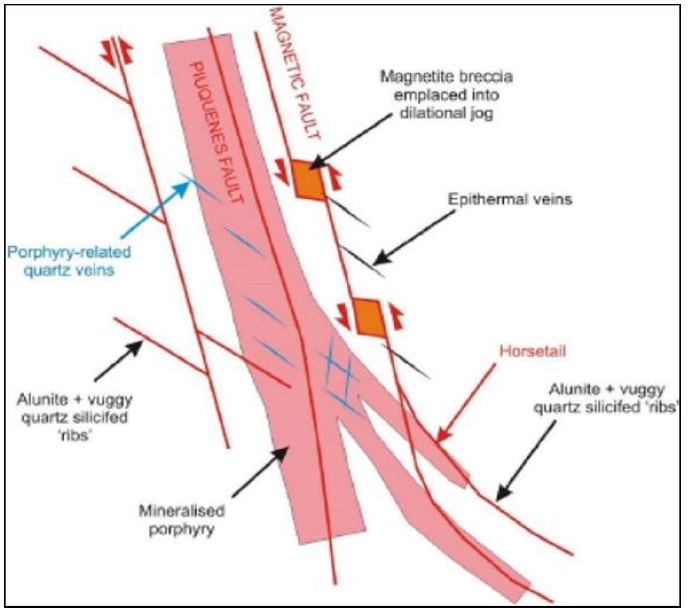
Figure 6.5: Kinematic structural interpretation
of Los Azules porphyry copper deposit (Pratt 2010)
Battle Mountain Gold explored Los Azules during
1998-1999 for gold and drilled three at La Hoya in the extreme northwest of the area, without significant success. The company may have
been attracted by hydrothermal breccias with associated kaolinite-illite-dickite-quartz-alunite alteration that are reported in volcanic
lithologies intruded by small intrusions and dikes of feldspar porphyry in the Cerros Centrales (Cerro Oeste) area.
Indications of potential gold-silver mineralization
around the Los Azules porphyry copper system include late-stage, intermediate-sulfidation epithermal quartz veins described by Pratt (2010).
The existence of a thick leached cap and supergene
chalcocite blanket at Los Azules indicates that oxidation, dissolution, vertical transportation and redeposition of copper occurred in
the system. Copper may also have been transported laterally away from the deposit and redeposited to form so-called “exotic”
copper mineralization (Sillitoe, 2010). No exploration for this style of mineralization has yet been undertaken in the vicinity of Los
Azules.
| Project Los Azules – S-K 1300 Technical Report Summary | Project No.: 21139-01 | 6-64 |
Los Azules is located within the Central Chile
segment (400 km-long) of the Miocene-early Pliocene porphyry copper belt (6,000 km-long) of the North and Central Andes as shown in Figure
6.6. The figure also shows locations of the major porphyry copper and related epithermal deposits, limits of the porphyry copper belt
and permissive northwest-trending structural corridors that influence the location of mineralization along the porphyry belt. Porphyry
copper deposits in this sub-belt include the world-class Los Pelambres (Cu-Mo), Rio Blanco-Los Bronces (Cu-Mo) and El Teniente (Cu-Mo)
Porphyry Deposits, the Maracunga Belt Porphyries (Cu-Au) in Chile and El Pachón (Cu) and Bajo de la Alumbrera (Cu-Au) in Argentina,
as well as numerous other porphyry and related deposits (Sillitoe and Perello, 2005).
Panteleyev (1995) describes the common features
of porphyry deposits as large zones of hydrothermally altered rock containing quartz veins and stockworks, sulfide-bearing veinlets, fractures,
and lesser disseminations in areas up to 10 km2 in size. These are commonly associated intrusion breccias and/or dike swarms.
Deposit boundaries are determined by economic
factors that define mineralized zones located within larger areas of low-grade, often concentrically zoned mineralization. Important geological
controls on porphyry mineralization include igneous contacts, cupolas and the uppermost, bifurcating, parts of stocks and dike swarms.
Intrusive and hydrothermal breccias and zones of intensely developed fracturing, respectively due to intersecting or parallel multiple
mineralized fracture sets, commonly coincide with the greatest metal concentrations.
Surface oxidation commonly modifies porphyry deposits
in weathered environments. Low pH meteoric waters leach copper from the oxide zone, which is then transported and redeposited as secondary
chalcocite and covellite, usually immediately below the water table to form sub- horizontal, tabular zones of supergene copper enrichment.
This process forms a copper-poor leached cap above a relatively thin, but often high-grade, zone of supergene copper enrichment that itself
caps a thicker zone of often moderate grade hypogene copper mineralization at depth.
| Project Los Azules – S-K 1300 Technical Report Summary | Project No.: 21139-01 | 6-65 |
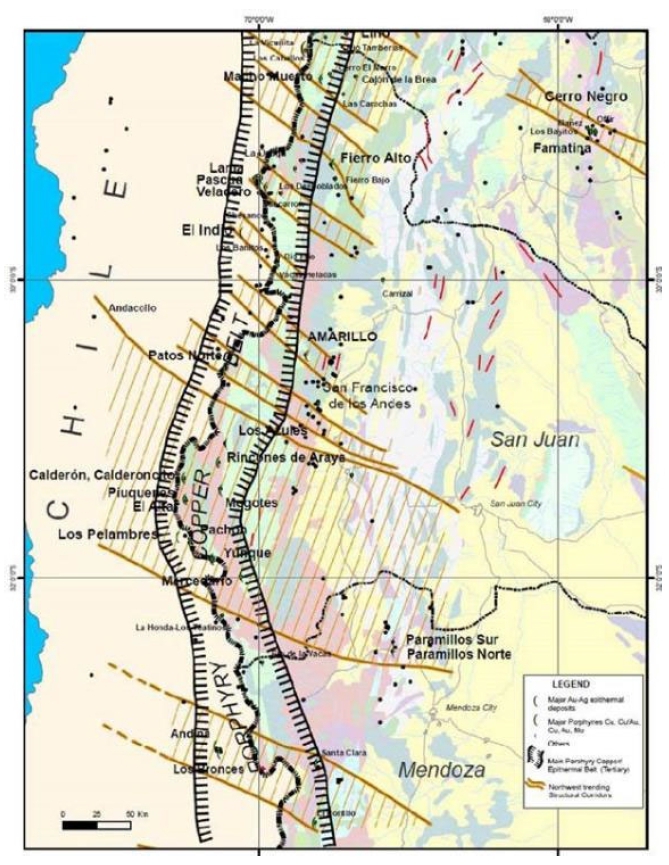
Figure 6.6: Part of the Central Chile Segment
of the Miocene-early Pliocene Porphyry Copper Belt (Rojas 2008)
| Project Los Azules – S-K 1300 Technical Report Summary | Project No.: 21139-01 | 6-66 |
Other deposit styles often spatially, temporally,
and genetically associated with porphyry deposits include:
| · | Exotic copper deposits, formed by the lateral migration of copper-bearing fluids away from the main body
of porphyry mineralization. |
| · | Mineralized breccia pipes, skarns, sedimentary replacements (mantos) and precious metals-bearing mesothermal-epithermal
vein deposits located peripheral to and progressively distant (laterally and vertically) from the porphyry copper center as shown in Figure
6.7. |
The figure shows the spatial relationships between
a porphyry copper system and its surrounding environment, including host rocks and peripheral styles of mineralization such as skarns,
carbonate replacement (chimney-manto), sediment-hosted disseminated sulfides, mesothermal polymetallic veins, and higher-level high/intermediate/low
sulfidation epithermal gold-silver veins and disseminated deposits.
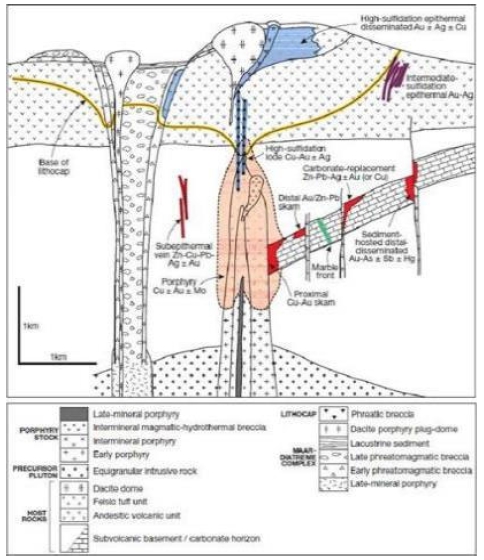
Figure 6.7: Diagram Showing Spatial Relationships
between a Porphyry Copper System and the Surrounding Environment (Sillitoe 2010)
| Project Los Azules – S-K 1300 Technical Report Summary | Project No.: 21139-01 | 6-67 |

Figure 6.8: Example Cross-Section (Section
40) of the Deposit showing the Main Lithological Units
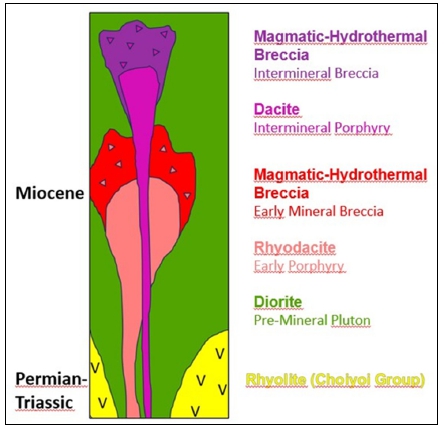
Figure 6.9: Generalized Volcano-Stratigraphic
Column of the Los Azules Copper Porphyry Deposit
| Project Los Azules – S-K 1300 Technical Report Summary | Project No.: 21139-01 | 6-68 |
Exploration at Los Azules commenced in the mid-1990s
and has included various studies of geology, geophysics, and geochemistry, as well as drilling with both reverse circulation and diamond
core drills, sampling and analysis of surface and drill core samples, and road construction. Exploration was conducted successively, and
sometimes in cooperation, by Battle Mountain Gold, MIM-Xstrata, and Minera Andes/McEwen Mining and McEwen Copper, principally by the latter
company.
| 7.2 | Geological Mapping and Studies |
The most comprehensive and up-to-date geological
map of Los Azules was produced by Pratt and Bolsover in 2010, as described in Section 6.2. An earlier detailed geological map, with cross
sections, was compiled by Rojas (2007); Almandoz (2010b) produced a geological map at a 1:5000 scale, and Zürcher (2008a) made a
detailed map of the central portion of the north-northwest-trending La Ballena Ridge that focused on hydrothermal alteration and mineralization.
Petrographic studies of polished sections collected
by Zurcher from drill cores, and surface samples were initially studied by DePangher (2008) in Oregon, and then by GEOMAQ in Santiago
de Chile (Rojas, 2010). Zurcher (2008b) reported a series of U-Pb age dates for the igneous intrusions.
In 2014, Sillitoe examined about 9,000 m (approximately
25% at the time) of the diamond drill core and proposed a revised geologic interpretation for Los Azules, which is described in Section
6.2. Sillitoe recognized the presence and importance of an early mineralized porphyry dike phase of igneous intrusion. Much of the hypogene
mineralization as well as the supergene mineralization is associated with this phase; later dikes are not as well mineralized. In 2015,
Vázquez relogged 44,000 m from 98 drill holes representing essentially all the drill core at the time. Vázquez confirmed
Sillitoe’s interpretation, and he also refined the temporal sequence and spatial distribution of distinct alteration phases and
mineralization zones as described in Section 6.2.
Various geophysical studies were conducted at
Los Azules by Battle Mountain Gold and by MIM-Xstrata respectively in 1998-1999 and 2004 and by Minera Andes (Quantec) in early 2010 and
McEwen Mining (Quantec) in 2012. Work done and results for these surveys are described in the following section.
7.3.1 Battle Mountain Gold (1998-99)
GEODATOS, a Chilean geophysical company, conducted
an airborne geophysical survey in early 1998. The survey covered a 20 km by 10 km area elongated east-west including the Los Azules and
Paso de la Coipa areas.
Results suggested the existence of a structural
corridor striking northwest and structures striking east- northeast associated with strong to moderate magnetic low signatures in the
Los Azules mineralized body. A total field magnetic plot identified a magnetic high anomaly surrounding a central magnetic low that extended
6 km north-northwest and 3 km northeast as shown in Figure 7.1. Battle Mountain Gold interpreted the magnetic low as altered rocks associated
with the mineralized body.
| Project Los Azules – S-K 1300 Technical Report Summary | Project No.: 21139-01 | 7-69 |
Four lines of induced polarization (IP) were oriented
east-west averaging two kilometers long and spaced at 600 m to 900 m apart. The lines were positioned to cross the locations of mineralized
drill holes LA04-98, LA-06-98, and LA-08-98. IP results indicated high chargeability and low resistivity corresponding with the location
of the Los Azules porphyry copper deposit.
Two ground magnetic surveys totaling 103 km were
conducted in the Los Azules mineralized porphyry and the nearby Sector Mantos, which is 1 km west of Cerro Oeste.
Lines were oriented east-west at 100 m spacing
and 10 m stations. Results confirmed the existence of north-northwest- and north-northeast-striking structures as indicated by aeromagnetics.
Results also confirmed the presence of a magnetic low anomaly in the vicinity of drill holes LA-98-04, LA-98-06 and LA-98-08 and suggested
the presence of a magnetic low along the alteration system of La Ballena Ridge as shown on Figure 7.1.
| Project Los Azules – S-K 1300 Technical Report Summary | Project No.: 21139-01 | 7-70 |
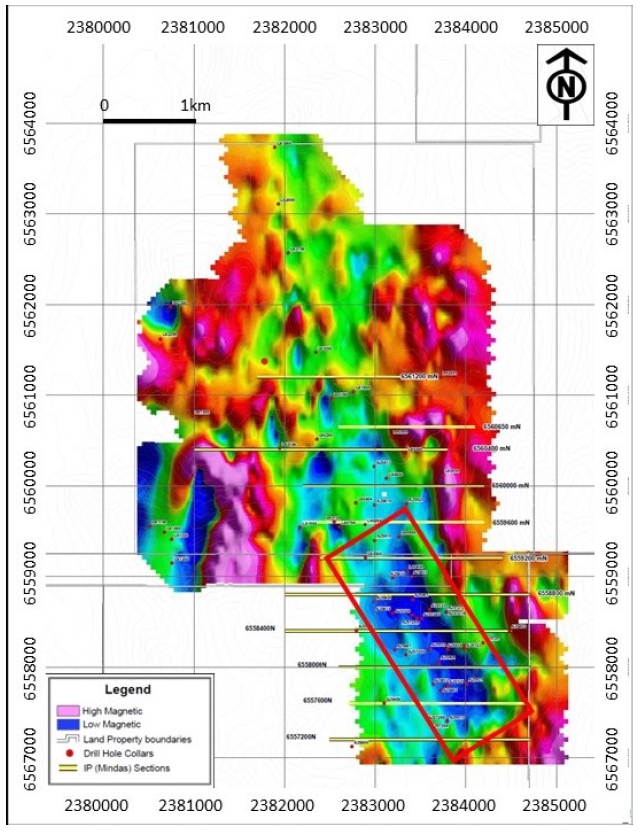
Figure 7.1: Magnetic Map of Los Azules (Reduced
to Pole) and IP lines. (Rojas, 2008 after Xstrata, 2003). Note: Red box indicates the mag low across the Ballena Ridge.
| Project Los Azules – S-K 1300 Technical Report Summary | Project No.: 21139-01 | 7-71 |
7.3.2 MIM Xstrata (2003-2004)
During 2003-2004, MIM-Xstrata carried out a magnetic
survey of approximately 70 km at Los Azules. Lines were oriented east-west across the area controlled by the company at that time. In
addition, MIM-Xstrata ran six lines of MIMDas (MIM-Xstrata proprietary IP system) east-west totaling 11.8 km. At the request of Minera
Andes, MIM-Xstrata extended their geophysical lines south into Minera Andes ground completing five additional lines for a total of 11.3
km in 2004. Total surveying by MIMDas was 23.1 km.
Magnetometry indicated a magnetic low beneath
the Los Azules porphyry copper system and suggested that it extended north-northwest towards the La Hoya Zone (Cerros Oeste and Este).
The total field plot identified a magnetic high anomaly surrounding the magnetic low. The magnetic low extends 7 km to 8 km north-northwest
and up to 2 km east-northeast confirming the interpretations made by Battle Mountain Gold.
MIMDas IP surveying (2003-2004) indicated high
resistivity in the north-northwest zones at Los Azules with much lower resistivity within the porphyry copper system. Chargeability is
relatively low to the north but becomes much lower at the porphyry although it increases significantly at depth. These results reflect
the occurrence of more superficial sulfides in the Lagunas area of the system (north of the porphyry deposit) and a thicker leached cap
in the more altered part of the system.
7.3.3 Minera Andes TITAN 24 Survey (2010)
Titan-24 DCIP-MT data were acquired at Los Azules
during April and May 2010 by Quantec Geoscience Ltd., on behalf of Minera Andes Inc. The survey consisted of twelve parallel lines and
each line comprised one single spread of 3.6 km, except for L63450 N that was 3.3 km long. Full MT tensor data was acquired in all the
lines and DCIP was collected in all but two of the lines. In total, ten spreads of DC and IP data were acquired covering 35.7 km and twelve
spreads of MT covering 42.9 km.
Over 130 IP anomalies were identified. Of these,
20 were classed as priority 1, 20 as priority 2, and 12 as priority 3. The priority 1 anomalies are larger targets, at least 200 m across,
and described by Quantec as being consistent with the porphyry and near- porphyry mineralization model.
Two large, deep resistivity anomalies, one high
to the east, under the Los Azules mineralization, and one low to the west are well defined by the MT survey. The width of the anomalies
is 800 m to 1 km for the resistivity low and 500 m to 800 m for the resistivity high. Quantec postulated that the deep anomalies are most
likely related to conductive sulfides, perhaps in a disseminated pyrite/sulfide shell surrounding a concealed porphyry intrusion. These
anomalies, which are referred to as the “Southwest Target”, are the targets that were tested in Hole T-01B in 2011 and Hole
1279 in 2012 (Figure 7.2).
| Project Los Azules – S-K 1300 Technical Report Summary | Project No.: 21139-01 | 7-72 |
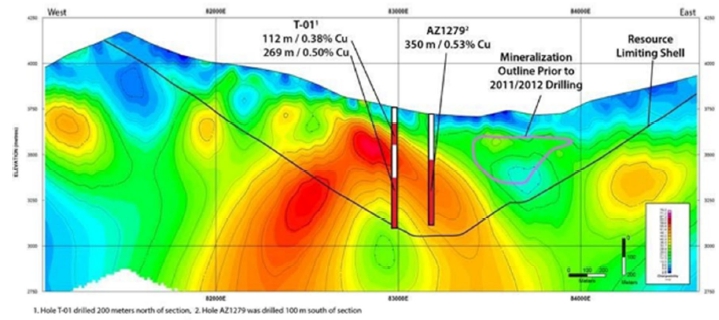
Figure 7.2: Section 58,400N Showing 2D IP
Inversion Anomaly (Southwest Target) (McEwen 2012).
7.3.4 McEwen Mining: Ground Magnetic Survey (2012)
During January 2012, Quantec Geoscience Argentina
S.A. performed a ground magnetic survey on the southwest portion of the Project. The data was presented as maps of the Total Magnetic
Field, Reduction to the Pole transform, Analytic Signal, Tilt Derivative and First Vertical Derivative.
Figure 7.3 is the Total Magnetic Field map for
the 2012 survey overlain on the image shown in Figure 7.1. The 2012 magnetic data shows a discontinuous north-northwest trending magnetic
low southwest of and roughly parallel to the prominent magnetic low that corresponds to the location of the main Los Azules Deposit.
Areas of high magnetic response indicate the presence
of elevated levels of magnetic minerals, such as magnetite, pyrrhotite, and hematite, whereas areas of low magnetic response may be caused
by alteration processes such as magnetite destruction or may simply indicate rock types with no magnetic minerals. This anomaly was tested
with one drill hole during the 2012 season and intersected only traces of copper mineralization.
| Project Los Azules – S-K 1300 Technical Report Summary | Project No.: 21139-01 | 7-73 |
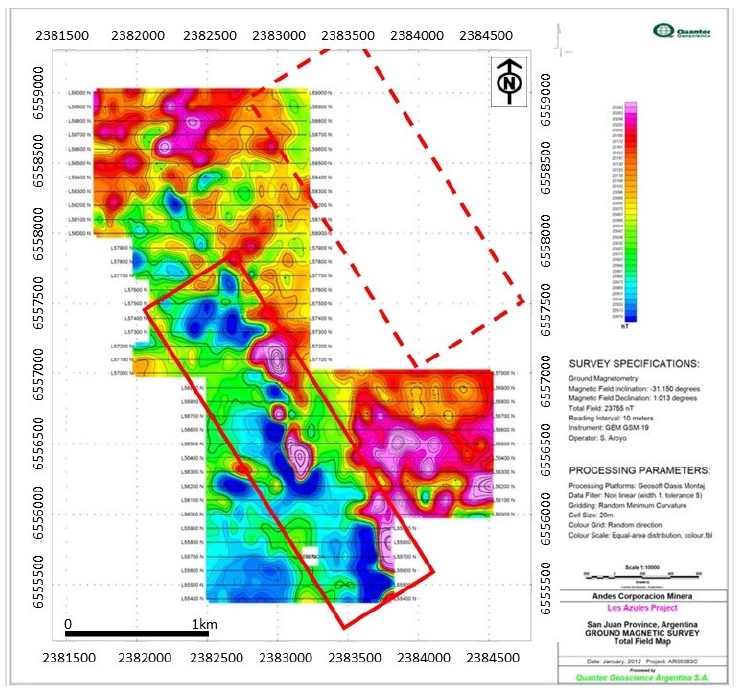
Figure 7.3: Total Magnetic Field Map of Los
Azules. (Quantec, 2012). Note: Dashed red box indicates the mag low across the Ballena Ridge seen above in Figure 7.1 – the
solid red box indicates the discontinuous mag low to the southwest.
| 7.4 | SURVEYS AND INVESTIGATIONS |
Mineral exploration at Los Azules has been carried
out successively by Battle Mountain Gold, MIM-Xstrata and Minera Andes-McEwen Mining, McEwen Copper and/or professional consultants or
contractors employed by these companies.
In 2017, McEwen Mining engaged consultant Rodrigo
Diaz to conduct an evaluation of remote spectral geology (RSG) over a 17 km by 20 km area at Los Azules and later extended to include
an area 38 km by 42 km. Spectral data of Landsat 8 (30-15 m pixel and 16-bit radiometric resolution), spectral data of Aster (30-15 m
pixel and 8-bit radiometric resolution) were selected and used; additionally, spectral data of the Sentinel 2 (20-10 m pixel and 16-bit
radiometric resolution) and Sentinel 1-Radar (10 m pixel).
| Project Los Azules – S-K 1300 Technical Report Summary | Project No.: 21139-01 | 7-74 |
In 2022, McEwen Copper undertook a program of
continuous hyperspectral scanning and high-resolution core photography on the entire available archive of drill core completed in 2022
and previous programs stored at Calingasta. By July 2022, this represented some 64,000 m of scanned material available to augment completion
of an updated geological model and support the design of the ongoing metallurgical program. This work is expected to be a protocol for
all future drill programs.
Also in 2022, McEwen Copper engaged the services
of Murphy Geological Services to complete a structural interpretation of Sentinel-2 and high-resolution imagery of the Los Azules property
and immediate surrounding area. Sentinel-2 is a new earth observation sensor with 13 spectral bands having resolutions up to 10 m which
was launched by the European Space Agency in June 2015 and is a significant improvement on the 15 m resolution pan-sharpened Landsat-7
and ASTER data and allows more detailed structural analysis. An interpretation of a 45 km (E-W) by 35 km (N-S) Sentinel-2 extract centered
on Los Azules was undertaken at up to 1:10,000 scale and a more detailed structural analysis of high-resolution satellite imagery for
Los Azules Project area at up to 1:2,000 scale.
Completion of the Diaz work in 2017 and Murphy
work in 2022 is foundational to designing and re-establishing more regional reconnaissance exploration at Los Azules.
The goals of future exploration at Los Azules
include the establishment of upside potential on the property, ongoing geological model refinements, deposit growth, resource category
upgrades, and identification/discovery of new porphyry mineralization as extensions of the Los Azules Deposit, as well as new porphyry
systems.
Future exploration work programs should carry
out reconnaissance study, field mapping, geophysical surveying, and core drilling to achieve these goals. More specifically, these activities
should include:
| · | An updated regional scale Spectral study for alteration definition, characterization of known mineralization,
and generation of new targets. |
| · | Satellite-based litho-structural mapping to complement updated spectral study. |
| · | Reconnaissance geological mapping and geochemistry to increase geological and structural understanding
of the known mineralization, to ground truth interpretations of the satellite mapping study and identification or refinement of potential
exploration target areas. |
| · | Continue core relogging and validation versus hyperspectral scanning results to ensure a unified geological
model of the deposit supported by all datasets from current and historic programs. |
| · | Reprocessing of the raw 2010 Quantec Titan Survey data. |
| · | Strategic core drilling of interpreted Los Azules Deposit extensions and over selective high-quality exploration
targets to be generated on the property. |
| · | Continued infill core drilling to upgrade the priority portion of the resource based on goals of the planned
Feasibility Study. |
| Project Los Azules – S-K 1300 Technical Report Summary | Project No.: 21139-01 | 7-75 |
Drilling programs have been undertaken at Los
Azules between 1998 and 2023 by four different mineral exploration companies including BMG, MIM Argentina (now Glencore), Minera Andes/McEwen
Mining and McEwen Copper. Drilling included reverse circulation programs mostly for gold exploration and diamond drilling focusing on
supergene and hypogene porphyry-style copper mineralization. Descriptions of these programs are detailed in the following sections. Table
7.1 provides a summary of the drilling information.
| Table 7.1: Exploration Drilling by Year and by Company |
| Year |
Company |
No. of holes |
Meters |
| 1998 |
Battle Mountain Gold |
16 |
3,614 |
| 1999 |
Battle Mountain Gold |
8 |
2,067 |
| 2004 |
Glencore Xstrata (MIM) |
4 |
864 |
| 2003 - 2004 |
Minera Andes |
9 |
2,064 |
| 2005 - 2006 |
Minera Andes |
11 |
2,602 |
| 2006 - 2007 |
Minera Andes |
17 |
3,501 |
| 2007 - 2008 |
Minera Andes |
18 |
5,469 |
| 2009 - 2010 |
Minera Andes |
28 |
10,229 |
| 2010 - 2011 |
Minera Andes |
44 |
10,405 |
| 2011 - 2012 |
McEwen Mining |
8 |
2,830 |
| 2012 – 2013 |
McEwen Mining |
22 |
15,873 |
| 2017 |
McEwen Mining |
17 |
6,469 |
| 2018 |
McEwen Mining |
79 |
4,274 |
| 2022 |
McEwen Copper |
65 |
23,811 |
| 2023 |
McEwen Copper |
93 |
22,592 |
| Total |
|
439(1) |
116,664 |
| 1. | This table includes all drilling that has occurred on the property. Some holes were redrilled due to drilling difficulties and are
not included in the database. Holes that were started in one season and completed the following season are counted in the year they were
started, but the meters drilled in each season are shown for the respective seasons. The drilling reflects all holes to the effective
date of May 9th, 2023. |
| Project Los Azules – S-K 1300 Technical Report Summary | Project No.: 21139-01 | 7-76 |
The drill plan showing collar locations by the
year drilled is shown in Figure 7.4.
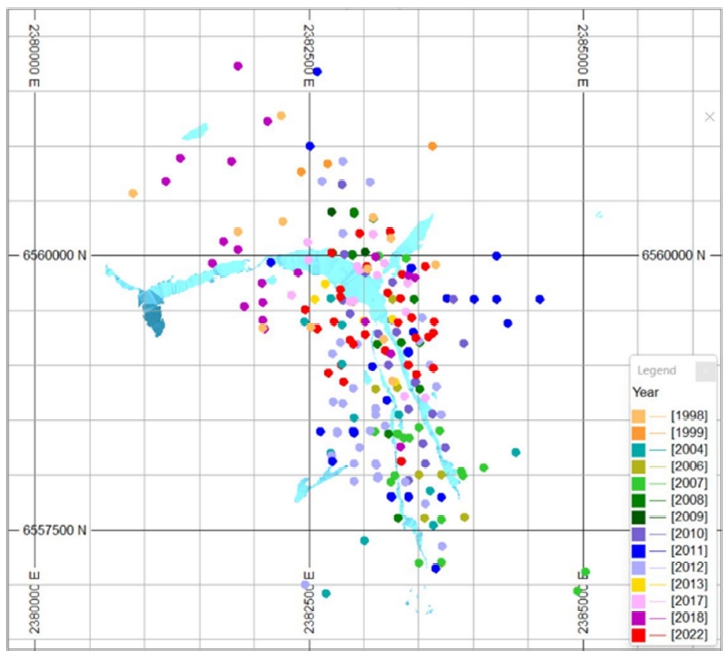
Figure 7.4: Plan Showing Locations of drill
holes at Los Azules (CRM 2022)
7.6.1 Drilling Procedures and Conditions
Drilling by McEwen Mining Inc. was contracted
to various drilling companies including Connors Drilling, Patagonia Drill Mining Services, Adviser Drilling, Boland Minera, Major Drilling,
Foraco Argentina, HG Perforaciónes, Conosur, and Boart Longyear. Drilling conditions have been particularly difficult, especially
in faulted intersections or in areas of unconsolidated surface scree/talus.
7.6.2 McEwen Copper (2022-2023)
Over the period of two drilling seasons from January
2022 to May 2023, McEwen Copper completed 40,815 m of core drilling in 99 holes. The primary purpose of the drilling was for mineral resource
upgrading from Inferred to Indicated (66 holes for 28,221 m) and metallurgical purposes (33 holes for 12,594 m). A further 59 holes for
5,588 m drilled by RC, core and sonic drilling methods were used for geotechnical, hydrological, and ground investigation work in the
area. Figure 7.4 shows the location and distribution of Los Azules drill holes based on core and RC drilling methods.
| Project Los Azules – S-K 1300 Technical Report Summary | Project No.: 21139-01 | 7-77 |
7.6.3 Logging
Samples taken from drill holes at Los Azules are
logged at the Project camp by geologists employed or contracted by McEwen Copper. Sampling procedures are described in Section 8.2. Emphasis
is given to recording rock-types, alteration associations, types and distribution of mineralization, and the presence of various types
of veinlets and structures. These features are logged onsite (Figure 7.5) and then transferred to a digital database.
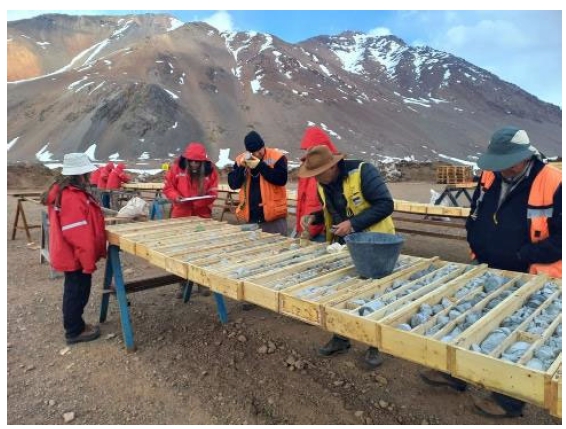
Figure 7.5: Logging and inspection of drill
core
Geotechnical observations and parameters are recorded,
including percentage of core recovery, RQD, Schmidt Hammer hardness determinations, point load testing, fracture density and angle relative
to the length of the hole, as well as fracture fill material (Figure 7.6). This information is transferred to the digital database.
| Project Los Azules – S-K 1300 Technical Report Summary | Project No.: 21139-01 | 7-78 |
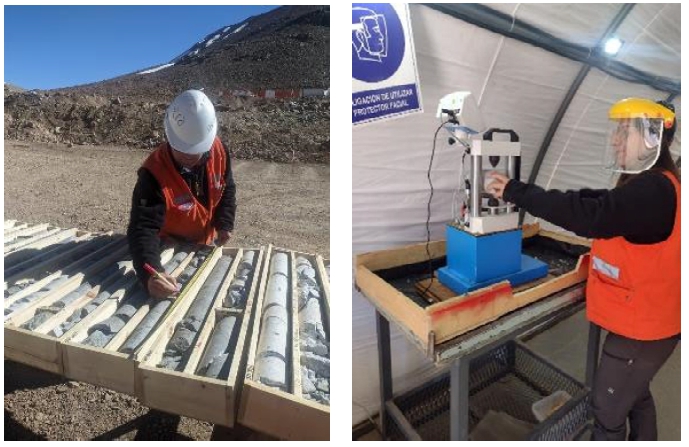
Figure 7.6: Geotechnical logging and data
collection
Log sheets are coded, and details recorded for
interval depth, interval width, lithology, alteration types, alteration intensities, alteration minerals, structure, percentage vein quartz,
percentage total disseminated sulfides, mineralization minerals, mineral zone (hypogene or supergene), including observations of jarosite,
goethite, hematite, covellite, chalcocite, pyrite, chalcopyrite, bornite among others.
7.6.4 Surveys
According to McEwen Copper staff, downhole surveying
is done on drill holes by the drilling contractors using REFLEX and/or Sperry-Sun tools. Density determinations were made for 915 drill
core samples prior to the 2022 drill program. During the 2022 campaign, a program of hyperspectral scanning of the entire available core
archive of some 64,000 m was completed.
7.6.5 Drill Hole Results
There are a total of 439 drill holes in the Los
Azules database, with a cumulative length of 116,664 m. A summary of the significant drilling results is found in Table 7.2 for campaigns
prior to 2018, while Table 7.3 displays results for the 2022 drilling campaign.
| Project Los Azules – S-K 1300 Technical Report Summary | Project No.: 21139-01 | 7-79 |
Drilling has confirmed the presence of a hypogene
porphyry copper deposit in a continuous body, as well as the presence and continuity of an overlying supergene chalcocite enrichment blanket.
The extent of the mineral resource measures approximately 4 km north-south by 1.5 km west-east. Many of the drill holes in the central
and northern parts of the deposit have been terminated in mineralization that exceeds the 2017 IA base case cut-off grade of 0.20% Cu.
Drilling during the 2012-2013 campaign extended the depth of the mineralized system in the southwestern part of the deposit to at least
1,000 m.
| Table 7.2: Examples of Significant Drilling Results Prior to 2022 |
| Drill Hole ID |
TD (m) |
Intersection |
Interval (m) |
Total Copper (%) |
| From (m) |
To (m) |
|
|
| AZ0401 |
195.0 |
130.0 |
195.0 |
65.0 |
0.62 |
| Including |
150.0 |
192.0 |
42.0 |
0.82 |
| AZ0402 |
330.5 |
164.0 |
304.0 |
140.0 |
0.38 |
| Including |
164.0 |
190.0 |
26.0 |
0.47 |
| Including |
230.0 |
304.0 |
74.0 |
0.42 |
| AZ0404 |
300.8 |
162.0 |
282.0 |
120.0 |
0.54 |
| Including |
162.0 |
202.0 |
40.0 |
0.59 |
| Including |
236.0 |
282.0 |
46.0 |
0.64 |
| AZ0407 |
168.8 |
96.0 |
152.0 |
56.0 |
0.44 |
| Including |
126.0 |
152.0 |
26.0 |
0.58 |
| AZ0610 |
261.4 |
174.0 |
261.4 |
87.4 |
0.83 |
| AZ0611 |
270.7 |
112.0 |
270.7 |
158.7 |
0.51 |
| AZ0614 |
224.6 |
132.0 |
180.0 |
48.0 |
1.13 |
| Including |
136.0 |
158.0 |
22.0 |
1.40 |
| AZ0617 |
183.5 |
66.0 |
183.5 |
117.5 |
0.63 |
| Including |
66.0 |
124.0 |
58.0 |
0.84 |
| AZ0619 |
299.4 |
78.3 |
299.4 |
221.2 |
1.62 |
| Including |
78.3 |
116.0 |
37.8 |
2.22 |
| Including |
134.0 |
146.0 |
12.0 |
3.94 |
| AZ0620 |
253.3 |
80.0 |
226.0 |
146.0 |
1.10 |
| Including |
80.0 |
106.0 |
26.0 |
1.54 |
| AZ0722 |
271.2 |
119.0 |
155.0 |
36.0 |
0.99 |
| AZ0724D |
278.2 |
124.0 |
160.0 |
36.0 |
0.79 |
| AZ0729B |
226.9 |
130.0 |
214.0 |
84.0 |
0.73 |
| Including |
172.0 |
204.0 |
32.0 |
0.94 |
| AZ0730 |
342.6 |
123.0 |
323.8 |
200.8 |
0.89 |
| Including |
140.0 |
253.0 |
113.0 |
1.04 |
| AZ0832 |
420.0 |
80.0 |
140.0 |
60.0 |
0.78 |
| AZ0833 |
387.8 |
73.0 |
313.0 |
240.0 |
0.94 |
| AZ0837A |
541.0 |
326.0 |
516.0 |
190.0 |
0.82 |
| AZ0841 |
400.2 |
241.0 |
285.0 |
44.0 |
1.83 |
| AZ0843 |
176.0 |
67.0 |
131.0 |
64.0 |
0.69 |
| Project Los Azules – S-K 1300 Technical Report Summary | Project No.: 21139-01 | 7-80 |
| Table 7.2: Examples of Significant Drilling Results Prior to 2022 |
| Drill Hole ID |
TD (m) |
Intersection |
Interval (m) |
Total Copper (%) |
| From (m) |
To (m) |
|
|
| AZ0946 |
469.4 |
110.0 |
469.4 |
359.4 |
0.63 |
| Including |
115.0 |
260.0 |
145.0 |
1.08 |
| AZ1047 |
493.1 |
74.0 |
493.1 |
419.1 |
0.50 |
| Including |
102.0 |
182.0 |
80.0 |
0.92 |
| AZ1048 |
466.1 |
105.0 |
466.1 |
361.1 |
0.77 |
| Including |
123.0 |
339.0 |
216.0 |
1.01 |
| AZ1049 |
491.2 |
62.0 |
491.2 |
429.2 |
0.75 |
| Including |
62.0 |
298.0 |
236.0 |
1.05 |
| AZ1050 |
408.5 |
94.0 |
408.5 |
314.5 |
0.30 |
| Including |
94.0 |
132.0 |
38.0 |
0.68 |
| AZ1051 |
620.2 |
69.0 |
620.2 |
551.2 |
0.35 |
| Including |
363.5 |
426.0 |
62.5 |
1.12 |
| AZ1052 |
425.0 |
103.0 |
425.0 |
322.0 |
0.42 |
| AZ1053A |
650.0 |
48.9 |
650.0 |
601.1 |
0.54 |
| Including |
122.0 |
230.0 |
108.0 |
1.03 |
| AZ1055 |
408.5 |
116.0 |
408.5 |
292.5 |
0.55 |
| AZ1056 |
295.3 |
70.0 |
295.3 |
225.3 |
0.47 |
| Including |
192.0 |
223.0 |
31.0 |
0.88 |
| AZ1057 |
503.6 |
173.0 |
503.6 |
330.6 |
0.43 |
| Including |
173.0 |
225.0 |
52.0 |
0.84 |
| Including |
255.0 |
293.0 |
38.0 |
0.83 |
| AZ1058 |
451.8 |
70.0 |
451.8 |
381.8 |
0.52 |
| Including |
96.0 |
181.0 |
85.0 |
0.99 |
| AZ1059 |
656.4 |
88.0 |
656.4 |
568.4 |
0.47 |
| Including |
330.0 |
404.0 |
74.0 |
0.90 |
| AZ1060A |
402.5 |
116.0 |
402.5 |
286.5 |
0.50 |
| Including |
130.0 |
170.0 |
40.0 |
0.69 |
| AZ1061A |
293.4 |
71.0 |
293.4 |
222.4 |
0.90 |
| Including |
71.0 |
250.0 |
179.0 |
1.04 |
| AZ1062 |
280.0 |
130.0 |
280.0 |
150.0 |
0.64 |
| Including |
130.0 |
248.0 |
118.0 |
0.70 |
| AZ1063 |
427.1 |
94.0 |
427.1 |
333.1 |
0.72 |
| Including |
94.0 |
232.0 |
138.0 |
0.81 |
| AZ1064 |
170.1 |
136.0 |
170.1 |
34.1 |
0.47 |
| AZ1064A |
404.4 |
120.0 |
248.0 |
128.0 |
0.75 |
| And |
|
248.0 |
404.4 |
156.4 |
0.39 |
| Project Los Azules – S-K 1300 Technical Report Summary | Project No.: 21139-01 | 7-81 |
| Table 7.2: Examples of Significant Drilling Results Prior to 2022 |
| Drill Hole ID |
TD (m) |
Intersection |
Interval (m) |
Total Copper (%) |
| From (m) |
To (m) |
|
|
| AZ 1168 |
569.3 |
148.0 |
569.3 |
421.3 |
0.66 |
| AZ 1169 |
315.8 |
86.0 |
315.8 |
229.8 |
0.36 |
| AZ 1170 |
349.3 |
112.0 |
349.3 |
237.3 |
0.63 |
| AZ 1175 |
355.2 |
74.0 |
340.0 |
266.0 |
0.22 |
| and |
340.0 |
355.2 |
15.2 |
0.72 |
| AZ 1176 |
393.4 |
162.0 |
292.0 |
130.0 |
0.63 |
| T-01B |
656.0 |
80.0 |
192.0 |
112.0 |
0.38 |
| and |
387.0 |
656.0 |
269.0 |
0.50 |
| AZ 1279 |
622.7 |
272.0 |
456.0 |
184.0 |
0.38 |
| and |
456.0 |
622.7 |
166.7 |
0.71 |
| AZ 1282 |
482.1 |
309.5 |
314.0 |
4.5 |
2.60 |
| AZ 1289 |
367.0 |
220.0 |
367.0 |
147.0 |
0.44 |
| AZ 1291 |
890.5 |
72.0 |
232.0 |
160.0 |
0.61 |
| and |
562.0 |
790.0 |
228.0 |
0.40 |
| and |
790.0 |
890.5 |
100.5 |
0.71 |
| AZ 1294 |
861.9 |
62.2 |
74.0 |
11.8 |
0.53 |
| And |
252.0 |
861.9 |
609.9 |
0.47 |
| AZ 1295 |
1044.5 |
422.0 |
1044.5 |
622.5 |
0.51 |
| incl |
580.0 |
618.0 |
38.0 |
1.07 |
| incl |
720.0 |
744.0 |
24.0 |
1.16 |
| incl |
970.0 |
1044.5 |
74.5 |
0.61 |
| AZ 1296 |
523.2 |
156.0 |
244.0 |
88.0 |
0.92 |
| AZ 1297 |
980.8 |
276.0 |
690.0 |
414.0 |
0.50 |
| incl |
436.0 |
490.0 |
54.0 |
1.07 |
| AZ 1299 |
1074.6 |
78.0 |
94.0 |
16.0 |
0.55 |
| and |
546.0 |
1074.6 |
528.6 |
0.44 |
| AZ 12101 |
237.0 |
168.0 |
237.0 |
69.0 |
0.87 |
| AZ 12114 |
814.5 |
224.0 |
374.0 |
150.0 |
0.70 |
| |
|
|
|
|
|
| Source: | Minera Andes press releases dated May 5, 2004, May 31, 2007,
November 14, 2007, April 16, 2008, June 6, 2008, March 8, 2010, June 21, 2010, and June 27, 2011, and McEwen Mining press releases dated
May 10, 2012, January 17, 2013 and March 28, 2013. TD = total depth |
| Project Los Azules – S-K 1300 Technical Report Summary | Project No.: 21139-01 | 7-82 |
| Table 7.3: Examples of Significant Copper, Gold and Silver Drilling Results From 2022 Campaign |
| Hole-ID |
Section |
Predominant Mineral Zone |
From (m) |
To (m) |
Length (m) |
Cu% |
Au (g/t) |
Ag (g/t) |
Comment |
| AZ22137A |
36 |
Total |
133.0 |
557.3 |
424.3 |
0.47 |
0.027 |
0.008 |
|
| incl |
|
Enriched |
133.0 |
342.0 |
209.0 |
0.49 |
0.028 |
0.016 |
|
| and |
|
Primary |
342.0 |
557.3 |
215.3 |
0.44 |
0.026 |
0.001 |
incl. 8m of 1.00% Cu in Primary |
| AZ22138 |
36 |
Total |
138.0 |
660.1 |
522.1 |
0.42 |
0.064 |
1.883 |
|
| incl |
|
Enriched |
138.0 |
348.0 |
210.0 |
0.60 |
0.064 |
2.180 |
incl. 28m of 0.87% Cu in Enriched |
| and |
|
Primary |
348.0 |
660.1 |
312.1 |
0.30 |
0.065 |
1.683 |
|
| AZ22139 |
36 |
Total |
114.5 |
282.6 |
168.2 |
0.08 |
0.060 |
1.447 |
|
| incl |
|
Enriched |
206.5 |
282.6 |
76.1 |
0.12 |
0.032 |
1.164 |
|
| AZ22140 |
36 |
Total |
117.4 |
342.8 |
225.4 |
0.16 |
0.030 |
1.117 |
|
| incl |
|
Enriched |
117.4 |
314.0 |
196.6 |
0.16 |
0.032 |
1.173 |
|
| and |
|
Primary |
314.0 |
342.8 |
28.8 |
0.16 |
0.019 |
0.732 |
|
| AZ22141 |
40 |
Total |
183.1 |
551.0 |
367.9 |
0.50 |
0.069 |
1.535 |
|
| incl |
|
Enriched |
183.1 |
360.0 |
176.9 |
0.50 |
0.044 |
1.437 |
|
| and |
|
Primary |
360.0 |
551.0 |
191.0 |
0.50 |
0.092 |
1.625 |
|
| AZ22142 |
36 |
Total |
92.0 |
511.1 |
419.1 |
0.79 |
0.152 |
3.508 |
Incl. 32m of 1.11% Cu & |
| incl |
|
Enriched |
92.0 |
278.0 |
186.0 |
0.93 |
0.095 |
3.544 |
104m of 1.00% Cu in Enriched |
| and |
|
Primary |
278.0 |
511.1 |
233.1 |
0.67 |
0.198 |
3.479 |
46m of 1.59% Cu in Primary |
| AZ22143 |
36 |
Total |
92.5 |
403.0 |
310.5 |
0.20 |
0.015 |
0.880 |
|
| incl |
|
Enriched |
92.5 |
266.0 |
173.5 |
0.22 |
0.016 |
0.985 |
|
| and |
|
Primary |
266.0 |
403.0 |
137.0 |
0.18 |
0.014 |
0.747 |
|
| AZ22144 |
36 |
Total |
58.0 |
506.6 |
448.6 |
0.30 |
0.02 |
0.84 |
|
| incl |
|
Enriched |
58.0 |
204.0 |
146.0 |
0.31 |
0.01 |
0.52 |
|
| and |
|
Primary |
204.0 |
506.6 |
302.6 |
0.29 |
0.02 |
1.00 |
incl 104.6m of 0.48% Cu |
| AZ22145 |
40 |
Total |
76.0 |
257.0 |
181.0 |
0.18 |
0.02 |
1.90 |
|
| incl |
|
Enriched |
76.0 |
194.0 |
118.0 |
0.16 |
0.03 |
2.25 |
|
| and |
|
Primary |
194.0 |
257.0 |
63.0 |
0.21 |
0.01 |
1.26 |
|
| Project Los Azules – S-K 1300 Technical Report Summary | Project No.: 21139-01 | 7-83 |
| Table 7.3: Examples of Significant Copper, Gold and Silver Drilling Results From 2022 Campaign |
| Hole-ID |
Section |
Predominant Mineral Zone |
From (m) |
To (m) |
Length (m) |
Cu% |
Au (g/t) |
Ag (g/t) |
Comment |
| AZ22146 |
40 |
Total |
91.0 |
421.5 |
330.5 |
0.83 |
0.11 |
2.30 |
|
| incl |
|
Enriched |
91.0 |
394.0 |
303.0 |
0.86 |
0.11 |
2.26 |
incl. 103.4m of 1.31% Cu |
| and |
|
Primary |
394.0 |
421.5 |
27.5 |
0.50 |
0.10 |
2.76 |
|
| AZ22147 |
48 |
Total |
60.0 |
240.8 |
180.8 |
0.03 |
0.02 |
0.50 |
|
| incl |
|
Enriched |
60.0 |
67.0 |
7.0 |
0.10 |
0.08 |
1.27 |
|
| AZ22148 |
40 |
Total |
76.0 |
315.0 |
239.0 |
0.26 |
0.02 |
1.01 |
|
| incl |
|
Enriched |
76.0 |
212.0 |
136.0 |
0.33 |
0.02 |
0.85 |
|
| and |
|
Primary |
212.0 |
315.0 |
103.0 |
0.16 |
0.02 |
1.23 |
|
| AZ22149 |
48 |
Total |
131.6 |
428.0 |
296.4 |
0.55 |
0.04 |
1.62 |
|
| incl |
|
Enriched |
131.6 |
278.0 |
146.4 |
0.34 |
0.02 |
0.32 |
|
| and |
|
Primary |
278.0 |
428.0 |
150.0 |
0.76 |
0.06 |
2.91 |
incl 54m of 1.38% Cu from 376m |
| AZ22150 |
44 |
Total |
78.0 |
257.4 |
179.4 |
0.14 |
0.01 |
0.53 |
|
| incl |
|
Enriched |
78.0 |
126.0 |
48.0 |
0.04 |
0.01 |
0.25 |
|
| and |
|
Primary |
126.0 |
257.4 |
131.4 |
0.17 |
0.01 |
0.63 |
|
| AZ22158 |
30 |
Enriched |
72.0 |
294.0 |
222.0 |
0.95 |
0.09 |
1.57 |
incl 44m of 1.38% Cu from 144m |
| and |
|
Primary |
294.0 |
300.0 |
6.0 |
0.34 |
0.05 |
0.43 |
|
| AZ22161 |
48 |
Enriched |
116.0 |
354.0 |
238.0 |
0.58 |
0.07 |
1.19 |
|
| AZ22162 |
36 |
Enriched |
102.0 |
450.0 |
348.0 |
0.28 |
0.40 |
1.13 |
|
| AZ22163 |
44 |
Enriched |
92.0 |
286.0 |
194.0 |
0.56 |
0.04 |
0.68 |
|
| AZ22164 |
38 |
Leached |
18.0 |
242.0 |
224.0 |
0.04 |
0.02 |
1.32 |
|
| AZ22165 |
48 |
Leached |
24.5 |
200.0 |
175.5 |
0.04 |
0.04 |
1.27 |
|
| AZ22166 |
30 |
Enriched |
82.7 |
199.6 |
116.9 |
0.13 |
0.02 |
0.81 |
incl 53.6m of 0.25% Cu from 146m |
| AZ22167 |
44 |
Enriched |
72 |
152.4 |
80.4 |
0.21 |
0.02 |
0.78 |
incl 54.4m of 0.25% Cu from 98m |
Source: McEwen Copper press release dated August
4, 2022
| Project Los Azules – S-K 1300 Technical Report Summary | Project No.: 21139-01 | 7-84 |
| 7.7 | True Thickness of Mineralization |
Supergene mineralization forms a sub-horizontal
zone measuring over 5 km north-south by 1.5 km west-east. The zone is underlain by hypogene mineralization that extends to depths greater
than 1 km below the surface. The sub-vertical geometry of key deposit lithologies and structural elements, coupled with predominantly
vertically oriented drill holes prior to 2022 effectively represent the true thicknesses of mineral zones. The use of inclined drill holes
for resource delineation drilling beginning with the 2022 campaign has served to improve the interpretation of the constraining sub-vertical
geological elements.
Refer to Section 13.7 for information regarding hydrogeology.
| 7.9 | ADEQUACY STATEMENT ON SECTION 7 |
The deposits at Los Azules are relatively broad
zones, with variable orientations of breccias. This has required reorienting drill programs as the deposit is better understood to more
accurately capture the volumes of higher-grade mineralization. Insufficient drilling that captures the fabric of the deposits risk over
or under estimation of the volumes of the Mineral Resource. Lower grade zones are well behaved and are well represented. The deposits
remain open at depth and along the primary axis of continuity.
The QP believes that the quantity and quality
of the lithological, collar, and downhole survey data collected during the exploration and infill drill programs completed at Los Azules
are acceptable to support Mineral Resource estimation.
| Project Los Azules – S-K 1300 Technical Report Summary | Project No.: 21139-01 | 7-85 |
| 8.0 | sample preparation, analyses, and security |
Mr. Allan Schappert (CPG, SME-RM) of Stantec Consulting
International Ltd., QP, visited the Los Azules property during the period from 24 April to 15 May 2022. The purpose of the visit was to
observe, review, and comment on all aspects of data collection, recording, and analysis in preparation of the Mineral Resource Estimate.
Activities and discussions included the following: visit and inspection of operating drill sites; care, custody, and control procedures
of core boxes; core logging facilities at Los Azules camp; core storage and sampling procedures at the Calingasta warehouse; a tour of
the independent assay lab in Mendoza; review of historical and current QA/QC protocols with a review of recent results.
The results of the historical and current drilling
program were discussed with the Project staff and select intervals from a series of drill holes were reviewed. A series of surface exposures
were visited at the deposit site. Active drill sites were visited and a series of (completed) drill hole collars were observed.
Mr. Schappert reviewed the logging, sampling procedures,
and Quality Assurance/Quality Control (QA/QC) practices used during the drilling program. The sampling practices were found to adhere
to accepted industry standards. Historic Standard Reference Materials (SRM) were prepared from locally sourced rocks and certified by
Alex Stewart Laboratories in Mendoza, Argentina. Blank material was initially made from “barren” quartz with a small portion
of leached material “to add some color” (i.e., to appear anonymous in the sample sequence). This material was not completely
sterile, and another source of blank material was obtained for QA/QC programs after 2008. “Coarse” duplicates taken at site
in 2008 were core duplicates obtained from quarter core splits. Coarse reject duplicates were eventually submitted for 2008 and included
in the 2009 and subsequent programs.
Since 2013, all sample preparation (crushing and
pulverizing) and assaying is completed at Alex Stewart Labs in Mendoza. Historical assaying and sample preparation has taken place at
other accredited labs in Argentina and Chile. Laboratories utilized by McEwen Copper have internal QC samples used in each batch of sampled
material provided by McEwen Copper. Each assay certificate lists the drill sample results, plus the laboratory’s internal sample
control results that consist of its own duplicates, blank and reference standard pulp with each batch assayed for its internal quality
control on precision, instrument drift and accuracy to determine if there are any sampling issues for that run. Anomalously high values
within batches are verified by re-assay as a matter of routine.
The drilling programs that have occurred on the
Los Azules property since 1998 have used both reverse circulation (RC) and diamond core (core) equipment. Since 2004, Minera Andes/McEwen
Mining and McEwen Copper have mainly used core-drilling techniques. The procedure for logging the core is described previously in Section
7.
Once geotechnical and geological logging has occurred
(including the mark-up of the sample locations on the core), the boxes of core are transferred to one of the nearby camp tents where a
dedicated photo booth setup enables the core boxes to be photographed in order and in a consistent fashion (Figure 8.1). Photos are taken
of both wet and dry core and are labelled according to hole ID, box number, and the from-to information (Figure 8.2). The photographs
are stored in the digital database for later reference if needed.
| Project Los Azules – S-K 1300 Technical Report Summary | Project No.: 21139-01 | 8-86 |
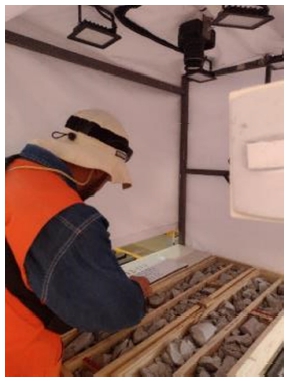
Figure 8.1: Dedicated static photo booth for
consistent photography of core
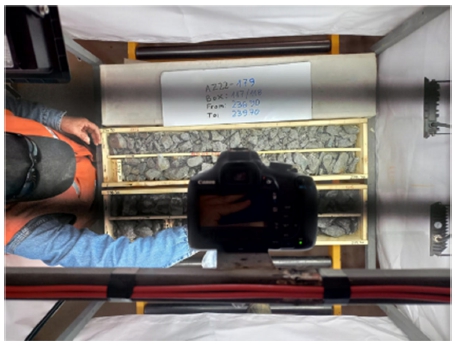
Figure 8.2: An example of the labelling of
core boxes for photography
Once photography is complete, approximately 40-48
core boxes (depending on core size) are stacked on a pallet in the correct downhole order. Pallets of core are properly secured by plastic
sheets and strapping (Figure 8.3) and are stored in a locked and security-sealed sea container awaiting shipment to the core warehouse
in Calingasta. Twice weekly shipments are tracked by McEwen Copper using Chain of Custody paperwork to ensure a secure delivery.
| Project Los Azules – S-K 1300 Technical Report Summary | Project No.: 21139-01 | 8-87 |
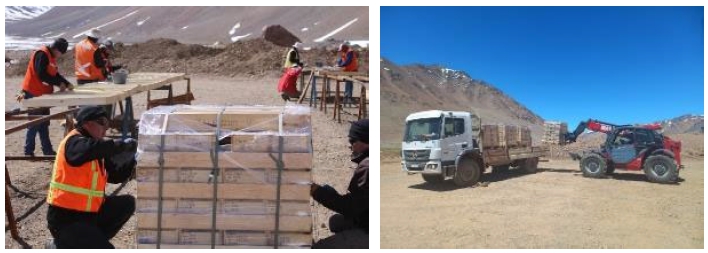
Figure 8.3: The securing and loading of the
core boxes for shipment to Calingasta
Upon arrival at the Calingasta warehouse facility,
a check is made on the integrity of the delivery according to the Chain of Custody documentation. Core boxes are unloaded into the warehouse
where they are firstly processed using a GeoLOGr hyperspectral scanner unit (Figure 8.4). This unit uses continuous short-wave infrared
(SWIR) point spectroscopy to provide objective drill core logs in a rapid and reliable manner. After scanning, the core boxes are transferred
immediately by roller tables to the sample prep area in the warehouse.
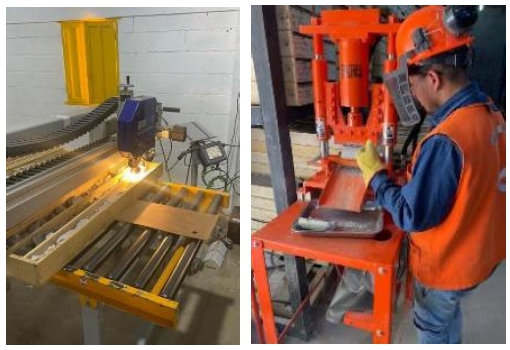
Figure 8.4: The hyperspectral scanning unit
and the hydraulic core splitter
McEwen Copper sampling staff uses hydraulic guillotine
core splitters (Figure 8.4) to split the more intact core fragments lengthwise as instructed by the logging geologist on the sampling
sheet. Core is divided using a splitter to minimize the loss of sooty chalcocite, which could be lost by washing during cutting by a diamond
saw. Depending on fracture density, RQD, and general condition of the core, any core that is not whole or is significantly in the form
of rubble is divided with a trowel to obtain a reasonable sample. One half of the core is kept behind in the core box and later stored
on shelving units in the warehouse for posterity and later reference.
| Project Los Azules – S-K 1300 Technical Report Summary | Project No.: 21139-01 | 8-88 |
Sampled core fragments are immediately placed
in thick plastic bags labelled with unique ID codes for each sample and sealed with nylon zip ties. Usually, three to seven individually
bagged samples are then placed into larger poly-woven rice bags, labelled accordingly, and secured with a uniquely numbered tamper proof
security seal (Figure 8.5).
Secured sacks are palletized and kept in a padlocked
and security sealed storage area (Figure 8.5) until samples are dispatched weekly to the laboratory for analysis. CCTV and security lighting
have been installed in the outdoor Calingasta warehouse facility that monitors the storage area. An inventory of samples and associated
security seals is maintained and is used in the Chain of Custody paperwork protocols when samples are dispatched to the lab and checked
when received by the lab.
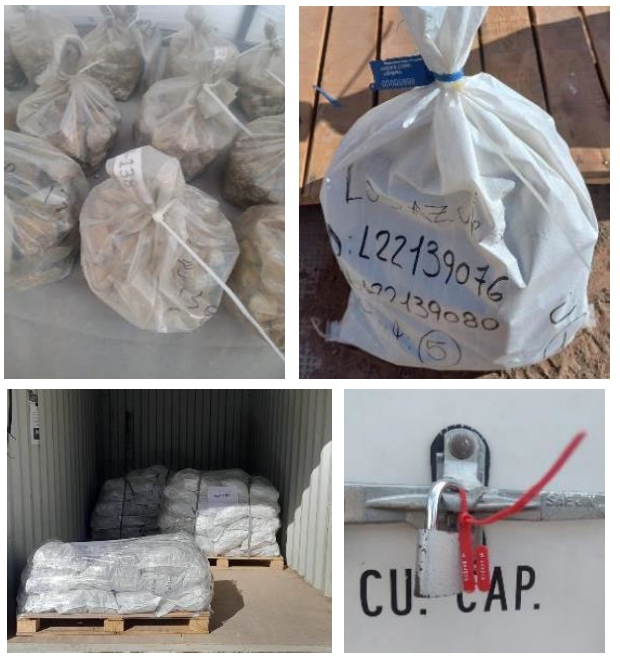
Figure 8.5: Showing the sequence of bagging,
tagging, sealing, and securing the samples for dispatch.
| Project Los Azules – S-K 1300 Technical Report Summary | Project No.: 21139-01 | 8-89 |
It is the opinion of the QP that the receiving,
preparation, storage, and dispatch procedures at a well-organized and secure core facility produces samples from Los Azules that are appropriate
for subsequent use in resource estimation.
| 8.3 | Sample Preparation and Analyses |
Once the samples are bagged in Calingasta, no
McEwen Copper employee is involved with any subsequent sample preparation. Samples are picked up regularly by staff from Alex Stewart
International Labs and delivered directly to their labs in Mendoza. The sacks are not opened until they reach the laboratory where the
inventory of sample numbers and security seals are checked and referenced to the existing Chain of Custody paperwork protocols followed
to this point.
Alex Stewart International (ASI) provides geochemical,
metallurgical, and analytical services to the mining and mineral exploration industry in Africa, Europe, South America, and Asia. ASI
Laboratories are accredited to ISO 9001, 14001 and 17025 standards and participate in inter-laboratory tests and international round robins.
Sample preparation protocols consist of the following:
| · | Samples are dried until the desired moisture content is achieved. The entire sample is crushed to 80%
passing 2mm (10 mesh). |
| · | A sample splitter obtains a 600 g fraction, which is then pulverized to 95% passing 105 microns (140 mesh). |
| · | Crushers and pulverizers are cleaned with high pressure air after every sample; granulometry tests are
performed every fifteen (15) samples and reported in the final certificates. |
Assays using the following methods are performed
at the ASI Labs in Mendoza:
| · | Au4-30: Gold analysis by fire assay and determination by AAS using a 30 g sample. |
| · | ICP-AR 39: multi-element suite analysis in aqua regia; determination by ICP-OES Radial. |
| · | ICP-ORE: 19-element overlimit analysis for the above method; ICP-OES Radial. |
| · | LMC-140: Sequential Copper Analysis to determine Acid Soluble Copper (using sulfuric acid), Cyanide
Soluble Copper, Residual Copper, and Total Copper by AAS determination. |
Sequential copper determinations for acid soluble
copper (CuAS) and cyanide soluble copper (CuCN) are provided by a standard sequential copper assay methodology by the Alex Stewart Laboratories.
Acid soluble and cyanide soluble assays are combined to determine the approximate soluble copper content (CuSOL) of each sample based
on the methodology. The sequential total copper assay determination is only used for comparative purposes and the total copper assayed
in the drill program procedure is used in the drilling database.
Complete and final assay certificates are transmitted
electronically to the Database Manager in Excel and pdf formats. If the assays pass the McEwen Copper QA/QC protocols (see below), they
are then entered into the Fusion database for later use in interpretation, modelling, and resource estimation.
Historically, sample preparation and assaying
has variously taken place at Alex Stewart Labs, ALS Chemex (Chile), and ACME Labs (Mendoza and Chile). ALS Chemex and ACME are also ISO
9001:2000 certified labs. The sample prep at the different labs is very similar with minor variations in crushing, pulverizing, and sample
size, but all to generally accepted industry standards.
| Project Los Azules – S-K 1300 Technical Report Summary | Project No.: 21139-01 | 8-90 |
McEwen Copper decided to undertake an extensive
re-assaying program to augment the database prior to the updated estimate. The main objectives for the re-assaying program were aimed
at obtaining missing data, benefiting from improved detection limits for deleterious elements (particularly for arsenic), benefiting from
a consistent assay methodology using just one laboratory and to obtain sequential assay determinations where only total copper information
was available. This program was initiated in 2022 and completed in 2023, and a total of 159 holes for 24,704 samples were re-assayed under
this program using either remaining core or historical sample pulps and rejects (located at the Calingasta warehouse) and sent for re-assay
at Alex Stewart Labs, Mendoza.
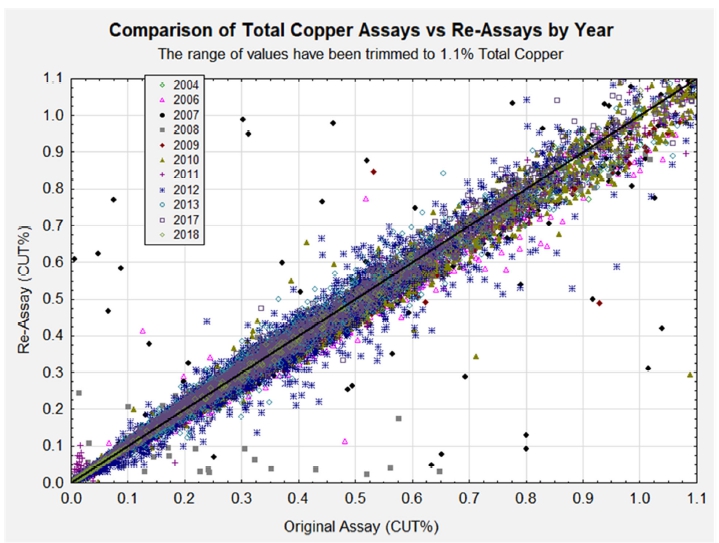
Figure 8.6: Total Copper Assays vs Re-Assays
| Project Los Azules – S-K 1300 Technical Report Summary | Project No.: 21139-01 | 8-91 |

Figure 8.7: Cyanide Soluble Copper Assays
vs Re-Assays
QC sample insertion
During the sample bagging and bundling process
in Calingasta, McEwen Copper staff insert standards and blank samples in pre-determined regular intervals as well as duplicate samples.
In a sequence of forty samples there will be two blanks, two standards, and one duplicate requested. The frequency of QC samples is more
than adequate for the current program.
In addition to the McEwen Copper QC samples, ASI
perform their own internal QC checks that include both commercial and internal standards, blanks, and duplicates. Results of their internal
QC are reported in the final certificates.
Chain of Custody
The chain of custody has been outlined in the
previous paragraphs in this section. It appears that any tampering with individual bags or the ties would be immediately evident when
the samples arrived at the lab. Any tampering with the larger bags would also be apparent on arrival at the lab. Documentation was provided
such that it would be difficult for a mix up in the samples to occur either during shipment or at the lab.
| Project Los Azules – S-K 1300 Technical Report Summary | Project No.: 21139-01 | 8-92 |
All procedures were being carefully attended to
and met or exceeded industry standards for collection, handling, and transporting of drill core samples.
The Fusion database where the final assay results
are stored has a strict read / write permissions policy and protocol to ensure no unauthorized access or editing of the database is possible.
Back-ups of the database occur on a regular basis.
Control samples consist of blanks, duplicates,
and standard reference samples. Independent third-party labs are also often used for check samples to assure assaying accuracy beyond
standard QC protocols. Blank samples test for contamination; duplicates test for contamination, precision, and intra-sample grade variation;
and reference standards test for assay precision and accuracy.
Control Sample Performance
The performance of reference standards is evaluated
using diagnostic charts whereby outliers can be identified if they lie outside of +/-3sd of the certified or expected value of the sample.
Control charts are similar in that they monitor the consistency of performance at the lab when 90% of the results must fall within ±10%
of the mean value of the assays for the process to be “in control”.
McEwen Copper consistently and routinely monitors
the QC results as they are received from the lab and not at the end of a drilling campaign, to ensure that outliers are caught and fixed
as soon as possible. Obvious outliers or a collection of outliers in a batch or distinct period will be flagged for re-assaying whereby
a bracket of 10 samples either side of the standard will be resubmitted for repeat assays until the QC results are satisfactory.
Examples of diagnostic charts are provided in
Figure 8.8. In the charts, the expected assay value appears as a green horizontal line (middle line). Red lines, either side of the expected
value lines, indicate +/-1,2 or 3 standard deviations (SD) away from the expected value with outliers being considered outside of these
ranges.
| Project Los Azules – S-K 1300 Technical Report Summary | Project No.: 21139-01 | 8-93 |
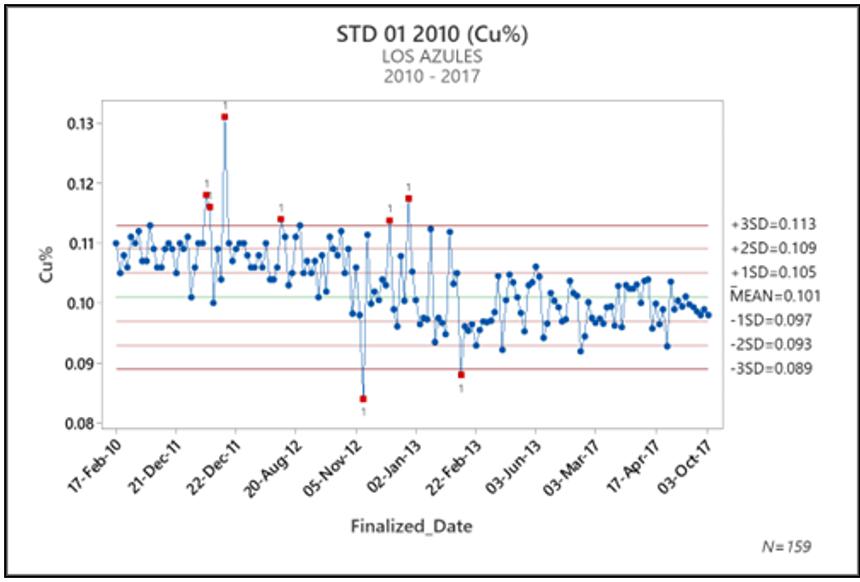
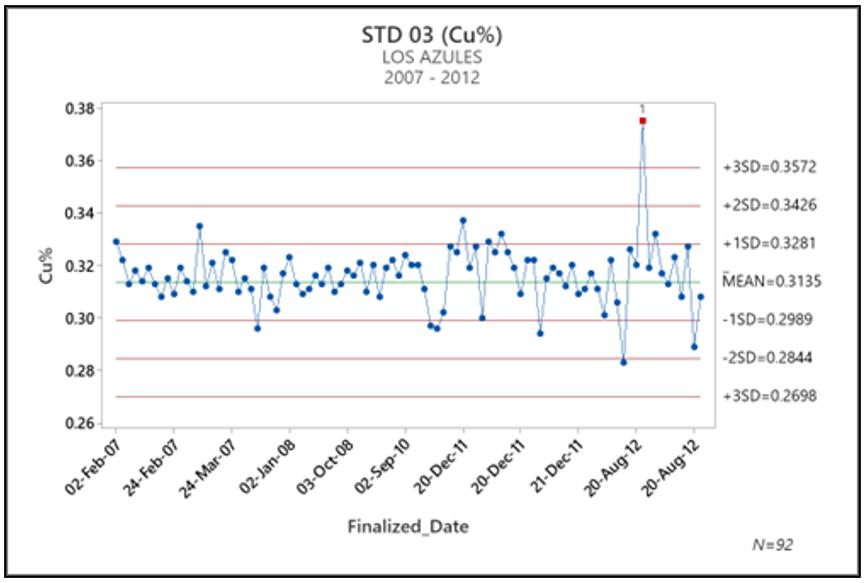
| Project Los Azules – S-K 1300 Technical Report Summary | Project No.: 21139-01 | 8-94 |


| Project Los Azules – S-K 1300 Technical Report Summary | Project No.: 21139-01 | 8-95 |
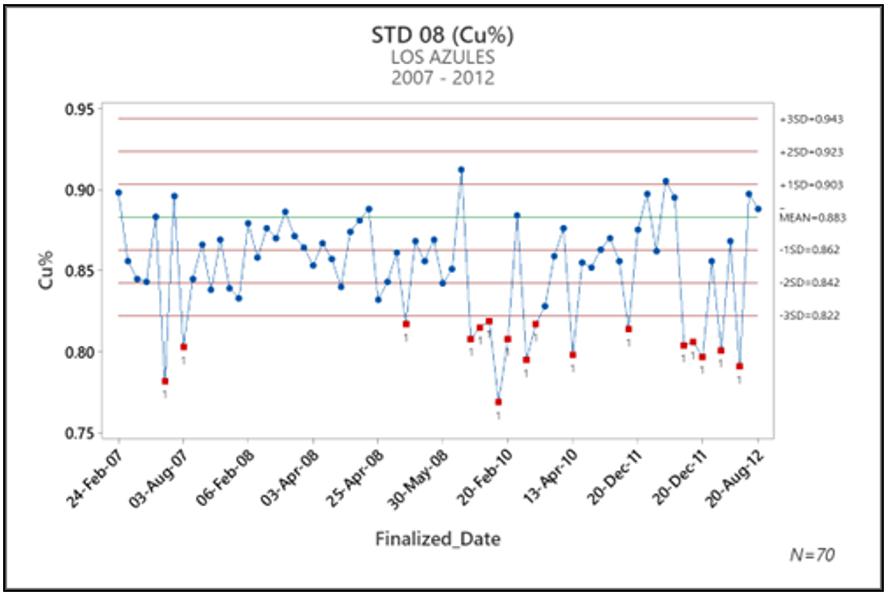
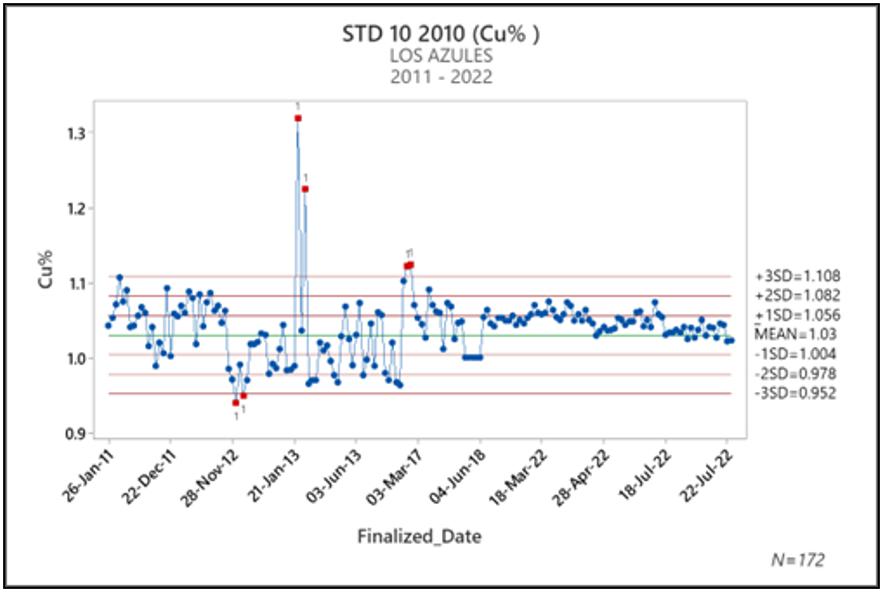
Figure 8.8: Diagnostic charts for standards
used at Los Azules 2007-2022
| Project Los Azules – S-K 1300 Technical Report Summary | Project No.: 21139-01 | 8-96 |
The performance of copper standards was similar
across the drilling from 2007 through the 2017 field seasons with exceptions as outlined. Minor variations in the different lab preparation
and assaying methodology likely played a part in the erratic nature of the earlier campaigns, however results that “bounce”
around the expected values is normal and expected. All outlier values were sent for re-assay.
In the 2009-2010 field season, hole 1049 produced
significant QC errors which were addressed by remedial assaying for that hole. In the 2010-2011 field season, standards indicated copper
values were consistently higher than expected. The errors were addressed by a program of re-assaying in 2012. Original values in the database
were replaced by the 2012 re-assay results which were validated by control values. The 2011-2012, 2012-2013, and 2017 field seasons assaying
produced no significant QC errors. The 2018 and recent 2022 campaigns show a good trace of stable standard results for STD03 and STD10
with no errors seen.
Due to the low values of gold, control using standards
of comparable values is not possible due to the lack of precision in the assay process; however, duplicates show no indication of systematic
assay problems in gold.
Blank Sample Performance
In the field seasons prior to 2009, the blank
material was discovered to be mineralized. This generated a significant number of false positive results. All out of control results during
this period were subjected to remedial procedures. No evidence of contamination from sample to sample was detected by the remedial work.
In the 2009-2010 field season, the blank was replaced
with a commercial silica sand and continued to be used until 2018. There were a handful of small blank failures in the assaying, later
mitigated by re-assaying of the batch. In the 2021/22 drilling season, a commercially sourced coarse quartz material replaced the previous
blanks. There have been no blank failures for copper or gold since 2013 (Figure 8.9).
| Project Los Azules – S-K 1300 Technical Report Summary | Project No.: 21139-01 | 8-97 |
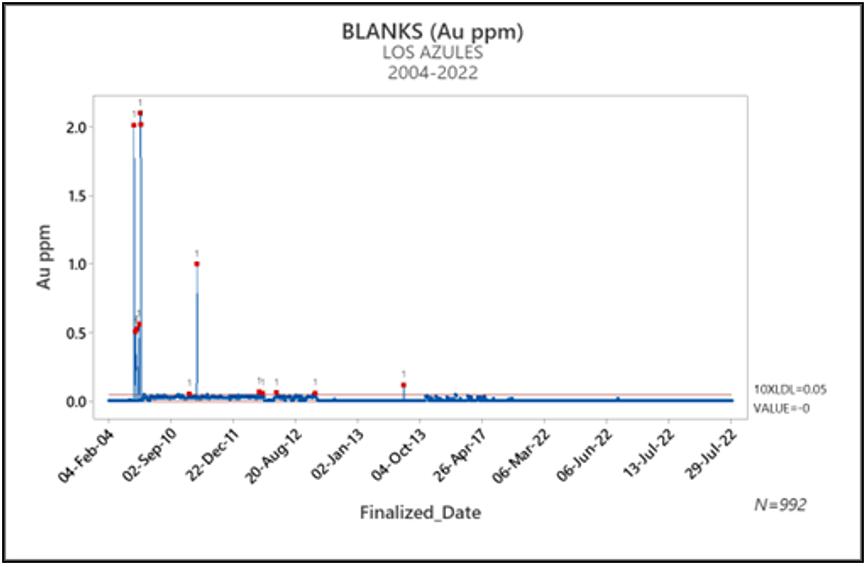
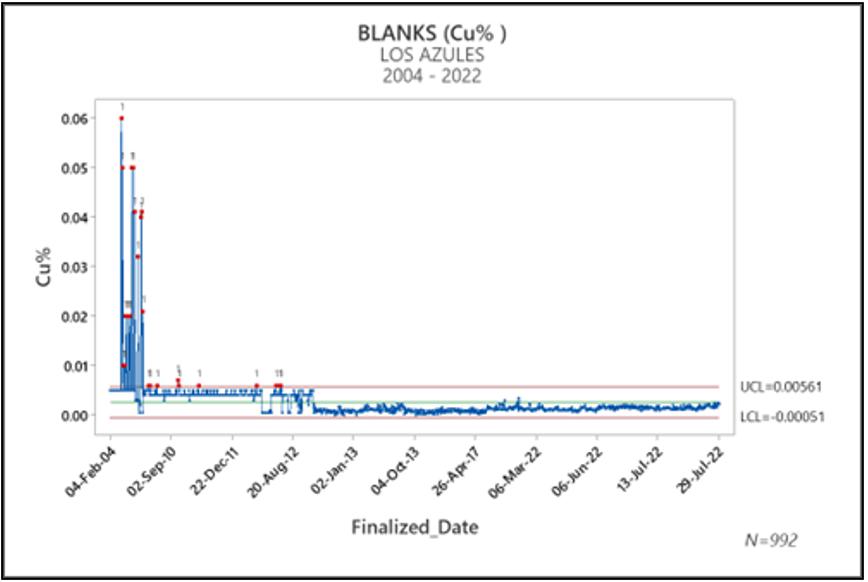
Figure 8.9: Control charts for the blanks
at Los Azules 2004-2022
| Project Los Azules – S-K 1300 Technical Report Summary | Project No.: 21139-01 | 8-98 |
Duplicate Sample Performance
Duplicate samples of coarse reject material are
assayed to check the sample preparation protocol. If the protocol is adequate, 90% of the duplicate pairs of assays should fall within
±30% of each other. During all field seasons, coarse reject copper duplicates fell within control limits (Figure 8.10).
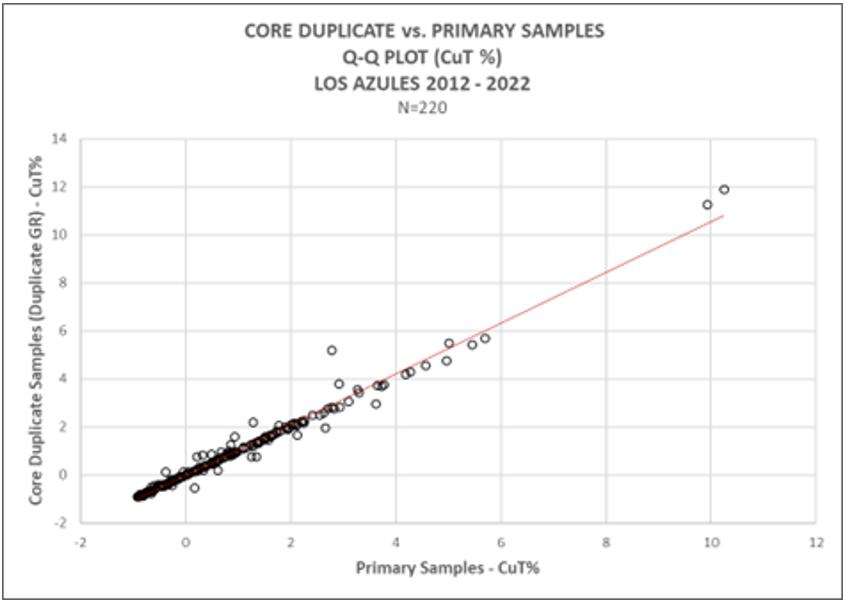
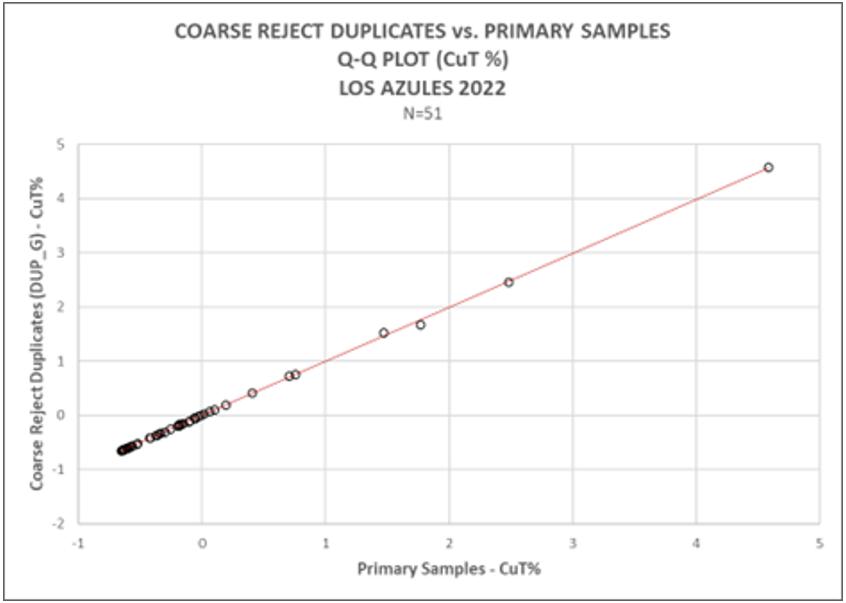
Figure 8.10: QQ plots for core duplicates
2012-2022
| Project Los Azules – S-K 1300 Technical Report Summary | Project No.: 21139-01 | 8-99 |
Pulp Duplicate Sample Performance
Duplicate samples of pulp material are assayed
as another check on assay accuracy and precision. For all seasons where duplicates were taken, copper duplicates from pulp material fell
within control limits above the prescribed rate of 90% within ±10%. Differences with gold duplicates in 2009 – 2010 have
been addressed. There are no other outstanding issues with pulp duplicate performance (Figure 8.11).
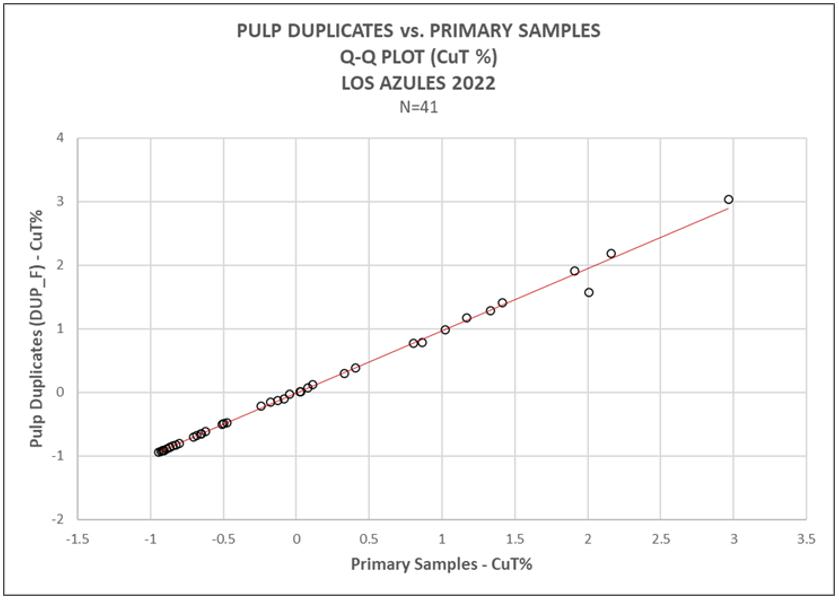
Figure 8.11: QQ plot for the pulp duplicates
in the 2022 campaign
Results from the control sample analysis indicate
that the copper and gold assay processes are under sufficient control to produce reliable sample assay data for resource estimation and
release of drill hole assay results. Inadequate standards from early field seasons were eliminated. The use of only one lab to produce
assay results improves the consistency of results. Material that was assumed to be blank but contained low copper values was replaced.
Later types of blank material improved the monitoring of potential contamination of the samples.
All past deficiencies in the QC program have been
addressed. The Los Azules sampling and assaying program is producing sample information that meets industry standards for copper and gold
accuracy and reliability. The assay results are sufficiently accurate and precise for use in resource estimation and the release of drill
hole results on a hole-by-hole basis.
| Project Los Azules – S-K 1300 Technical Report Summary | Project No.: 21139-01 | 8-100 |
During April 25 – May 05, 2022, the QP conducted
a site visit in Argentina and met with the resource estimation team in San Francisco. The purpose of the visits was to observe, review,
and comment on all aspects of data collection, recording, and analysis in preparation of the MRE. Several project related areas were visited
and are summarized below.
| 9.1 | Drill Site Inspection, Los Azules Project Site |
The Los Azules Deposit is located at an elevation
of 3,700 m in the Andes mountains.
The QP made several trips to the project drilling
area to view activities at various drill sites. Rigs at both Major Drilling and Foraco platforms were observed. At each rig, at least
one complete cycle was observed with core extracted from the core barrel, core barrel put back in the hole, advance the hole about three
meters, pull the core barrel out again and empty core onto tube for transfer to a core box.
Much of the core coming out of the core barrel
is highly fractured and loose. Care was taken to keep the core as intact as possible with little mixing of the pieces as they were moved.
Figure 9.1 is a photo of the Drill Hole Coordinator carefully transferring the highly fractured core to core box. The box is then labelled,
sealed, and transported to the logging area.
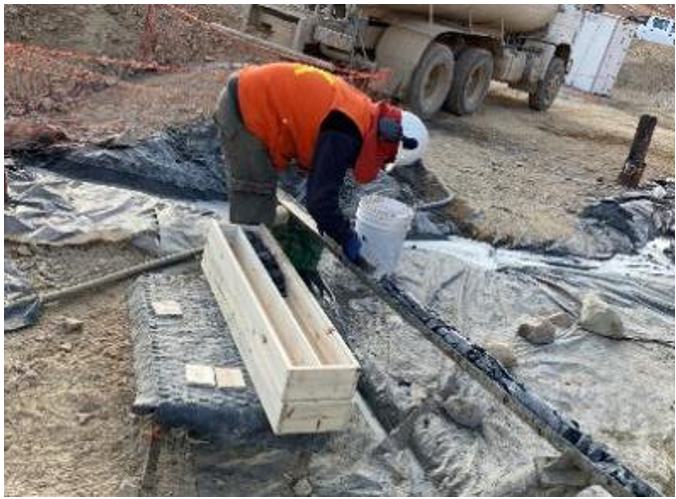
Figure 9.1: Transferring Core to Core Box
Considerable care is taken to ensure drill collar
locations and drill site preparations are completed on a timely basis. A series of three surveyed and flagged stakes were set up in groups
to indicate the azimuth of the proposed hole. The actual collar location is marked with a flagged and labelled stake that shows the hole
number, azimuth, and dip. Figure 9.2 shows a drill pad prepared for a drill rig to move onto soon.
| Project Los Azules – S-K 1300 Technical Report Summary | Project No.: 21139-01 | 9-101 |

Figure 9.2: Drill Pad Preparation
While on site, the QP checked several drill collars
with a hand-held GPS. The coordinates were compared to data in the project’s drilling database. All holes checked showed agreement
within the margin of error of the instrument being used.
| 9.2 | Core Logging compound, los azules project site |
Drill core is delivered directly from the drill
site and sorted and stacked by drill hole. Once the complete hole is delivered, it is laid-out on tables for logging. A team of well-experienced
senior geologists log core for lithology, mineralogy and structure and select sample intervals for assaying and bulk density determinations.
Concurrently, geological technicians log the hole for rock quality designations (RQD) and measure fracture angles. Core is photographed
at site before sampling and splitting.
A technician also conducts Schmidt Hammer determinations
at one-meter intervals and point load testing (PLT) at regular intervals. Core is scribed with a line along the long axis where appropriate.
Technicians then either cut larger pieces in half with a hydraulic splitter or select half of the fractured core within the defined interval
and place the rock and sample tag in prelabelled bags. Up to ten of these plastic bags are placed in a large mesh bag, labeled inside
and out, sealed, and placed in a locked secure container awaiting transport to the assay lab.
| 9.3 | Core Warehouse, Calingasta |
A visit was made to the Calingasta core storage
facility for a day to observe and review activities at that location. The facility is in the foothills of the Andes mountains at an elevation
of 1500 m. Core is delivered to the facility after it has been logged, split, and sampled by geologists and technicians at the Los Azules
Project site. Core is immediately sorted, coded, and labelled and stored indoors in well-made storage racks. Pulps and rejects are stored
in dedicated buildings at the warehouse compound. The use of hyperspectral scanners and high-resolution photography was reviewed. Figure
9.3 is a photo of the core storage racks at the Calingasta compound.
| Project Los Azules – S-K 1300 Technical Report Summary | Project No.: 21139-01 | 9-102 |
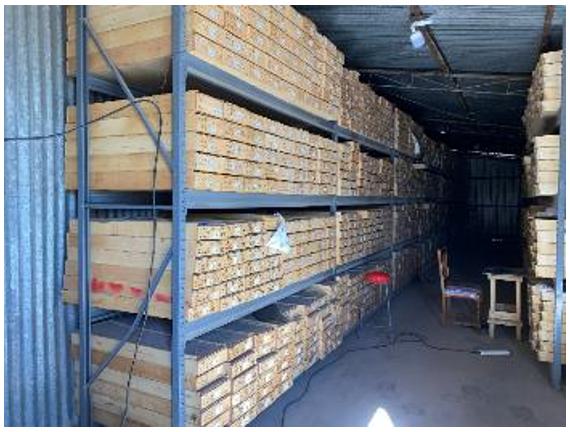
Figure 9.3: Core storage racks at Calingasta
Hole AZ22142 was selected for review during which
the core logging protocol, sample selection, sample labelling for assaying and bulk density testing, common mineralogical and lithologic
controls were discussed.
| 9.4 | Alex Stewart Assay Lab, Mendoza |
A visit to Alex Stewart Inc (ASI) Labs took place
to follow the routing of incoming samples through drying, sample prep, analysis, reporting and included discussions of internal QA/QC
practices, gold assaying procedures and detection limits used by ASI, the protocol for sequential copper assays, bulk density protocols
and reporting limits, and the use of a new high temperature atomic absorption (AA) unit. ASI is an International Organization for Standardization
(ISO) certified lab (17025). The secure outside storage area (walled, fenced, and gated) for incoming samples was visited and sample security
and Chain of Custody procedures were reviewed.
| 9.5 | Global Database Manager, Database Curator & Exploration Manager, San Juan |
Discussions with the Global Database Manager,
Database Curator, and Exploration Manager included: the multiple historical interpretations seen in the logging; the presentation of drilling
results, the effect of Dr. Sillitoe’s 2014 site visit, and adjustments made to interpretive work thereafter. Additionally, discussions
on the historical use of multiple labs for assay analysis, historical and current QA/QC protocols including a review of recent results,
the preliminary results of an initial database audit by MTS were reviewed. The ongoing topographic survey with discussion of various national
grid systems used were described.
| Project Los Azules – S-K 1300 Technical Report Summary | Project No.: 21139-01 | 9-103 |
| 9.6 | CRM (Resource Estimation), San Francisco |
CRM is the consultant modelling team based in
Santiago, Chile, and San Francisco, USA, chosen by McEwen Copper to complete the Mineral Resource Estimate (MRE). Primary discussions
involved the modelling work completed to-date and included data validation of new data provided for the modelling process, interpretive
steps, and methods used to construct grade estimation boundaries, re-evaluation of mineral zone contacts using sequential assay results,
and the use of satellite mapping for fault traces. There was discussion of the use of implicit modelling for interpretive work, discussion
on density measurements, and gold assay detection limits and methods used to cap high grade outliers in the drilling database and associated
composite file.
| 9.7 | Mine Technical Services (MTS) Database Audits |
MTS conducted two phases of audits (2021 and 2022)
including a site visit by Todd Wakefield and Francisco Ramos between April 18 – 27, 2022. Discussions of their findings and a review
of their recommendations were made. Stantec Consulting International Ltd. geological QP supported McEwen Copper’s decision to undertake
an extensive re-assaying program of existing core to augment the database prior to the updated estimate.
The drill hole database utilized in the geological
modelling and subsequent mineral resource estimation consists of historical information and the drill hole data collected by the Issuer.
The historical drill data were presented as a
series of .csv data tables, which were imported into an MS Access database for review and verification. The drill hole data was then loaded
into Leapfrog Geo software which provides standard checks for drill data integrity, considering a sequential ‘from’ and ‘to’
for the interval tables, the end of hole detailed in the collar table matching those in the interval tables, duplication of data, and
checks for erroneous readings in survey deviation. There were no errors found in the historical drill hole data tables.
The drill hole data from the current drilling
campaign was captured on site using Excel data sheets, which were then validated upon import to a Fusion X SQL data management system
ensuring the integrity of data captured during the logging process. The assay data certificates were loaded directly into the database,
importing the information contained therein in its entirety without any manual editing. The database manages the assay data, using a series
of rules and profiles designed to export the assay data from the optimum analytical method and converting any below detection limit values
to numeric data. The data tables, Collar, Survey, Lithology, Assay, Alteration, Mineralization, and Structure were extracted as a series
of .csv files with their table structure set up for direct import in the Leapfrog Geo modelling platform. These data were combined with
the historical data, checked for drill hole data integrity, and promoted as error free data used in the geological modelling.
It is the opinion of the QP that the results of
the data verification indicate that the database is sound reliable, and adequate for the purposes of resource estimation.
| Project Los Azules – S-K 1300 Technical Report Summary | Project No.: 21139-01 | 9-104 |
| 10.0 | mineral processing and metallurgical testing |
Copper mineralization is complex and varied at
Los Azules, as to be expected for deposits of this type. The potential resource sources for processing include Oxide/LIX, Supergene, and
Primary mineralized Zones in the deposit. LIX mineralization is the Spanish acronym for “leached” or leach cap. Primary, or
hypogene copper mineralization, extends to at least 1,000 m below the present surface at Los Azules. Near surface, leached primary sulfides
(mainly pyrite and chalcopyrite) were redeposited below the water table in a sub-horizontal layered zone of supergene enrichment as secondary
chalcocite and covellite. Very little oxide copper mineralization is present in the deposit and found in the Oxide/LIX and Supergene enrichment
Zones. Hypogene (Primary Zone) bornite appears at deeper levels together with chalcopyrite. Gold, silver, and molybdenum are present in
trace amounts, but copper is the most important economic constituent at Los Azules.
This report update leverages the prior metallurgical
work completed for the Los Azules Project and reported in prior Technical Reports. Historical testing for McEwen Copper was conducted
on samples from the resource in several phases. C. H. Plenge Laboratory (Plenge) in Lima, Peru, performed several scoping level investigations
from 2008 to 2012 to support a Preliminary Economic Assessment (PEA) by Samuel Engineering in 2009, 2010, and 2013. Additional samples
from the resource were tested at the SGS Research Limited (SGS) to support a Preliminary Economic Assessment (PEA) by Hatch in 2017. A
mineral liberation analysis (MLA) was completed at Thompson Creek Metals Company in Challis, Idaho; in 2012 on rougher flotation samples
from the Plenge lock-cycle testing.
The historical work completed at both Plenge and
SGS concentrated on evaluating sulfide resource processing options including flotation, pressure oxidation (POX) of flotation concentrate,
and column leaching. The evaluation of the historical data in the PEA in 2009 and 2010 resulted in the selection of a flotation process
to produce a copper concentrate. In 2013, a change in the PEA concepts resulted in a flotation concentrate being treated by a POX leach
circuit and solvent extraction / electrowinning (SX/EW) to produce copper metal cathodes.
Metallurgical characterization testing has been
completed as part of this study in the form of sequential assay (sulfuric acid and cyanide component steps) for the resources considered,
column testing and bottle roll testing. The sequential assay method used at Los Azules for both the resource assay and metallurgical programs
provides an indication of the copper mineralization present in the form of acid soluble copper (CuAS) and cyanide soluble copper (CuCN),
both assays combined provide an approximation for leachable/soluble copper (CuSOL) component of the total copper assay (CuT).
There are several sequential assay methods in
use in the industry, the methodology selected for Los Azules maintains consistency with historic assay methods included with the resource
assay data set. Re-assaying of older pulps and core samples was completed; however, results did not provide sufficient confidence in the
updated sequential assaying information obtained for use in the resource models.
The current metallurgical program is developed
in three (3) phases based on sample availability to support this PEA and continuing in parallel to support future study and objectives.
The Phase 1 program is complete and pending some final analysis at the time of this report and considered for the PEA analysis along with
the historical information. The Phase 2 and 3 programs are started, and metallurgical sampling and sample preparation is in progress.
| Project Los Azules – S-K 1300 Technical Report Summary | Project No.: 21139-01 | 10-105 |
In 2021, existing drill core was selected by lithology
and material type to reflect economically processable material in the resource for this study. Assay data and bottle roll testing was
completed for this study from the 21 column test samples (from nine (9) composites and two (2) drill holes) are currently under acidic
and bio-leach conditions. This reflects the Phase 1 metallurgical test program currently being completed at SGS Minerals S.A. analytical
lab in Santiago, Chile which is ISO 9001:2015, ISO 14001:2015 and ISO 45001:2018 certified. Additionally, 90 kg samples from Composite
6, Composite 7, Composite 8, and Composite 9 (for a total of 360 kg) from this program were shipped and delivered to Rio Tinto’s
facility in Bundoora in early November 2022 to undertake alternative leaching techniques.
Additionally, over 4.5 tonnes of PQ/HQ core material
from the 2022 drilling season were shipped to Hazen Research in Golden, Colorado in September 2022. Nuton has set up a laboratory facility
at Hazen, mirroring the technology and practices from the Bundoora facility near Melbourne.
As part of the Phase 1 metallurgical testing program,
samples were shipped to SEPRO laboratory in Canada to undergo microwave assisted comminution; to evaluate thermal stresses creating fractures
(macro and micro).
A total of 9 drill holes over 4,217 m of PQ core
(41,689 kg) were drilled during the 2022 campaign to support the Phase 2 metallurgical test program at SGS; these samples were delivered
in mid-October 2022. Additionally, samples from the 2022 drilling season of PQ core were sent to Hazen Laboratory in Golden, Colorado
to undertake alternative leaching techniques, starting in Q1 of 2023.
Sampling for a Phase 3 metallurgical test program
is currently under way, sampling PQ core to develop a large bulk sample to support 305 mm diameter by 9 m height columns for support of
a feasibility.
Based on typical recovery estimates for CuAS and
CuCN as provided by a standard sequential copper assay methodology developed at the Plenge Laboratory facility in Lima, Peru, projected
copper recovery estimates have been derived based on leachable/soluble (CuSOL) copper content that will be validated in the ongoing column
testing program at SGS, Santiago. Information in this section of the report has been updated and received as of 05/01/2023.
The metallurgical work completed to date and ongoing
at the effective date of this report provides an adequate understanding of the expected performance characteristics for a PEA level of
analysis. For Los Azules, the anticipated copper extraction of the CuSOL fraction of the assayed copper in each block is 100%. Additionally,
approximately 15% of the residual copper component can be extracted based on the metallurgical results to date. Copper recovered to cathodes
also considers a heap efficiency and inventory factor of 90% of the extractable copper based on general experience.
Based on the resource assay data and column results,
the apparent soluble copper recovery to cathodes is approximately 107%, with the overall LOM total copper recovery expected for the initial
project is approximately 73% as calculated for the components. Soluble copper recovery exceeding 100% implies partial leaching of material
which was not categorized as “soluble” based on the sequential assaying method and data available. Given the implied recovery
results, some adjustment to the sequential assay methodology could be considered to approximate the actual column and eventual heap leaching
results better directly.
| Project Los Azules – S-K 1300 Technical Report Summary | Project No.: 21139-01 | 10-106 |
Copper recovery is also distributed over a two-year
timeframe (60% of expected production in year 1 and 40% in year 2) to achieve at least two (2), 180-day leaching cycles in the multi-layer
stacked pad design from the time of initial placement on the pad.
The current Phase 1 project engineering design
uses a sulfuric acid copper bio-heap leach process to produce a Base Case 175,000 tonne/annum (tpa) copper cathodes by SX/EW or in an
Alternative Case 125,000 tpa considering the LIX and Supergene material types. This process design is described in Section 14 and was
used to estimate capital and operating costs for the economic assessments of the Project.
| 10.2 | current metallurgical testwork programs |
The current metallurgical program consists of
three (3) concurrent phases of worked aimed at supporting a feasibility study level of investigation. In the current Phase 1 program work,
existing drill core was selected for testing by lithology and material type to reflect economically processable material in the resource
for this study. Phases 2 and 3 will utilize new metallurgical core obtained from the ongoing drilling program to investigate the potential
metallurgical variability of the deposit and focus on the initial 3-5 years of materials to be mined.
McEwen Copper and SE developed and implemented
the main metallurgical test program (Phase 1) at a well-established Mineral Processing research and development firm in Santiago, Chile
(SGS Santiago). The metallurgical test program has been developed and supervised by Samuel Engineering.
The Phase 1 Metallurgical test program focused
on the following:
| · | Head Characterization (Sequential Copper, Fire Assay, Sulfur Speciation, Carbon Speciation, ICP-MS (50
elements), Fluoride, Chloride, and Mercury) |
| · | Comminution test work by lithology (SPI, SMC, LEIT, BWi, Ai, SG, and Bulk Density) |
| · | Grind vs rougher flotation recovery curves by lithology |
| · | Sulfuric Acid Bottle Rolls by lithology |
| · | Composite Sulfuric Acid Column Leach by material type |
| · | Solid-Liquid settling and filtration by lithology |
| · | Head Sample Mineralization (XRD, Clay Analysis, XRF, and TIMA-X PMA) |
| · | Acid Generation Prediction and Humidity Cell Testing |
The Phase 1 metallurgical test program was designed
to determine the metallurgical response variability of the resource to the selected operating parameters from historical parameters, using
several resource samples representing the depth and breadth of the resource. The program was also designed to develop data to project
metal recoveries, process reagent requirements, and to support process equipment sizing and selection.
A total of 78 separate samples were chosen by
SE, representing the Los Azules resource covering the major lithologies (Diorite, Porphyritic Diorite, Hydrothermal Magmatic Breccia,
Quartz Vein, Dacite Porphyry, and Rhyodacite Porphyry) and material types (Oxide/LIX, Supergene, and Primary). Cancha Geometallurgy Software
was utilized to provide analysis and interpretation to the material body; allowing for geostatistical functions to ensure that samples
are representative. Figure 10.1 and Figure 10.2 show the spatial representation of the 78 samples compared to the 5 Year Pit and Ultimate
Pit.
| Project Los Azules – S-K 1300 Technical Report Summary | Project No.: 21139-01 | 10-107 |
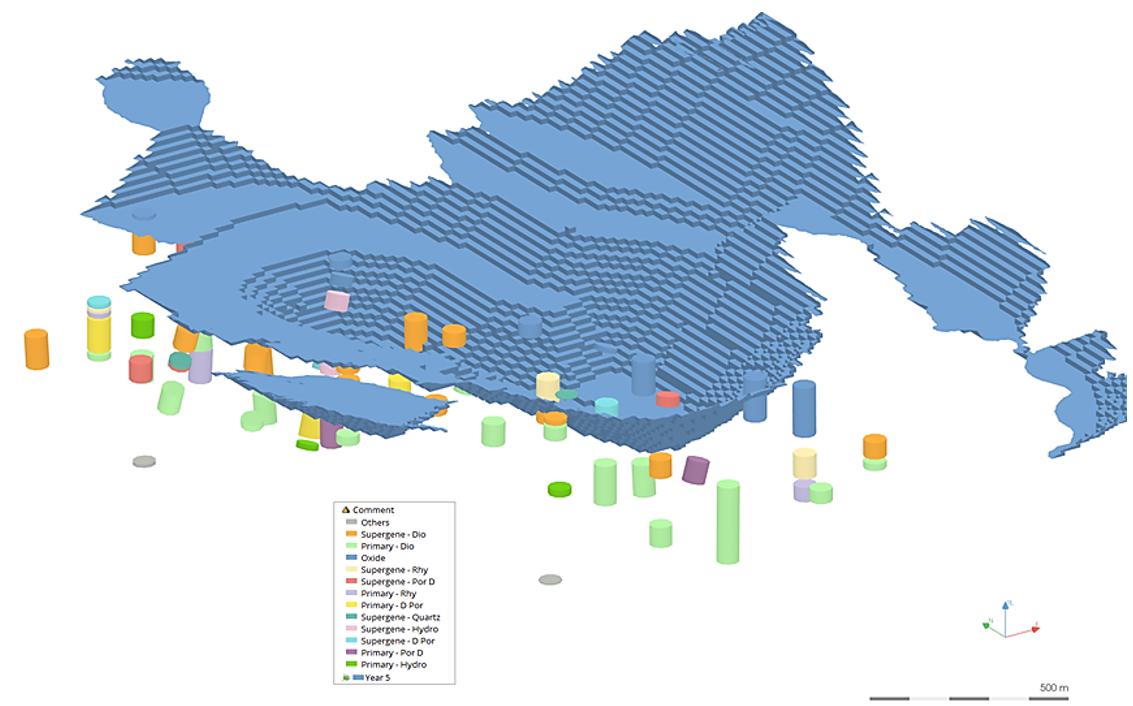
Figure 10.1: Spatial Representation of Phase
1 Metallurgical Samples in the 5 Year Pit (SE, 2023)
| Project Los Azules – S-K 1300 Technical Report Summary | Project No.: 21139-01 | 10-108 |

Figure 10.2: Spatial Representation of Phase
1 Metallurgical Samples in the Ultimate Pit (SE, 2023)
| Project Los Azules – S-K 1300 Technical Report Summary | Project No.: 21139-01 | 10-109 |
McEwen Copper personnel identified and shipped
existing core samples to SGS. In June of 2022, a total of 7,490 kg of existing drill core was delivered to SGS.
In Table 10.1, the event timings and their associated
lithologies are shown for the two (2) major pits being utilized in the PEA document; one for the 5 Year Pit and the next for the Ultimate
Pit. The percentages are a tabulation of number of blocks (standard 20x20x15 block) by lithology in the block model within each of those
pits. Table 10.2 and Table 10.3 are from the information produced by CRM-SA, LLC.
| Table 10.1: Event Timings and Associated Lithologies |
| Event Timing |
Associated lithologies |
Ultimate Pit |
5 Year Pit |
| Hydrothermal Breccia |
Hydrothermal Breccia |
0.10% |
0.31% |
| Early Mineral Porphyry |
Rhyodacite Porphyry |
9.06% |
19.09% |
| Pre-Mineral Pluton |
Diorite; Porphyritic Diorite; Monzodiorite; Quartz Diorite |
72.97% |
65.22% |
| Inter Mineral Porphyry |
Dacite Porphyry |
13.66% |
13.89% |
| Overburden / Cover |
Overburden |
Not Calculated |
Not Calculated |
| Magmatic Hydrothermal Breccia |
Magmatic Hydrothermal Breccia |
3.04% |
1.17% |
| Volcanics |
Andesite; Andesitic Tuff; Rhyolite |
1.16% |
| Late Quartz Veins |
Quartz Vein |
Not Modelled in Leapfrog |
| Project Los Azules – S-K 1300 Technical Report Summary | Project No.: 21139-01 | 10-110 |
| Table
10.2: Event Timings and Material Types in the Ultimate Pit |
| Mineral
Zone |
Hydrothermal
Brx
(101) |
Early
Mineral
Porphyry (102) |
Pre-Mineral
Pluton
(103) |
Inter
Mineral
Porphyry (104) |
Overburden
(105) |
Magmatic
Hyd.
Breccia (106) |
Volcanics
(107) |
Late
Qtz
Veins
(108) |
Number
of
Blocks |
Average
Total
Cu (%) |
Number
of
Blocks |
Average
Total
Cu (%) |
Number
of
Blocks |
Average
Total
Cu (%) |
Number
of
Blocks |
Average
Total
Cu (%) |
Number
of
Blocks |
Average
Total
Cu (%) |
Number
of
Blocks |
Average
Total
Cu (%) |
Number
of
Blocks |
Average
Average
Total Cu (%) |
Not
Modeled in
Leapfrog |
| 2
- Oxide/LIX |
18 |
0.11 |
2,835 |
0.015 |
15,647 |
0.026 |
3,179 |
0.021 |
10,924 |
0.028 |
94 |
0.116 |
90 |
0.002 |
0 |
| 3
- Supergene |
55 |
1.45 |
2,478 |
0.750 |
2,420 |
0.803 |
673 |
0.611 |
|
|
211 |
1.341 |
|
|
0 |
| 4
- Mixed |
13 |
0.75 |
1 |
0.120 |
99 |
0.647 |
18 |
0.233 |
|
|
21 |
0.201 |
|
|
0 |
| 5
– Bornite/Chalcopyrite |
|
|
|
|
|
|
|
|
|
|
|
|
|
|
|
| 6
– Bornite |
|
|
|
|
|
|
|
|
|
|
|
|
|
|
|
| 7
– Primary |
|
|
3 |
0.530 |
|
|
|
|
|
|
|
|
|
|
|
| Total |
86 |
1.06 |
5,317 |
0.358 |
18,166 |
0.133 |
3,870 |
0.125 |
10,924 |
0.028 |
326 |
0.914 |
90 |
0.002 |
0 |
| Table
10.3: Event Timings and Material Types in 5 Year Pit |
| Mineral
Zone |
Hydrothermal
Brx
(101) |
Early
Mineral
Porphyry (102) |
Pre-Mineral
Pluton (103) |
Inter
Mineral
Porphyry (104) |
Overburden
(105) |
Magmatic
Hyd.
Breccia (106) |
Volcanics
(107) |
Late
Qtz
Veins (108) |
Number
Of
Blocks |
Average
Total
Cu (%) |
Number
Of
Blocks |
Average
Total
Cu (%) |
Number
Of
Blocks |
Average
Total
Cu (%) |
Number
Of
Blocks |
Average
Total
Cu (%) |
Number
Of
Blocks |
Average
Total
Cu (%) |
Number
Of
Blocks |
Average
Total
Cu (%) |
Number
Of
Blocks |
Average
Total
Cu (%) |
Not
Modeled in
Leapfrog |
| 2
- Oxide/LIX |
18 |
0.11 |
2,835 |
0.015 |
15,647 |
0.026 |
3,179 |
0.021 |
10,924 |
0.028 |
94 |
0.116 |
90 |
0.002 |
0 |
| 3
- Supergene |
55 |
1.45 |
2,478 |
0.750 |
2,420 |
0.803 |
673 |
0.611 |
|
|
211 |
1.341 |
|
|
0 |
| 4
- Mixed |
13 |
0.75 |
1 |
0.120 |
99 |
0.647 |
18 |
0.233 |
|
|
21 |
0.201 |
|
|
0 |
| 5
– Bornite/Chalcopyrite |
|
|
|
|
|
|
|
|
|
|
|
|
|
|
|
| 7
- Primary |
|
|
3 |
0.530 |
|
|
|
|
|
|
|
|
|
|
|
| Total |
86 |
1.06 |
5,317 |
0.358 |
18,166 |
0.133 |
3,870 |
0.125 |
10,924 |
0.028 |
326 |
0.914 |
90 |
0.002 |
0 |
| Project Los Azules – S-K 1300 Technical Report Summary | Project No.: 21139-01 | 10-111 |
Of the 78 samples, six (6) were labelled as Dacitic
Porphyry, 32 were labelled as Diorite, six (6) were labelled as Hydrothermal Magmatic Breccia, 13 were labelled as Oxide/LIX, eight (8)
were labelled as Porphyry Diorite, five (5) were labelled as Quartz Vein, and eight (8) were labelled as Rhyodacite Porphyry.
Out of the 78 total samples sent to SGS, nine
(9) composites were created based on the differing material types.
Significant testing information related to the
proposed Phase 1 processing option is summarized below.
Head Characterization
Detailed head assays and multi-element assays
for each sample and composite used in the Phase 1 Metallurgical program were performed. Table 10.4 shows the head assays and multi-element
assays for the various lithologies and rock types. The analyses are consistent with the sample analyses noted in the historical metallurgical
data. The summary of data is represented in Table 10.4 for Oxide/LIX, Table 10.5 for Supergene, and Table 10.6 for Primary material types.
| Project Los Azules – S-K 1300 Technical Report Summary | Project No.: 21139-01 | 10-112 |
| Table
10.4: Oxide/LIX Head Assays |
| BHID |
From
(m) |
To
(m) |
Zone |
CuT
(%) |
CuAS
(%) |
CuCN
(%) |
CuSOL
(%) |
CuSOL/CuT
Ratio
(%) |
Fe
(%) |
Mo
(%) |
Ag
(ppm) |
Au
(g/t) |
S
(%) |
Sulfide
(%) |
Sulfate
(g/t) |
C
(%) |
CO3
(%) |
Fluoride
(ppm) |
Hg
(g/t) |
Cl
(kg/t) |
As
(ppm) |
| AZ1047 |
72 |
102 |
Oxide/LIX |
0.358 |
0.053 |
0.162 |
0.215 |
60.06% |
1.764 |
0.004 |
5.13 |
0.28 |
0.39 |
0.32 |
<0.01 |
0.03 |
0.16 |
487 |
<0.15 |
0.10 |
429 |
| AZ1053A |
66 |
94 |
Oxide/LIX |
0.287 |
0.047 |
0.095 |
0.142 |
49.48% |
1.384 |
0.004 |
2.26 |
0.07 |
0.14 |
0.13 |
<0.01 |
0.06 |
0.29 |
615 |
0.62 |
0.10 |
61 |
| AZ1057 |
15 |
158 |
Oxide/LIX |
0.018 |
0.002 |
0.009 |
0.0011 |
61.11% |
1.225 |
0.003 |
0.78 |
0.11 |
0.26 |
0.05 |
<0.01 |
0.03 |
0.15 |
292 |
0.32 |
<0.1 |
22 |
| AZ1059 |
42 |
86 |
Oxide/LIX |
0.056 |
0.005 |
0.011 |
0.016 |
28.57% |
3.021 |
0.004 |
1.27 |
<0.03 |
0.1 |
0.07 |
<0.01 |
0.03 |
0.16 |
515 |
0.39 |
0.10 |
92 |
| AZ1060A |
68 |
96 |
Oxide/LIX |
0.063 |
0.013 |
0.012 |
0.025 |
39.68% |
1.976 |
0.001 |
1.39 |
0.05 |
0.05 |
0.01 |
<0.01 |
0.02 |
0.11 |
428 |
<0.15 |
<0.1 |
28 |
| AZ1061A |
54 |
68 |
Oxide/LIX |
0.032 |
0.003 |
0.008 |
0.011 |
34.38% |
1.561 |
<0.001 |
1.19 |
0.14 |
0.14 |
0.09 |
0.15 |
0.04 |
0.19 |
436 |
0.81 |
<0.1 |
135 |
| AZ1062 |
6 |
95 |
Oxide/LIX |
0.015 |
<0.002 |
0.006 |
0.008 |
53.33% |
1.635 |
0.002 |
0.47 |
0.06 |
0.27 |
0.07 |
0.2 |
0.02 |
0.12 |
595 |
0.88 |
<0.1 |
83 |
| AZ1064A |
14 |
112 |
Oxide/LIX |
0.014 |
<0.002 |
0.005 |
0.007 |
50.00% |
1.557 |
0.003 |
0.63 |
0.05 |
0.26 |
0.05 |
0.07 |
0.04 |
0.19 |
489 |
0.41 |
<0.1 |
56 |
| AZ1170 |
62 |
102 |
Oxide/LIX |
0.03 |
0.003 |
0.006 |
0.009 |
30.00% |
1.418 |
<0.001 |
0.77 |
0.09 |
0.22 |
0.17 |
<0.01 |
0.02 |
0.1 |
627 |
<0.15 |
<0.1 |
30 |
| AZ1171 |
86 |
144 |
Oxide/LIX |
0.085 |
0.009 |
0.04 |
0.049 |
57.65% |
1.241 |
<0.001 |
0.37 |
<0.03 |
0.8 |
0.79 |
<0.01 |
0.02 |
0.1 |
534 |
<0.15 |
<0.1 |
12 |
| AZ1294 |
58 |
110 |
Oxide/LIX |
0.271 |
0.016 |
0.098 |
0.114 |
42.07% |
1.782 |
0.005 |
1.68 |
<0.03 |
0.43 |
0.38 |
<0.01 |
0.03 |
0.13 |
498 |
<0.15 |
0.10 |
30 |
| AZ17122 |
64 |
158 |
Oxide/LIX |
0.119 |
0.016 |
0.064 |
0.08 |
67.23% |
2.065 |
<0.001 |
0.42 |
<0.03 |
1.11 |
1.08 |
<0.01 |
0.02 |
0.11 |
752 |
0.95 |
<0.1 |
95 |
| AZ17130 |
114 |
130 |
Oxide/LIX |
0.036 |
0.004 |
0.005 |
0.009 |
25.00% |
1.57 |
0.003 |
1.6 |
0.04 |
0.07 |
0.04 |
<0.01 |
0.02 |
0.09 |
684 |
<0.15 |
<0.1 |
24 |
| Table
10.5: Supergene Head Assays |
| BHID |
From
(m) |
To
(m) |
Zone |
Lithology |
CuT
(%) |
CuAS
(%) |
CuCN
(%) |
CuSOL
(%) |
CuSOL/
CuT
Ratio
(%) |
Fe
(%) |
Mo
(%) |
Ag
(ppm) |
Au
(g/t) |
S
(%) |
Sulfide
(%) |
Sulfate
(g/t) |
C
(%) |
CO3
(%) |
Fluoride
(ppm) |
Hg
(g/t) |
Cl
(kg/t) |
As
(ppm) |
| AZ0835 |
127 |
168 |
Supergene |
Dacitic
Porphyry |
0.209 |
0.022 |
0.117 |
0.139 |
66.51% |
1.732 |
0.003 |
0.69 |
<0.03 |
0.44 |
0.4 |
<0.01 |
0.04 |
0.18 |
452 |
0.42 |
0.10 |
8 |
| AZ0835 |
174 |
269 |
Supergene |
Dacitic
Porphyry |
0.222 |
0.012 |
0.078 |
0.09 |
40.54% |
1.15 |
0.004 |
1.04 |
<0.03 |
0.68 |
0.65 |
0.07 |
0.02 |
0.11 |
551 |
0.7 |
0.14 |
14 |
| AZ1053A |
264 |
322 |
Supergene |
Dacitic
Porphyry |
0.4 |
0.022 |
0.194 |
0.216 |
54.00% |
1.166 |
0.002 |
1.49 |
0.04 |
0.6 |
0.51 |
<0.01 |
0.02 |
0.1 |
576 |
0.41 |
0.10 |
134 |
| AZ0614 |
132 |
180 |
Supergene |
Diorite |
1.131 |
0.055 |
0.716 |
0.771 |
68.17% |
2.226 |
0.003 |
1.79 |
0.16 |
1.17 |
1.12 |
0.07 |
0.04 |
0.22 |
783 |
<0.15 |
<0.1 |
21 |
| AZ0618 |
90 |
108 |
Supergene |
Diorite |
0.26 |
0.024 |
0.172 |
0.196 |
75.38% |
1.851 |
0.002 |
1.18 |
<0.03 |
1.27 |
0.71 |
<0.01 |
0.02 |
0.12 |
566 |
<0.15 |
<0.1 |
24 |
| AZ0618 |
132 |
192 |
Supergene |
Diorite |
0.153 |
0.016 |
0.076 |
0.092 |
60.13% |
1.638 |
0.002 |
0.6 |
<0.03 |
0.69 |
0.64 |
0.06 |
0.02 |
0.12 |
267 |
0.84 |
<0.1 |
19 |
| AZ0835 |
276 |
293 |
Supergene |
Diorite |
0.189 |
0.006 |
0.024 |
0.03 |
15.87% |
2.667 |
0.004 |
1.51 |
0.06 |
1.12 |
0.99 |
0.04 |
0.19 |
0.95 |
486 |
<0.15 |
<0.1 |
206 |
| AZ1047 |
116 |
138 |
Supergene |
Diorite |
1.001 |
0.087 |
0.591 |
0.678 |
67.73% |
1.485 |
0.005 |
4.53 |
0.12 |
0.94 |
0.94 |
0.01 |
0.05 |
0.25 |
513 |
1.75 |
<0.1 |
198 |
| AZ1047 |
276 |
372 |
Supergene |
Diorite |
0.452 |
0.008 |
0.231 |
0.239 |
52.88% |
1.855 |
0.005 |
1.4 |
0.04 |
0.33 |
0.3 |
<0.01 |
0.19 |
0.94 |
522 |
<0.15 |
0.15 |
24 |
| AZ1055 |
128 |
188 |
Supergene |
Diorite |
0.7 |
0.045 |
0.008 |
0.053 |
7.57% |
1.999 |
0.002 |
0.9 |
<0.03 |
1.12 |
1.09 |
<0.01 |
0.04 |
0.2 |
459 |
0.24 |
<0.1 |
67 |
| AZ1059 |
86 |
154 |
Supergene |
Diorite |
0.347 |
0.019 |
0.005 |
0.024 |
6.92% |
2.337 |
0.004 |
1.25 |
0.03 |
0.26 |
0.25 |
0.46 |
0.02 |
0.1 |
758 |
0.43 |
<0.1 |
28 |
| AZ1063 |
120 |
162 |
Supergene |
Diorite |
0.927 |
0.035 |
0.566 |
0.601 |
64.83% |
1.366 |
0.003 |
0.83 |
0.09 |
1 |
0.95 |
<0.01 |
0.02 |
0.09 |
892 |
0.36 |
<0.1 |
49 |
| AZ1064A |
206 |
224 |
Supergene |
Diorite |
0.643 |
0.023 |
0.418 |
0.441 |
68.58% |
1.392 |
0.002 |
1.56 |
0.08 |
1.48 |
1.33 |
<0.01 |
0.11 |
0.53 |
375 |
<0.15 |
0.10 |
53 |
| AZ12100 |
208 |
242 |
Supergene |
Diorite |
0.221 |
0.015 |
0.102 |
0.117 |
52.94% |
1.917 |
<0.001 |
0.3 |
<0.03 |
0.64 |
0.61 |
<0.01 |
0.02 |
0.08 |
416 |
<0.15 |
0.20 |
8 |
| AZ12106 |
118 |
206 |
Supergene |
Diorite |
0.994 |
0.04 |
0.602 |
0.642 |
64.59% |
1.474 |
0.005 |
1.76 |
0.1 |
0.59 |
0.7 |
0.09 |
0.03 |
0.17 |
331 |
<0.15 |
0.13 |
14 |
| AZ17130 |
217 |
286 |
Supergene |
Diorite |
0.35 |
0.016 |
0.163 |
0.179 |
51.14% |
1.417 |
0.003 |
1.57 |
0.05 |
0.33 |
0.31 |
<0.01 |
0.02 |
0.11 |
462 |
0.21 |
0.13 |
27 |
| Project Los Azules – S-K 1300 Technical Report Summary | Project No.: 21139-01 | 10-113 |
| Table
10.5: Supergene Head Assays |
| BHID |
From
(m) |
To
(m) |
Zone |
Lithology |
CuT
(%) |
CuAS
(%) |
CuCN
(%) |
CuSOL
(%) |
CuSOL/
CuT
Ratio
(%) |
Fe
(%) |
Mo
(%) |
Ag
(ppm) |
Au
(g/t) |
S
(%) |
Sulfide
(%) |
Sulfate
(g/t) |
C
(%) |
CO3
(%) |
Fluoride
(ppm) |
Hg
(g/t) |
Cl
(kg/t) |
As
(ppm) |
| AZ0946 |
128 |
250 |
Supergene |
Hydrothermal
Magmatic Breccia |
1.026 |
0.024 |
0.471 |
0.495 |
48.25% |
1.674 |
0.005 |
3.56 |
0.12 |
0.8 |
0.76 |
0.04 |
0.02 |
0.12 |
379 |
<0.15 |
0.11 |
79 |
| AZ1053A |
116 |
160 |
Supergene |
Hydrothermal
Magmatic Breccia |
1.279 |
0.07 |
0.826 |
0.896 |
70.05% |
1.144 |
0.005 |
2.02 |
0.06 |
0.7 |
0.66 |
0.01 |
0.02 |
0.1 |
525 |
<0.15 |
0.10 |
30 |
| AZ12116 |
152 |
202 |
Supergene |
Hydrothermal
Magmatic Breccia |
1.039 |
0.034 |
0.705 |
0.739 |
71.13% |
1.429 |
<0.001 |
0.49 |
<0.03 |
1.44 |
1.12 |
<0.01 |
0.02 |
0.09 |
559 |
0.31 |
0.10 |
11 |
| AZ1055 |
246 |
254 |
Supergene |
Porphyry
Diorite |
0.39 |
0.019 |
0.176 |
0.195 |
50.00% |
1.594 |
0.002 |
2.95 |
<0.03 |
0.71 |
0.67 |
<0.01 |
0.05 |
0.25 |
441 |
<0.15 |
0.10 |
16 |
| AZ12114 |
130 |
186 |
Supergene |
Porphyry
Diorite |
0.233 |
0.017 |
0.143 |
0.16 |
68.67% |
2.752 |
<0.001 |
0.56 |
<0.03 |
3.04 |
2.98 |
<0.01 |
0.02 |
0.08 |
636 |
<0.15 |
<0.1 |
101 |
| AZ17127 |
230 |
255 |
Supergene |
Porphyry
Diorite |
0.226 |
0.026 |
0.127 |
0.153 |
67.70% |
1.098 |
0.001 |
0.97 |
<0.03 |
0.26 |
0.25 |
<0.01 |
0.01 |
0.06 |
336 |
0.18 |
<0.1 |
10 |
| AZ17128 |
288 |
342 |
Supergene |
Porphyry
Diorite |
0.239 |
0.011 |
0.067 |
0.078 |
32.64% |
1.831 |
0.002 |
1.14 |
0.05 |
0.76 |
0.24 |
1.39 |
0.04 |
0.2 |
788 |
<0.15 |
<0.1 |
96 |
| AZ17128 |
196 |
258 |
Supergene |
Porphyry
Diorite |
0.121 |
0.004 |
0.033 |
0.037 |
30.58% |
2.409 |
0.002 |
0.91 |
<0.03 |
0.22 |
0.19 |
<0.01 |
0.02 |
0.11 |
348 |
0.42 |
<0.1 |
55 |
| AZ17134 |
166 |
194 |
Supergene |
Porphyry
Diorite |
0.589 |
0.025 |
0.268 |
0.293 |
49.75% |
1.288 |
0.001 |
1.03 |
0.04 |
1.1 |
1.02 |
<0.01 |
0.08 |
0.39 |
420 |
<0.15 |
0.10 |
32 |
| AZ0611 |
151.8 |
155 |
Supergene |
Quartz |
0.156 |
0.015 |
0.099 |
0.114 |
73.08% |
0.497 |
<0.001 |
1.42 |
0.05 |
0.51 |
0.42 |
0.08 |
0.03 |
0.14 |
264 |
0.18 |
<0.1 |
68 |
| AZ0843 |
127 |
132 |
Supergene |
Quartz |
0.405 |
0.025 |
0.25 |
0.275 |
67.90% |
1.061 |
0.001 |
30 |
0.25 |
0.93 |
0.87 |
0.04 |
0.06 |
0.3 |
515 |
0.25 |
<0.1 |
49 |
| AZ1055 |
232 |
244 |
Supergene |
Quartz |
0.479 |
0.023 |
0.276 |
0.299 |
62.42% |
1.031 |
0.002 |
3.78 |
<0.03 |
1 |
0.81 |
0.16 |
0.07 |
0.34 |
466 |
<0.15 |
<0.1 |
23 |
| AZ0835 |
144 |
153 |
Supergene |
Rhyodacite
Porphyry |
0.216 |
0.014 |
0.085 |
0.099 |
45.83% |
1.727 |
0.003 |
0.28 |
<0.03 |
0.4 |
0.37 |
0.04 |
0.03 |
0.17 |
336 |
<0.15 |
0.10 |
4 |
| AZ0838 |
194 |
236 |
Supergene |
Rhyodacite
Porphyry |
0.453 |
0.02 |
0.248 |
0.268 |
59.16% |
1.254 |
0.001 |
1.04 |
0.04 |
1.07 |
0.99 |
<0.01 |
0.05 |
0.23 |
685 |
0.58 |
<0.1 |
10 |
| AZ1057 |
213 |
279 |
Supergene |
Rhyodacite
Porphyry |
0.625 |
0.029 |
0.449 |
0.478 |
76.48% |
1.427 |
0.002 |
1.19 |
0.07 |
1.62 |
1.44 |
0.16 |
0.03 |
0.15 |
432 |
<0.15 |
<0.1 |
57 |
| AZ12100 |
114 |
184 |
Supergene |
Rhyodacite
Porphyry |
0.584 |
0.033 |
0.485 |
0.518 |
88.70% |
1.391 |
0.002 |
1.66 |
0.04 |
1.18 |
1.14 |
0.07 |
0.02 |
0.1 |
577 |
0.34 |
<0.1 |
13 |
| Project Los Azules – S-K 1300 Technical Report Summary | Project No.: 21139-01 | 10-114 |
| Table
10.6: Primary Head Assays |
| BHID |
From
(m) |
To
(m) |
Zone |
Lithology |
CuT
(%) |
CuAS
(%) |
CuCN
(%) |
CuSOL
(%) |
CuSOL/CuT
Ratio
(%) |
Fe
(%) |
Mo
(%) |
Ag
(ppm) |
Au
(g/t) |
S
(%) |
Sulfide
(%) |
Sulfate
(g/t) |
C
(%) |
CO3
(%) |
Fluoride
(ppm) |
Hg
(g/t) |
Cl
(kg/t) |
As
(ppm) |
| AZ1053A |
426 |
506 |
Primary |
Dacitic
Porphyry |
0.305 |
0.012 |
0.082 |
0.094 |
30.82% |
1.312 |
0.002 |
1.67 |
<0.03 |
0.68 |
0.4 |
0.48 |
0.05 |
0.25 |
495 |
0.84 |
<0.1 |
12 |
| AZ1058 |
212 |
290 |
Primary |
Dacitic
Porphyry |
0.339 |
0.015 |
0.024 |
0.039 |
11.50% |
1.359 |
0.002 |
1.01 |
0.05 |
1.32 |
0.77 |
1.13 |
0.05 |
0.23 |
482 |
0.15 |
<0.1 |
123 |
| AZ17120 |
168 |
217 |
Primary |
Dacitic
Porphyry |
0.965 |
0.039 |
0.618 |
0.657 |
68.08% |
1.653 |
<0.001 |
1.01 |
0.04 |
1.6 |
1.52 |
<0.01 |
0.02 |
0.09 |
463 |
<0.15 |
<0.1 |
20 |
| AZ0618 |
290 |
316.4 |
Primary |
Diorite |
0.241 |
0.003 |
0.016 |
0.019 |
7.88% |
2.059 |
0.002 |
0.84 |
<0.03 |
1.79 |
1.73 |
0.06 |
0.02 |
0.12 |
838 |
<0.15 |
<0.1 |
14 |
| AZ0946 |
372 |
464.9 |
Primary |
Diorite |
0.308 |
0.008 |
0.079 |
0.087 |
28.25% |
1.393 |
0.003 |
1.24 |
0.05 |
0.81 |
0.28 |
1.43 |
0.06 |
0.3 |
557 |
0.4 |
0.16 |
81 |
| AZ1047 |
408 |
492 |
Primary |
Diorite |
0.279 |
0.017 |
0.148 |
0.165 |
59.14% |
1.388 |
0.002 |
1.16 |
0.05 |
0.65 |
0.27 |
1.05 |
0.08 |
0.41 |
672 |
0.67 |
0.17 |
58 |
| AZ1054 |
292 |
356 |
Primary |
Diorite |
0.253 |
0.014 |
0.052 |
0.066 |
26.09% |
1.764 |
0.001 |
0.41 |
<0.03 |
0.67 |
0.66 |
0.13 |
0.02 |
0.09 |
443 |
<0.15 |
<0.1 |
8 |
| AZ1055 |
336 |
408 |
Primary |
Diorite |
0.415 |
0.029 |
0.175 |
0.204 |
49.16% |
1.667 |
0.003 |
0.96 |
<0.03 |
0.51 |
0.47 |
0.03 |
0.03 |
0.17 |
435 |
0.75 |
0.11 |
12 |
| AZ1059 |
451 |
526 |
Primary |
Diorite |
0.285 |
0.007 |
0.105 |
0.112 |
39.30% |
1.914 |
0.001 |
1.76 |
0.05 |
2.23 |
0.31 |
6.36 |
0.12 |
0.61 |
405 |
0.2 |
0.17 |
28 |
| AZ1064A |
312 |
404 |
Primary |
Diorite |
0.314 |
0.009 |
0.056 |
0.065 |
20.70% |
1.099 |
<0.001 |
0.8 |
0.05 |
2.06 |
0.5 |
3.46 |
0.04 |
0.19 |
499 |
<0.15 |
<0.1 |
12 |
| AZ1168 |
318 |
354 |
Primary |
Diorite |
0.611 |
0.022 |
0.253 |
0.275 |
45.01% |
1.047 |
0.004 |
1.92 |
0.07 |
0.56 |
0.52 |
<0.01 |
0.04 |
0.2 |
377 |
<0.15 |
0.20 |
10 |
| AZ1173 |
120 |
157 |
Primary |
Diorite |
0.208 |
0.012 |
0.045 |
0.057 |
27.40% |
2.552 |
0.002 |
0.71 |
<0.03 |
0.53 |
0.41 |
<0.01 |
0.03 |
0.15 |
496 |
<0.15 |
<0.1 |
15 |
| AZ12113 |
92 |
126 |
Primary |
Diorite |
0.676 |
0.058 |
0.388 |
0.446 |
65.98% |
2.534 |
0.02 |
0.7 |
<0.03 |
1.26 |
1.24 |
0.05 |
0.02 |
0.09 |
408 |
<0.15 |
<0.1 |
301 |
| AZ1280 |
76 |
90 |
Primary |
Diorite |
0.428 |
0.032 |
0.192 |
0.224 |
52.34% |
2.222 |
0.002 |
0.47 |
<0.03 |
1.09 |
1.04 |
0.05 |
0.03 |
0.14 |
481 |
<0.15 |
<0.1 |
55 |
| AZ1280 |
98 |
136 |
Primary |
Diorite |
0.109 |
0.003 |
0.011 |
0.014 |
12.84% |
2.874 |
0.002 |
0.25 |
<0.03 |
0.41 |
0.36 |
0.02 |
0.05 |
0.26 |
574 |
<0.15 |
<0.1 |
144 |
| AZ1284 |
196 |
310 |
Primary |
Diorite |
0.186 |
<0.002 |
0.033 |
0.035 |
18.82% |
1.99 |
0.011 |
0.62 |
<0.03 |
0.55 |
0.52 |
0.07 |
0.05 |
0.27 |
603 |
<0.15 |
0.10 |
15 |
| AZ1285 |
195.1 |
416 |
Primary |
Diorite |
0.144 |
0.003 |
0.018 |
0.021 |
14.58% |
2.361 |
0.003 |
0.55 |
<0.03 |
0.84 |
0.35 |
1.22 |
0.08 |
0.42 |
654 |
<0.15 |
<0.1 |
29 |
| AZ1294 |
252 |
310 |
Primary |
Diorite |
1.013 |
0.014 |
0.097 |
0.111 |
10.96% |
2.506 |
0.002 |
2.09 |
0.07 |
1.71 |
1.63 |
<0.01 |
0.05 |
0.23 |
540 |
<0.15 |
0.20 |
199 |
| AZ1299 |
70 |
108 |
Primary |
Diorite |
0.315 |
0.059 |
0.204 |
0.263 |
83.49% |
2.667 |
0.002 |
0.38 |
<0.03 |
0.52 |
0.47 |
0.03 |
0.01 |
0.05 |
984 |
0.25 |
<0.1 |
308 |
| AZ1053A |
522 |
538 |
Primary |
Hydrothermal
Magmatic Breccia |
1.483 |
0.011 |
0.31 |
0.321 |
21.65% |
3.314 |
0.004 |
5.46 |
0.19 |
2.51 |
1.35 |
3.09 |
0.09 |
0.43 |
564 |
<0.15 |
0.16 |
41 |
| AZ1059 |
344 |
396 |
Primary |
Hydrothermal
Magmatic Breccia |
0.772 |
0.027 |
0.332 |
0.359 |
46.50% |
2.056 |
0.003 |
3.33 |
0.07 |
2.52 |
0.47 |
5.55 |
0.05 |
0.26 |
544 |
0.92 |
<0.1 |
120 |
| AZ1067 |
342 |
362 |
Primary |
Hydrothermal
Magmatic Breccia |
0.42 |
0.02 |
0.122 |
0.142 |
33.81% |
1.026 |
0.02 |
2.5 |
<0.03 |
0.98 |
0.89 |
0.12 |
0.04 |
0.18 |
313 |
0.62 |
<0.1 |
105 |
| AZ1065 |
322 |
384 |
Primary |
Porphyry
Diorite |
0.27 |
0.003 |
0.034 |
0.037 |
13.70% |
1.189 |
0.002 |
1.25 |
0.04 |
2.07 |
0.59 |
3.9 |
0.05 |
0.26 |
818 |
0.27 |
<0.1 |
19 |
| AZ12116 |
320 |
414 |
Primary |
Porphyry
Diorite |
0.231 |
<0.002 |
0.029 |
0.031 |
13.42% |
1.19 |
0.003 |
1.05 |
<0.03 |
1.12 |
0.35 |
2.57 |
0.06 |
0.3 |
394 |
<0.15 |
<0.1 |
16 |
| AZ12100 |
705 |
709 |
Primary |
Quartz |
0.268 |
<0.002 |
0.019 |
0.021 |
7.84% |
1.611 |
0.005 |
1.76 |
0.03 |
5.11 |
1.16 |
11.3 |
0.43 |
2.15 |
574 |
0.92 |
<0.1 |
82 |
| AZ12114 |
422 |
432 |
Primary |
Quartz |
0.544 |
<0.002 |
0.022 |
0.024 |
4.41% |
3.181 |
0.005 |
23.3 |
0.38 |
5.53 |
3.91 |
3.99 |
0.14 |
0.7 |
797 |
2.41 |
<0.1 |
175 |
| AZ0838 |
237.6 |
340 |
Primary |
Rhyodacite
Porphyry |
0.278 |
0.013 |
0.118 |
0.131 |
47.12% |
1.151 |
0.002 |
0.91 |
<0.03 |
0.56 |
0.56 |
<0.01 |
0.06 |
0.28 |
372 |
<0.15 |
0.10 |
23 |
| AZ0946 |
252 |
370 |
Primary |
Rhyodacite
Porphyry |
0.319 |
0.007 |
0.135 |
0.142 |
44.51% |
1.34 |
0.004 |
1.43 |
0.05 |
0.64 |
0.22 |
1.12 |
0.05 |
0.26 |
573 |
0.58 |
0.15 |
79 |
| AZ1057 |
303 |
345 |
Primary |
Rhyodacite
Porphyry |
0.277 |
0.014 |
0.086 |
0.1 |
36.10% |
1.868 |
0.001 |
0.62 |
0.05 |
1.75 |
1.7 |
0.05 |
0.03 |
0.14 |
507 |
<0.15 |
<0.1 |
8 |
| Project Los Azules – S-K 1300 Technical Report Summary | Project No.: 21139-01 | 10-115 |
Sulfuric Acid Bottle Rolls
Bottle roll testing was completed at the SGS laboratory
in Santiago. The tests were completed with 1 kg charge of material at 100% passing -10 mesh. Material charges were placed in a 10L bottle
with a leach solution at pH 1.5 and a slurry density of 1:2 (w/w solid liquid). A total of 114 bottle rolls were completed at SGS. This
testing spanned 38 different samples (9 composites, 29 drill hole samples) with three (3) bottles at the same conditions except varying
additions of Fe at 0, 2, and 5 g/L.
Bottle rolls pH was adjusted and maintained at
1.5 pH with control checks at 2, 4, 6, 12, 24, 48, 72, and 96 hours. After 96 hours, the tests were completed with the solution/solids,
filtered, and analyzed.
Two main parameters were to be demonstrated from
the work: maximum acid consumption and maximum acid soluble copper recovery.
The summary of the Supergene results is presented
in Table 10.7 and Primary results are presented in Table 10.8.
| Table 10.7: Supergene Bottle Roll Results |
| Sample |
Ferric Addition |
Copper (%) |
Recovery |
H2SO4 Consumption |
| Fe+2 (g/L) |
Assayed Head
CuT (%) |
Calculated Head
CuT (%) |
Cu in Solution
(%) |
Tail Assay
CuT (%) |
CuT Recovery
(%) |
Gross
kg/t |
Net
kg/t |
Specific
(Gangue)
kg H2SO4 / kg Cu |
| Average |
0 |
0.586 |
0.590 |
0.52 |
0.492 |
18.37 |
20.7 |
19.1 |
37.9 |
| |
2 |
0.586 |
0.565 |
0.96 |
0.379 |
31.61 |
13.0 |
10.0 |
15.8 |
| |
5 |
0.586 |
0.497 |
1.38 |
0.226 |
41.32 |
8.4 |
4.2 |
11.1 |
| Average Diorite |
0 |
0.445 |
0.468 |
0.40 |
0.392 |
18.23 |
26.3 |
25.1 |
76.4 |
| |
2 |
0.445 |
0.442 |
0.62 |
0.321 |
26.84 |
11.9 |
9.8 |
33.6 |
| |
5 |
0.445 |
0.351 |
1.02 |
0.151 |
34.25 |
10.8 |
7.8 |
36.8 |
| Average Dacitic Porphyry |
0 |
0.222 |
0.235 |
0.20 |
0.198 |
17.74 |
27.1 |
26.5 |
67.3 |
| |
2 |
0.222 |
0.260 |
0.33 |
0.202 |
27.02 |
11.1 |
10.1 |
16.9 |
| |
5 |
0.222 |
0.233 |
0.35 |
0.160 |
31.35 |
4.7 |
3.6 |
5.2 |
| Average Rhyodacite Porphyry |
0 |
0.554 |
0.545 |
0.70 |
0.414 |
24.44 |
20.5 |
18.4 |
13.2 |
| |
2 |
0.554 |
0.543 |
1.17 |
0.318 |
41.35 |
12.9 |
9.4 |
4.1 |
| |
5 |
0.554 |
0.560 |
1.53 |
0.254 |
54.51 |
6.7 |
2.0 |
0.7 |
| Average Hydrothermal Magmatic Breccia |
0 |
1.115 |
1.100 |
0.86 |
0.944 |
15.10 |
19.7 |
17.0 |
11.6 |
| |
2 |
1.115 |
1.088 |
1.73 |
0.755 |
30.15 |
16.9 |
11.7 |
3.9 |
| |
5 |
1.115 |
0.875 |
2.69 |
0.357 |
46.43 |
10.9 |
2.8 |
0.5 |
| Average Porphyry Diorite |
0 |
0.351 |
0.365 |
0.239 |
0.32 |
15.93 |
14.4 |
13.5 |
40.9 |
| |
2 |
0.351 |
0.290 |
0.540 |
0.18 |
29.65 |
10.9 |
9.2 |
21.4 |
| |
5 |
0.351 |
0.292 |
0.640 |
0.17 |
33.42 |
6.4 |
4.5 |
8.2 |
| Project Los Azules – S-K 1300 Technical Report Summary | Project No.: 21139-01 | 10-116 |
| Table 10.8: Primary Bottle Roll Results |
| Sample |
Ferric Addition |
Copper (%) |
Recovery |
H2SO4 Consumption |
| Fe+2 (g/L) |
Assayed Head
CuT (%) |
Calculated Head
CuT (%) |
Cu in Solution
(%) |
Tail Assay
CuT (%) |
CuT Recovery
(%) |
Gross
kg/t |
Net
kg/t |
Specific
(Gangue)
kg H2SO4 / kg Cu |
| Average Primary |
0 |
0.369 |
0.369 |
0.15 |
0.345 |
9.50 |
27.2 |
26.7 |
278.7 |
| |
2 |
0.369 |
0.352 |
0.29 |
0.303 |
16.89 |
19.9 |
19.0 |
125.7 |
| |
5 |
0.369 |
0.146 |
0.33 |
0.054 |
19.28 |
7.4 |
6.4 |
50.1 |
| Average Diorite |
0 |
0.246 |
0.240 |
0.17 |
0.211 |
12.35 |
26.1 |
25.6 |
247.1 |
| |
2 |
0.246 |
0.236 |
0.28 |
0.185 |
20.94 |
22.1 |
21.3 |
122.5 |
| |
5 |
0.246 |
0.159 |
0.32 |
0.048 |
23.77 |
7.9 |
6.9 |
52.9 |
| Average Dacitic Porphyry |
0 |
0.333 |
0.340 |
0.03 |
0.339 |
1.56 |
26.3 |
26.2 |
503.5 |
| |
2 |
0.333 |
0.333 |
0.04 |
0.338 |
2.16 |
23.1 |
23.0 |
320.0 |
| |
5 |
0.333 |
0.007 |
0.04 |
0.000 |
2.07 |
4.4 |
4.3 |
62.8 |
| Average Rhyodacite Porphyry |
0 |
0.299 |
0.302 |
0.17 |
0.273 |
12.13 |
21.5 |
21.0 |
75.6 |
| |
2 |
0.299 |
0.299 |
0.36 |
0.233 |
24.50 |
19.6 |
18.5 |
32.2 |
| |
5 |
0.299 |
0.171 |
0.41 |
0.087 |
29.04 |
4.8 |
3.5 |
4.6 |
| Average Hydrothermal Magmatic Breccia |
0 |
1.128 |
1.145 |
0.26 |
1.114 |
5.58 |
35.7 |
34.9 |
67.3 |
| |
2 |
1.128 |
1.167 |
0.61 |
1.065 |
12.70 |
17.3 |
15.5 |
13.7 |
| |
5 |
1.128 |
1.109 |
0.68 |
0.960 |
14.35 |
11.2 |
9.1 |
7.5 |
| Average Porphyry Diorite |
0 |
0.251 |
0.256 |
0.03 |
0.256 |
1.92 |
29.6 |
29.6 |
723.5 |
| |
2 |
0.251 |
0.125 |
0.03 |
0.121 |
2.61 |
11.1 |
11.0 |
248.5 |
| |
5 |
0.251 |
0.138 |
0.04 |
0.131 |
2.88 |
5.5 |
5.4 |
119.0 |
| Project Los Azules – S-K 1300 Technical Report Summary | Project No.: 21139-01 | 10-117 |
Sulfuric Acid Column Bio-leach
Compositing of material from Table 10.9 was completed
at SGS in 2022 based on creating graded material types to compare to the Plenge data. Additionally, based on additional material present,
AZ-1285 and AZ-0946 were selected for column testing.
The composite columns are currently in progress
and results to date are considered preliminary. Material for the column tests were crushed to 100% passing 19 mm (3/4 inch) and 12.7 mm
(1/2 inch) for size recovery. All columns with 19 mm material were conducted in 152.4 mm I.D. by 3 m tall columns, containing approximately
75 kg of material. All columns with 12.7 mm material were conducted in 101.6 mm I.D. by 3 m tall columns, containing approximately 35
kg of material. Column leach testing is being completed in a closed circuit with solvent extraction (SX). A synthetic raffinate was used
to start the column leach, comprising of Santiago tap water, 5 g/L sulfuric acid, and 2 g/L ferric.
Column material standing moisture was approximately
2%, whereas SGS agglomerated the material to 5% moisture using the synthetic raffinate before being placed in each column. Columns were
allowed to rest for two (2) days before being fed with the raffinate. The raffinate is being added at a rate of 6 L/hr/m2 with
biomass inoculated into the raffinate solution to the columns. The active biomass was produced from an already active SGS culture to simulate
a mature bio-leaching system.
All 21 columns were started on October 1st,
2022, running at ambient temperature (average temperature of columns was 18.6 C when loaded) and without air addition. Solution breakthrough
was completed after two (2) days for the 12.7 mm material and three (3) days after the 19 mm material. Acid is added to the columns when
the pH arises above 2.2, however, the columns are maintained at a pH between 1.8 and 2.2.
Additionally, 90 kg samples from Composite 6,
Composite 7, Composite 8, and Composite 9 from this program were shipped and delivered to Melbourne, Australia in early November 2022
to undertake alternative leaching techniques.
The head assays for each of the columns prepared,
is presented in Table 10.9.
| Project Los Azules – S-K 1300 Technical Report Summary | Project No.: 21139-01 | 10-118 |
| Table 10.9: Column Head Assays |
| Composite Number |
Column Number |
Size Fraction |
Material Type |
CuT (%) |
CuAS (%) |
CuCN (%) |
CuSOL (%) |
CuSOL/CuT
Ratio (%) |
Fe (%) |
Au
(g/t) |
S
(%) |
| Composite 1 |
Column 1 |
P100% - 19 mm |
Oxide/LIX |
0.047 |
0.005 |
0.021 |
0.026 |
55.32 |
1.177 |
0.12 |
0.28 |
| |
Column 12 |
P100% - 12.7 mm |
Oxide/LIX |
| Composite 2 |
Column 2 |
P100% - 19 mm |
Oxide/LIX |
0.019 |
0.002 |
0.006 |
0.008 |
44.11 |
1.587 |
0.05 |
0.28 |
| |
Column 13 |
P100% - 12.7 mm |
Oxide/LIX |
| Composite 3 |
Column 3 |
P100% - 19 mm |
Oxide/LIX |
0.123 |
0.016 |
0.046 |
0.062 |
50.41 |
1.956 |
0.30 |
0.81 |
| |
Column 14 |
P100% - 12.7 mm |
Oxide/LIX |
| Composite 4 |
Column 4 |
P100% - 19 mm |
Supergene |
0.45 |
0.024 |
0.272 |
0.296 |
65.78 |
2.329 |
0.06 |
0.70 |
| |
Column 15 |
P100% - 12.7 mm |
Supergene |
| Composite 5 |
Column 5 |
P100% - 19 mm |
Supergene |
0.405 |
0.018 |
0.22 |
0.238 |
58.77 |
1.894 |
0.03 |
0.81 |
| |
Column 16 |
P100% - 12.7 mm |
Supergene |
| Composite 6 |
Column 6 |
P100% - 19 mm |
Supergene |
0.475 |
0.018 |
0.254 |
0.272 |
57.26 |
1.897 |
0.03
|
0.74 |
| |
Column 17 |
P100% - 12.7 mm |
Supergene |
| Composite 7 |
Column 7 |
P100% - 19 mm |
Primary |
0.238 |
0.003 |
0.018 |
0.021 |
8.82 |
2.591 |
0.04 |
1.45 |
| |
Column 18 |
P100% - 12.7 mm |
Primary |
| Composite 8 |
Column 8 |
P100% - 19 mm |
Primary |
0.375 |
0.008 |
0.075 |
0.083 |
22.13 |
1.828 |
0.05 |
1.17 |
| |
Column 19 |
P100% - 12.7 mm |
Primary |
| Composite 9 |
Column 9 |
P100% - 19 mm |
Primary |
0.578 |
0.021 |
0.232 |
0.253 |
43.77 |
2.076 |
0.27 |
1.02 |
| |
Column 20 |
P100% - 12.7 mm |
Primary |
| AZ-1285 |
Column 10 |
P100% - 19 mm |
Supergene |
0.144 |
0.003 |
0.018 |
0.021 |
14.58 |
2.361 |
<0.03 |
0.84 |
| |
Column 21 |
P100% - 12.7 mm |
Supergene |
| AZ-0946 |
Column 11 |
P100% - 19 mm |
Primary |
1.026 |
0.024 |
0.471 |
0.495 |
48.25 |
1.674 |
0.12 |
0.80 |
| Project Los Azules – S-K 1300 Technical Report Summary | Project No.: 21139-01 | 10-119 |
As of the effective date of this report, the Phase
1 columns were completed and results from leaching on a solution and head assay basis has been reported by SGS. Column residues were being
prepared for analysis. Until tails assays are confirmed, copper recovery based on head assays are only indicative and significant variations
may be present. Fitted logarithmic curves are included with each figure to represent the best approximation of copper recovery in the
future.
Due to the very low-grade nature of Composites
1 and 2 were observed once head assays were completed, both samples were tested for a total of 30 days prior to being taken offline and
washed.
| 10.2.1.1 | Column Test work and Recoveries |
Based on the Plenge test work from 2010 and the
start of the Phase 1 Metallurgical test work program, the following observations are provided.
| · | Based on the results to date, a fixed base copper recovery of 100% soluble copper (CuSOL = CuAS + CuCN)
is recommended for the resource evaluation and economic assessment at this time. Additionally, with soluble copper recovery above 100%,
a recovery of residual copper (after soluble copper) at 15% is recommended for the resource evaluation and economic assessment currently. |
| · | Soluble Copper recovery continues to progress with columns in progress-currently the column performance
has exceeded expectations. Plenge tested work-maintained columns at approximately 1 pH with a high dosage of raffinate at the start, explaining
the fast kinetic leach at the start of the test. |
| · | Column test work is in progress and results presented herein are indicative in nature only until columns
are taken down and assayed for a calculated head grade. Only then, can the recoveries and grades be fully reconciled. |
| · | Copper recovery is consistent with the materials tested so far, and copper extraction and acid consumption
recommendation should be used for resource evaluation. |
| · | Based on current bottle roll results and the current column consumption (Figure 10.7 and Figure 10.8),
an average gross acid consumption is 18 kg/t of material. |
| · | Figure 10.9 and Figure 10.10 present the pH of the operating columns. Currently the columns are overdosed
with acid and a decrease in dosage of acid is taking place as of the writing of this report to keep the columns operating between 1.8
and 2.2 pH. |
| · | Figure 10.3 and Figure 10.4 show present the current copper soluble recovery results of the Supergene
columns program versus the Plenge soluble copper recovery and the 100% soluble copper recovery design parameter for this report. Figure
10.4 most matches the material as all data is 100% passing 12.7 mm (1/2 inch). Logarithmic fitted curves have been added to present where
the data may fall after 180 days of leaching. |
| Project Los Azules – S-K 1300 Technical Report Summary | Project No.: 21139-01 | 10-120 |
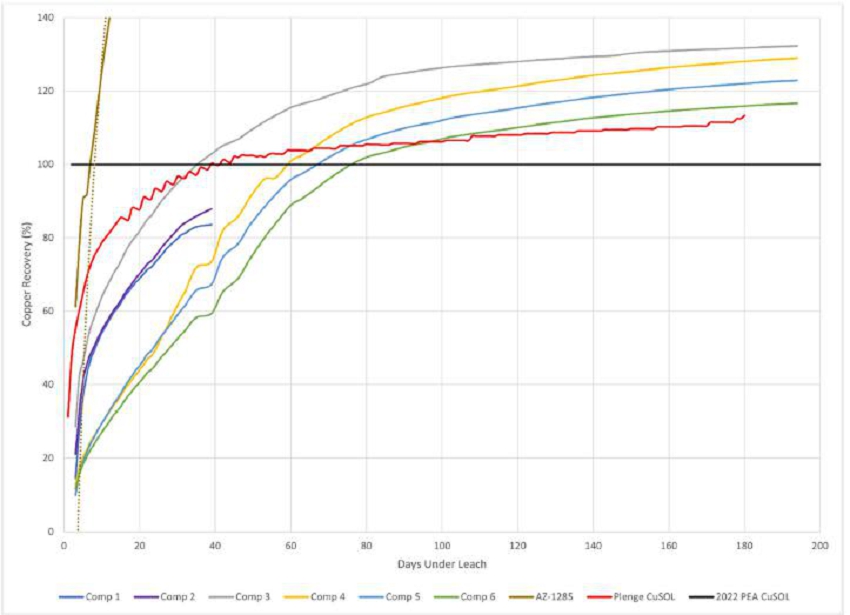
Figure 10.3: 19 mm Supergene Column Soluble
Copper Recovery
| Project Los Azules – S-K 1300 Technical Report Summary | Project No.: 21139-01 | 10-121 |
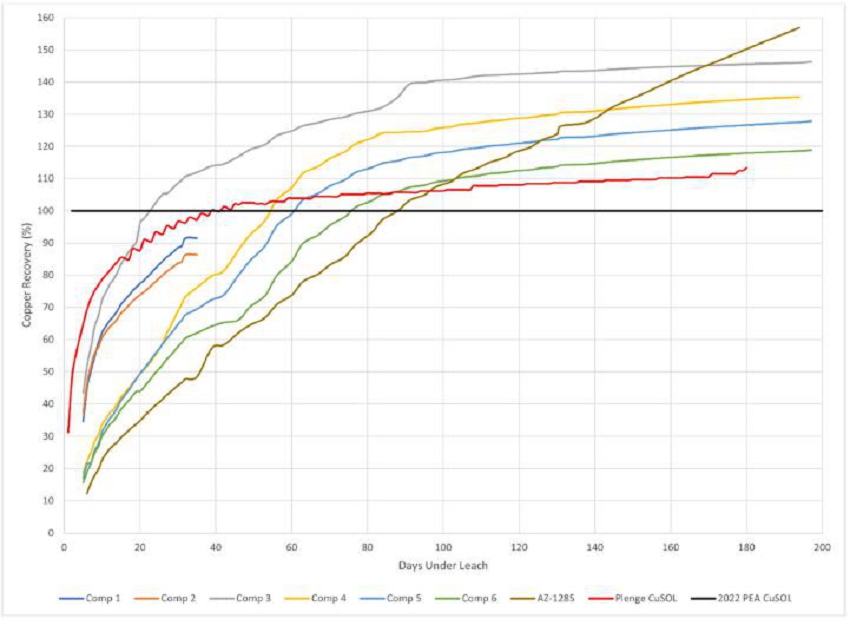
Figure 10.4: 12.7 mm Supergene Column Soluble
Copper Recovery
| Project Los Azules – S-K 1300 Technical Report Summary | Project No.: 21139-01 | 10-122 |
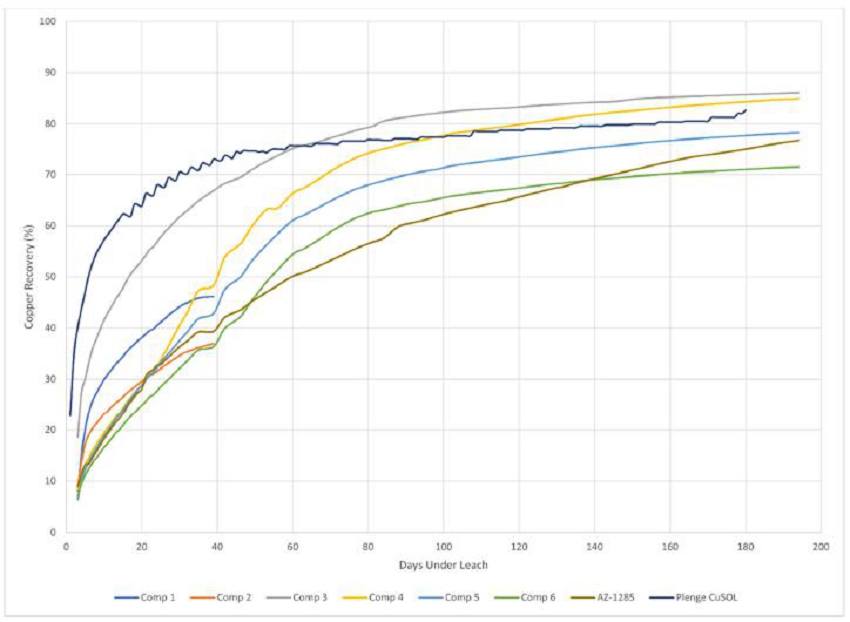
Figure 10.5: 19 mm Supergene Column Total
Copper Recovery
| Project Los Azules – S-K 1300 Technical Report Summary | Project No.: 21139-01 | 10-123 |
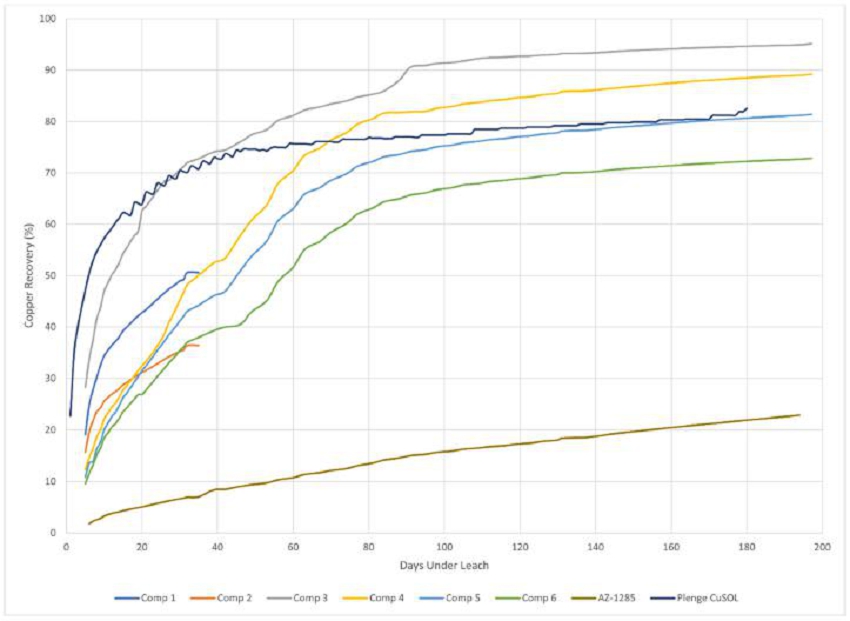
Figure 10.6: 12.7 mm Supergene Column Total
Copper Recovery
| Project Los Azules – S-K 1300 Technical Report Summary | Project No.: 21139-01 | 10-124 |
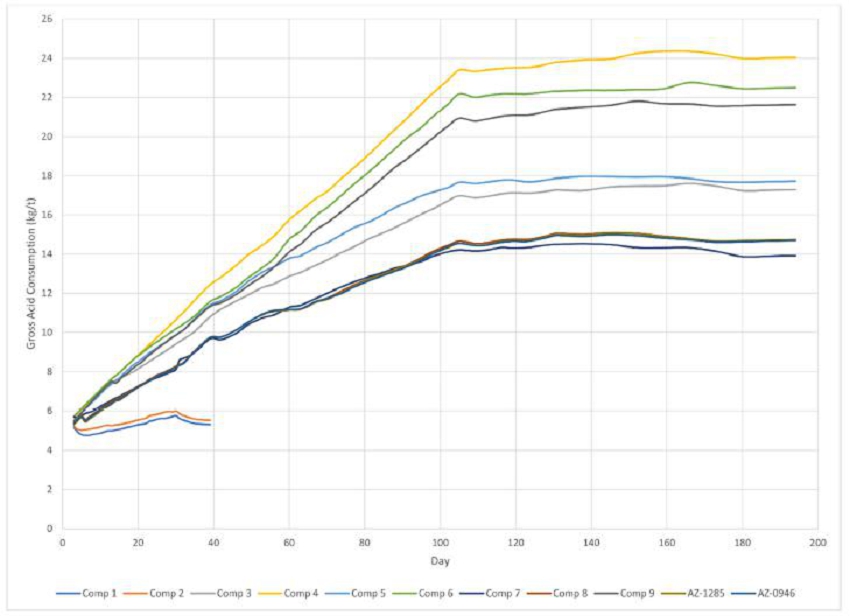
Figure 10.7: 19 mm Column Gross Acid Consumption
| Project Los Azules – S-K 1300 Technical Report Summary | Project No.: 21139-01 | 10-125 |
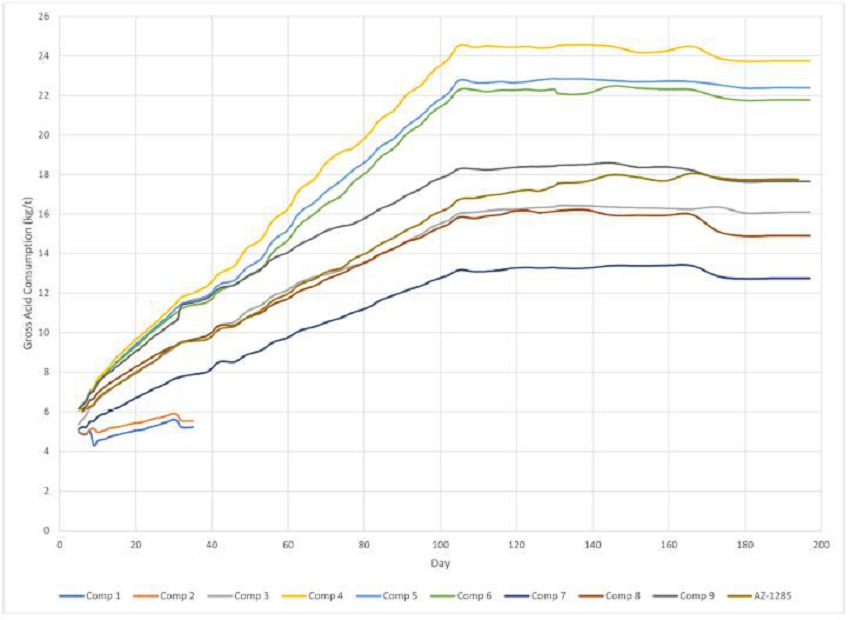
Figure 10.8: 12.7 mm Column Gross Acid Consumption
| Project Los Azules – S-K 1300 Technical Report Summary | Project No.: 21139-01 | 10-126 |
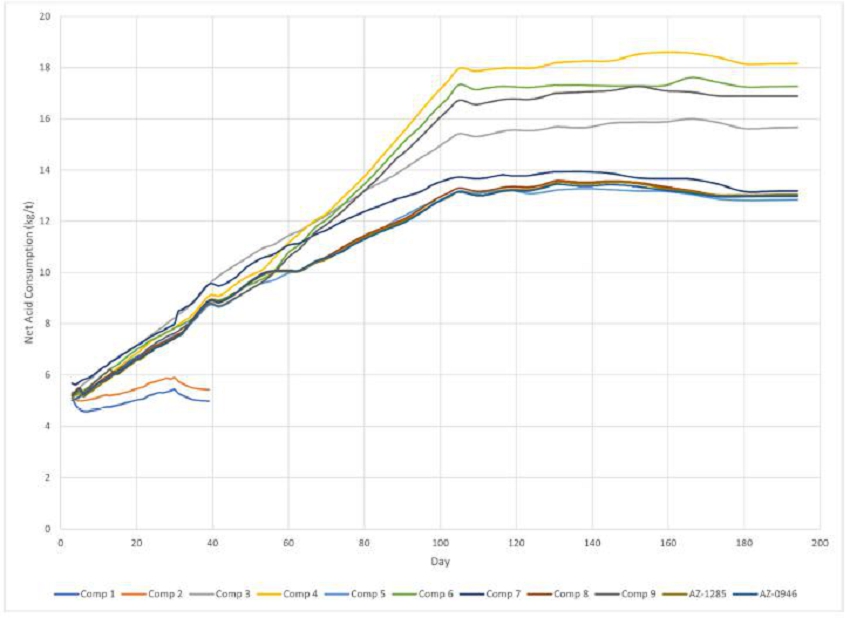
Figure 10.9: 19 mm pH
| Project Los Azules – S-K 1300 Technical Report Summary | Project No.: 21139-01 | 10-127 |

Figure 10.10: 12.7 mm pH
| Project Los Azules – S-K 1300 Technical Report Summary | Project No.: 21139-01 | 10-128 |
Mineralization (XRD, CLAY ANALYSIS, XRF, TIMA-X PMA)
The mineralogical characterization tests of 74
drill core head assays were completed in X-Ray Fluorescence (XRF), X-Ray Diffraction (XRD) with clay analysis. TESCAN Integrated Mineral
Analyzer (TIMA-X) uses both Energy Dispersive X-Ray (EDX) and backscattered electron (BSE) signals to identify minerals and compare them
to entries in the SGS mineral library, an upgrade in technology from the traditionally accepted QEMSCAN technology.
Of significance is the level of potassium in the
gangue minerals. With dissolution, this could drive iron precipitation as potassium jarosite, particularly at elevated temperatures. Additionally,
significant biotite and chlorite levels are also observed in some composites, which can lead to higher acid consumption, particularly
at higher leaching temperatures and lower pH in the leach solutions. Continued analysis and monitoring of these features are included
in the future workplan.
| Project Los Azules – S-K 1300 Technical Report Summary | Project No.: 21139-01 | 10-129 |
| 10.3 | Nuton™ TECHNOLOGY Testing |
Nuton LLC is a technology venture of Rio Tinto,
one of the world’s largest mining companies, and home to a unique integration of innovative nature-based technologies, expertise,
and capabilities. At the core of Nuton is a portfolio of proprietary copper bio-heap leach related technologies. Nuton aims to advance
the environmental, social, and governance performance of the industry whilst delivering copper growth. In August 2022, McEwen Copper and
Nuton™ entered into a collaboration agreement to test the viability of Nuton™ technologies on a range of Los Azules process
material types. Although Nuton has completed larger scale testing at several projects and has developed proprietary modeling techniques
to predict results, there are no commercial applications of the Nuton™ technology operating at the time of this report.
From the 2022 drilling season, over 4.5 tonnes
of PQ/HQ core material from Los Azules were shipped to Hazen Research in Golden, Colorado in September 2022. Nuton was in progress of
setting up a laboratory facility directly at Hazen, mirroring the technology and practices from the Bundoora facility in Melbourne. The
column material is currently in progress in both facilities. The 4.5 tonnes of sample represent multiple material types and lithologies
as prescribed in Table 10.10.
| Table 10.10: Material Shipped to Hazen to undergo Nuton Testing |
| Hole # |
From |
To |
Material Type |
Lithology |
| AZ17131 |
334 |
378 |
Primary |
Dacitic Porphyry |
| AZ17134 |
198 |
251.5 |
Supergene |
Rhyodacite Porphyry |
| AZ22138 |
139 |
203 |
Supergene |
Dacitic Porphyry |
| AZ22138 |
422 |
526 |
BN-CPY |
Diorite |
| AZ22140 |
116 |
245 |
Supergene |
Diorite |
| AZ22142 |
95 |
166 |
Supergene |
Rhyodacite Porphyry |
| AZ22142 |
371 |
432 |
Primary |
Porphyry Diorite |
| AZ22142 |
165 |
222 |
Supergene |
Porphyry Diorite |
| AZ22146 |
96 |
188 |
Supergene |
Hydrothermal Magmatic Breccia |
| AZ22149 |
152 |
236 |
Supergene |
Diorite |
| AZ22149 |
383 |
428 |
Primary |
Diorite |
| AZ22150 |
141 |
215 |
Primary |
Diorite |
Additionally, in November 2022, samples from Composite
6, Composite 7, Composite 8, and Composite 9 (90 kg of each and described in Table 10.11) were shipped from SGS Santiago and delivered
to Melbourne, Australia at the Nuton Bundoora facility. The purpose of these samples was for comparative analysis from SGS utilizing the
Nuton™ technology.
| Project Los Azules – S-K 1300 Technical Report Summary | Project No.: 21139-01 | 10-130 |
Nuton has developed proprietary models to simulate
the performance of Nuton technologies both in column leach tests and in commercial scale operations. These models have been developed
over the past 25 or more years and have been validated at various scales. The Nuton Computational Fluid Dynamics (CFD) model is used to
project copper recovery and reagent consumption and provide information necessary to evaluate capital and operating costs specific to
the Nuton process, which will help inform an evaluation of the Nuton contribution to the Los Azules Project and a notice to proceed to
a next stage of the project. Through the CFD modelling, the requirement to add proprietary additives was identified to operate the columns
under optimum Nuton conditions.
The columns at Hazen and Bundoora are currently
in progress, and results to date are considered preliminary. The test matrix for Bundoora can be found in Table 10.11 and for Hazen in
Table 10.12. Bundoora column tests are being conducted in 100 mm I.D. by 1 m tall columns containing approximately 10 kg of crushed and
agglomerated material. Hazen column tests are being conducted in 140 mm I.D. by 1 m tall columns containing approximately 20 kg of crushed
and agglomerated material. All material was agglomerated to 4-6% moisture and loaded into the columns, resting for three (3) days before
commencing irrigation with raffinate. The raffinate is being added at a rate of 10 L/hr/m2. Microbial cultures (biomass) required
for leaching are added directly to the columns. The biomass was produced from proprietary cultures. Nuton™ uses three (3) different
mixed cultures consisting of bacteria and archaea to enable operation over a wide temperature range: a mesophilic culture for a lower
temperature range, a moderately thermophilic culture for a moderate temperature range, and an extremely thermophilic culture for a high
temperature range. Additives are used to enhance the leaching process.
| Project Los Azules – S-K 1300 Technical Report Summary | Project No.: 21139-01 | 10-131 |
| Table 10.11: Bundoora Column Test Matrix |
| |
Composite 6 |
Composite 7 |
Composite 8 |
Composite 9 |
| Operating Temperature 2 |
moderate |
high |
high |
med-high |
high |
high |
moderate |
high |
med-high |
moderate |
| pH1 |
< 2 |
< 2 |
< 2 |
< 2 |
< 2 |
< 2 |
< 2 |
< 2 |
< 2 |
< 2 |
| Additive Type1 |
- |
- |
Additive 2 |
Additive 2 |
Additive 2 |
Additive 2 |
Additive 3 |
Additive 2 |
Additive 2 |
Additive 3 |
| Additive 1a1 |
- |
Yes |
Yes |
- |
- |
Yes |
- |
- |
- |
- |
| Additive 1b1 |
- |
- |
- |
- |
Yes |
- |
- |
Yes |
Yes |
- |
1 - Specific information is proprietary
and confidential
2 – Specific temperature settings
are proprietary
| Table
10.12: Hazen Column Test Matrix |
| BHID |
AZ22138
(422-526) |
AZ22149
(383-428) |
AZ22149
(152-236) |
AZ22140
(116-245) |
AZ22150
(141-215) |
AZ17134
(198-251.5) |
AZ22142
(95-166) |
AZ22142
(371-432) |
AZ22142
(165-222) |
AZ17131
(334-378) |
AZ22138
(139-203) |
AZ22146
(96-188) |
| Material
Type |
BN-CPY |
Primary |
Supergene |
Supergene |
Primary |
Supergene |
Supergene |
Primary |
Supergene |
Primary |
Supergene |
Supergene |
| Operating
Temperature 1 |
med-high |
med-high |
med-high |
high |
med-high |
high |
moderate |
med-high |
high |
med-high |
med-high |
high |
med-high |
high |
med-high |
med-high |
| pH1 |
<
2 |
<
2 |
<
2 |
<
2 |
<
2 |
<
2 |
<
2 |
<
2 |
<
2 |
<
2 |
<
2 |
<
2 |
<
2 |
<
2 |
<
2 |
<
2 |
| Additive
Type1 |
Additive
2 |
Additive
2 |
Additive
2 |
Additive
2 |
- |
- |
- |
- |
Additive
2 |
Additive
2 |
Additive
2 |
Additive
2 |
Additive
2 |
Additive
2 |
Additive
2 |
Additive
2 |
| Additive
1a1 |
Yes |
Yes |
- |
Yes |
Yes |
Yes |
- |
- |
Yes |
- |
- |
Yes |
- |
Yes |
- |
- |
| Additive
1b1 |
- |
- |
Yes |
- |
Yes |
Yes |
- |
- |
- |
- |
- |
- |
- |
- |
- |
- |
1 - Specific information is proprietary and confidential
Stage 1 column leaching of the composite samples
at Bundoora, as well as of the primary bulk samples at Hazen, is underway and expected to complete during Q1 2024.
| Project Los Azules – S-K 1300 Technical Report Summary | Project No.: 21139-01 | 10-132 |
| 10.4 | Adequacy of data and use |
The metallurgical work completed to date and ongoing
at the effective date of this report provides an adequate understanding of the expected performance characteristics for an Initial Assessment
level of analysis. For the 19mm column tests in the current program, the total copper extraction ranged from 86% to 72% in 180 days and
averaged 80% overall. For Los Azules, the anticipated copper extraction of the CuSOL fraction of the assayed copper in each block is 100%.
Additionally, approximately 15% of the residual copper component can also be extracted based on the metallurgical results to date.
Copper recovered to cathodes considers a heap
efficiency and inventory factor of 90% of the long-term extractable copper extended over a two-year leach cycle period based on general
experience. Soluble copper recovery exceeding 100% implies partial leaching of material which was not categorized as “soluble”
based on the sequential assaying method and data available.
The expected overall total copper recovery expected
is approximately 73% and is distributed over a two-year timeframe from placement on the leach pad. In the opinion of the QP, the metallurgical
test work and analysis support the metallurgical assumptions provided and used in the mineral resource estimation, the preliminary mine
plans, and the economic analysis presented in this report.
Based on current bottle roll results and the current
column consumption, an average gross acid consumption is 18 kg/t of material. Net acid consumption is a function of recoverable copper
with acid produced as a result of the electrowinning process and calculated in the process cost model annually.
Potential scenarios for the preferred future Phase
2 operations employing the NutonTM bio-leaching technology are presented and discussed in Section 22.2.1 of this report. Although
Nuton has completed larger scale testing at several global project sites and has developed proprietary modeling techniques to predict
leaching performance results, there are no commercial applications of the Nuton™ technology operating at the time of this report.
A significant testing program, including broader column testing of the project resources, and site-based scale-up work will be required
to validate these preliminary estimates. As such, these results are not considered suitable for inclusion at this time in the initial
project cases presented are and only included as a demonstration of the potential future opportunity.
In the opinion of the QP, the metallurgical test
work and reconciliation and production data support the metallurgical assumptions for the mineral resource estimations, mine plans, and
preliminary economic analysis included in this Initial Assessment report.
Inadequate sampling of the initial 5-year mining
target material is apparent and results from lack of permitted access for the drilling programs. Additional testing, as described in this
report, is required to support any Reserves classification for the Los Azules resources described.
| Project Los Azules – S-K 1300 Technical Report Summary | Project No.: 21139-01 | 10-133 |
| 11.0 | mineral resource estimates |
This
section is a summary of documents presented in 2021 and 2022 detailing the items discussed here1,2,3.
The late-2022/spring McEwen Copper’s drilling was not
available when these documents were completed. The information presented here is updated to include all data collected during the summer/fall
2021/2022 field season.
This report augments previous work with data from
52 drill holes (22,497, meters) completed by December 31, 2022. Additional data included 159 drill holes (24,704 samples) submitted to
re-assay for elements not provided in the original assay suite.
The
geological model was rebuilt from all available data and the complete data set reassessed to develop a new estimation strategy. The resource
estimation was performed by Jeff Sullivan, PhD and Silvia Satchwell of CRM-SA, LLC. The work is overseen by Allan Schappert of Stantec
Consulting International Ltd., who serves as the qualified person (QP) for the
resource estimate.
Resource Database and Geological Model Extent
The current database is adequate for the preparation
of a long-range model that will serve as a basis for modeling associated with completing the IA. The extent of mineralization along the
strike exceeds 4 km and the distance across strike is approximately 2.2 km. The deposit is open at depth. Over the approximately 2.5 km
strike length where mineralization is strongest, the average drill spacing is approximately 150 m to 200 m, but there are localized areas
where drilling is on a 100 m spacing. The assay database considers 162 drillholes and 56,528 m of assay interval data. Resource estimation
work was performed using Datamine Studio modeling software.
Summary of Controls on Mineralization
Mineralization shows strong continuity from south
to north and vertically. Laterally, grades decrease moving away from an NNW striking central structure. The main control on mineralization
is the modeled mineral zone which follows the typical porphyry copper pattern. Below the unmineralized overburden, a low-grade leach unit
is found, which overlies a well-developed zone of secondary enrichment which transitions into primary mineralization at depth. The model
also contains a small oxide/sulfide mixed zone. There is only minor copper oxide mineralization, so no economic oxide zone was modeled.
A secondary control on grade is provided by lithology.
In terms of copper grade, the strongest mineralization is found in a low-volume hydrothermal breccia. The remaining lithologies are intrusive
rocks that are modeled according to the age of mineralization. The pre-mineral pluton (diorite) is the background rock intruded by the
relatively narrow early mineral porphyry (EMP) and inter-mineral porphyry (IMP). The EMP has elevated grades relative to the diorite and
IMP. Combinations of lithology and mineral zone are used to control the estimation; however, the combinations applied differ for the models
of copper, gold, and silver.
1 CRM, February 2022, Re-estimation
of Copper Grades, Los Azules Project, Argentina
2 CRM, May 2022, Estimation of Gold
and Minor Elements, Los Azules Project, Argentina
3 CRM, August 2022, Soluble Copper
Estimation, Model Notes, Los Azules Project, Argentina
| Project Los Azules – S-K 1300 Technical Report Summary | Project No.: 21139-01 | 11-134 |
Additional observed controls on grade are:
| · | Within the enriched zone, proximity of a sample to the leached/enriched (upper) or enriched/primary (lower)
contact is observed as a control on cyanide soluble copper grade and solubility. |
| · | Highest grades are observed along a central NNW striking, steeply dipping structure/fault. Elevated grades
are due to both a higher proportion of the higher-grade lithologic units (breccia and EMP) near the structure and an increase in fracturing
of the host rock. These properties generate a decreasing lateral grade trend with increasing distance from the structure. As a result,
grades are more continuous parallel to the structure. |
| · | Copper grades are well behaved with low relative variability. Gold and silver grades are more variable.
Narrow breccia and late quartz vein occurrences carry elevated grades particularly for gold and silver. Grades associated with these narrow
occurrences are volumetrically restricted during estimation. Aside from this issue, copper grades are not capped. For gold and silver,
a local capping algorithm was applied to define and manage outliers. |
| · | Over large volumes there is some correlation between average grades of the metals due to the control exerted
by the central structure. Locally, however, correlation can be poor. The correlation between soluble and total copper is strong outside
of the enriched zone. Within the enriched zone, correlation varies by depth in the enrichment profile. |
| · | At the contacts between estimation units, a sharp change in grade is observed for copper and sharing samples
across estimation units is not allowed (i.e., hard boundaries were utilized). |
Spatial Correlation
Spatial correlation was modeled by mineral zone
using pairwise relative variograms. Modeled variograms show the expected NNW anisotropy.
Block Model Validation
Copper grades were estimated by ordinary Kriging
while gold and silver were estimated using inverse distance squared (ID2) weighting. Checks performed to validate the estimates
included:
| · | Comparison of drillhole data and model grades in plan and section. |
| · | Comping model and data (nearest neighbor estimates) averages over the estimation unit, over slices through
the model, and over large blocks. |
These checks showed that the model reproduced
the major features of the data while the match between the model and data averages was acceptable.
Resource Classification
Mineral resources have been classified according
to guidelines and logic summarized within the Canadian Institute of Mining, Metallurgy and Petroleum (CIM 2019) and as defined by the
Securities Exchange Commission’s S-K 1300 (SEC 2018). Definitions of mineral resources are slightly different in these two codes.
With slight variations resources were classified as Indicated or Inferred by considering geology, sampling, and grade estimation aspects
of the model. For geology, consideration was given to the confidence in the interpretation of the lithologic domain boundaries and geometry.
For sampling, consideration was given to the number and spacing of composites, the orientation of drilling and the reliability of sampling.
For the estimation results, consideration was given to the confidence with which grades were estimated, as measured by the quality of
the match between the grades of the data and the model.
| Project Los Azules – S-K 1300 Technical Report Summary | Project No.: 21139-01 | 11-135 |
Resource Summary
The indicated and inferred resource for the enriched
and primary zones are presented below in Table 11.1 and Table 11.2, respectively. Mineral resources are determined using an NSR cut-off
value to cover the processing cost for each recovery methodology. For supergene and primary material going to the leach pile the cutoff
was $2.74/t. For supergene going to the mill the cutoff was $5.46/t and primary material going to the mill was $5.43/t. The resource is
further constrained by a pit shell that demonstrates the reasonable prospects of eventual economic extraction (RPEEE) of this material.
| Table
11.1: Indicated Resources for the Los Azules Project |
| |
MTonnes |
Average
Grade |
Contained
Metal |
In-Situ
Copper
Total
(%) |
In-Situ
Copper
Soluble
(%) |
In-Situ
Gold
(g/tonne) |
In-Situ
Silver
(g/tonne) |
In-Situ
Copper
Total
Content
(Blbs) |
In-Situ
Copper
Soluble
(Blbs) |
In-Situ
Gold
(Moz) |
In-Situ
Silver
(Moz) |
| Leach |
944.2 |
0.46 |
0.30 |
- |
- |
9.54 |
6.25 |
- |
- |
| Mill
- Supergene |
73.0 |
0.13 |
- |
0.09 |
1.10 |
0.21 |
- |
0.20 |
2.58 |
| Mill
- Primary |
218.1 |
0.25 |
- |
0.036 |
1.06 |
1.19 |
- |
0.25 |
7.43 |
| Total
Leach |
944.2 |
0.46 |
0.30 |
- |
- |
9.54 |
6.25 |
- |
- |
| Total
Mill |
291.1 |
0.22 |
- |
0.049 |
1.07 |
1.40 |
- |
0.46 |
10.01 |
| Total
Indicated |
1,235.3 |
0.40 |
|
|
|
10.94 |
|
|
|
| Table
11.2: Inferred Resources for the Los Azules Project |
| |
MTonnes |
Average
Grade |
Contained
Metal |
In-Situ
Copper
Total
(%) |
In-Situ
Copper
Soluble
(%) |
In-Situ
Gold
(g/tonne) |
In-Situ
Silver
(g/tonne) |
In-Situ
Copper
Total
Content
(Blbs) |
In-Situ
Copper
Soluble
(Blbs) |
In-Situ
Gold
(Moz) |
In-Situ
Silver
(Moz) |
| Leach |
695.7 |
0.32 |
0.19 |
- |
- |
4.91 |
2.96 |
- |
- |
| Mill
- Supergene |
525.6 |
0.30 |
- |
0.05 |
1.44 |
3.45 |
- |
0.87 |
24.40 |
| Mill
- Primary |
3,288.0 |
0.25 |
- |
0.03 |
1.18 |
18.35 |
- |
3.37 |
124.67 |
| Total
Leach |
695.7 |
0.32 |
0.19 |
- |
- |
4.91 |
2.96 |
- |
- |
| Total
Mill |
3,813.6 |
0.26 |
- |
0.035 |
1.22 |
21.79 |
- |
4.24 |
149.07 |
| Total
Inferred |
4,509.3 |
0.31 |
|
|
|
26.70 |
|
|
|
Notes:
| · | There is a reasonable prospect of eventual economic extraction of the leach resource using sulfuric acid
leaching and SX/EW recovery at NSR cutoff of $2.74/t. |
| · | The supergene and primary material can be treated in a float mill with NSR cutoffs of $5.46 and $5.43/t
respectively. NSR values are based on a copper price of $4.00/lb., gold at $1,700/oz., and silver at $20/oz., where applicable. |
| · | The quantity and grade of reported Inferred mineral resources in this estimation are uncertain in nature
and there is insufficient exploration to define these Inferred mineral resources as an Indicated or Measured mineral resource; it is expected
that further exploration will result in upgrading a significant portion of this material to an Indicated level of classification. |
| · | Mineral resources, which are not mineral reserves, do not have demonstrated economic viability. The estimate
of mineral resources may be materially affected by environmental, permitting, legal, title, socio-political, marketing, or other relevant
factors. |
| Project Los Azules – S-K 1300 Technical Report Summary | Project No.: 21139-01 | 11-136 |
Figure 11.1 is a plan map of the project area
and shows the collar location of the drill holes used in this MRE. Some of the drilling done by the Battle Mountain Group in 2008 has
been excluded because of the lack of lithologic logging. This data represents a very small fraction of the total drilling done to date.

Figure 11.1: Drill Hole Location Map
Introduction
The following is a summary of the understanding
of the genesis, the interpretation criteria, and parameters used in the geological modelling of the Los Azules Deposit detailed in a report
by Atticus Geoscience (Mortimer, 2022). The model will assist in ongoing exploration and is used as a base for the 2023 MRE model described
herein. The 3D geological model was constructed using Leapfrog software.
Geological Evolution
The Los Azules Deposit contains overprinting mineralization
and alteration events, and it is necessary to understand the time and spatial relationships of these events to develop an integrated geological
model.
| Project Los Azules – S-K 1300 Technical Report Summary | Project No.: 21139-01 | 11-137 |
The development of all models, the cross-cutting
relationships, and construction sequences are based on the geological evolution and known events, the evidence for which comes from direct
observations of cross-cutting relationships seen in the field, and in the drill core.
Structural Model
The structural regime plays a fundamental role
in the mineralization, alteration, mineral zonation, and the development of the intrusive lithologies. The structural model is based largely
on geological mapping and field observations (Pratt, 2010), recent discussions with the current geology team, interpretations from drilling
data to define and confirm the structural controls and has been refined iteratively throughout the process. Further drilling and additional
work will continue to better define the structural model.
Lithology Model
Lithological contacts and solids have been constructed
from the integration of data from the lithology, alteration, and assay data input tables in the database. The geological map was also
used to define contacts for the volcanics and quaternary cover. Table 11.3 describes the units that are modelled and their order in the
event sequencing.
| Table 11.3: Chronological Geological Events used in Model Construction |
| Age |
Event |
Sub Event |
| Younger |
Erosion (Topography) |
|
| |
Quaternary Cover |
|
 |
|
|
| Inter Mineral Porphyry (IMP) + MagHydBx + HydBx |
HydBx |
| |
MagHydBx |
| |
IMP |
| Early Mineral Porphyry (EMP) |
|
| Diorite Pre-Mineral Pluton (PMP) |
|
| Older |
Triassic Volcanics |
|
All surfaces within the model, except one, were
constructed using implicit modelling methods, interpolating between known contact points (drill hole intervals) with subsequent editing
guided by sectional and level plan interpretations. The volcanic diorite contact surface is built using geological mapping interpretation
lines, as no drilling has currently intercepted the volcanics. Figure 11.2 and Figure 11.3 show examples of the lithological model in
plan and section views.
| Project Los Azules – S-K 1300 Technical Report Summary | Project No.: 21139-01 | 11-138 |
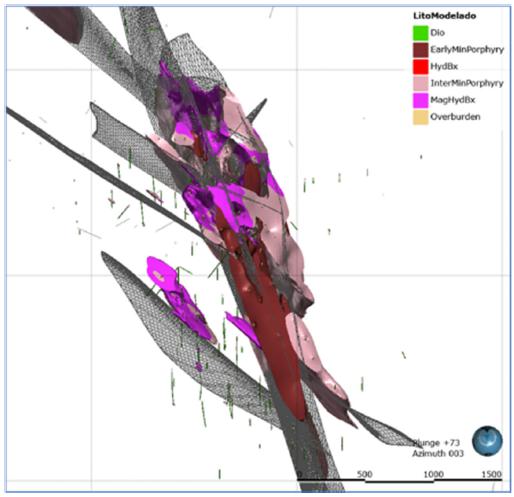
Figure 11.2: Plan view of the lithology model
under construction
| Project Los Azules – S-K 1300 Technical Report Summary | Project No.: 21139-01 | 11-139 |
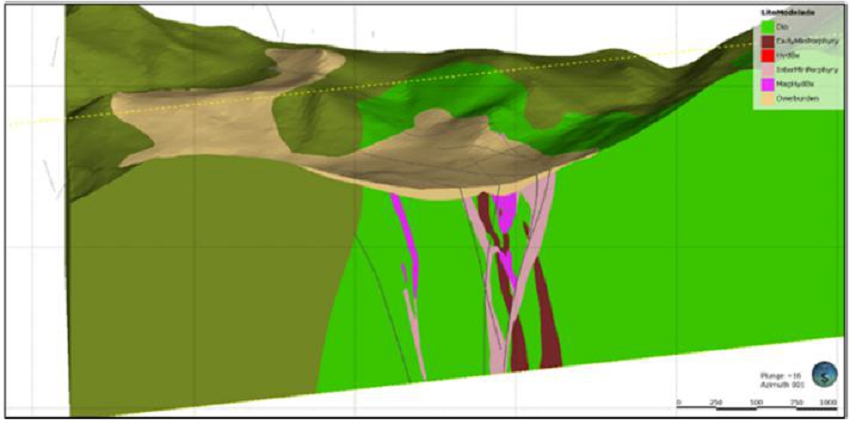
Figure 11.3: Oblique section view of the completed
lithological model looking North.
Alteration Model
Contact surfaces and solids of the alteration
model are based directly on drill data, constructed using integrated data from interval fields in the alteration, lithology, and assay
data tables.
The alteration model was constructed considering
the evolution of the deposit. Only the reactive lithologies present at the time of porphyritic intrusions can be affected by the alteration,
so the model only considers lithologies below the quaternary cover surface.
The construction sequence considers only one principal
event and is thus more aligned to the spatial distribution of alteration types rather than the temporal distribution. Overprinting of
alteration types has not been considered in the model. Table 11.4 shows the sequence of alteration events that were used in the model
creation.
| Table 11.4: Sequence of Alteration Effecting the Los Azules Deposit. |
| Sequence |
Event |
Sub Event |
 |
Erosion (Topography) |
|
| Quaternary cover |
|
| Silicification |
|
| Argillic |
|
| Potassic |
|
| Sericite |
Chlorite-Sericite |
| |
Sericite |
| Chlorite (Propylitic) |
|
Alteration surfaces are built using implicit modelling,
interpolating between known contact points (drill hole intercepts) with interpolation parameters fitting with the geological interpretation.
| Project Los Azules – S-K 1300 Technical Report Summary | Project No.: 21139-01 | 11-140 |
Copper Mineral Zonation Model
The copper mineral zonation model surfaces and
solids were constructed using interval selections from the assay, mineralogy, and lithology drill data tables. Interval selections are
based primarily on the sequential copper assay data and mathematically defining the min zone category into oxide (‘OX’), mixed
(‘MIX’), supergene enriched (‘SG’), transition (‘TR’), and hypogene (‘HYP’). Table 11.5
shows the criteria used to define each of these zones.
| Table 11.5: Mineral Zonation Criteria. |
| Sequential Copper Assays (%) |
Category |
| Acid Soluble Copper >= 30% |
OX: Oxide |
| Cyanide Soluble Copper >= 50% |
SG: Supergene (Enriched) |
| Residual Copper Content >= 80% |
HYP: Hypogene (Primary) |
| Cyanide SolCu <= 50% AND Acid SolCu >= 15% |
MIX: Mixed |
| Cyanide SolCu <= 50% AND Residual Cu <= 80% |
TR: Transition |
The leached zone (‘LIX’) was assigned
based on a combination of the absence of copper and presence of iron oxides. Additional categories of primary bornite (‘BN’)
and primary bornite-chalcopyrite (‘BN-CPY’) were assigned based on sequential copper assays below the base of the supergene
surface and confirmed through logging and visual presence of bornite.
The mixed (‘MIX’) category has undergone
partial oxidation and/or partial leaching of the supergene zone and exhibits repeated fluctuation between oxide and supergene. The transition
zone (‘TR’) is a region of primary copper mineralization that has undergone partial supergene enrichment through repeated
fluctuation between hypogene and supergene. Table 11.6 shows the sequence of geological events that have altered and effected the Los
Azules Deposit.
| Table 11.6: Geologic Events Altering and Effecting the Los Azules Deposit |
| Sequential |
Event |
|
|
Erosion (Topography) |
| Quaternary cover |
| LIX (Leached) |
| MIX / OX (Mixed / Oxide) |
| SG (Supergene) |
| TR (Transition) |
| BN (Primary Bornite) |
| BN-CPY (Primary Bornite-Chalcopyrite) |
| HYP (Hypogene) |
There is not enough material to define an oxide
solid. The minor, narrow intervals and amounts of oxide lithology that are present have been grouped into the mixed (‘MIX’)
category.
Estimation domains for the copper resource are
the copper mineral zonation models, except that the transition surface is eliminated and the definition of the base of the supergene has
been defined using geological logging.
| Project Los Azules – S-K 1300 Technical Report Summary | Project No.: 21139-01 | 11-141 |
The Copper zonation models are built using implicit
modelling, interpolating between known contact points (drill hole intercepts) fitting with the geological interpretation, and with subsequent
editing guided by sectional interpretations.
Conclusions and Recommendations
The construction methodology of the geological
models is extremely robust. It breaks the deposit down into its component events, and by understanding each of the controls related to
that event, yields a greater understanding of the deposit and a more robust series of inter-related models. The modelling is carried out
in sequence: structure – lithology – alteration – mineralization – zonation with iterative revision and reconstruction.
Continued exploration and drilling, especially
via angled holes, will serve to better define and improve confidence in the model going forward.
Overall, modelling shows that Los Azules is a
large structurally controlled porphyry deposit, open towards the west, northwest, and at depth. The extensive supergene zone has developed
down structures that transition into primary sulfide mineralization. Modelling shows multiple bornite centers within the primary zone
highlighting exploration potential at depth and along the currently modelled structures.
Composites are created from irregular length sample
intervals to produce equal length grade data that can be directly compared. To avoid excessively averaging or smoothing the grade data,
the composite length is linked to the sampling interval. Over 90% of the assayed sample intervals have a sample length of 2 m. To preserve
the details of the original logging and minimize the amount of grade smoothing, the 2 m length was selected for compositing.
Composites of equal length begin at the drillhole
collar. Within each 2 m interval, the majority-logged lithology and mineral zone over the interval are assigned to the composite. Random
checks of the composited grades were performed, and no errors were detected.
| 11.5 | Exploratory Data Analysis |
Exploratory data analysis (EDA) is performed to
determine the important controls on grades. Use of these controls during estimation will improve model quality and better define the spatial
extent of high- and low-grade volumes. Statistical analysis is a key component of the EDA; however, statistical results are only valid
over volumes where the statistical distribution of grades are not dependent on location. For this reason, before statistical evaluation,
an assessment of the behavior of grades in space is required.
Once the key controls on grade are determined,
the deposit is sub-divided into volumes (domains) in which the statistical behavior of grades is consistent. Resource model blocks located
within a domain are identified/coded and then estimated using a constant, domain-specific set of estimation parameters.
| Project Los Azules – S-K 1300 Technical Report Summary | Project No.: 21139-01 | 11-142 |
Behavior of Grades in Space
When viewed in plan, copper grades generally align
parallel to the major NNW oriented structure associated with the wetlands/vegas. This association between grades and the structure is
shown in Figure 11.4, which is a plan view of the drilling and represents the structure as a straight line.
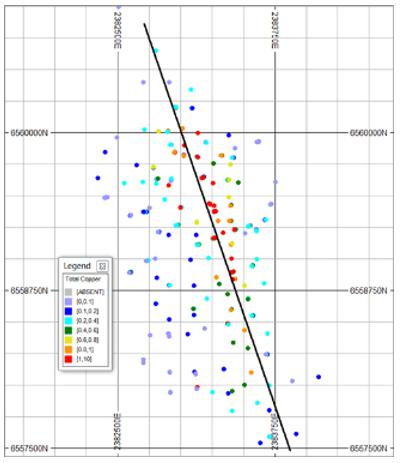
Figure 11.4: Plan Map of Drilling Showing
Location of Central Structure
The spatial relationship between the grade and
the line can be examined by calculating the horizontal distance from each composite to the line. Average copper can then be examined as
a function of distance (Figure 11.5).
| Project Los Azules – S-K 1300 Technical Report Summary | Project No.: 21139-01 | 11-143 |
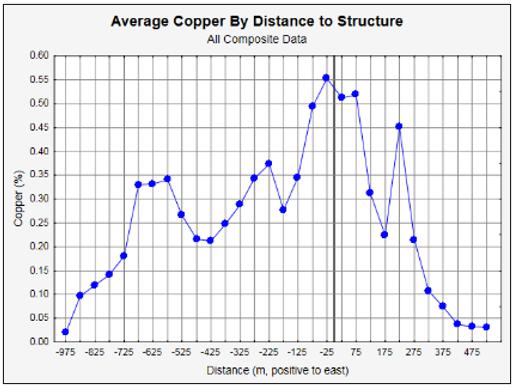
Figure 11.5: Relationship Between Composite
Copper Grades and Structure
| Project Los Azules – S-K 1300 Technical Report Summary | Project No.: 21139-01 | 11-144 |
The relationship between copper grade and the
distance to central structure must be considered when evaluating average grade.
The key geologic variables that are qualitatively
related to copper grades are lithology and mineral zone. Plots considering lithology and mineral zone are presented in Figure 11.6 and
Figure 11.7.

Figure 11.6: Average Copper by Distance and
Mineral Zone
Within the leach zone, average total copper grades
are consistent across the deposit and are not influenced by the central structure. Within the enriched and hypogene/primary zones, average
copper grades are influenced by distance. Due to this dependence on location, global statistics (over all data) are not locally representative.
| Project Los Azules – S-K 1300 Technical Report Summary | Project No.: 21139-01 | 11-145 |
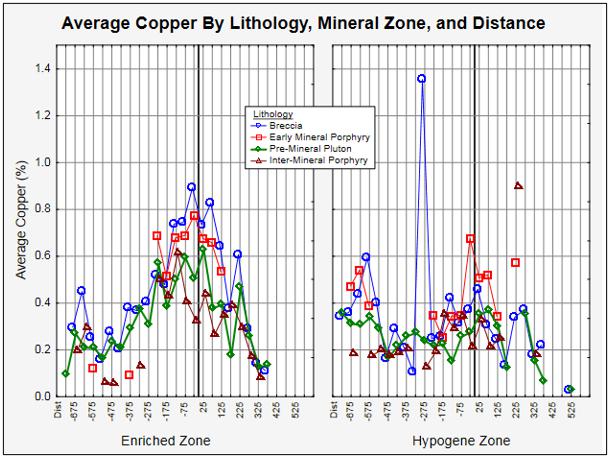
Figure 11.7: Average Copper by Mineral Zone,
Lithology and Distance
For the enriched zone, the highest grades are
found in the breccia and early mineral porphyry lithologies and enhanced near the structure. Grades in the inter-mineral porphyry tend
to be the lowest. Greater variability is seen in the breccia unit due, in part, to the small number of samples in this unit.
For the Hypogene zone, copper grades in all lithologies
are elevated near the main structure indicating the continuity of the structure and mineralization at depth. A second high grade zone
is found in the western portion of the deposit (distance -600m) associated with a second hypothesized structure at depth and represents
a potential future drilling target.
Basic Statistics, Domains, and Coding
Typically, average grades and other statistics
are computed by a geologic variable to define estimation domains. This type of analysis, neglecting location, will cause an overstatement
of variance and could result in incorrect outlier management decisions. To remove some of the dependence of grades on location, data are
divided into three distance groups: <-200m (West), >200m (East), and within 200m of the main structure (Central).
Table 11.7 below considers total copper grade
statistics by location and mineral zone as defined by the geologic model.
| Project Los Azules – S-K 1300 Technical Report Summary | Project No.: 21139-01 | 11-146 |
| Table 11.7: Total Copper Statistics by Location and Mineral Zone. |
| Sector |
Mineral
Zone |
|
|
Standard
|
Coefficient |
Minimum |
|
Maximum |
| Number of |
Average |
Deviation |
of |
Percentile |
| Composites |
(%) |
(%) |
Variation |
25th |
50th |
75th |
95th |
98th |
| West |
Overburden |
225 |
0.017 |
0.015 |
0.875 |
0.003 |
0.009 |
0.011 |
0.017 |
0.051 |
0.065 |
0.086 |
| Leached |
1,545 |
0.039 |
0.033 |
0.841 |
0.001 |
0.017 |
0.030 |
0.052 |
0.102 |
0.140 |
0.282 |
| Enriched |
3,205 |
0.424 |
0.511 |
1.204 |
0.005 |
0.167 |
0.297 |
0.501 |
1.200 |
1.776 |
12.89 |
| Mixed |
490 |
0.192 |
0.164 |
0.855 |
0.010 |
0.094 |
0.157 |
0.246 |
0.449 |
0.576 |
1.773 |
| Bn-Cpy |
792 |
0.381 |
0.217 |
0.569 |
0.044 |
0.250 |
0.329 |
0.454 |
0.775 |
1.040 |
2.035 |
| Bornite |
244 |
0.460 |
0.357 |
0.776 |
0.103 |
0.304 |
0.403 |
0.507 |
0.750 |
2.050 |
3.370 |
| Hypogene |
7,138 |
0.253 |
0.273 |
1.075 |
0.000 |
0.097 |
0.178 |
0.316 |
0.727 |
1.057 |
3.928 |
Central
(Near
Structure) |
Overburden |
90 |
0.020 |
0.014 |
0.709 |
0.006 |
0.010 |
0.016 |
0.023 |
0.052 |
0.066 |
0.094 |
| Leached |
2,479 |
0.029 |
0.032 |
1.105 |
0.001 |
0.012 |
0.020 |
0.033 |
0.078 |
0.140 |
0.298 |
| Enriched |
6,439 |
0.639 |
0.449 |
0.702 |
0.008 |
0.328 |
0.533 |
0.825 |
1.507 |
1.910 |
4.538 |
| Mixed |
372 |
0.326 |
0.442 |
1.356 |
0.008 |
0.062 |
0.125 |
0.381 |
1.301 |
1.692 |
2.311 |
| Bn-Cpy |
1,123 |
0.445 |
0.389 |
0.874 |
0.011 |
0.209 |
0.345 |
0.541 |
1.099 |
1.500 |
4.422 |
| Bornite |
346 |
0.371 |
0.328 |
0.883 |
0.076 |
0.213 |
0.293 |
0.396 |
1.090 |
1.447 |
3.171 |
| Hypogene |
4,511 |
0.318 |
0.267 |
0.840 |
0.006 |
0.146 |
0.258 |
0.405 |
0.780 |
1.085 |
3.825 |
| East |
Overburden |
106 |
0.044 |
0.027 |
0.623 |
0.010 |
0.024 |
0.036 |
0.054 |
0.091 |
0.127 |
0.158 |
| Leached |
1,117 |
0.032 |
0.031 |
0.944 |
0.001 |
0.014 |
0.024 |
0.040 |
0.088 |
0.131 |
0.253 |
| Enriched |
640 |
0.407 |
0.279 |
0.686 |
0.019 |
0.189 |
0.365 |
0.545 |
0.899 |
1.187 |
1.824 |
| Mixed |
21 |
0.157 |
0.230 |
1.459 |
0.018 |
0.037 |
0.085 |
0.133 |
0.530 |
0.957 |
0.957 |
| Bn-Cpy |
0 |
|
|
|
|
|
|
|
|
|
|
| Bornite |
0 |
|
|
|
|
|
|
|
|
|
|
| Hypogene |
607 |
0.183 |
0.182 |
0.997 |
0.005 |
0.037 |
0.137 |
0.242 |
0.576 |
0.745 |
1.000 |
| All
Data |
31,490 |
0.334 |
0.384 |
1.149 |
0.000 |
0.080 |
0.228 |
0.444 |
1.049 |
1.442 |
12.89 |
After partially controlling for location, average
grades show important differences among the various mineral zones. Some of the minor mineral zones (mixed, Bn-Cpy, and bornite) are less
common in the east.
| Project Los Azules – S-K 1300 Technical Report Summary | Project No.: 21139-01 | 11-147 |
Basic statistics by lithology are presented by
sector in Table 11.8
| Table 11.8: Total Copper Statistics by Lithology and Sector |
| Sector |
Mineral
Zone |
|
|
Standard
|
Coefficient |
Minimum |
|
Maximum |
| Number
of |
Average |
Deviation |
of |
Percentile |
| Composites |
(%) |
(%) |
Variation |
25th |
50th |
75th |
95th |
98th |
| West |
Hydro
Brx |
2,111 |
0.320 |
0.337 |
1.054 |
0.002 |
0.120 |
0.230 |
0.396 |
0.952 |
1.258 |
3.392 |
| Early
Min. Porphyry |
307 |
0.202 |
0.339 |
1.683 |
0.000 |
0.006 |
0.017 |
0.292 |
0.936 |
1.174 |
1.786 |
| PreMineral
Pluton |
8,907 |
0.237 |
0.230 |
0.972 |
0.001 |
0.082 |
0.180 |
0.323 |
0.618 |
0.855 |
4.04 |
| Inter-Min.
Porphyry |
470 |
0.136 |
0.113 |
0.831 |
0.002 |
0.055 |
0.115 |
0.174 |
0.361 |
0.446 |
0.771 |
| Overburden |
215 |
0.016 |
0.013 |
0.832 |
0.003 |
0.008 |
0.011 |
0.017 |
0.047 |
0.061 |
0.070 |
| Mag.
Hyd. Breccia |
777 |
0.744 |
0.870 |
1.169 |
0.003 |
0.275 |
0.517 |
0.942 |
2.164 |
2.737 |
12.886 |
| Late
Qtz Veins |
698 |
0.318 |
0.352 |
1.106 |
0.003 |
0.111 |
0.201 |
0.420 |
0.883 |
1.320 |
3.928 |
Central
(Near
Structure) |
Hydro
Brx |
2,957 |
0.476 |
0.416 |
0.874 |
0.002 |
0.168 |
0.376 |
0.680 |
1.329 |
1.627 |
3.058 |
| Early
Min. Porphyry |
2,194 |
0.436 |
0.413 |
0.947 |
0.002 |
0.046 |
0.366 |
0.650 |
1.182 |
1.448 |
4.422 |
| PreMineral
Pluton |
5,070 |
0.280 |
0.287 |
1.025 |
0.001 |
0.085 |
0.205 |
0.381 |
0.792 |
1.108 |
4.021 |
| Inter-Min.
Porphyry |
2,027 |
0.289 |
0.232 |
0.801 |
0.001 |
0.129 |
0.264 |
0.404 |
0.681 |
0.936 |
2.521 |
| Overburden |
94 |
0.020 |
0.014 |
0.709 |
0.006 |
0.010 |
0.016 |
0.023 |
0.048 |
0.066 |
0.094 |
| Mag.
Hyd. Breccia |
2,352 |
0.756 |
0.569 |
0.753 |
0.005 |
0.372 |
0.623 |
1.022 |
1.870 |
2.278 |
4.538 |
| Late
Qtz Veins |
616 |
0.361 |
0.280 |
0.775 |
0.007 |
0.167 |
0.297 |
0.472 |
0.916 |
1.110 |
1.692 |
| East |
Hydro
Brx |
773 |
0.253 |
0.284 |
1.125 |
0.006 |
0.038 |
0.142 |
0.377 |
0.810 |
1.067 |
1.824 |
| Early
Min. Porphyry |
7 |
0.573 |
0.094 |
0.165 |
0.476 |
0.510 |
0.543 |
0.600 |
0.766 |
0.766 |
0.766 |
| PreMineral
Pluton |
949 |
0.092 |
0.134 |
1.462 |
0.002 |
0.021 |
0.038 |
0.101 |
0.366 |
0.530 |
0.899 |
| Inter-Min.
Porphyry |
213 |
0.183 |
0.237 |
1.297 |
0.003 |
0.019 |
0.046 |
0.275 |
0.683 |
0.861 |
1.000 |
| Overburden |
104 |
0.043 |
0.027 |
0.628 |
0.010 |
0.024 |
0.036 |
0.054 |
0.091 |
0.127 |
0.158 |
| Mag.
Hyd. Breccia |
161 |
0.385 |
0.266 |
0.690 |
0.002 |
0.192 |
0.372 |
0.547 |
0.830 |
1.000 |
1.261 |
| Late
Qtz Veins |
41 |
0.110 |
0.095 |
0.863 |
0.012 |
0.022 |
0.072 |
0.188 |
0.280 |
0.317 |
0.317 |
| All Data |
31,043 |
0.338 |
0.386 |
1.142 |
0.000 |
0.084 |
0.231 |
0.448 |
1.055 |
1.449 |
12.89 |
In terms of data quantity, the western sector
is dominated by the pre-mineral pluton. The early mineral porphyry is more common near the structure while the inter-mineral porphyry
is more common to the east of the structure. The average grade of the high-grade breccia units is clearly lower in the eastern sector.
Elevated grades are observed in the two breccia
units. Based on general similarity in grades and occurrence, the hydrothermal and magmatic hydrothermal breccia were combined for purposes
of estimation.
The late quartz veins can have elevated grades,
particularly for precious metals; however, this unit was not defined in the geologic model due to a lack of observable continuity. Composites
with this logged code were restricted during estimation.
Based on this information, estimation domains
(with minor exceptions) were created by combining mineral zone and lithology. The selected domains and numerical codes for copper estimation
are:
| · | 2102 – Leach/Early Mineral Porphyry |
| · | 2103 – Leach/Pre-Mineral Pluton |
| · | 2104 – Leach/Inter-mineral Porphyry |
| · | 3102 – Enriched/Early Mineral Porphyry |
| · | 3103 – Enriched/Pre-Mineral Pluton |
| · | 3104 – Enriched/Inter-mineral Porphyry |
| · | 4102 – Mixed/Early Mineral Porphyry |
| Project Los Azules – S-K 1300 Technical Report Summary | Project No.: 21139-01 | 11-148 |
| · | 4103 – Mixed/Pre-Mineral Pluton |
| · | 4104 – Mixed/Inter-mineral Porphyry |
| · | 5102 – Bn – Cpy/Early Mineral Porphyry |
| · | 5103 – Bn – Cpy/Pre-Mineral Pluton |
| · | 5104 – Bn – Cpy/Inter-mineral Porphyry |
| · | 6102 – Bornite/Early Mineral Porphyry |
| · | 6103 – Bornite/Pre-Mineral Pluton |
| · | 6104 – Bornite/Inter-mineral Porphyry |
| · | 7102 – Hypogene/Early Mineral Porphyry |
| · | 7103 – Hypogene/Pre-Mineral Pluton |
| · | 7104 – Hypogene/Inter-mineral Porphyry |
Behavior Near Contacts
Grades within specified estimation domains can
vary as a function of distance to a contact when a halo of mineralization or other type of transition occurs between domains. When grades
transition across domain boundaries, it may be appropriate to share samples across the boundary during estimation to preserve the transition
in the model (a soft boundary). If sharp changes in grade are observed across a contact, the sharing of samples is inappropriate (a hard
boundary).
To observe whether grades near contacts are transitional,
two types of analysis were performed. First, large blocks that straddle the contact were defined and average grades on the two sides of
the contact were compared. This analysis evaluates grades near the contact over the range of observed values and provides an indication
of the grades that would be combined if there were free sharing of grades during estimation. The second check is more localized; the distance
between each composite and the nearest model block (from a different domain) is determined. Average grades are then computed and plotted.
Although more localized, this approach combines data over the entire deposit.
As an example of the analysis performed, the behavior
of different lithologies in the enriched zone is considered. Figure 11.8 shows a matrix of scatter plots that show the results of analysis
of composites on the two sides of contacts between the various domains within the model.
| Project Los Azules – S-K 1300 Technical Report Summary | Project No.: 21139-01 | 11-149 |
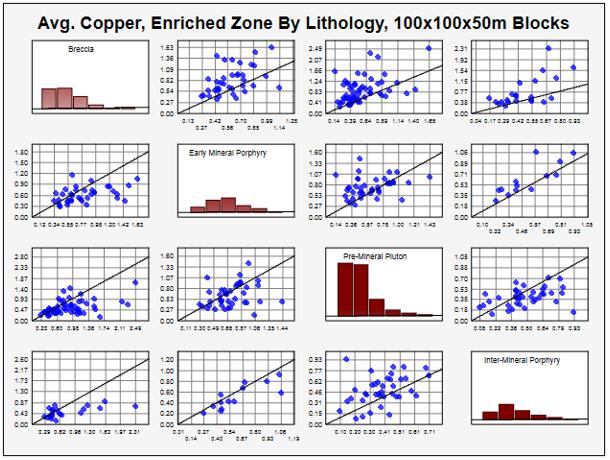
Figure 11.8: Cross Contact Composite Comparison
In this plot, each point represents average grades
on two sides of a contact. Labeled histograms on the diagonal define the lithology considered on the X and Y axes. Thus, the scatterplot
in the upper right corner of the plot considers blocks containing breccia and inter-mineral porphyry data. In this case, the grades in
the breccia are greater and independent of the grades in the porphyry. Sharing samples across this boundary is not appropriate.
For the other combinations of units, average grades
on the two sides of the contact are different. The most similar are grades on the two sides of the breccia/early mineral porphyry contact.
The grades across the pre-mineral pluton and inter-mineral porphyry are also similar. For these two contacts, the detailed contact plots
are shown Figure 11.9.
| Project Los Azules – S-K 1300 Technical Report Summary | Project No.: 21139-01 | 11-150 |
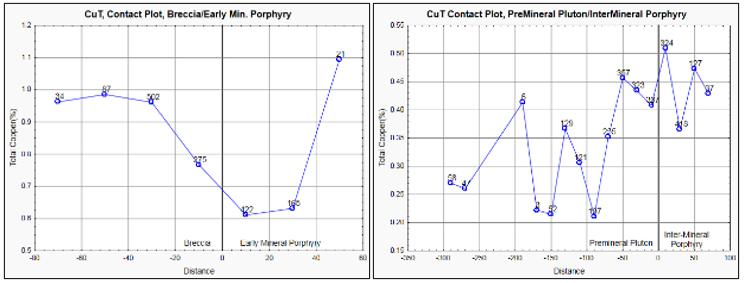
Figure 11.9: Detailed Cross Contact Composite
Grade / Distance Analysis
For the Breccia/EMP contact, grades drop from
about 0.8% to 0.6% at the contact. At the Pre-Mineral Pluton/Intermineral Porphyry contact, grades increase from about 0.4% to 0.5%. Based
on these changes in grades near the contact and the behavior of average grades in the previously presented contact scatterplots (Figure
11.8), these contacts and all other lithology contacts are treated as hard boundaries during estimation with no sharing of samples between
lithology units.
Cyanide Soluble Copper EDA
Sequential copper determinations for acid soluble
copper (CuAS) and cyanide soluble copper (CuCN) are provided by a standard sequential copper assay methodology by the Alex Stewart Laboratory
(see Section 8.3).
Cyanide soluble (CuCN) grades are directly linked
to the expected metal production for the leach project. For this reason, a detailed evaluation of both CuCN grade and the ratio of CuCN
to total copper (solubility) was performed.
A very important control on solubility is mineral
zone since solubility is linked to copper mineralogy. Figure 11.10 presents box plots of CuCN by mineral zone.
| Project Los Azules – S-K 1300 Technical Report Summary | Project No.: 21139-01 | 11-151 |

Figure 11.10: Box Plots of CuCN by Mineral
Zone
The two plots are identical only the vertical
scale is different. As seen, only the enriched and bornite zones show an important quantity of elevated CuCN grades. For the other mineral
zones, at least 75% of the data have grades less than 0.15%.
The central structure also provides an important
control on CuCN grade. Figure 11.11 presents average grades as a function of distance to the line representing the structure. The data
is further broken down by mineral zone as defined in the legend.
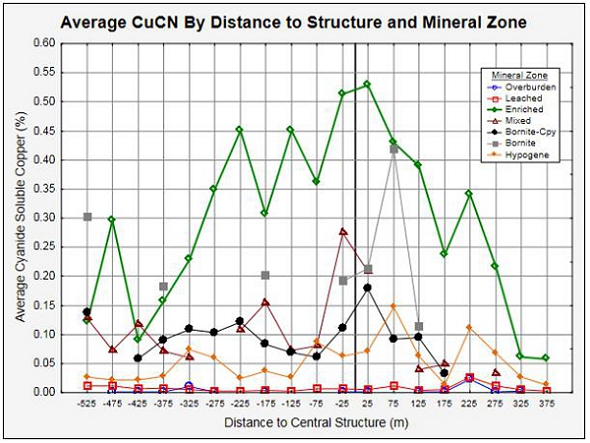
Figure 11.11: Average CuCN grades by Distance
from Central Structure.
| Project Los Azules – S-K 1300 Technical Report Summary | Project No.: 21139-01 | 11-152 |
The lateral behavior of CuCN grades is similar
to total copper in the enriched zone. The best primary zone grades are found in the bornite zone, but unfortunately this zone is not common.
Grades in the leached and hypogene zone are low; however, hypogene grades do increase slightly near and to the east of the structure.
Table 11.9 presents CuCN statistics by mineral zone.
| Table 11.9: Basic Statistics – CuCN by Mineral Zone. |
| Mineral
Zone |
|
|
Standard
|
Coefficient |
Minimum |
|
Maximum |
| Number
of |
Average |
Deviation |
of |
Percentile |
| Composites |
(%) |
(%) |
Variation |
25th |
50th |
75th |
95th |
98th |
| Overburden |
419 |
0.002 |
0.006 |
3.220 |
0.00014 |
0.001 |
0.001 |
0.002 |
0.004 |
0.010 |
0.091 |
| Leached |
4,827 |
0.005 |
0.016 |
2.925 |
0.00003 |
0.001 |
0.002 |
0.003 |
0.024 |
0.056 |
0.251 |
| Enriched |
10,190 |
0.362 |
0.365 |
1.008 |
0.00003 |
0.126 |
0.251 |
0.470 |
1.070 |
1.422 |
7.150 |
| Mixed |
864 |
0.112 |
0.209 |
1.868 |
0.00005 |
0.007 |
0.039 |
0.109 |
0.503 |
0.851 |
1.609 |
| Bn-Cpy |
1,913 |
0.117 |
0.135 |
1.162 |
0.004 |
0.048 |
0.080 |
0.136 |
0.326 |
0.515 |
1.725 |
| Bornite |
590 |
0.249 |
0.241 |
0.966 |
0.018 |
0.126 |
0.195 |
0.289 |
0.569 |
0.904 |
2.648 |
| Hypogene |
11,961 |
0.038 |
0.073 |
1.893 |
0.00005 |
0.007 |
0.015 |
0.036 |
0.160 |
0.267 |
1.697 |
| All
Data |
30,764 |
0.151 |
0.271 |
1.794 |
0.00003 |
0.006 |
0.037 |
0.181 |
0.658 |
1.024 |
7.150 |
The number of CuCN composites is less than the
number of total copper composites since CuCN assays were not consistently requested in all historical drilling programs. In the important
enriched zone, there are 10,190 CuCN composites as compared to 10,284 total copper composites.
For composites assayed by both methods, Figure
11.12 shows the correlation between cyanide soluble and total copper for sulfide mineral zones.
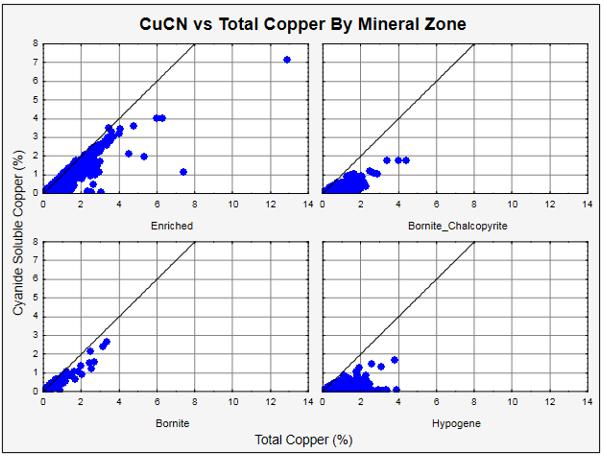
Figure 11.12: Scatter plots of Total Copper
VS Cyanide Soluble Copper
| Project Los Azules – S-K 1300 Technical Report Summary | Project No.: 21139-01 | 11-153 |
For the bornite zone, the relationship between
the two types of copper is close to linear. For the hypogene and bornite-chalcopyrite zone, correlation is very weak. There is an important
level of correlation in the enriched zone; however, the slope of the line (solubility ratio) is not constant.
The solubility ratio is dependent on copper mineralogy.
From the base of the leach to the top of primary zone, a change in copper mineralogy is seen. Near the base of the leach zone, chalcocite
and possibly copper oxides are observed. Near the base of the enriched zone, a mixture of chalcocite and chalcopyrite is found. Due to
this change in mineralogy, solubility is expected to vary across the vertical thickness of the enriched zone.
To check for a vertical trend in solubility, the
relative depth of each composite (depth below top of enriched/total vertical thickness) was determined and statistics by relative depth
interval were calculated.
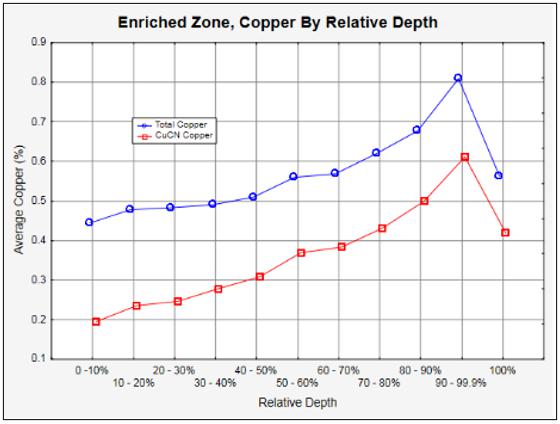
Figure 11.13: Graph Showing Relationship Between
Copper Grades and Depth.
Moving from a relative depth of 0 to 100% equates
to moving from the base of the enriched zone to the top. Due to model resolution, the uppermost group in some cases captures samples that
could be partially leached; as the enriched zone thins (associated with lower grade) more samples report to the 100% bin (as an example,
if the enriched zone thickness is only 1 block, all composites from the drillhole report to the 100% group).
The plot clearly shows that average CuCN grades
decrease more rapidly with depth than total copper in the enriched zone. This unequal decrease in average grades results in a reduction
in CuCN solubility with depth.
| Project Los Azules – S-K 1300 Technical Report Summary | Project No.: 21139-01 | 11-154 |
Gold and Silver
The spatial distribution of gold and silver grades
is like that of copper; however, the precious metals show high grade values associated with assumed localized structures and veins (Late-Stage
Quartz Veins identified in logging) that are independent of copper. Scatterplots of average grades over large blocks show these features
of the correlation.
Figure 11.14: Scatter plots of Precious Metals
vs Total Copper.
Grade capping of precious metal grades will be
required to address the local grade variability.
| Table 11.10: Basic Statistics for Gold Grades by Mineral Zone. |
| Mineral
Zone |
|
|
Standard |
Coefficient |
Minimum |
Percentile |
Maximum |
| Number
of |
Average |
Deviation |
of |
| Composites |
(%) |
(%) |
Variation |
25th |
50th |
75th |
95th |
98th |
| Overburden |
421 |
0.030 |
0.032 |
1.055 |
0.005 |
0.010 |
0.020 |
0.040 |
0.100 |
0.120 |
0.220 |
| Leached |
5,140 |
0.052 |
0.103 |
1.961 |
0.003 |
0.010 |
0.030 |
0.070 |
0.150 |
0.190 |
3.590 |
| Enriched |
10,284 |
0.057 |
0.121 |
2.132 |
0.003 |
0.020 |
0.040 |
0.070 |
0.150 |
0.220 |
8.720 |
| Mixed |
883 |
0.053 |
0.089 |
1.667 |
0.003 |
0.010 |
0.030 |
0.070 |
0.150 |
0.220 |
1.290 |
| Bn-Cpy |
1,915 |
0.063 |
0.106 |
1.677 |
0.005 |
0.020 |
0.040 |
0.070 |
0.160 |
0.240 |
2.290 |
| Bornite |
590 |
0.060 |
0.080 |
1.335 |
0.005 |
0.030 |
0.040 |
0.070 |
0.140 |
0.210 |
0.980 |
| Hypogene |
12,256 |
0.043 |
0.172 |
4.036 |
0.003 |
0.010 |
0.020 |
0.040 |
0.120 |
0.190 |
9.160 |
| All
Data |
31,489 |
0.051 |
0.138 |
2.735 |
0.003 |
0.010 |
0.030 |
0.060 |
0.140 |
0.200 |
9.160 |
| Project Los Azules – S-K 1300 Technical Report Summary | Project No.: 21139-01 | 11-155 |
| Table 11.11: Basic Statistics for Silver Grades by Mineral Zone. |
| Mineral
Zone |
|
|
Standard |
Coefficient |
Minimum |
Percentile |
Maximum |
| Number
of |
Average |
Deviation |
of |
| Composites |
(%) |
(%) |
Variation |
25th |
50th |
75th |
95th |
98th |
| Overburden |
421 |
0.601 |
0.758 |
1.262 |
0.25 |
0.25 |
0.25 |
0.70 |
1.50 |
2.40 |
8.23 |
| Leached |
5,141 |
0.940 |
1.987 |
2.115 |
0.10 |
0.50 |
0.50 |
0.83 |
2.50 |
4.38 |
65.5 |
| Enriched |
10,284 |
1.518 |
10.115 |
6.661 |
0.15 |
0.50 |
0.70 |
1.50 |
4.30 |
6.60 |
954 |
| Mixed |
883 |
1.471 |
3.170 |
2.156 |
0.15 |
0.50 |
0.55 |
1.30 |
4.90 |
10.1 |
49.7 |
| Bn-Cpy |
1,915 |
1.908 |
2.876 |
1.507 |
0.15 |
0.60 |
1.20 |
2.20 |
5.30 |
8.50 |
53.8 |
| Bornite |
590 |
1.739 |
1.730 |
0.995 |
0.25 |
0.80 |
1.30 |
2.10 |
4.10 |
6.80 |
19.6 |
| Hypogene |
12,256 |
1.418 |
3.456 |
2.437 |
0.10 |
0.50 |
0.60 |
1.30 |
4.50 |
7.70 |
172 |
| All Data |
31,490 |
1.399 |
6.294 |
4.499 |
0.10 |
0.50 |
0.60 |
1.40 |
4.20 |
7.00 |
954 |
As compared to total copper, precious metal grades
show more variability, and the mineral zone provides a weaker control on grades.
Density was estimated using the same 2190 density
measurements (by the water immersion method) available for the 2017 PEA model. No density data was collected during the 2022 field program.
Density data was coded for lithology and mineral
zone using the block model and a statistical analysis was performed. High-and-low outliers were defined. Density values less than 2 g/cc
were set to 2 g/cc (1 sample) and values larger than 2.9 g/cc were set to 2.9 g/cc (1 sample).
Density was estimated by mineral zone. Summary
statistics are presented in Table 11.12.
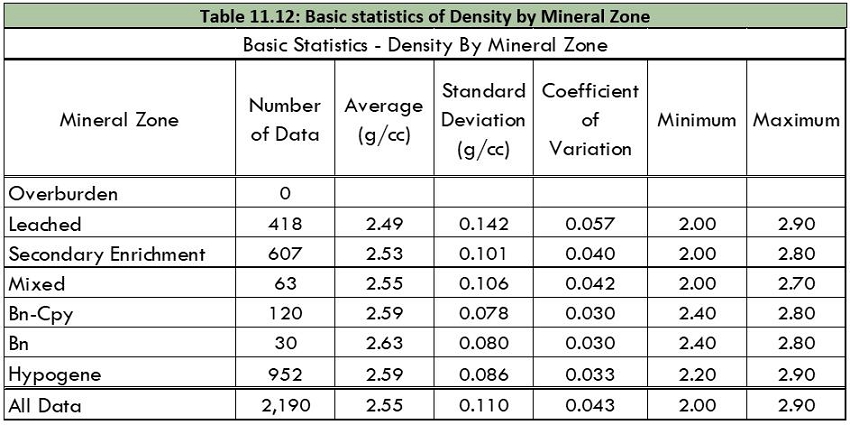
A value of 2.4 g/cc was assigned to overburden.
| Project Los Azules – S-K 1300 Technical Report Summary | Project No.: 21139-01 | 11-156 |
Density was estimated separately for each mineral
zone. Inverse distance squared estimation was used for each estimate. The search was anisotropic aligned parallel to the main structures
(N20W) with radii of 150 m along strike, 100 m across strike, and 100 m vertically. A minimum of 4 and a maximum of 10 samples were used
with the additional restriction that a maximum of 3 samples per drillhole were used. This restriction requires that data come from at
least 2 drillholes to estimate a block. For un-estimated blocks, the search was expanded by a factor of 2 and then 3. Blocks that remained
un-estimated were assigned the average density of the appropriate mineral zone.
| 11.7 | Evaluation of Outlier Grades |
Grades per estimation domain show an important
spatial association with the central NNW structure. As a result, the distribution of grades, including the values of the upper percentiles,
vary by location; standard approaches to defining outliers (such as examining the global distribution of grades) are thus not appropriate.
When average grades per domain are variable in space, outliers must be identified and managed based on local statistics. The capping approach
taken compares local grades with and without each composite grade. Those composites associated with a substantial change in local grade
are identified as outliers. Local outliers are capped to a value that is consistent with the neighboring grades. Local capped grades were
defined for copper, gold, and silver per estimation domain. Table 11.13 presents the potential metal removal due to capping.
| Project Los Azules – S-K 1300 Technical Report Summary | Project No.: 21139-01 | 11-157 |
| Table 11.13: Potential Effect of Capping on Copper, Gold, and Silver Content. |
Mineral
Zone |
Number of
Composites |
Average Copper (%) |
| |
|
Metal |
| Uncapped |
Capped |
Removal |
| Leached |
5,155 |
0.033 |
0.033 |
0.0% |
| Enriched |
10,284 |
0.558 |
0.556 |
0.3% |
| Mixed |
869 |
0.250 |
0.250 |
0.0% |
| Bn-Cpy |
1,915 |
0.418 |
0.416 |
0.6% |
| Bornite |
590 |
0.408 |
0.408 |
0.0% |
| Hypogene |
12,256 |
0.274 |
0.274 |
0.0% |
| All Data |
31,069 |
0.339 |
0.338 |
0.2% |
Mineral
Zone |
Number of
Composites |
Average
Gold (%) |
| |
|
Metal |
| Uncapped |
Capped |
Removal |
| Leached |
5,154 |
0.052 |
0.050 |
3.8% |
| Enriched |
10,284 |
0.057 |
0.053 |
6.4% |
| Mixed |
869 |
0.053 |
0.049 |
7.9% |
| Bn-Cpy |
1,915 |
0.063 |
0.059 |
6.1% |
| Bornite |
590 |
0.060 |
0.056 |
7.5% |
| Hypogene |
12,256 |
0.043 |
0.037 |
12.1% |
| All Data |
31,068 |
0.051 |
0.047 |
7.9% |
| Mixed Zone capped to 0.1 g/t |
Mineral
Zone |
Number of
Composites |
Average
Silver (%) |
| |
|
Metal |
| Uncapped |
Capped |
Removal |
| Leached |
5,155 |
0.938 |
0.828 |
11.7% |
| Enriched |
10,284 |
1.518 |
1.298 |
14.5% |
| Mixed |
869 |
1.488 |
1.325 |
11.0% |
| Bn-Cpy |
1,915 |
1.908 |
1.868 |
2.1% |
| Bornite |
590 |
1.739 |
1.726 |
0.7% |
| Hypogene |
12,256 |
1.418 |
1.309 |
7.7% |
| All Data |
31,069 |
1.410 |
1.268 |
10.0% |
| Mixed Zone capped to 9.0 g/t |
| Project Los Azules – S-K 1300 Technical Report Summary | Project No.: 21139-01 | 11-158 |
Based on the very low metal removals seen for
total copper, the resource estimate is based on uncapped copper grades. Local capped grades are used for gold and silver except for the
mixed zone. Due to the small number of data, the mixed zone composites were capped at approximately the 99th percentile of the grade distribution.
In addition to capping, a small number of composites
were restricted for all elements. Two types of composites requiring restriction were identified: logged late quartz veins and breccia
composites more than 22.5 m (1.5 bench heights) from a breccia block. The restricted composites only participated in the estimation of
the block containing the composite.
Experimental variograms were computed by mineral
zone. Given the observed spatial grade trends, variability is expected to be dependent on direction and the variograms will show a zonal
anisotropy. To best show the anisotropy, variograms rather than correlograms are preferred. To reduce noise associated with local variability,
pairwise relative variograms were computed and modeled.
| Project Los Azules – S-K 1300 Technical Report Summary | Project No.: 21139-01 | 11-159 |


Figure 11.15: Experimental Data and Modeled
Variogram.
For the enriched zone, the strongest correlation
is observed parallel to the strike direction of the steeply dipping central structure. The largest variability is seen perpendicular to
the plane due to the grade trend in this direction. Experimental variograms parallel to possible dip directions showed less correlation
than the vertical variogram.
For the primary/hypogene zone, the strongest correlation
remains parallel to the NNW structure. The downdip and perpendicular-to-the-plane variograms show similar levels of correlation.
| Project Los Azules – S-K 1300 Technical Report Summary | Project No.: 21139-01 | 11-160 |
| Table 11.14: Variogram Model Parameters for Copper, Gold, and Silver. |
| Copper |
Mineral
Zone |
Axis
Orientation (trend/plunge) |
|
Spherical
Structure 1 |
Spherical
Structure 2 |
Spherical
Structure 3 |
| Major |
Minor |
Semi- |
Nugget |
Variance
|
Distances
(m) |
Variance
|
Distances
(m) |
Variance |
Distances
(m) |
| Major |
Effect |
(C
Value) |
Major |
Minor |
Semi |
(C
Value) |
Major |
Minor |
Semi |
(C
Value) |
Major |
Minor |
Semi |
| Enriched |
N20W/0 |
N70E/0 |
0/90 |
0.13 |
0.07 |
17 |
13 |
32 |
0.04 |
64 |
64 |
133 |
0.08 |
5000 |
89 |
158 |
| Leach |
N20W/0 |
N70E/0 |
0/90 |
0.1 |
0.1 |
32 |
88 |
34 |
0.07 |
320 |
133 |
69 |
0.05 |
5000 |
133 |
69 |
| Primary |
N20W/0 |
250/60 |
70/30 |
0.15 |
0.07 |
36 |
56 |
107 |
0.08 |
241 |
241 |
389 |
0.13 |
5000 |
355 |
430 |
| |
|
|
|
|
|
|
|
|
|
|
|
|
|
|
|
|
| Gold |
Mineral
Zone |
Axis
Orientation (trend/plunge) |
|
Spherical
Structure 1 |
Spherical
Structure 2 |
Spherical
Structure 3 |
| Major |
Minor |
Semi- |
Nugget |
Variance
|
Distances
(m) |
Variance
|
Distances
(m) |
Variance |
Distances
(m) |
| Major |
Effect |
(C
Value) |
Major |
Minor |
Semi |
(C
Value) |
Major |
Minor |
Semi |
(C
Value) |
Major |
Minor |
Semi |
| Enriched |
N20W/0 |
N70E/0 |
0/90 |
0.15 |
0.08 |
29 |
23 |
13 |
0.1 |
175 |
111 |
82 |
0.12 |
5000 |
187 |
5000 |
| Leach |
N20W/0 |
N70E/0 |
0/90 |
0.14 |
0.06 |
25 |
84 |
23 |
0.05 |
69 |
98 |
211 |
0.2 |
5000 |
122 |
5000 |
| Primary |
N20W/0 |
70/30 |
250/60 |
0.2 |
0.2 |
131 |
117 |
63 |
0.1 |
1200 |
437 |
482 |
0.1 |
5000 |
491 |
1200 |
| |
|
|
|
|
|
|
|
|
|
|
|
|
|
|
|
|
| Silver |
Mineral
Zone |
Axis
Orientation (trend/plunge) |
|
Spherical
Structure 1 |
Spherical
Structure 2 |
Spherical
Structure 3 |
| Major |
Minor |
Semi- |
Nugget |
Variance
|
Distances
(m) |
Variance
|
Distances
(m) |
Variance |
Distances
(m) |
| Major |
Effect |
(C
Value) |
Major |
Minor |
Semi |
(C
Value) |
Major |
Minor |
Semi |
(C
Value) |
Major |
Minor |
Semi |
| Enriched |
N20W/0 |
N70E/0 |
0/90 |
0.23 |
0.1 |
42 |
41 |
35 |
0.12 |
55 |
91 |
266 |
0.07 |
5000 |
200 |
700 |
| Leach |
N20W/0 |
N70E/0 |
0/90 |
0.15 |
0.05 |
44 |
27 |
33 |
0.05 |
89 |
36 |
115 |
0.1 |
133 |
51 |
5000 |
| Primary |
N70E/0 |
N20W/0 |
250/60 |
0.2 |
0.1 |
22 |
22 |
12 |
0.1 |
53 |
39 |
64 |
0.1 |
318 |
207 |
196 |
| Project Los Azules – S-K 1300 Technical Report Summary | Project No.: 21139-01 | 11-161 |
| 11.9 | Model Setup and Limits |
The resource block model was developed in DATAMINE
Studio software. Table 11.15 presents the dimensions and limits of the model. The Posgar 94 coordinate system was used. The block size
of 20 x 20 x 15 m is consistent with the typical selective mining unit (SMU) used for this type of copper deposit.
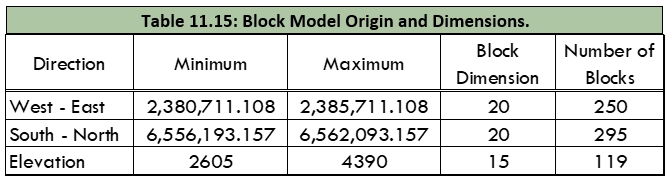
Model blocks are assigned lithology and mineral
zone codes based on the block centroid and the wireframe models from the geologic model. Sub-blocks were not used. The model contains
a field defining the percentage of the block below surface topography.
| 11.10 | Interpolation Parameters |
Block model grades were estimated using a combination
of ordinary Kriging and inverse distance squared weighting. Inverse distance weighting was used for the smaller domains where a variogram
model could not be developed (mixed zone and overburden). The estimation search uses multiple passes with decreasing restrictions to allow
estimation of a large proportion of the model blocks. The search pass where each block is estimated is stored in the model output file.
Different, but similar, searches were used for
copper and the precious metals. The search strategy for copper is presented to illustrate the approach. The first three search passes
use an octant restriction, requiring that four of the octants surrounding the block contain data. This increases the likelihood that data
will surround the block. If a block cannot be estimated in the first three passes, estimation based on a minimum number of drillholes
near the block is performed. Three drillhole restriction search passes are considered yielding a total of six estimation searches, the
first three search passes with octants.
| Table
11.16: Search Strategy for Copper Estimation, Pass 1 to 3 |
Mineral
Zone |
Search
Distance By Direction |
Octant
Restriction |
#
of Composites |
Search
Expansion 1 |
Search
Expansion 2 |
| N20W/0 |
N70E/0 |
0/90 |
Octants
Filled |
Min.
Per
Octant |
Max.
Per
Octant |
Minimum |
Maximum |
Factor |
Minimum |
Maximum |
Factor |
Minimum |
Maximum |
| Overburden |
100 |
100 |
100 |
4 |
1 |
7 |
15 |
30 |
2 |
15 |
30 |
3 |
8 |
20 |
| Leach |
100 |
100 |
100 |
4 |
1 |
7 |
15 |
30 |
2 |
15 |
30 |
3 |
8 |
20 |
| Enriched |
150 |
75 |
25 |
4 |
1 |
7 |
15 |
30 |
2 |
15 |
30 |
3 |
8 |
20 |
| Mixed |
150 |
75 |
50 |
4 |
1 |
7 |
15 |
30 |
2 |
15 |
30 |
3 |
8 |
20 |
| Bn-Cpy |
150 |
75 |
50 |
4 |
1 |
7 |
15 |
30 |
2 |
15 |
30 |
3 |
8 |
20 |
| Bornite |
150 |
75 |
50 |
4 |
1 |
7 |
15 |
30 |
2 |
15 |
30 |
3 |
8 |
20 |
| Hypogene |
150 |
75 |
50 |
4 |
1 |
7 |
15 |
30 |
2 |
15 |
30 |
3 |
8 |
20 |
| Project Los Azules – S-K 1300 Technical Report Summary | Project No.: 21139-01 | 11-162 |
The second three searches (search passes 4 through
6) are presented in Table 11.17.
| Table 11.17: Search Strategy for Copper Estimation, Pass 4 to 6 |
Mineral
Zone |
Search
Distance By Direction |
Max. |
#
of Composites |
Search
Expansion 1 |
Search
Expansion 2 |
| N20W/0 |
N70E/0 |
0/90 |
Samples
Per Hole |
Minimum |
Maximum |
Factor |
Minimum |
Maximum |
Factor |
Minimum |
Maximum |
| Overburden |
300 |
300 |
300 |
5 |
10 |
24 |
2 |
10 |
24 |
3 |
10 |
24 |
| Leach |
300 |
300 |
300 |
8 |
12 |
24 |
2 |
12 |
24 |
3 |
12 |
24 |
| Enriched |
450 |
225 |
75 |
8 |
12 |
24 |
2 |
12 |
24 |
3 |
12 |
24 |
| Mixed |
450 |
225 |
150 |
8 |
12 |
24 |
2 |
12 |
24 |
3 |
12 |
24 |
| Bn-Cpy |
450 |
225 |
150 |
8 |
12 |
24 |
2 |
12 |
24 |
3 |
12 |
24 |
| Bornite |
450 |
225 |
150 |
8 |
12 |
24 |
2 |
12 |
24 |
3 |
12 |
24 |
| Hypogene |
450 |
225 |
150 |
8 |
12 |
24 |
2 |
12 |
24 |
3 |
12 |
24 |
Anisotropic searches parallel to the major NNW
structure are used outside of the overburden and leach. A smaller vertical search is used in the enriched zone due to the observed vertical
trend in copper solubility.
The same search strategy and variogram models
were used for both total and soluble copper to avoid generating solubility artifacts in the estimates. Not all composites have both total
and soluble copper grades since soluble copper assays were not performed in some of the past drilling campaigns. To account for the missing
data, copper is estimated in two passes:
| · | Estimate grades using only the composite data with both soluble and total copper. |
| · | Estimate grades using all total copper grades (final total copper estimate). |
| · | To obtain the final soluble copper grade, compute the ratio of soluble to total copper (from the first
estimate), then multiply this ratio by the final total copper estimate. |
In this approach there is an implicit assumption
of solubility stationarity (invariability of the average in space). Within the enriched zone, solubility is clearly a function of proximity
to the upper and lower contacts of the unit. To account for this natural change in mineralogy/solubility, the enriched zone copper estimates
are restricted to relative depth bands and the vertical search is reduced.
To validate the model, comparisons of the estimated
block grades with the grades of the samples are undertaken to assess whether the model honors the data. To remove spatial clustering and
define the volume of influence of each composite, nearest neighbor models were created. The height of the model blocks is 15 m, while
the composite length is 2 m. If an NN model were created using this information, only every 7th or 8th composite would be nearest to a
block centroid (i.e., most data would not participate in the validation). To address this issue, the resource model blocks were subdivided
into 2.5 m high sub-blocks for the NN model.
The validation steps performed were:
| · | Visual inspection of model and data grades on section and plan. |
| · | Comparison of average model and sample grades per estimation domain. |
| · | Comparison of average model and sample grades over large blocks. |
| · | Comparison of average model and sample grades over slices through the model. |
| Project Los Azules – S-K 1300 Technical Report Summary | Project No.: 21139-01 | 11-163 |
Visual Inspection
The visual inspection considers both the geological
model and the estimated grades. The model check confirms that the model blocks are properly coded and that the domain codes of the data
match those of the model. The check of grades compares the spatial pattern of grades seen in the composite samples with that of the estimated
block grades. Important features observed in the samples such as the anisotropic correlation pattern parallel and perpendicular to the
central structure, the decrease in grade moving away from the data, and the vertical decrease in solubility with depth in the enriched
zone are reproduced in the model. Furthermore, the grades seen in the drillholes match well with the estimated block grades.
Average Grades by Domain
As an overall check of the estimated grades, average
model and NN grades are compared by domain and search pass for the leach, enriched and hypogene zones. For each comparison, the number
of estimated blocks is shown along with the relative difference in the two estimated grades.
Both average total and cyanide soluble copper
grades are compared. It is noted that for soluble copper the resource model used a two-stage estimation to account for the missing CuCN
data while the NN estimate is a simple estimate using only the available data.
Examining the number of blocks estimated per pass
provides information on drillhole density per mineral zone. The enriched zone was typically estimated in search pass 2 or 3, while the
bulk of the hypogene zone could not be estimated until search pass 4.
| Project Los Azules – S-K 1300 Technical Report Summary | Project No.: 21139-01 | 11-164 |
| Table 11.18: Comparison of Resource and NN Estimates in The Block Model. |
| Comparison of Model and Data Averages
By Mineral Zone and Search Pass (only blocks with Nearest Neighbor Estimates) |
| |
|
|
Total
Copper |
Cyanide
Soluble Copper |
Acid
Soluble Copper |
| Search |
Mineral |
Tonnes |
Model |
Data |
Relative |
Model |
Data |
Relative |
Model |
Data |
Relative |
| Pass |
Zone |
(000,000) |
Avg
(%) |
Avg
(%) |
Difference |
Avg
(%) |
Avg
(%) |
Difference |
Avg
(%) |
Avg
(%) |
Difference |
| 1 |
Cover |
3.2 |
0.025 |
0.026 |
1.8% |
0.001 |
0.001 |
4.1% |
0.008 |
0.008 |
0.5% |
| 1 |
Leach |
61.2 |
0.035 |
0.036 |
3.0% |
0.005 |
0.005 |
4.1% |
0.009 |
0.010 |
9.0% |
| 1 |
Enriched |
124.6 |
0.617 |
0.610 |
-1.1% |
0.406 |
0.400 |
-1.6% |
0.053 |
0.054 |
1.8% |
| 1 |
Mixed |
1.9 |
0.281 |
0.257 |
-9.1% |
0.156 |
0.131 |
-18.9% |
0.071 |
0.075 |
5.2% |
| 1 |
Cpy-Bn |
0.4 |
0.342 |
0.315 |
-8.6% |
0.110 |
0.085 |
-28.9% |
0.021 |
0.019 |
-7.7% |
| 1 |
Bornite |
0.1 |
0.324 |
0.421 |
23.1% |
0.261 |
0.325 |
19.6% |
0.012 |
0.016 |
25.9% |
| 1 |
Hypogene |
43.8 |
0.296 |
0.301 |
1.6% |
0.059 |
0.060 |
1.7% |
0.016 |
0.016 |
3.0% |
| 1 |
Volcanics |
0.6 |
0.003 |
0.003 |
-5.4% |
0.001 |
0.001 |
-5.3% |
0.001 |
0.000 |
-68.9% |
| 2 |
Cover |
47.2 |
0.021 |
0.022 |
3.3% |
0.001 |
0.002 |
14.1% |
0.006 |
0.006 |
-2.9% |
| 2 |
Leach |
344.5 |
0.034 |
0.035 |
3.8% |
0.005 |
0.006 |
7.4% |
0.008 |
0.009 |
3.8% |
| 2 |
Enriched |
416.5 |
0.482 |
0.479 |
-0.7% |
0.307 |
0.303 |
-1.4% |
0.049 |
0.050 |
3.1% |
| 2 |
Mixed |
1.5 |
0.398 |
0.375 |
-6.1% |
0.228 |
0.208 |
-9.7% |
0.093 |
0.092 |
-0.7% |
| 2 |
Hypogene |
168.1 |
0.273 |
0.275 |
1.0% |
0.062 |
0.061 |
-1.4% |
0.015 |
0.016 |
5.2% |
| 2 |
Volcanics |
20.9 |
0.003 |
0.003 |
-3.9% |
0.001 |
0.001 |
-4.0% |
0.001 |
0.000 |
-11.2% |
| 3 |
Cover |
78.2 |
0.032 |
0.039 |
18.1% |
0.002 |
0.002 |
18.6% |
0.008 |
0.009 |
8.9% |
| 3 |
Leach |
217.6 |
0.035 |
0.034 |
-0.7% |
0.006 |
0.006 |
6.7% |
0.009 |
0.006 |
-38.4% |
| 3 |
Enriched |
257.6 |
0.405 |
0.398 |
-1.8% |
0.238 |
0.232 |
-2.6% |
0.043 |
0.044 |
1.9% |
| 3 |
Mixed |
0.1 |
0.267 |
0.146 |
-82.6% |
0.138 |
0.053 |
-161.6% |
0.060 |
0.026 |
-132.7% |
| 3 |
Hypogene |
192.2 |
0.232 |
0.245 |
5.3% |
0.045 |
0.046 |
2.5% |
0.013 |
0.015 |
13.0% |
| 3 |
Volcanics |
18.5 |
0.003 |
0.003 |
-5.2% |
0.001 |
0.001 |
-4.7% |
0.001 |
0.000 |
-70.6% |
| 4 |
Cover |
58.9 |
0.028 |
0.029 |
3.1% |
0.001 |
0.002 |
5.5% |
0.007 |
0.006 |
-9.7% |
| 4 |
Leach |
222.4 |
0.030 |
0.029 |
-1.6% |
0.005 |
0.005 |
1.0% |
0.008 |
0.006 |
-24.0% |
| 4 |
Enriched |
206.1 |
0.369 |
0.347 |
-6.3% |
0.216 |
0.197 |
-9.6% |
0.041 |
0.041 |
1.4% |
| 4 |
Mixed |
1.0 |
0.363 |
0.325 |
-11.7% |
0.192 |
0.150 |
-28.3% |
0.101 |
0.112 |
9.3% |
| 4 |
Cpy-Bn |
342.0 |
0.359 |
0.347 |
-3.4% |
0.099 |
0.095 |
-4.8% |
0.020 |
0.020 |
-0.9% |
| 4 |
Bornite |
86.1 |
0.357 |
0.360 |
1.0% |
0.214 |
0.224 |
4.4% |
0.024 |
0.024 |
2.9% |
| 4 |
Hypogene |
2218.8 |
0.254 |
0.253 |
-0.1% |
0.024 |
0.025 |
7.4% |
0.008 |
0.008 |
6.5% |
| 4 |
Volcanics |
52.6 |
0.004 |
0.004 |
-7.3% |
0.001 |
0.001 |
-14.1% |
0.001 |
0.000 |
-32.4% |
For cyanide soluble copper, the most appropriate
comparisons are over the enriched zone. Outside of this zone, very low soluble copper grades are observed, and small differences can generate
large relative difference values.
Except in those domains where data is sparse,
the model and data average grades match acceptably well for total copper. For soluble copper, the two estimates of average grades match
well for the enriched zone domains in passes 1 through 3. This similarity in average grades provides an indication that the two-step Kriging
estimate, used for soluble copper, has not generated an estimation bias. In search pass 4, the difference in averages grades increase
for both copper species, indicating that estimate quality is reduced.
Average Grades Over Large Blocks
Model and sample data (NN model) grades are averaged
into larger 60 x 100 x 60 m blocks and then compared in a scatterplot. A larger block dimension is considered in the North-South direction
due to the stronger grade correlation parallel to the NNW structure. Averaging block grades over a larger volume compensates for the difference
in the variances of block and data grades and allows a local, numerical, comparison of the two estimates over the entire deposit. Groups
of blocks with important differences in the two estimates can be identified in space and reviewed.
| Project Los Azules – S-K 1300 Technical Report Summary | Project No.: 21139-01 | 11-165 |
Figure 11.16 presents validation scatterplots
for total and cyanide soluble copper for blocks estimated in search pass 1 and search passes 1 and 2.

Figure 11.16: Scatter Plots of Large Block
Comparison of Samples VS Model Grades.
The upper scatterplots are for total copper while
the lower plots are for cyanide soluble copper. The plots on the left side consider model blocks estimated in search pass 1. Blocks estimated
in passes 1 and 2 are shown on the right. In all four scatterplots, the points are well centered on the line Y=X. For blocks estimated
in search pass 1 the scatter is less; however, the comparison for pass 1 and 2 estimates is acceptable. For cyanide soluble copper, the
NN estimate is more variable and indicates the possibility of larger grades. If true, the model is conservative.
| Project Los Azules – S-K 1300 Technical Report Summary | Project No.: 21139-01 | 11-166 |
Validations Over Slices Through the Model
Slices with widths of 80 m (NS) and 60 m (EW)
are cut through the resource model and average model and sample grades are compared. Figure 11.17 presents average total and soluble copper
grades for the enriched and hypogene zones for blocks estimated in passes 1 or 2.

Figure 11.17: East-West Swath Plots of Total
and Cyanide Soluble Copper Grades in the NN Model
The total volume per slice is shown on the right
axis. As seen, the two sets of average grades are very similar across the deposit with the NN average showing larger variance.
The same plot considering grades by easting is
shown in Figure 11.18.
| Project Los Azules – S-K 1300 Technical Report Summary | Project No.: 21139-01 | 11-167 |

Figure 11.18: North-South Swath Plots of Total
and Cyanide Soluble Copper Grades in the NN Model
When considered as a function of easting, average
grades show a peak associated with the central NNW structure and decrease rapidly to both the west and east. The peak grade is seen for
total copper in both mineral zones, but the peak is sharper in the enriched zone. For both total and soluble copper, in each of the two
mineral zones, the resource model and NN averages match well.
In the vertical direction, a vertical solubility
trend was observed in the data. To best reproduce this trend, the estimation approach utilized a relative depth coordinate transform to
control the estimation. This estimate is compared against an untransformed NN estimate.
| Project Los Azules – S-K 1300 Technical Report Summary | Project No.: 21139-01 | 11-168 |
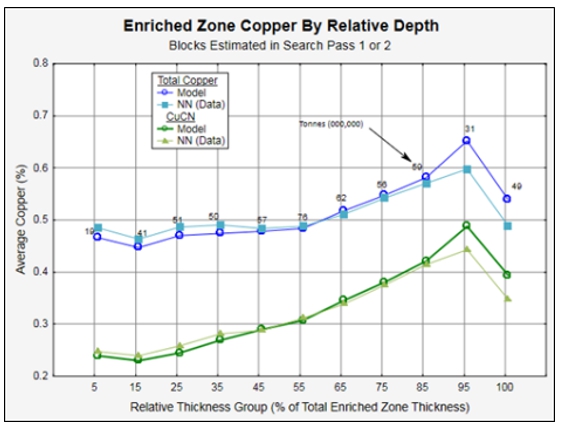
Figure 11.19: Total and Cyanide Soluble Copper
Related to Depth from the Top of the Enriched Zone
This plot shows that the resource model finds
lower grades approaching the base and slightly higher grades near the top of the enriched zone. This type of average grade difference
is an indication that the NN model (based on untransformed coordinates) is smoothing the vertical trend relative to the resource model.
Given the small differences observed and the differences in the model and validation approach, the model is validated by the NN results.
| 11.12 | Resource Classification |
The mineral resources at the Los Azules Deposit
have been classified in accordance with the CIM Definition Standards for Mineral Resources and Mineral Reserves (May 2019) and the SEC’s
S-K 1300 regulations (2018). Studies supporting the 2017 PEA model (Hatch, 2017) found that drilling on a 150 m grid was sufficient to
define an Indicated resource. This result was validated by CRM4.
The resource classification approach taken recognizes
that the Los Azules Deposit is not drilled on a regular grid. To obtain a measure of the local drilling density, a block-by-block computation
was performed for blocks located outside of the leached or overburden zones. For each block, the average distance to the nearest three
drillholes was determined. To select the most relevant dimension, plan and section images were created and the following were reviewed:
| · | The location of the drillholes |
| · | The continuity of grades in space |
| · | Images of the estimated distance to the nearest three drillholes |
| · | The extent of the validation volume (blocks estimated in search passes 1 and 2). |
4 Consultores de Recursos Minerales (CRM), Memo to Antonio Samaniego (SRK), Review of Los Azules Drill Spacing and Classification, 4 June
2021
| Project Los Azules – S-K 1300 Technical Report Summary | Project No.: 21139-01 | 11-169 |
Based on this assessment, it was determined that
non-breccia blocks where the average spacing to the nearest three drillholes was less than 120 m were defined as Indicated resource. The
reduction from the previously stated 150 m grid to 120 m is to allow for the differences between a regular grid spacing and the distance
to 3 irregularly spaced drillholes. For breccia blocks, 75 m was selected due to the reduced continuity of this lithology. Using a similar
evaluation, blocks with an average distance to the nearest three drillholes between 120 m and 400 m were considered inferred resource.
To satisfy the requirement for reported mineral
resources to have a reasonable prospect of eventual economic extraction (RPEEE), an open pit was evaluated using the resource model. The
economic value of each block was calculated based on the metal content, the price of each metal, processing costs, and other downstream
costs associated with having a final saleable product. This value is stored for each block of the model as Net Smelter Return (NSR). The
parameters used to calculate NSR in the models are detailed in Section 11.13.1.
The NSR values were used to generate an open pit
with variable cutoff values to cover the material types and recovery methodology. The parameters used to evaluate the leach versus potential
flotation mill recovery are detailed in Section 11.13.4.
The initial Indicated resource blocks were subsequently
modified as follows:
| · | Indicated blocks below elevation 3340 m were downgraded to the Inferred category. This elevation range
is investigated by three deep drillholes which identified a mineralized zone that is offset from the main structure. The geologic controls
on mineralization in this volume are not well understood. |
| · | The initial classification was smoothed to remove some of the isolated blocks. An example of the smoothed
and unsmoothed classification is presented in Figure 11.20. |
| Project Los Azules – S-K 1300 Technical Report Summary | Project No.: 21139-01 | 11-170 |
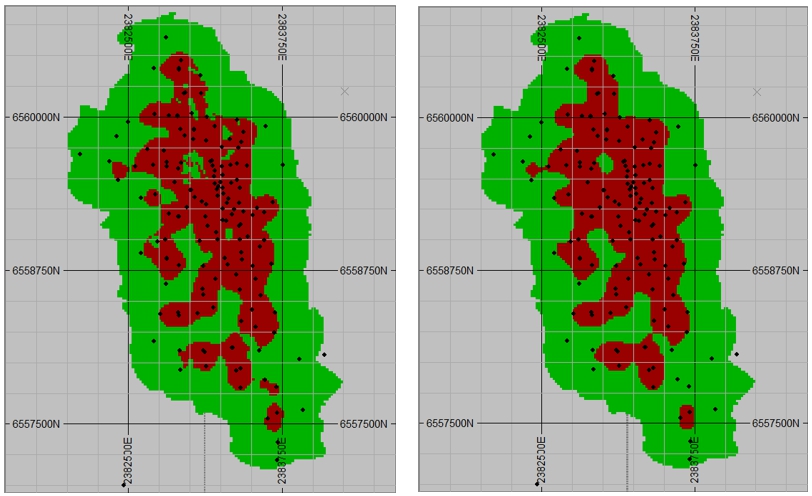
Level 3500 +/- 8m, The Initial (L)
and Smoothed Classification (R); Data in northwest are leach and are not considered.
Figure 11.20: Comparison of Indicated and
Inferred limits before and after Smoothing.
| Project Los Azules – S-K 1300 Technical Report Summary | Project No.: 21139-01 | 11-171 |
About a third of the resource is located underneath
some cryogenic geoform features. Figure 11.21 shows the plan outline of the resource pit and the location of the cryogenic geoforms identified
with a 50 m standoff line around each. Given the environmental consideration of these features, the indicated material below and to the
west of the geoforms within the resource pit shell has been downgraded to Inferred pending further investigations.
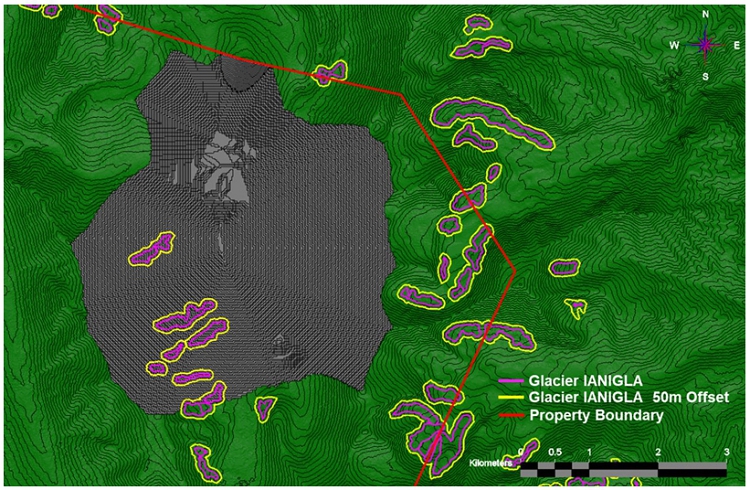
Figure 11.21: Plan View of the Resource Pit
with Geoforms Outlines
Table 11.19 reports the Indicated and Inferred
resources from the 2022 S-K 1300 IA Technical Report Summary, which were reported at a 0.2% copper cut-off. These are now obsolete and
are replaced with the 2023 IA Mineral Resource Estimate in this report. They are presented here only for comparative purposes.
| Table 11.19: 2017 Estimate of Los Azules Mineral Resources |
| |
Average Grade |
Contained Metal |
| Mtonnes |
Cu % |
Au g/t |
Mo % |
Ag g/t |
Cu Blbs |
Au Moz |
Mo Mlbs |
Ag Moz |
| Indicated |
| 962 |
0.48 |
0.06 |
0.003 |
1.8 |
10.2 |
1.7 |
57.3 |
55.7 |
| Inferred |
| 2,666 |
0.33 |
0.04 |
0.003 |
1.6 |
19.3 |
3.8 |
194.0 |
135.4 |
Note: The mineral resources do not have demonstrated economic
viability
| Project Los Azules – S-K 1300 Technical Report Summary | Project No.: 21139-01 | 11-172 |
Net Smelter Return (NSR) Parameters
The NSR calculation varies according to the recovered
metal and the mineral zone being processed. Table 11.20 shows the prices and costs associated with using an acid leach method to recover
copper from the supergene material in the model.
| Table 11.20: NSR Parameters for Leach Recovery |
| Constant Item |
Value |
Units |
| |
|
|
| Metal Prices |
|
|
| Copper Price |
$ 4.00 |
USD$/lb. |
| Gold Price |
$ 1,700.00 |
USD$/Oz. |
| Silver Price |
$ 20.00 |
USD$/Oz. |
| |
|
|
| |
|
| Selling Costs (insurance & marketing) |
|
| Copper Selling Cost |
$ 0.02 |
USD$/lb. |
| Gold Selling Cost |
$ - |
USD$/Oz. |
| Silver Selling Cost |
$ - |
USD$/Oz. |
| |
| |
| Processing Cost |
| Processing Tonnes |
4.17 |
$/tonne |
| |
|
|
| Transportation Costs |
|
|
| Land Freight (truck) |
100.00 |
USD$/mt |
| Ocean Freight (ship) |
50.00 |
USD$/mt |
| Total Freight |
150.00 |
USD$/mt |
Note: Only copper is recovered in the leach method and has a constant recovery of 95% applied.
With applied solvent extraction / electro-winning (SX/EW) cathode production there are no smelter or related costs incurred.
With the potential for froth flotation as a recovery
method, the NSR values were calculated for both high-grade enriched and Primary material in a mill. This has the added benefit of also
recovering the gold and silver present in the resource. Table 11.21 details the parameters used to calculate NSR for this case.
| Project Los Azules – S-K 1300 Technical Report Summary | Project No.: 21139-01 | 11-173 |
| Table 11.21: NSR Parameters for Mill/Flotation Process |
| Constant Item |
Value |
Units |
| |
|
|
| Metal Prices |
|
|
| Copper Price |
$ 4.00 |
USD$/lb. |
| Gold Price |
$ 1,700.00 |
USD$/Oz. |
| Silver Price |
$ 20.00 |
USD$/Oz. |
| |
|
|
| |
|
| Selling Costs (insurance & marketing) |
|
| Copper Selling Cost |
$ 0.02 |
USD$/lb. |
| Gold Selling Cost |
$ - |
USD$/Oz. |
| Silver Selling Cost |
$ - |
USD$/Oz. |
| |
| Recoveries are specified in the rock type variable tabs |
| |
|
|
| Concentrate Terms |
|
|
| Min. Copper feed grade |
0 |
% Cu |
| Cu Con. Grade for Supergene |
28.53 |
% Cu |
| Cu Con. Grade for Primary |
31.96 |
% Cu |
| |
|
|
| Payable Metal |
|
|
| Copper Payability |
96.5 |
% |
| Gold Payability |
90.0 |
% |
| Silver Payability |
90.0 |
% |
| |
|
| Minimum Con. Grade for Credit Payability |
|
| Gold |
1 |
g/t |
| Silver |
30 |
g/t |
| |
|
|
| Refining Charges |
|
|
| Copper Refining Charges |
$ 0.080 |
USD$/lb. |
| Gold Refining Charges |
$ 8.000 |
USD$/Oz. |
| Silver Refining Charges |
$ 0.500 |
USD$/Oz. |
| |
|
|
| |
|
|
| Treatment Charges |
|
|
| Con. Treatment Charge |
$ 80.00 |
USD$/dmt |
| |
|
|
| Transportation Costs |
|
|
| Land freight – trucking rate |
|
$USD/wmt/km |
| Land freight – trucking distance |
|
km |
| Land freight – trucking |
$ 100.00 |
$USD/wmt |
| Ocean freight |
$ 50.00 |
$USD/wmt |
| Project Los Azules – S-K 1300 Technical Report Summary | Project No.: 21139-01 | 11-174 |
| Table 11.21: NSR Parameters for Mill/Flotation Process |
| Constant Item |
Value |
Units |
| Con. Moisture spec |
8 |
% |
| Total freight |
$ 162.00 |
$USD/dmt |
| |
|
|
| Copper Treatment and Transport |
$ 0.1098 |
$/lbs |
| Gold/Silver Treatment and Transport |
$ 0.0075 |
$/oz |
| |
|
|
| Total Selling Cost |
|
|
| Copper |
$ 0.21 |
$/lbs |
| Gold |
$ 8.01 |
$/oz |
| Silver |
$ 0.51 |
$/oz |
| |
|
|
| Recovery Factors |
Enriched |
Primary |
| Copper |
89.3 |
93.2 |
| Gold |
65.6 |
62.9 |
| Silver |
54.0 |
68.8 |
| |
|
|
| Copper Concentrate Spec. |
28.53 |
31.96 |
| |
|
|
| Payable Metal |
Value |
|
| Copper |
96.50 |
|
| Gold |
90.00 |
|
| Silver |
90.00 |
|
| |
|
|
| Recovery with Payable Metal |
Enriched |
Primary |
| Copper |
0.8617 |
0.8994 |
| Gold |
0.5904 |
0.5661 |
| Silver |
0.4860 |
0.6192 |
Pit Design Parameters.
The calculated NSR value in each block was used
to evaluate an open pit within the resource model. Both Inferred and Indicated blocks were used to create the pit. The original pit was
unconstrained and extended to use all the available data in the model. This pit had to be adjusted to avoid an area of cryogenic geoforms
on the south-west corner of the resource area. Table 11.22 details the parameters used to create these shapes.
| Project Los Azules – S-K 1300 Technical Report Summary | Project No.: 21139-01 | 11-175 |
| Table 11.22: Open Pit Design Parameters. |
| Pit Depth |
Inter Ramp
Slope Angle |
Slope Code |
| Surface to 600m |
42o |
|
| 600m to 800m |
38o |
|
| 800m to 1,000m |
34o |
|
| 1,000 to 1,200m |
32o |
|
| |
|
|
| Overburden |
30o |
|
Figure 11.22 below shows the areas in the leach
and mill pits where the pit slope angles shown in Table 11.22 above are applied.
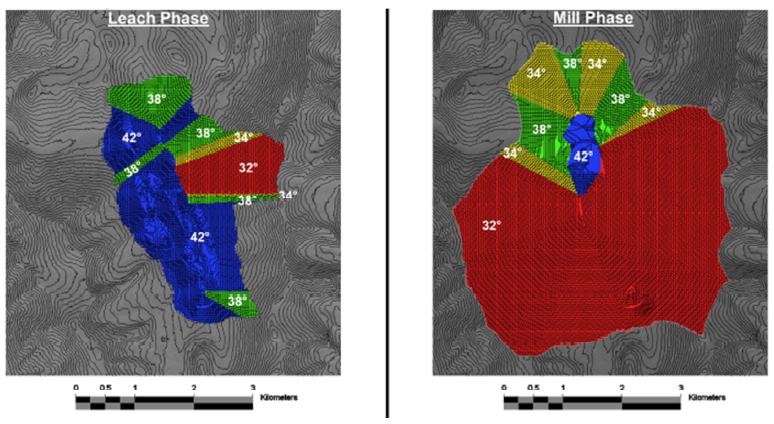
Figure 11.22: Plan View of the Resource Pits
with Slope Angles
Mineral Resource Table
The resource pit and NSR cutoffs detailed above
were used to define an economic MRE as reported in Table 11.23 and Table 11.24. The resources exclude leach zone and overburden material
and includes only Indicated and Inferred blocks.
| Project Los Azules – S-K 1300 Technical Report Summary | Project No.: 21139-01 | 11-176 |
| Table 11.23: Indicated Resources for the Los Azules Project |
| |
MTonnes |
Average Grade |
Contained Metal |
|
In-Situ Copper
Total (%) |
In-Situ Copper
Soluble (%) |
In-Situ Gold
(g/tonne) |
In-Situ Silver
(g/tonne) |
In-Situ Copper Total
Content (Blbs) |
In-Situ Copper
Soluble (Blbs) |
In-Situ Gold
(Moz) |
In-Situ Silver
(Moz) |
| Leach |
944.2 |
0.46 |
0.30 |
- |
- |
9.54 |
6.25 |
- |
- |
| Mill - Supergene |
73.0 |
0.13 |
- |
0.09 |
1.10 |
0.21 |
- |
0.20 |
2.58 |
| Mill - Primary |
218.1 |
0.25 |
- |
0.036 |
1.06 |
1.19 |
- |
0.25 |
7.43 |
| Total Leach |
944.2 |
0.46 |
0.30 |
- |
- |
9.54 |
6.25 |
- |
- |
| Total Mill |
291.1 |
0.22 |
- |
0.049 |
1.07 |
1.40 |
- |
0.46 |
10.01 |
| Table 11.24: Inferred Resources for the Los Azules Project |
| |
MTonnes |
Average Grade |
Contained Metal |
|
In-Situ Copper
Total (%) |
In-Situ Copper
Soluble (%) |
In-Situ Gold
(g/tonne) |
In-Situ Silver
(g/tonne) |
In-Situ Copper
Total Content (Blbs) |
In-Situ Copper
Soluble (Blbs) |
In-Situ Gold
(Moz) |
In-Situ Silver
(Moz) |
| Leach |
695.7 |
0.32 |
0.19 |
- |
- |
4.91 |
2.96 |
- |
- |
| Mill - Supergene |
525.6 |
0.30 |
- |
0.05 |
1.44 |
3.45 |
- |
0.87 |
24.40 |
| Mill - Primary |
3,288.0 |
0.25 |
- |
0.03 |
1.18 |
18.35 |
- |
3.37 |
124.67 |
| Total Leach |
695.7 |
0.32 |
0.19 |
- |
- |
4.91 |
2.96 |
- |
- |
| Total Mill |
3,813.6 |
0.26 |
- |
0.035 |
1.22 |
21.79 |
- |
4.24 |
149.07 |
| Notes: |
| 1. | There is a reasonable prospect of eventual economic extraction of the heap leach resource using sulfuric
acid leaching and SX/EW recover at NSR cutoff of $2.74/t. The supergene and primary material can be treated in a mill with NSR cutoffs
of $5.46 and $5.43/t respectively. NSR values are based on a copper price of $4.00/lb., gold at $1,700/oz., and silver at $20/oz., where
applicable. |
| 2. | Mineral resources, which are not mineral reserves, do not have demonstrated economic viability. The estimate
of mineral resources may be materially affected by environmental, permitting, legal, title, socio-political, marketing, or other relevant
factors. |
| 3. | The quantity and grade of reported Inferred mineral resources in this estimation are uncertain in nature
and there is insufficient exploration to define these Inferred mineral resources as an Indicated or Measured mineral resource; it is expected
that further exploration will result in upgrading some of this material to an Indicated or Measured classification. |
Table 11.25 details the indicated material in
the environmentally sensitive area under the cryogenic geoforms that was downgraded to Inferred in the MRE.
| Table 11.25: Inferred Material under the Cryogenic Geoforms |
| |
MTonnes |
Average Grade |
Contained Metal |
|
In-Situ Copper
Total (%) |
In-Situ Copper
Soluble (%) |
In-Situ Gold
(g/tonne) |
In-Situ Silver
(g/tonne) |
In-Situ Copper
Total Content (Blbs) |
In-Situ Copper
Soluble (Blbs) |
In-Situ Gold
(Moz) |
In-Situ Silver
(Moz) |
| Leach |
- |
- |
- |
- |
- |
- |
- |
- |
- |
| Mill - Supergene |
2.5 |
0.22 |
- |
0.02 |
0.94 |
0.01 |
- |
0.002 |
0.07 |
| Mill - Primary |
79.9 |
0.28 |
- |
0.026 |
1.46 |
0.49 |
- |
0.067 |
3.74 |
| Total Leach |
- |
- |
- |
- |
- |
- |
- |
- |
- |
| Total Mill |
82.3 |
0.28 |
- |
0.026 |
1.44 |
0.51 |
- |
0.069 |
3.82 |
| Project Los Azules – S-K 1300 Technical Report Summary | Project No.: 21139-01 | 11-177 |
Soluble copper was not reported in the 2022 Initial
Assessment (2017 PEA basis) resource statement and is therefore not compared.
The tonnage above cutoff shows an increase of
the tonnes of Inferred and Indicated material in the current model. The current model predicts 19% lower overall copper grades.
The major factors contributing to these differences
are:
| · | The current model treats the high-grade breccia and early mineral porphyry units as separate domains with
relatively small volumes. The estimation considers these lithology domains as statistically different with no sharing of samples between
the high-grade lithologies and the surrounding (lower grade) domains. For the 2017 model, data from all lithologies are combined. As a
result, the 2017 model laterally smears grades outward from the high-grade lithologies while, at the same time, smooths (reduces) the
grades within the high-grade zones. This change in modeling can be expected to increase copper grade above cutoff while reducing tonnes
above cutoff. |
| | | |
| · | The 2017 IA model did not consider the important control on grades provided by the central NNW structure
or the declining lateral grade trend moving away from the structure. As a result, a large, isotropic, circular search was used during
estimation. This type of search can be expected to smooth the observed lateral grade trend. The current model uses an anisotropic search
oriented at N20W and the model validations show that the lateral grade trend is well reproduced. As a result, it is expected that the
2017 model would provide a larger estimate of tonnes above cutoff at a lower grade. |
| | | |
| · | The 2017 IA model contains large lateral extensions of the enriched zone which enhanced the enriched zone
volume. Drilling in 2022 targeted some of these extensions and reduced the lateral volume of the enriched zone. |
| | | |
| · | The tonnage of Indicated resource stated in 2017 was ostensibly based on a 150 m drill spacing. Review
of the extent of the volume of the 2017 Indicated resource shows that it often extends into volumes where the drill spacing is larger
than 150 m. The drill spacing and methodology used in the 2017 IA led to a higher indicated resource tonnage estimate than using the 120
m drill spacing applied in the 2023 estimate. |
| | | |
| · | Drilling performed in 2022 provided additional details on the shape and volume of the enriched zone, adding
confidence to the local modeling of the estimation domains and estimation of grades. |
Cutoff-Grade Sensitivity
The NSR cutoff used to develop the leach pit
was based on total soluble copper plus the added value of 15% of the residual copper in the block. The actual cutoff value was set at
$2.74/t. Figure 11.23 is a grade-tonnage curve showing the NSR values for leachable material in the block model. The NSR value used to
determine the outline of the mill pit was based on total copper and credits for gold and silver. The mill cutoff was set at $5.46/t for
Supergene material and $5.43/t for Primary. Figure 11.24 is a grade-tonnage chart of the NSR value for material destined for the mill.
| Project Los Azules – S-K 1300 Technical Report Summary | Project No.: 21139-01 | 11-178 |
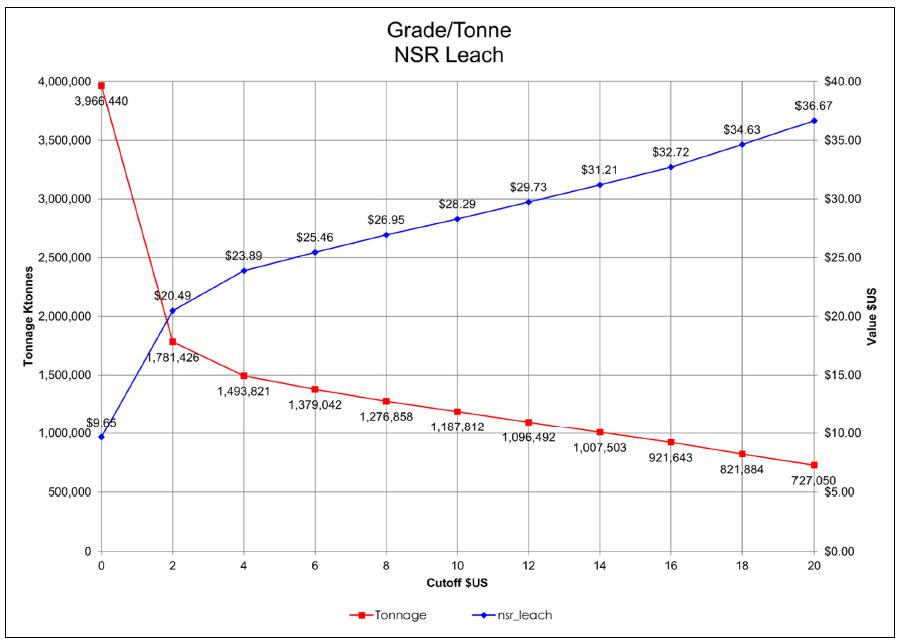
Figure 11.23: Grade / Tonnage Curves for Leach
NSR
| Project Los Azules – S-K 1300 Technical Report Summary | Project No.: 21139-01 | 11-179 |
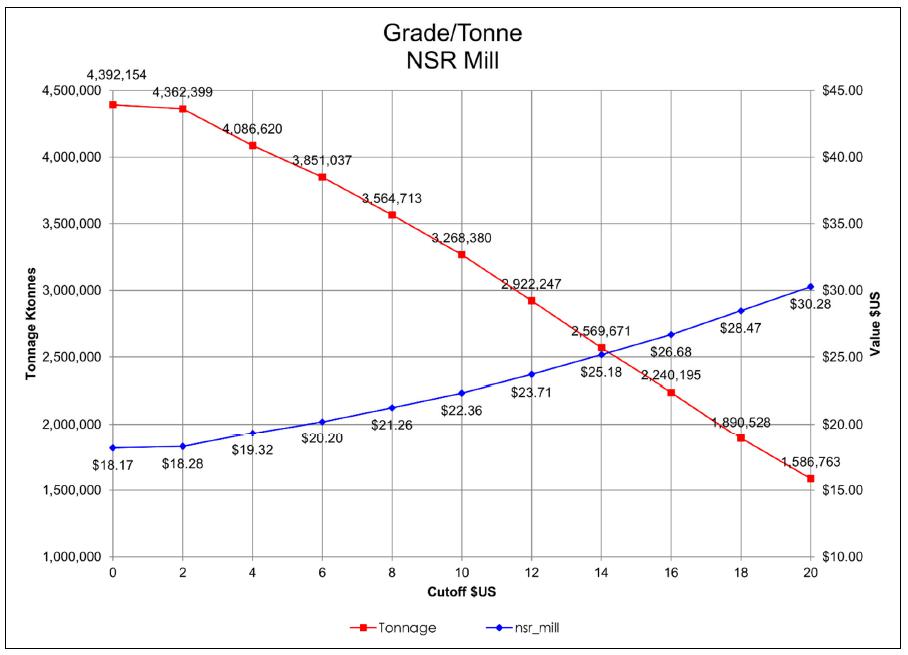
Figure 11.24: Grade / Tonnage Curves for Mill
NSR
| 11.14 | adequacy STATEMENT on section 11 |
The QP believes that the EDA, mineralogical wireframing,
grade capping, and grade estimation methodologies used in the creation of this MRE followed sound industrial standards and conforms to
the requirements of an S-K 1300 Technical Report Summary. The outlined resource has shown itself to be quite robust with recent added
drilling having little effect on the tonnes and grade but improving confidence. Major factors affecting the MRE include the decision to
not declare any Measured resource until the lithologic boundaries are better understood and the downgrading of resource under the identified
cryogenic geoforms to Inferred for potential environmental concerns.
11.14.1 Uncertainty Factors
In the opinion of the QP, risk factors that may affect the reliability
of, or confidence in, the mineral resource estimate include, but are not limited to:
| · | Changes in metal prices and/or international currency exchange rates. |
| | | |
| · | Changes in the interpretations of continuity and geometry of the mineralized zones. |
| Project Los Azules – S-K 1300 Technical Report Summary | Project No.: 21139-01 | 11-180 |
| · | Changes in estimation interpretations and methodologies used based on additional data as closer spaced drilling results become available. |
| | | |
| · | Changes in parameter assumptions used for geotechnical, mining methodology and recovery, processing, and metallurgical recoveries. |
| | | |
| · | Changes in operating cost assumptions including labor costs. |
11.14.2 QP Statement
The QP believes that the EDA, mineralogical wireframing, grade capping,
and grade estimation methodologies used in the creation of this MRE followed sound industrial standards and conforms to the requirements
of an S-K 1300 Technical Report Summary. The outlined resource has shown itself to be quite robust with recent drilling being added having
little effect on the tonnes and grade but improving confidence. Major factors affecting the MRE include the decision to not declare any
Measured resource until the lithologic boundaries are better understood, and the downgrading of resource under the identified cryogenic
geoforms to Inferred for potential environmental concerns.
| Project Los Azules – S-K 1300 Technical Report Summary | Project No.: 21139-01 | 11-181 |
| 12.0 | mineral reserve estimates |
No Mineral Reserves are estimated in this Initial
Assessment.
| Project Los Azules – S-K 1300 Technical Report Summary | Project No.: 21139-01 | 12-182 |
This section discusses aspects of the mine that
excludes Inferred Resources. Inferred Resources are considered geologically too speculative to have the economic considerations applied
to them that would enable them to be categorized as mineral reserves as part of further detailed evaluation at the prefeasibility or feasibility
level.
This 2023 S-K 1300 IA report for Los Azules is
based on a revised and updated geological block model with an effective date of December 2022. The characteristics of the block model
and the mineral resource estimation process that was followed to build it are described in detail in Section 11.
In many respects, the Los Azules Deposit is a
classic Andean-style porphyry copper deposit. The surface overburden cover lies on top of a barren leached zone, which in turn overlies
a zone of secondary supergene enrichment of variable copper grades and thickness, and below it the Primary or Hypogene mineralization
extends to at least 1,000 m below the present surface. The Los Azules hydrothermal alteration system is at least 5 km long and 4 km wide
and is elongated in an NNW direction along a major structural corridor.
The mineralized system disappears below volcanic
cover to the north; therefore, the ultimate extent is unknown. Los Azules has been geologically mapped over many years. The entire area
comprising the Los Azules Deposit is covered by thick talus or valley fill, so none of the mineralized materials are exposed in outcrop,
although some near-surface exposures have been exposed in trenching at the crest of the La Ballena Ridge that defines the long axis of
the deposit. Consequently, the interpretation of the structures and intrusive bodies is based almost entirely upon drill hole data.
An altered zone surrounds the Los Azules Deposit,
which is approximately 4 km long by 2.5 km wide. The limits of the mineralization along strike and at depth have not been entirely constrained
by drilling. Many of the holes in the core resource area have been terminated in mineralization.
Hypogene minerals include chalcopyrite and to
a lesser extent, bornite. However, chalcopyrite is the most important copper mineral in the upper levels of the deposit, while Hypogene
bornite appears at deeper levels together with chalcopyrite. Copper sulfides rarely exceed 2% to 3% of rock volume. Intervals of 0.1%
to 0.35% copper are common in Hypogene mineralization.
Circulation of meteoric ground water leached the
primary sulfides (pyrite and chalcopyrite) from the host rocks over the past several million years, and the leached copper was redeposited
below the water table in a sub-horizontal zone, or blanket, of Supergene enrichment as secondary chalcocite and covellite. The intensity
of secondary enrichment diminishes with depth, except along major structures where it may extend to great depth.
Starting at the boundary between the barren leached
zone and the Supergene mineralization, secondary enrichment mineralization gradually transitions to predominantly Hypogene mineralization
at depth. Figure 13.1 and Figure 13.2 show a long section and cross section, respectively, through a representative portion of the orebody
along with copper grade zones and pit phase limits.
| Project Los Azules – S-K 1300 Technical Report Summary | Project No.: 21139-01 | 13-183 |
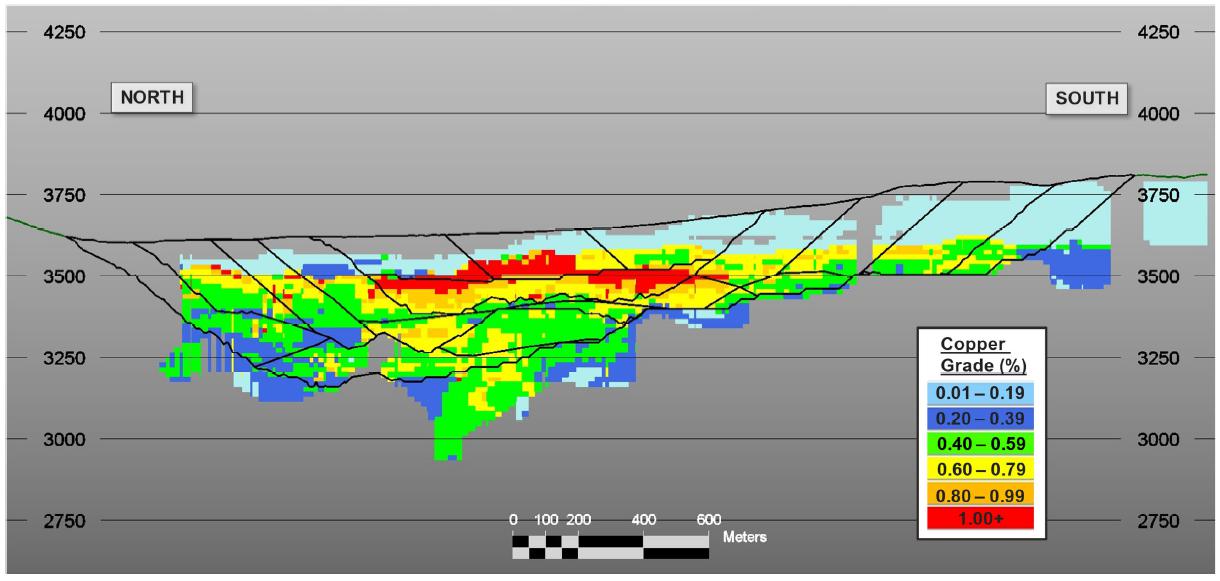
Figure 13.1: Long Section through the Los Azules
Mineralization Looking East – with Mining Phase Outlines
| Project Los Azules – S-K 1300 Technical Report Summary | Project No.: 21139-01 | 13-184 |
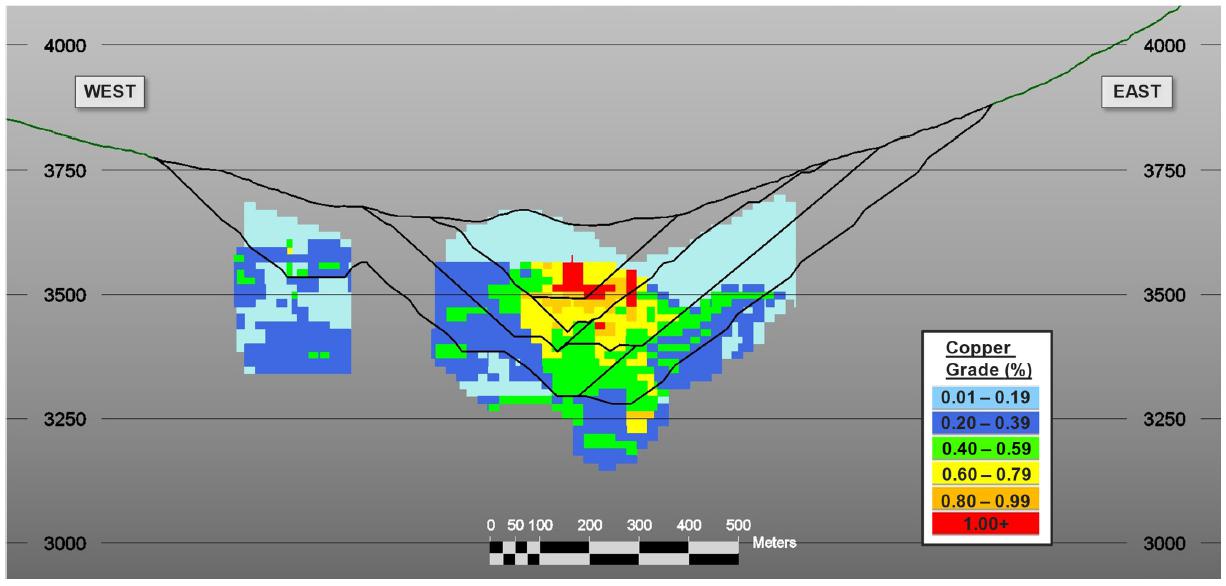
Figure 13.2: Cross Section through the Los
Azules Mineralization Looking North West– with Mining Phase Outlines
| Project Los Azules – S-K 1300 Technical Report Summary | Project No.: 21139-01 | 13-185 |
Los Azules can be described as a typical copper
porphyry deposit, with large tonnages of disseminated copper minerals with the usual succession of leached, supergene, and hypogene mineralization.
Mineralized material is present from relatively
shallow elevations and therefore large-scale, conventional, open pit mining methods are considered the most appropriate method to mine
the Los Azules mineralization. This said, considerable effort was taken to evaluate mining methods, and specifically equipment, which
would lead to an operation with a reduced carbon footprint. Work related to decarbonization of the mine has included trade-off studies
between conveyors and trucks, in-pit crushing and conveyor (IPCC) systems, battery electric trucking, and trolley-assist truck haulage
systems.
Although most, if not all, of these technologies
have merit and could be incorporated into future mine designs, for the purpose of this S-K 1300, electrification of the mine to a reasonable
practical extent was the goal. The mine plan therefore incorporates a combination of electric-hydraulic front shovels and large mine haul
trucks that will be equipped with pantographs from the start of operations to allow for the early use of trolley-assist infrastructure.
Several sections of the pit and external haul roads have been designed to be equipped with trolley-assist electrical infrastructure.
| 13.2 | Economic Pit Limit Evaluations |
The ultimate pit limit and intermediate pit shells
were developed with the use of Geovia Whittle™ pit optimization software. Within this software, the pseudo-flow pit optimization
algorithm was used to develop the incremental pit shells and associated shell values. The Whittle software also provided guidance for
the selection of the optimal mining phases.
To obtain the ultimate pit limit and intermediate
pit shells, the block model was first updated to include the net smelter return (NSR), surface restrictions / constraints, and pit slope
geotechnical guidance. The block model was then imported into Whittle™ pit optimization software, with mining parameters and production
rates added within the software. All these subjects are discussed in the following subsections.
A series of economic pit optimizations were evaluated
to define pushbacks and the ultimate pit. The pit-optimization presented in this section was created for a mine that produces copper cathode
using a heap-leach process (the base case pit optimization). The Los Azules Deposit also contains mineralized material that may be economic
for producing a milled copper concentrate product, but this material was not considered for base case pit optimization.
Net Smelter Return
NSR
is the revenue estimated to be earned when a tonne of mineralized material is mined and processed to produce a saleable product. NSR values
were calculated for the Los Azules Project on a US$/t basis using Python-based scripts. The NSR calculations for Los Azules took the
following parameters into consideration.
| · | Metal Prices |
| · | Process / Leaching Recoveries |
| · | Selling Costs, such as Insurance and Marketing |
| · | Payability Rates |
| · | Refining Charges (where applicable) |
| Project Los Azules – S-K 1300 Technical Report Summary | Project No.: 21139-01 | 13-186 |
| · | Treatment Charges (where applicable) |
| · | Freight Costs (only for saleable products) |
Refining and treatment charges were only applied
to material processed to produce a concentrate. NSR values were calculated for producing copper cathode and copper concentrate (with gold
and silver credits). The NSR for concentrate production was calculated to identify the amount of mineralized material that could be processed
in the future to produce a concentrate. Revenue from processing this mineralized material and producing a concentrate was not considered
during the pit optimization for the IA base mine plan as this plan considers the leachable resource tonnage.
The following expenses and parameters are not
incorporated into the NSR calculation.
| · | Capital Expenditures |
| · | General and Administrative Costs |
| · | Ore Loss and Dilution |
| · | Cost of Mining mineralized material or Waste |
| · | Mineral Processing Costs |
| · | Interest Expenses |
| · | Taxes |
There are two sets of NSR calculations coded into
the block model. One for the leach process and one for the mill process.
| 13.2.1.1 | Leach Process NSR Calculations |
Relevant inputs for the heap-leach NSR calculation
are presented in Table 13.1. Based on the provided information, 100% of the soluble copper was recoverable with the heap-leach process,
in addition to 15% of the non-soluble copper grade (total copper grade minus the soluble copper grade). These recovery rates were provided
by Samuel Engineering and are discussed in Section 10. The remainder of the inputs were developed by the Stantec Consulting International
Ltd. project team.
| Table 13.1: Heap-Leach Net Smelter Return Inputs for the IA Mine Plan |
| Parameter |
Values |
Units |
| Copper Selling Price |
3.75 |
US$/lbs. |
| Copper Selling Cost |
0.47 |
US$/lbs. |
| Copper Selling Cost (Producers Brokerage Fee) |
0.02 |
US$/lbs. |
| Soluble Copper Recovery |
100.00 |
% |
| Residual Copper Recovery* |
15.00 |
% |
| Freight Costs |
150.00 |
US$/dmt |
| *Applied to the difference between total copper and soluble copper grades |
| Project Los Azules – S-K 1300 Technical Report Summary | Project No.: 21139-01 | 13-187 |
Surface Restrictions
The economic pit optimization for Los Azules was
conducted while honoring surface restrictions with the key constraint being areas identified as cryogenic geoforms (zones of subsurface
frozen water). The extents of the geoforms were provided in DXF format by McEwen Mining and was obtained from the Instituto Argentino
de Nivología, Glaciología (Alday, 2022). No disturbance was permitted within 50 m (measured horizontally) of the geoforms.
Geoforms in the vicinity of the deposit were mostly located on the valley slopes, as shown in Figure 13.3.
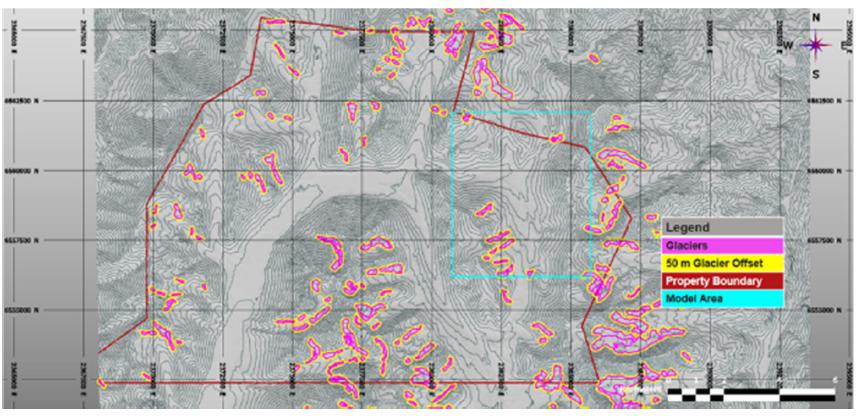
Figure 13.3: Cryogenic Landform Locations
on the Los Azules Property, with 50 m Topography Contours
Pit Geotechnical Stability
Based on available information and ongoing iterative
changes to pit plans as pit planning advances, Stantec Consulting International Ltd. adopted the following approach to the S-K 1300 geotechnical
pit stability assessment.
| · | Characterize overburden and rock mass conditions using existing data. |
| · | Conduct limit equilibrium stability analyses based on rock mass parameters. |
| · | Seepage modeling was used to inform the phreatic surface behind the pit wall, based on assumed boundary
conditions which includes allowing for pit dewatering. |
| · | Assessment of different pit slope heights to support interim pit phase design and allow exploitation using
steeper initial pit slopes, as appropriate. |
| · | Review of different slope angles to build relationships between factors of safety (FOS), slope angle,
and slope height. |
| · | Use the results of the assessment to create slope angle guidance to inform pit design/planning. |
Investigations to date have focused on defining
the resource, involving generally vertical holes without orientation of core, borehole televiewer logging or triple tube drilling to facilitate
core recovery. Some resource holes to date have included assessment of rock quality designation (RQD) and point load testing. Select holes
have recorded assessment of rock mass rating (RMR) and inputs to RMR. At the time of doing the pit optimization and designs, no geotechnically
focused drilling had been completed (geotechnical holes are being drilled during the current drilling campaign and this information will
be included in future studies). As there are no boreholes with discontinuity information and existing resource holes are clustered near
the center of the pit, Stantec Consulting International Ltd. has not created geotechnical domains, but has applied the analyses across
the entire pit; this approach was informed by review of rock quality data and strength parameters across the pit area. Therefore, there
is no structural information for the pit wall assessment at this stage, which limits the stability assessment to rock mass controlled
rather than structurally controlled (kinematic) stability.
| Project Los Azules – S-K 1300 Technical Report Summary | Project No.: 21139-01 | 13-188 |
This is a key limitation of the study, especially
in review of existing pit examples including Los Pelambres (Eggers, 2016), but is not uncommon for S-K 1300 level studies, where evaluation
for the early stages of pit viability mining can be based on judgment or experience in similar environments (Read & Stacey, 2009).
The results of a Limit Equilibrium Analyses undertaken
by Stantec Consulting International Ltd. are presented in Figure 13.4, where the green field shows the allowable factors of safety.
| Anticipated Factor of Safety - Based on Slope Face Angle and Pit Depth |
| Angle of Slope Face |
Depth of Pit (m) |
| 400 |
500 |
600 |
800 |
1000 |
1200 |
| 30° |
- |
- |
- |
1.46 |
- |
1.26 |
| 32° |
- |
- |
1.53 |
1.38 |
- |
1.20 |
| 34° |
- |
- |
1.46 |
1.32 |
1.23 |
1.14 |
| 36° |
- |
- |
1.40 |
1.26 |
1.16 |
1.09 |
| 38° |
- |
1.43 |
1.34 |
1.20 |
- |
1.04 |
| 40° |
1.50 |
1.37 |
1.28 |
1.14 |
- |
0.98 |
| 42° |
1.44 |
1.31 |
1.22 |
- |
- |
- |
Figure 13.4: Factor of Safety with Slope Angle
and Pit Depth
Based on the 2022 geotechnical characterization,
assumptions, and analyses, the recommendations for the Los Azules S-K 1300 overall slope angles are presented in Table 13.2.
| Project Los Azules – S-K 1300 Technical Report Summary | Project No.: 21139-01 | 13-189 |
| Table 13.2: Overall Suggested IA Pit Slope Angles, by Overall Pit Depth |
| Total Pit depths |
Angle of slope in rock |
| up to 600 m |
42° |
| 600m to 800 m |
38° |
| 800m to 1000 m |
34° |
| 1000m to 1200 m |
32° |
| Notes: |
| |
| Pits 800 m to 1200 m are very deep for the rock quality indicated by the available data; there is little empirical experience in this range and the slope angles remain uncertain at this stage. |
| |
| Seismic analysis has not yet been undertaken. |
| |
| Hydrogeology is based on assumptions and dewatering is likely required for the angles given. |
| |
| Pit depths allowed for 30 m overburden (OB); 2 x 15 m bench heights at 34 degrees BFA, 8 m catch bench within OB, 15 m catch bench between OB and rock. Giving inter-ramp angle of 30 degrees. Overburden depth will vary which may affect the combined rock/overburden overall slope angles. |
| |
| Failure surfaces completely within the blast damaged zone are not included; Stantec Consulting International Ltd. assumes bench design will account for managing bench scale stability. |
| |
| Pit slope angles are not incremental, i.e., a 700 m pit slope requires the entire slope to be at 38° degrees, not stepped down. |
The pit slope angle guidance for the Los Azules
pit optimization was based on the overall height of the slope and the overall wall angle. The slope angles provided in Table 13.2 were
applied to the entire slope, not incrementally as the pits progressed deeper. The pit optimization was refined through multiple iterations,
where each slope angle was applied to certain parts of the pit wall. This refining process was repeated to ensure that the geotechnical
guidance was applied accurately.
The overall slope angles presented above only
apply to pit walls excavated through rock. An inter-ramp angle of 30° was assumed for pit slopes excavated through overburden. A plan
of the model slope zones is presented in Figure 13.5. Slope zones correspond to overall slopes angles presented in Table 13.2. Slope zones
2 and 3 were coded vertically through the entire block model. Slope zone 1 (the overburden zone) has an irregular shape and was coded
over zones 2 and 3 where present.
| Project Los Azules – S-K 1300 Technical Report Summary | Project No.: 21139-01 | 13-190 |
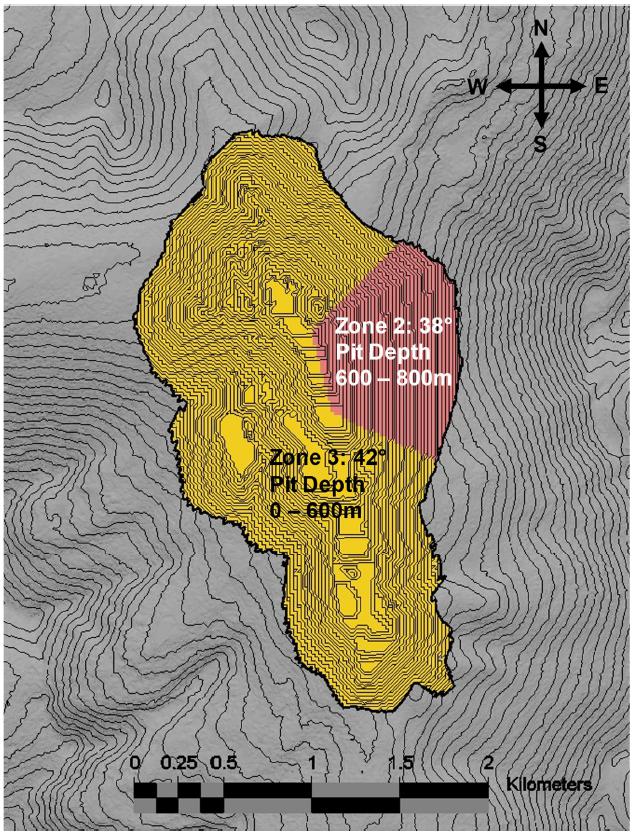
Note:
Zone 1 is overburden and used where present in the block model.
Figure 13.5: Slope Zones for ultimate selected
pit shell
It is assumed that the future bench design guidance
will account for managing bench scale stability, including potential failure surfaces completely within the blast damaged zone. Design
guidance for benches has not been included at this stage.
Mining Parameters and Production Rates
A pit optimization scenario at a production rate
of 175 ktpa of copper cathode was carried forward. This scenario was selected based on high-level trade-off studies that were conducted
and identified an optimal copper cathode production of approximately 175 ktpa. Production rates below 175 ktpa had difficulty supporting
the capital costs required for fixed site costs (power, access, and services). Production rates above 175 ktpa of copper cathode are hard
to sustain throughout the mine life and does not justify increased crushing, stacking, and SX/EW capacity for only a few years. Input
parameters are presented in Table 13.3.
| Project Los Azules – S-K 1300 Technical Report Summary | Project No.: 21139-01 | 13-191 |
| Table 13.3: Pit Optimization Input Parameters |
| Parameter |
Value |
Units |
| Processing Cost |
3.48 |
US$/t |
| Dilution Rate |
5 |
% |
| Mining Recovery Rate |
95 |
% |
| Default In-Situ Density¹ |
2.53 |
t/m3 |
| Stockpile Reclaim Cost |
1.00 |
US$/t |
| Stockpile Grade Recovery Rate |
90 |
% |
| Maximum Stockpile Size |
100 |
Mt |
| Bench Height |
15 |
m |
| Maximum Vertical Advance Rate |
12 |
Benches Per Year |
| Pre-Stripping Rate |
50 |
Mt/a |
| Pre-Stripping Period Length |
1 |
Year |
| Discount rate |
8 |
% Per Year |
| Mining Cost² |
1.90 |
US$/t |
| Maximum Mining Rate |
160 |
Mt/a |
| Maximum mineralized material Stacking Rate |
100 |
Mt/a |
¹Only applied to blocks without a density value defined
²Includes General & Administrative Costs |
The stockpile rehandle costs were then included
in equipment productivity calculations to derive the total mining cost.
Pit Optimization Pits and Phase Selection
The pit optimization produces a series of nested
pit shells at revenue factors in 0.01 increments and then in 0.02 increments. Revenue factors are incremental multipliers of the metal
selling prices. For example, a revenue factor of 0.5 represents the pit shell generated at a metal value of 50% of the base case prices.
It should also be noted that the pit shells generated by this process are not designs as they do not consider access, catch benches, safety
berms and other features incorporated into the final pit design. Pit phasing increases the estimated discounted pre-capital indicative
value during the pit optimization process by mining mineralized material earlier and delaying some waste mining.
Pit shells were generated for revenue factors
0 – 1.00 with slope codes designed to support pit shells up to 800 m deep. The first revenue factor to yield a pit shell was 0.17
because it was only at this revenue factor that the pit shell was able to overcome the early-stage costs of mining the non-mineralized
waste cover. As discussed in the resource geology section, there is a flat-lying layer of non-mineralized material in the valley bottom
that is approximately 75 m thick and acts like a fixed mining cost that needs to be overcome to create the first economic pit shell that
releases mineralized material.
| Project Los Azules – S-K 1300 Technical Report Summary | Project No.: 21139-01 | 13-192 |
The optimization analyses produced shells up to
a revenue factor of 1.04, as defined.
The pit-by-pit graph shown in Figure 13.6 summarizes
the results of the mineralized material and waste tonnage of each pit generated, along with indicative discounted value estimates. It
is important to note that the values presented should be viewed as relative comparisons to one another and do not represent net
present values for the overall project. These indicative value estimates are discounted at a rate of 8% per year and do not include capital,
royalties, taxes, or any other costs that have not been discussed in this section of the report. Indicative value estimates are created
with input operating costs that are based on the best available information. True operating costs were calculated once a full detailed
mine plan was developed. Variance between the cost inputs for optimization and final mining costs following mine design and schedule are
to be expected.
| Project Los Azules – S-K 1300 Technical Report Summary | Project No.: 21139-01 | 13-193 |
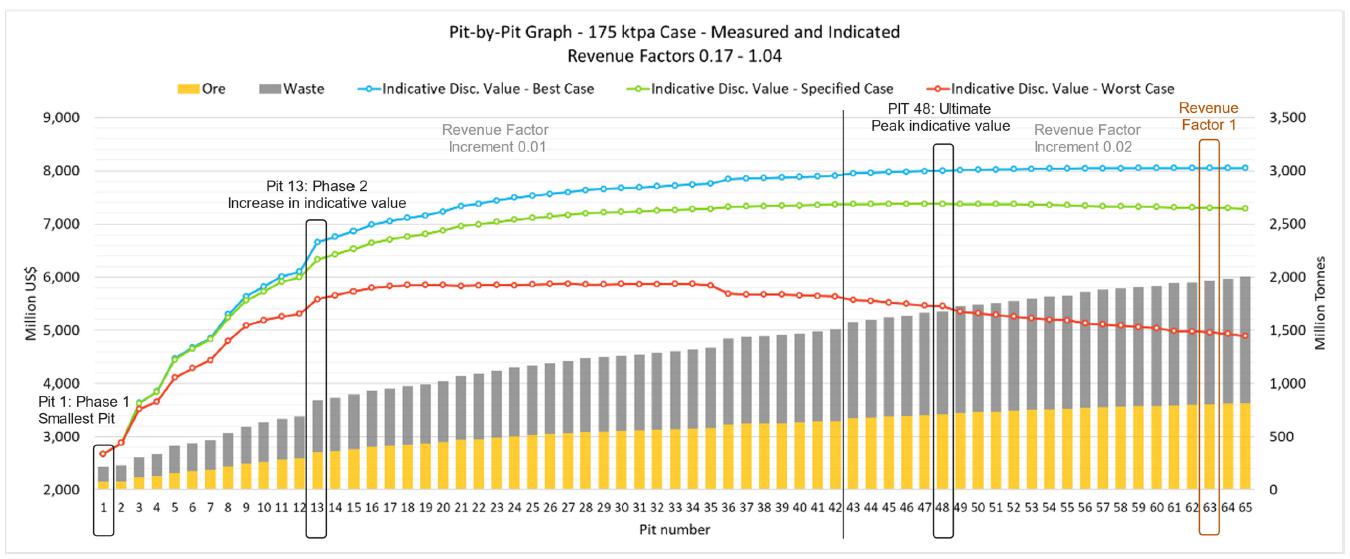
Figure 13.6: Pit-by-Pit graph Economic Pit
Optimization for the 175 ktpa production case
| Project Los Azules – S-K 1300 Technical Report Summary | Project No.: 21139-01 | 13-194 |
It is important to note that these values are
indicative estimates calculated during the pit optimization to be used to guide selection of pit limits and phasing. The values cannot
be construed as net present value estimates for the overall Los Azules Project. They do not consider actual capital requirements or development
timelines and are estimated from coarse mining schedules with simplified inputs.
| 13.3 | Mining Phases and Pit Design |
The pit shells selected during the pit optimization
process were used as the basis for the pit design. The pit shells follow the geotechnical guidance for overall slope angles but do not
have detailed bench, access, and ramp designs. Given the scale of the pit, it was assumed that the pit shell inter-ramp slope angles could
be steepened to accommodate highwall ramps while still following the overall slope angle guidance. Many areas in the selected pit shells
are mined down to a V-shaped point along the bottom of the pit since the optimization process is based on cone-shaped pits. Mining down
to a point is impossible in practice given the need for equipment access, which is why Stantec Consulting International Ltd. adopted a
minimum mining width of approximately 120 m for final pit benches. Interim pit shell phases were not truncated to simplify scheduling
for the S-K 1300. The small variance in tonnage between pit phases does not materially influence the schedule.
Stantec Consulting International Ltd. determined
that the material quantities in the selected interim pit shells are representative for mine scheduling at a S-K 1300 level. A more refined
definition of the phased quantities should be addressed at a more detailed level of study. Overall mined quantities by resource classification
are shown in Table 13.4. Quantities assume mineralized material loss equals dilution and are based on using a leaching scenario NSR cutoff
of $3.48/t.
| Project Los Azules – S-K 1300 Technical Report Summary | Project No.: 21139-01 | 13-195 |
| Table 13.4: In-situ Pit Quantities by Resource Classification. |
| Resource Classification |
Material/Grade Item |
Value |
Units |
| Measured |
Leachable Material |
- |
Mt |
| Copper Grade |
- |
% |
| Soluble Copper Grade |
- |
% |
| Recoverable Copper |
- |
Mt |
| Leach NSR |
- |
US$/t |
| Indicated |
Leachable Material |
702.3 |
Mt |
| Copper Grade |
0.52 |
% |
| Soluble Copper Grade |
0.36 |
% |
| Recoverable Copper |
2.7 |
Mt |
| Leach NSR |
29.24 |
US$/t |
| Total |
Leachable Material |
702.3 |
Mt |
| Copper Grade |
0.52 |
% |
| Soluble Copper Grade |
0.36 |
% |
| Recoverable Copper |
2.7 |
Mt |
| Leach NSR |
29.24 |
US$/t |
| Waste |
965.4 |
Mt |
| Stripping Ratio |
1.37 |
Waste t/Leachable material t |
Pre- and post-mining plan views of the ultimate
pit shell are shown in Figure 13.7 and Figure 13.8, respectively. The selected pit is approximately 3.4 km long and 1.8 km wide (measured
in plan). The highest point in the pit is at an elevation of 3,895 m and the lowest point is at 3,160 m. The maximum wall height is located
on the northeast side of the pit and is approximately 650 m high.
| Project Los Azules – S-K 1300 Technical Report Summary | Project No.: 21139-01 | 13-196 |

Figure 13.7:
Pit Area Prior to Mining, with 50 m Topography Contours
| Project Los Azules – S-K 1300 Technical Report Summary | Project No.: 21139-01 | 13-197 |
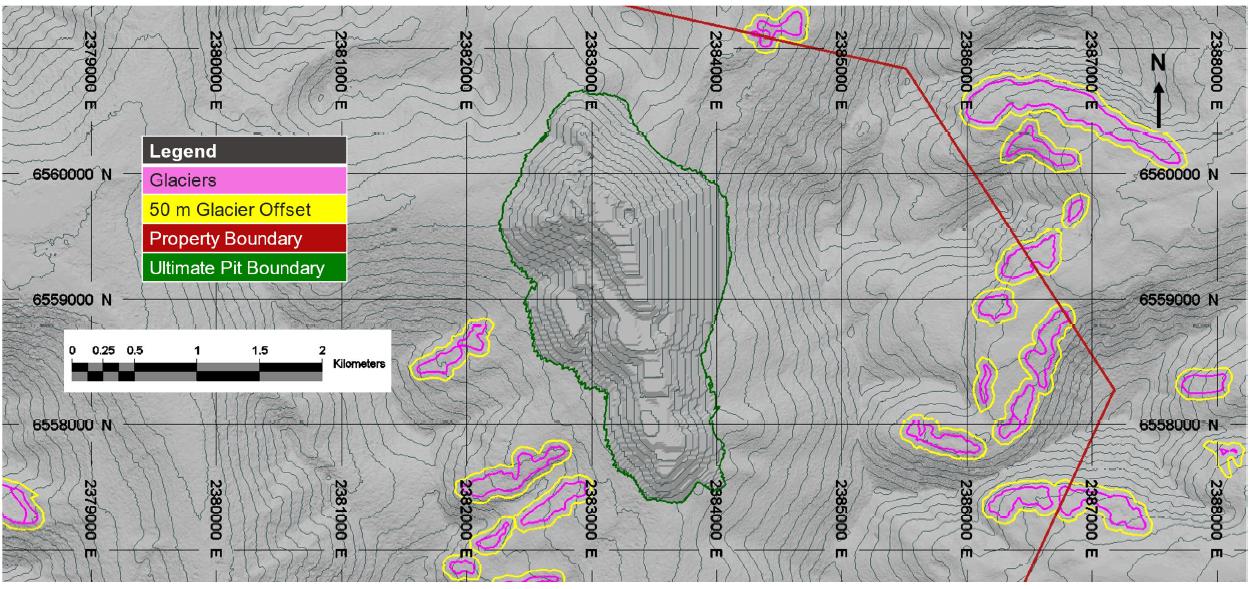
Figure 13.8: Largest Selected Leach Only Pit,
with 50 m Topography Contours
| Project Los Azules – S-K 1300 Technical Report Summary | Project No.: 21139-01 | 13-198 |
Phasing Plan
The phase 1 pit is the smallest pit shell generated
during the pit optimization (revenue factor 0.17.) It is subdivided into four operating areas, phases 1A1, 1A2, 1A3, and 1B, that allow
for early access to mineralized material and deferral of waste stripping. Phase 1A1 is designed to facilitate early mineralized material
access with minimal waste stripping.
Phase 2 is split into three major sub-phases with
minor subphases, for a total of 9 sub-phases. The first major sub-phase (Sub-phase 2A) is located around Phase 1. Sub-phase 2A is further
split into four minor phases 2A1, 2A2, 2A3, 2A4. These minor phases surround Phase 1 while meeting the minimum mining width of 120 m.
Due to the elongated nature of the pit shell shape, the northern portion of the Phase 2 is split into sub-phase 2B and the southern portion
is split into sub-phase 2C. Sub-phase 2B is further divided into three minor phases while sub-phase 2C is divided into two minor phases.
The division of phase 2 is to facilitate the recovery economical material while deferring uneconomical material.
Phase 3 pushes the pit to the ultimate wall and
is split into four subphases, 3A1, 3A2, 3A3, and 3A4 representing the southern, western, northern, and eastern wall respectively. Sub-phases
are divided with a strategy to target the southern and western portion first northern and eastern portion of phase 3 trailing behind.
The Southern portion (3A1) has highest grade material at 0.32% of phase 3 while the western (3A2) portion is the lowest strip area at
in phase 3 was a 1.0 strip ratio.
Plan view and cross sections of deposit and phases
are presented in Figure 13.9 to Figure 13.12. Note that NSR values are only shown for blocks that are classified as a mineral resource,
and with NSR values greater than the processing cost ($3.48/t). Table 13.5 presents the pit quantities by phase for the 175 ktpa case.
| Project Los Azules – S-K 1300 Technical Report Summary | Project No.: 21139-01 | 13-199 |

Figure 13.9: Cross Section Plan
| Project Los Azules – S-K 1300 Technical Report Summary | Project No.: 21139-01 | 13-200 |

Figure 13.10: Cross Section 1 with Pit Phasing
and Leach NSR Values
| Project Los Azules – S-K 1300 Technical Report Summary | Project No.: 21139-01 | 13-201 |
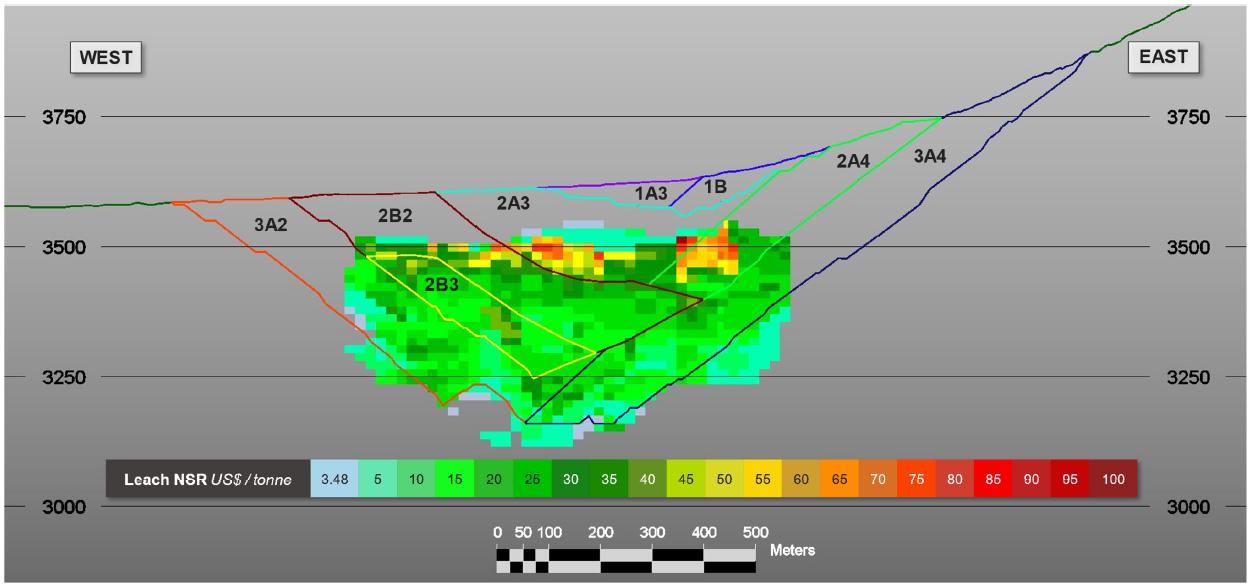
Figure 13.11: Cross Section 2 with Pit Phasing
and Leach NSR Values
| Project Los Azules – S-K 1300 Technical Report Summary | Project No.: 21139-01 | 13-202 |
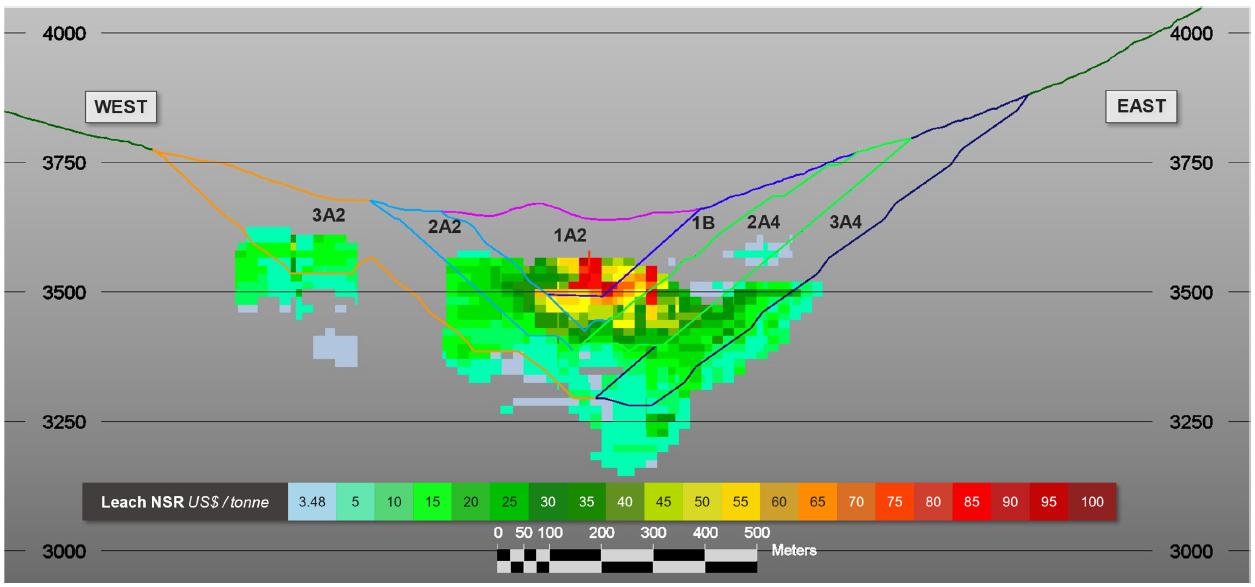
Figure 13.12: Cross Section 3 with Pit Phasing
and Leach NSR Values
| Project Los Azules – S-K 1300 Technical Report Summary | Project No.: 21139-01 | 13-203 |
| Table 13.5: Pit Quantities by Phase |
| |
Waste Material |
Leachable Material |
| Mining Phase |
Total |
Strip Ratio |
Waste |
Potential
Mill
Material1 |
Tonnage |
Copper
Grade |
Soluble
Copper
Grade |
Gold
Grade |
Silver
Grade |
NSR |
| - |
Mt |
(Waste t/Leach t) |
Mt |
Mt |
Mt |
% |
% |
g/t |
g/t |
US$/t |
| 1A1 |
38.5 |
4.2 |
30.8 |
0.4 |
7.4 |
0.67 |
0.59 |
0.06 |
1.21 |
47.41 |
| 1A2 |
46.6 |
2.4 |
29.5 |
3.6 |
13.6 |
0.78 |
0.68 |
0.07 |
1.44 |
55.22 |
| 1A3 |
37.0 |
2.6 |
24.3 |
2.6 |
10.2 |
0.65 |
0.55 |
0.07 |
1.66 |
44.68 |
| 1B |
89.3 |
1.1 |
43.7 |
3.6 |
42.0 |
0.95 |
0.78 |
0.08 |
1.50 |
63.20 |
| 2A1 |
55.6 |
3.6 |
43.6 |
0.1 |
12.0 |
0.69 |
0.58 |
0.06 |
1.04 |
46.83 |
| 2A2 |
65.2 |
0.6 |
25.0 |
0.3 |
39.9 |
0.47 |
0.35 |
0.04 |
1.05 |
28.45 |
| 2A3 |
93.8 |
0.8 |
39.0 |
3.7 |
51.0 |
0.58 |
0.43 |
0.05 |
1.44 |
34.35 |
| 2A4 |
161.8 |
1.5 |
92.9 |
4.5 |
64.4 |
0.61 |
0.45 |
0.06 |
1.34 |
36.01 |
| 2B1 |
12.9 |
- |
12.9 |
- |
- |
- |
- |
- |
- |
- |
| 2B2 |
87.0 |
0.7 |
31.4 |
4.4 |
51.2 |
0.53 |
0.38 |
0.05 |
1.56 |
30.34 |
| 2B3 |
51.3 |
0.6 |
19.3 |
0.5 |
31.5 |
0.55 |
0.38 |
0.05 |
1.79 |
30.89 |
| 2C1 |
59.3 |
3.6 |
43.1 |
3.1 |
13.0 |
0.57 |
0.48 |
0.07 |
0.96 |
38.84 |
| 2C2 |
51.7 |
3.2 |
31.9 |
7.3 |
12.4 |
0.61 |
0.50 |
0.09 |
1.13 |
40.24 |
| 3A1 |
119.4 |
1.5 |
66.1 |
6.1 |
47.2 |
0.46 |
0.32 |
0.06 |
0.97 |
25.54 |
| 3A2 |
175.3 |
1.0 |
77.3 |
11.0 |
87.0 |
0.35 |
0.20 |
0.04 |
1.11 |
15.97 |
| 3A3 |
295.2 |
1.4 |
165.7 |
4.8 |
124.7 |
0.41 |
0.25 |
0.04 |
1.28 |
20.01 |
| 3A4 |
227.8 |
1.4 |
130.2 |
2.7 |
94.9 |
0.45 |
0.25 |
0.06 |
1.59 |
20.41 |
| Total |
1,667.7 |
1.4 |
906.8 |
58.6 |
702.3 |
0.52 |
0.36 |
0.05 |
1.33 |
29.24 |
1Average in situ grade of
potential mill material: Total Copper (0.106%), Gold (0.079 g/t), Silver (0.955 g/t). Determined with mill NSR cutoff values of $5.46/t
for supergene material, and $5.43/t for primary material on Measured and Indicated material classification. Due to rounding, values may
not sum.
| Project Los Azules – S-K 1300 Technical Report Summary | Project No.: 21139-01 | 13-204 |
| 13.4 | LOS AZULES MINE PRODUCTION SCHEDULE |
Production Schedule
The Los Azules mine schedule was created using
the Hexagon MinePlan Schedule Optimizer. The pit phases described in Section 13.3 were split into 15 m benches and then imported into
the schedule optimizer. The schedule was set up to maximize NSR while allowing for access. Other constraints are listed below.
| · | A maximum of 12 benches per phase per year (VAR limit). |
| · | Maximum crusher throughput of 18 Mt/yr (year -1). |
| · | Maximum crusher throughput of 25 Mt/yr (year 1 to 2). |
| · | Maximum crusher throughput of 30-35 Mt/yr (year 3 to 6). |
| · | Maximum crusher throughput of 50 Mt/yr (year 7 to end of mine life). |
| · | A recoverable copper limit of 175 kt/yr. |
A stockpiling strategy will be implemented based
on mining capacity, crusher capacity, and copper cathode production. In years where direct feed requires higher grade material to produce
175 kt, lower grade material is stockpiled to release higher grade material. Stockpiled material remaining at the end of mining will be
reclaimed after mining has been completed in the pit.
The mine schedule does not include a mill processing
stream, as additional work is required to determine the feasibility of a mill. Potentially millable material is segregated in the mine
rock storage area to keep it available should a mill be developed in the future.
Based on the mining phase sequence and the constraints
listed above, the 175 kt cathode production schedule is shown in Figure 13.13.
| Project Los Azules – S-K 1300 Technical Report Summary | Project No.: 21139-01 | 13-205 |

1Mill Supergene Stk and Mill Primary Stk material
are segregated in the mine rock storage facility.
2Recoverable copper values are reported at the
time of mining and do not include leach recovery timelines.
Figure 13.13: Los Azules Mine Production Schedule
| Project Los Azules – S-K 1300 Technical Report Summary | Project No.: 21139-01 | 13-206 |
As shown in Figure 13.13, pre-stripping begins
in year -2, lasting for two years. In year -1, leachable material (17.4 Mt) is crushed and stockpiled on the pad to be ready for the leaching
process in the following year. Mine production for direct feed to the leaching operation begins in year 1 at a maximum of 25 Mt per year
until end of year 2. Mine production increases to a maximum of 30 to 35 Mt of leachable material between years 3 and 6. The final expansion
of leachable material production starts in year 7 going up to 50 Mt per year.
Recoverable copper cathode production starts in
year -1 with the mine delivering 105 ktpa of recoverable copper. From year 1 to 11, copper production from the mine produces approximately
175 ktpa of recoverable copper. Copper production decreases to 160 ktpa for years 12 and 13, and then proceed to further wind down until
the end of mine life. Recoverable copper does not include leach recovery timelines. Please see Table 14.4 for the actual amount of copper
leached and cathode produced on an annual basis. The pit is completed in year 15 with the stockpile fully depleted in year 17 (end of
mine life)
MRSF Configuration and Stability
Both the North and South MRSF follow the design
parameters shown in Table 13.6.
| Table 13.6: MRSF Parameters |
| MRSF Parameters |
| Lift Height (m) |
30 |
| Bench Width (m) |
35 |
| Slope Face Angle (°) |
37 |
| Road Width (m) |
50 |
| Maximum Road Grade (%) |
10 |
| Overall Slope (H:V) |
2.5H:1V |
The primary low-grade stockpile has an overall
slope of 2.5H:1V.
Refer to Section 22.10 for more details.
To achieve the highest possible productivity while
mining 15 m benches, the operation will be required to use large-scale surface mining equipment. 363 t load capacity class trucks were
selected as the optimal truck sizes. This was based on loading equipment size and fleet composition, required truck productivity, and
controlling the overall number of trucks required.
Equipment and personnel requirements will be based
on the mine operating 24 hours per day, 365 days per year, giving a possible operating hour total of 8,760 hours. Stantec Consulting International
Ltd. assumed typical allowances for maintenance, downtime, and stand-by to develop the equipment productive hours which were then adjusted
for utilization to provide the estimates in Table 13.7.
| Project Los Azules – S-K 1300 Technical Report Summary | Project No.: 21139-01 | 13-207 |
| Table 13.7: Annual Mine Equipment Productive Hours |
| Annual Mine Equipment Productive Hours |
| Haul Trucks |
6,284 |
| Shovels |
6,073 |
| Front-End Loaders |
5,863 |
| Support Equipment |
5,242 |
| Auxiliary Equipment |
3,669 |
| Other Equipment |
2,621 |
The primary mining fleet consists of loading and
hauling units, while support equipment consists of dozers, drills, and graders. The fleet size and composition were developed from first
principles by building up the equipment productivities for the primary loading fleet. The MS-Haulage software package was used to estimate
haul cycle times for the various mining phases to develop waste, mineralized material, and stockpile haulage times. The MS Haulage inputs
used are shown in Table 13.8.
| Table 13.8: MS Haulage Inputs |
| Rolling Resistance Near Pit/Dump |
2% |
| Rolling Resistance Typical Road |
2% |
| Max Speed Typical |
50 km/hr |
| Max
Speed Switchback/Corners |
10 km/hr |
| Max Speed near Pit/Dump |
50 km/hr |
| Max Speed Downhill Loaded |
20 km/hr |
| Max Speed Downhill Unloaded |
20 km/hr |
Haul cycle profiles were developed in MS Haulage
and linked with the mining schedule to determine the most optimal routing of material. Cycle times calculated by MS Haulage were then
linked to the mine production schedule to determine the truck requirements by mining period. The resulting fleet composition of the mine
schedule is shown in Figure 13.14.
| Project Los Azules – S-K 1300 Technical Report Summary | Project No.: 21139-01 | 13-208 |

Figure 13.14: Fleet Size for the Primary Mining
Fleet
| Project Los Azules – S-K 1300 Technical Report Summary | Project No.: 21139-01 | 13-209 |
The primary mining fleet requires a peak of 33
363-t class haul trucks, two 35 m3 front-end loader, and three 40 m3 hydraulic shovels. There is a ramp up
of the loading fleet through the first 5 years then drop off once the peak mining rates decreases after approximately year 11. The hauling
fleet ramps up until year 8 to about 33 trucks and then decreases after year 11 to the end of mine life.
Trolley-Assist Strategy
To reduce operating costs and GHG emissions, the
mine plan assumed a trolley-assisted haulage model. The life-of-mine (LOM) average operating cost (US$/t) using trolley assisted haulage
is approximately $0.8/t, whereas a conventional haulage scenario would cost approximately $1.51/t. This translates to an estimated undiscounted
LOM operating cost savings of approximately $1.3B. Furthermore, a trolley-assisted haulage model cuts GHG emissions by about 1.3 Mt over
the entire LOM. Assuming a carbon cost of $50/t, this GHG reduction provides an undiscounted LOM savings of $64M.
As a criterion for implementation of trolley infrastructure
for a given haul road network was a 2-year minimum operational life. Therefore, the trolley systems were designed in areas where it could
be installed for a minimum of 2 years on a sustained uphill grade. While trucks were on trolley assist, the obtainable uphill speed was
increased to 22.5 km/hr. Over the LOM, 38% of the loaded distance will be under trolley assist.
This section discusses the mining related labor
required to develop and operate the Los Azules open pit, including all technical, operations, and maintenance personnel. Operations and
maintenance labor and supervision has been allocated to cover the planned 24 hours per day, 365-work days per year schedule. A 12-hour
operating shift was assumed that requires two crews per day. The shift schedule is based on having four crews on a multi-week rotation.
The mine workforce size was determined based on the production schedule presented in this S-K 1300.
Table 13.9 shows the required mine labor for the
175 ktpa case from a pre-development year (year -2), a peak production year (Year 11) and the final year (year 17).
| Table 13.9: Mine Labor |
| Positions |
Year -2 |
Peak Year 11 |
Year 17 |
| Mine Operations: Supervision & Labor |
210 |
598 |
488 |
| Mine Maintenance: Supervision & Labor |
115 |
375 |
310 |
| Technical Services |
55 |
74 |
65 |
| Total Mine Department |
380 |
1,074 |
863 |
| 13.7 | Hydrogeology and Pit Dewatering |
An initial hydrogeological investigation was completed
in 2010 and a more extensive hydrological and hydrogeological investigation of the proposed pit area was completed in 2011 (Ausenco Vector,
2011). A total of eight standpipe piezometers and six vibrating wire piezometers have been installed, 16 in situ permeability tests
have been performed, and groundwater and surface water quality samples were collected and analyzed by an off-site laboratory. Fourteen
additional in situ permeability tests were conducted in nine exploration bore holes in 2018. These studies led to a conceptual understanding
of the hydrology and hydrogeology around the proposed open pit.
| Project Los Azules – S-K 1300 Technical Report Summary | Project No.: 21139-01 | 13-210 |
Groundwater flow in the volcanic bedrock is primarily
controlled by ubiquitous fracturing of the porphyritic diorite and geologic structures in the area. The degree of fracturing of the porphyritic
diorite and the permeability associated with the hydrothermal breccia and fault zones suggest that groundwater inflow to the pit will
be high. Numerical groundwater flow modeling from the 2011 study suggested that during later stages of pit development the groundwater
inflow to the pit will exceed 600 L/s. Updating these results based on the pit size and depth of the current S-K 1300 suggests groundwater
inflows to the pit on the order of 525 L/s.
Prior to discharge of mine water, pit water would
be used in the process plant, or if not, routed either to a sediment pond or rapid infiltration basin. Additional geochemical studies
are necessary to evaluate the geochemical characteristics of the pit wall rocks and the potential for acid rock drainage, which could
result in the need for treatment of in-pit waters. Most groundwater will be intercepted prior to seeping into the pit using wells. Initial
water quality data suggest that this approach may permit discharge of these waters without treatment (e.g., pH, metals, sediment etc.).
Additional hydrogeologic data collected outside
the area of mineralization and at greater depths will refine the long-term dewatering requirements and cost estimates. Long-term high-rate
pumping tests will also be completed to determine the large-scale hydraulic properties of the geologic materials in the pit area and evaluate
boundary conditions in the flow system that may exert strong controls over groundwater flow in the area.
| Project Los Azules – S-K 1300 Technical Report Summary | Project No.: 21139-01 | 13-211 |
| 14.0 | processing and recovery methods |
This 2023 IA incorporates an updated development
strategy for the potential resource processing sources include Oxide/LIX, Supergene (copper sulfide enriched material) and Primary (sulfide
material containing primary copper mineralization). LIX mineralization is the Spanish acronym for “leached” or leach cap.
This updated development strategy includes two phases of development: Phase 1 considers mining and processing resources associated with
the Oxide and Supergene copper mineralization in the near surface portion of the deposit using heap leaching methods. Based on evaluation
of several alternatives and production rates, a Base Case of up to a nominal 175,000 tonnes per annum of copper as electrowon cathode
was selected for Phase 1 of the Project development.
A Phase 2 of the Project considers the continued
development of the deposit’s primary copper mineralization found beneath the Supergene copper layer. The focus of this 2023 IA is
the initial Phase 1 project with limited concepts presented for Phase 2. For clarity, the economic outcomes for the development cases
presented in this 2023 IA include only Phase 1.
The Supergene and Oxide/LIX material is believed
to be suitable for treatment in a conventional lined leach pad suitable employing commercially proven sulfuric acid bio-leaching technology
with a conventional SX and EW process facilities to produce copper cathodes meeting London Metals Exchange (LME) Copper Grade A quality
standards or ASTM B115-10 – Cathode Grade 1.
The Phase 1 implementation scheme for the Project
is an open pit mine initially processing materials with crushing, bio-heap leaching and solvent extraction, and electrowinning (SX/EW)
facilities to produce LME Grade A copper cathodes for sale in Argentina or for export. Phase 1 mining over a period of 15 years yields
approximately 702 M tonnes of leachable material, containing a total of 8.23 billion lbs. (3,372 kt) of contained copper, of which 6.00
billion lbs (2,721 kt) is considered recoverable copper as cathodes. The total copper recovery expected is approximately 73% and considers
scale-up efficiencies and production distribution over a two-year timeframe from placement of material on the leach pad.
The Phase 1 Base Case includes processing facilities
to produce up to 175,000 tonnes per annum (tpa) of copper cathodes from higher grade, heap leachable copper content materials. The processing
facility will function through to the completion of mining of Phase 1 in Year 15 with stockpile reprocessing and residual leaching operations
to Year 18 (the “Base Case”). Mining operations for the Base Case ramp up over the proposed mine life from approximately 70
million total tonnes per annum moving up to 130 M tonnes per annum through the life of the Project as copper grades decrease, and waste
stripping increases. Process feed material delivery begins in Year 1 at 25 M tonnes per annum and ramps up to 50 M tonnes per annum in
Year 7 through the rest of the mining life.
Metallurgical characterization testing has been
completed in the form of sequential assay (sulfuric acid and cyanide steps) for the resources considered, bottle roll testing, and column
testing. The sequential assay method provides acid soluble copper (CuAS) and cyanide soluble Copper (CuCN), in which both assays combined
(CuAS + CuCN) provide a number for readily leachable/soluble copper (CuSOL); compared to the total copper assay (CuT).
| Project Los Azules – S-K 1300 Technical Report Summary | Project No.: 21139-01 | 14-212 |
A summary of the resources considered for processing
by source is provided in Table 14.1. Primary copper materials with sufficient leachable copper content are included in the Phase 1 leaching
resources considered. Stockpiled material, totaling 58.6M tonnes, is limited to the resources contained in the Phase 1 project mining
plans. The mine plan includes reclaim and processing 41.8M tonnes of lower grade supergene material included in the total in years 15-18.
| Table 14.1: Potential Process Materials Distribution – Leach Only Pit Shell |
| Material Type |
Potential
Process
Material (Mt) |
Grade
(CuT)
(%) |
Grade
(CuSOL)
(%) |
Gold
Grade
(g/t) |
Silver
Grade
(g/t) |
| Heap Leach Total |
702.3 |
0.518 |
0.362 |
0.05 |
1.33 |
| Oxide/LIX Material |
9.5 |
0.084 |
0.054 |
0.05 |
0.92 |
| Supergene Material |
612.4 |
0.536 |
0.394 |
0.05 |
1.28 |
| Primary Material |
80.4 |
0.433 |
0.152 |
0.06 |
1.77 |
| |
| Potential Mill/Leach Material (Stockpiled) |
58.6 |
0.106 |
0.022 |
0.08 |
0.95 |
| Primary Material |
16.8 |
0.249 |
0.027 |
0.04 |
0.96 |
| Oxide/LIX/Supergene Material |
41.8 |
0.049 |
0.020 |
0.09 |
0.95 |
The primary copper mineralization dominant material
mined (16.8M tonnes in the current plan) will be stockpiled for future processing routes, which may include a concentrator or alternative
leaching technologies. Any additional primary copper resource materials related to the Phase 2 mining/processing options are not represented
in the Phase 1 Base Case processing plan.
| 14.2 | heap leach (sx/ew) process flowsheet |
The Project envisions processing the Oxide/LIX
and Supergene resources mined. The conceptual block flow diagram for the processing facilities included in the Project is presented in
Figure 14.1.
| Project Los Azules – S-K 1300 Technical Report Summary | Project No.: 21139-01 | 14-213 |
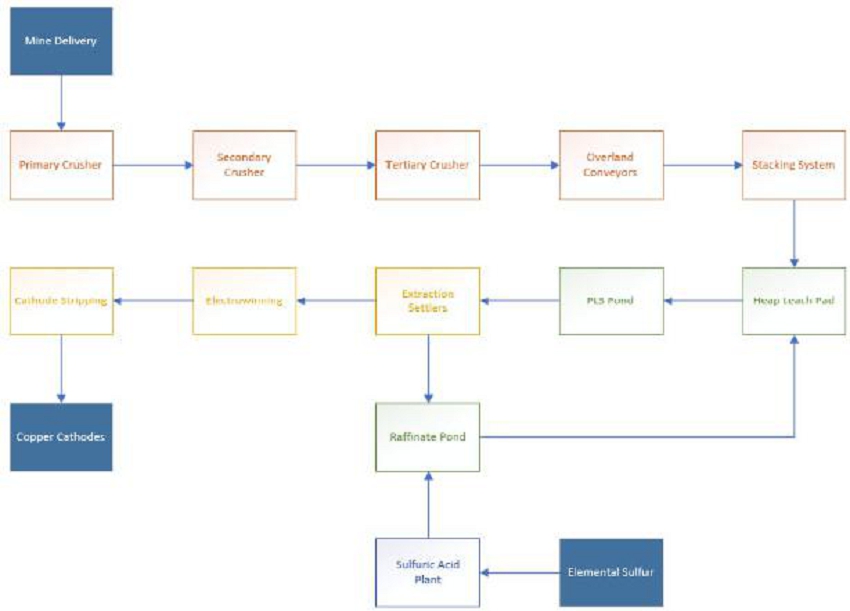
Figure 14.1: Heap Leach Process Flowsheet
| Project Los Azules – S-K 1300 Technical Report Summary | Project No.: 21139-01 | 14-214 |
Base Case Processing Facilities (175,000 tonnes per annum
Cu Cathode)
An initial Phase 1 Base Case was developed at
a nominal copper production rate of 175,000 tonnes per annum of copper cathodes. An expansion of the mining rates and materials handling
facilities is required by Year 4 and again in Year 7 to maintain copper production as the copper grade drops. This initial processing
facility will function through to the completion of mining for the initial project phase in Year 15, with low grade stockpile reclaim
and reprocessing in Years 15-16, and residual leaching operations to Year 18.
Mining operations ramp up over the proposed mine
life from approximately 80 million total tonnes per annum to 130 M tonnes per annum through the life of the project as copper grades diminish,
and waste stripping requirements increase. Processing feed rates begin at 25 M tonnes per annum and increase to 35 M tonnes per annum
in Year 4 and ultimately to 50 M tonnes per annum in Year 7 through the life of the Phase 1 project.
Run-of-Mine (ROM) Supergene material mined from
the open pit resource will be delivered directly to the primary gyratory crusher, located at the closest and safest site in proximity
to the lowest elevation section of the ultimate pit rim. This location minimizes both horizontal and vertical haulage for transport of
material from the mine to the primary crushing stage using an MMD Sizer to produce a minus 150 mm discharge product.
Crushed material will cycle through a series of
secondary/tertiary screens and crushers, capable of producing a yearly maximum tonnage rate, initially of 20-25M tonnes per annum (tpa)
for the Base Case. The crusher and stacking facilities will be operated 365 days/year and 24 hours/day at an operating availability of
70% or 6,132 operating hours using a two-shift rotation for process personnel. The crushing circuit produces a product at 80% passing
16.4 mm with an expected moisture content of 3%.
The crusher product will be transported to the
heap leach pad by a series of overland conveyors. The overland conveyors will discharge the material into agglomeration drums, bringing
the moisture up to 5% using raffinate solution directly from the raffinate pond outside of the heap leach boundaries.
The agglomerated material will be discharged through
a tripper conveyor, a series of portable conveyors, and finally a telescoping radial stacker to place the material directly on the heap
leach pad.
Crushed material from Oxide/LIX and Supergene
material types that is mined will be stacked on the heap leach pad; intending to be built in 9 m lifts to a maximum elevation of approximately
150 m. Material grade is determined by sequential assay and any leach material is stacked on the pad if it is above the soluble copper
cut-off grade.
The SX plant is designed to be modular and processes
pregnant leach solution (PLS) in three extraction (E) units, typically in a series-parallel configuration for each processing train with
a single stage of stripping (S) as indicated by: E1×E2×E1P×1S. The SX plant is designed for an initial two processing
trains to be modular construction and have a fabric structure cover over each train for weather protection.
The SX plant is designed to operate in several
configurations and organic to aqueous (O:A) flow ratios to accommodate the varying tonnage rates to the heap leach and resulting surface
areas under leach with decreasing process PLS feed grades from the mining operations over time.
| Project Los Azules – S-K 1300 Technical Report Summary | Project No.: 21139-01 | 14-215 |
The EW plant nominal capacity will be 175,000
tpa copper production, with rectified turn-up able to accommodate a maximum design production up to 201,250 tpa of copper cathodes. Copper
EW is expected to require 258 cells consisting of three processing bays of 86 cells, with two parallel lines of 43 cells per bay. EW cells
are constructed of polymer concrete and containing 84 cathodes (1.15m2/side plating area per cathode) and 85 anodes each, operating
in series and connected to rectifier transformer units. Expected current efficiency is 92% operating at a nominal 310 A/m2
current density (design maximum 356.5 A/m2). Cathode stripping from the permanent stainless-steel blanks will be done with
two (2) stripping machines that are of a semi-automatic, robotic design positioned in-line: one each between the three processing bays
on either side of the center bay.
Initial capital costs for the Base Case project
includes camps and site infrastructure, mining equipment to support the initial mining rate of 80 M tonnes per annum, crushing and heap
leach stacking systems to support the initial 22 M tonnes per annum throughput rate, SX/EW facilities to support 175,000 tonnes per annum
nominal copper production with an EW rectifier turn-up capacity of 12%, and heap leach facility (Phases 1A and 1B) to support placement
of 63 M tonnes.
Sustaining capital for the Base Case includes
mine equipment additions, heap leach pad expansions approximately every 2-3 years, mine equipment additions as the pit matures, crushing
plant expansions in year 4, crushing/stacking expansion in year 7, an additional SX train for increased flows in year 7, and on-site acid
plant expansions in years 4, 6, and 7 to an ultimate capacity of 700,000 tonnes of acid per year as processing rates and mining rates
increase.
Heap Leach Pad and Ponds
The total initial pad design has a capacity of
702 M tonnes, a future pad expansion is anticipated accommodate an additional 500 M tonnes with the expectation that Inferred resources
will be upgraded over time. The possibility to increase the nominal heap height is also under consideration. The leach pad develops over
time inside a valley with an upstream growth as prescribed in Figure 14.2 and Figure 14.3. Pad ultimate height of 150 m is not considered
extreme for design purposes and collection system integrity.
| Project Los Azules – S-K 1300 Technical Report Summary | Project No.: 21139-01 | 14-216 |
The design criteria details are presented in Table
14.2.
| Table 14.2: General Design Criteria |
| Parameter |
Unit |
Value |
| Initial Designed Stacking Capacity |
Mt |
957 |
| Ultimate Capacity Required |
Mt |
1,182 |
| Number of Stages |
- |
9 |
| Stacking Height |
m |
150 |
| Minimum slope of the stack base |
% |
2.5 |
| Overall Slope |
H:1V |
3.0 |
| Local Slope |
H:1V |
2.0 |
| Bench Width |
m |
10.0 |
| Stacking Layer Height |
m |
9 |
| Maximum Irrigation Area |
ha |
128 |
| Leach Material Permeability |
cm/s |
0.01 |
| Storm Precipitation 100 years |
mm/day |
68.10 |
| Storm Precipitation 1000 years |
mm/day |
135.30 |
| Initial Material Moisture (from Mine) |
% |
3.0 |
| Leaching Moisture |
% |
8.0 |
| Residual Moisture |
% |
5.0 |
| Drain Down Time |
hours |
100 |
| Bomb Stop |
hours |
24 |
Raffinate leach solution is pumped directly from
the Raffinate pond and applied to the surface of the heap through irrigation. The acid solution will percolate through the heap leach
material, dissolving copper, and some impurities. The resulting pregnant leach solution (PLS) will drain from the bottom of the heap and
will be collected in the PLS pond. From the PLS pond, the solution will be pumped to the feed tank for solvent extraction. The leaching
sequence for the pad is planned as follows in Table 14.3.
| Table 14.3: Average Leach Cycle Times |
| Leach Cycle Component |
Time (days) |
| Pad Loading |
14 |
| Surface Preparation / Piping |
7 |
| Active Solution Application |
180 |
| Drain Down and Decommissioning |
9 |
| Minimum Total Cycle Time |
210 |
Leaching solutions (raffinate), containing dilute
sulfuric acid (5-10 g/L H2SO4) will be pumped from the raffinate pond and applied to the top of each lift and allowed
to percolate though the copper leach material. Solution application is planned to be by a combination of sprinklers and drip emitters.
The raffinate is being added at a rate of 6 L/hr/m2
with biomass inoculated into the raffinate allowing for slower, bioleaching of sulfide minerals. The active biomass will be a product
of the column test work currently being completed at SGS on the Project material.
| Project Los Azules – S-K 1300 Technical Report Summary | Project No.: 21139-01 | 14-217 |
Soluble copper (CuSOL) recovery is estimated based
on the SGS and Plenge test results is 100%, with residual copper (CuRES) of 15% for a combined total copper (CuT) recovery expectation
of approximately 73%. As discussed in Section 10.0, the column work completed at Plenge did not include a bacterial leaching component
that would improve overall leaching performance.
Since mineralized material placement occurs over
a year’s time in the mine production plan, the last quarter of the year (3 months) is not expected to contribute to the production
in the year mined. Recovery has been shifted to the following year to account for the placement and preparation time required in the current
estimations. Only 60% of the recoverable copper is considered in the year placed with the remaining 40% coming in the following year.
For the Base Case option, the total initial pad
design capacity of 956.6M tonnes is completed over 21 years and a total of eight expansions after the initial construction period is over.
The initial build out of Phase 1A&B has a capacity of 75.9M tonnes of crushed/agglomerated material. The remaining material capacity
that is capable of being placed for Phase 2 (77.5M tonnes), Phase 3 (96.3M tonnes), Phase 4 (120M tonnes), Phase 5 (120M tonnes), Phase
6 (120M tonnes), Phase 7 (120M tonnes), Phase 8 (120M tonnes), and Phase 9 (106.9M tonnes).
A future pad expansion is anticipated in Years
21 and 23 to accommodate an additional 225M tonnes for the final total material requirement of 1,182M tonnes. The possibility to increase
the nominal heap height is also under consideration.
The expected materials placement and copper production
schedule is presented Table 14.4 for Years 1 through 17. Copper recovered to cathodes considers a heap efficiency (5%-7% impact) and solution
inventory (3%-5% impact) factor of 90% of the extractable copper based on general experience for large leach pads.
| Project Los Azules – S-K 1300 Technical Report Summary | Project No.: 21139-01 | 14-218 |

Figure 14.2: Heap Leach Pad General Layout
| Project Los Azules – S-K 1300 Technical Report Summary | Project No.: 21139-01 | 14-219 |
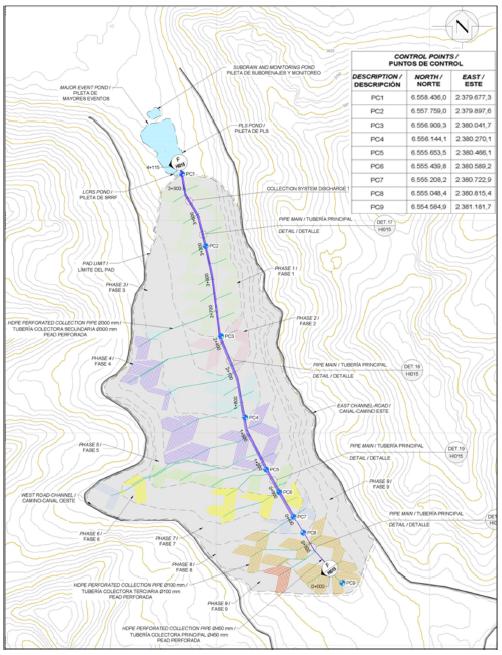
Figure 14.3: PLS Collection
| Project Los Azules – S-K 1300 Technical Report Summary | Project No.: 21139-01 | 14-220 |
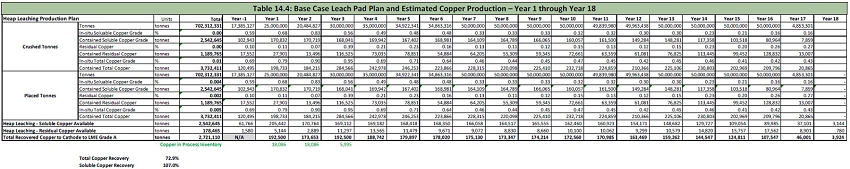
| Project Los Azules – S-K 1300 Technical Report Summary | Project No.: 21139-01 | 14-221 |
Sulfuric Acid Plant
Rather than trucking concentrated sulfuric acid
up to the Project, elemental sulfur produced at the YPF refinery in Lujan de Cuyo, Argentina, can be utilized to create sulfuric acid
at site. This decreases transportation, environmental, and health and safety risks from transportation of sulfuric acid to the project
site. Initial analysis of the YPF sulfur product at the Nuton lab at its Bundoora lab does not indicate any deleterious components to
the leaching systems are present.
Elemental sulfur prill is brought into the facility
and melted into liquid sulfur prior to combustion with oxygen. This produces gaseous sulfur dioxide (SO2) and sulfur trioxide
(SO3). The SO2/SO3 is used to convert to sulfuric acid (H2SO4); at normal operation,
the acid plant will produce sulfuric acid concentration of 94.5%. The SO3 is absorbed into a circulating sulfuric acid with
a concentration of 98% to help form more sulfuric acid.
For the Base Case option, the Phase 1 acid plant
will produce approximately 200,000 tonnes of sulfuric acid a year to be used in the heap leach process. The Phase 2 acid plant train is
expected to be operational in Year 4 and 100,000 tonnes per annum, bringing total acid production capacity to 300,000 tonnes of sulfuric
acid a year. A Phase 3 acid plant train of 100,000 tonnes per annum is expected to be operational in Year 6, bringing the total acid production
capacity to 400,000 tonnes of sulfuric acid a year. A Phase 4 acid plant of 300,000 tonnes per annum is expected to be operational in
Year 7; this brings the total acid production capacity to 700,000 tonnes of sulfuric acid a year.
Any excess heat and heated water can be utilized
in the process plant to fill necessary gaps. Steam will be captured and put through a combined cycle turbine generator to produce power.
Reagents, Water, and Power
Projected reagent and operating consumables requirements
for the LOM project are summarized as follows.
| · | Energy: 1.097 kWh/lb Cu produced |
| · | Makeup fresh water: 154 liters/second (lps) average |
| · | Sulfuric Acid: 1,381 tonne/day average, net of SX/EW credits |
| · | Elemental Sulfur: 409 tonne/day average, net of SX/EW credits |
| o | Extractant: 1200 - 1600 kg per day |
| o | Diluent: 2272 – 3000 liters per day |
| o | Cobalt Sulfate: 0.025 kg per tonne Cu produced |
| o | Guar: 0.005 kg per tonne Cu produced |
| o | Mist Suppressant: FC-1100 or alternative |
| Project Los Azules – S-K 1300 Technical Report Summary | Project No.: 21139-01 | 14-222 |
Power
For the Base Case, approximately 57 MW of power
will ultimately be required for the process facilities. For the Alternative Case, approximately 45 MW of power will ultimately be required.
However, the acid plants will provide a portion of the power through steam power cogeneration.
| Table 14.5: Projected Process Facilities Average Electric Power Usage |
| |
|
Average Consumption,
without acid plant |
Net Consumption,
with acid plant credit |
| kWhr/lb Cu |
MWhr/year |
kWhr/lb Cu |
MWhr/year |
| Base Case |
Total Power |
1.37 |
430,000 |
0.89 |
273,000 |
If the sulfuric acid plant and power lines to
site are both down, emergency power will be supplied through two (2) 10 MW diesel generators to continue power to the site for the foreseeable
future to avoid weather impacts and maintain operation of critical systems.
Sulfuric Acid
The heap leach acid consumption estimate varies
with the tonnage rates processed, types or materials leached (Oxide/LIX and Supergene) and the recovered copper content (grade). The expected
average gross acid consumption per tonne of material leached considered is 18 kg sulfuric acid/tonne. Copper plated in the EW operation
regenerates 1.54 tonnes of sulfuric acid per tonne of copper plated that is returned to the leaching circuit via the SX operation.
The mine average acid required for operation is
based on a gross acid consumption for all materials and net of copper production credits. The life of mine net acid consumption per tonne
of material leached is 13.1 kg/tonne and 1.79 kg/lb Cu produced.
All acid will be produced on site through the
acid plant. Sulfur prills will be supplied by YPF from their Mendoza based natural gas refinery operations. Life of mine sulfur consumption
averages 471 tonnes per day and ranges from 82 tonnes per day to 675 tonnes per day.
Start-up and minor supplemental sulfuric acid
will be brought directly to site to make up the difference after maximizing the production of each phase of acid plant.
An additional two (2) tpd of acid is expected
to satisfy electrolyte bleed make-up and all other SX/EW requirements. Most, if not all, of this acid would report to the raffinate pond
and be used in the leaching operation.
| 14.3 | adequacy statement ON SECTION 14 |
The QP believes the facilities and descriptions
of the processing areas are appropriate and consistent with other current operations and studies for similar facilities. Equipment selections
are based on vendor consultations and appropriate process modeling. The information is suitable for use in establishing reasonable prospects
for eventual economic extraction for the Mineral Resources, the mine plans and financial analysis.
| Project Los Azules – S-K 1300 Technical Report Summary | Project No.: 21139-01 | 14-223 |
Project infrastructure includes:
| · | Power Supply to Los Azules |
| · | Mine Rock Storage Facility (MRSF) (by Stantec Consulting International Ltd.) |
| · | Employee Housing and Transportation |
| · | Water Supply (by Stantec Consulting International Ltd.) |
Port facilities for materials and product distribution
considered in this IA include the inland port of Rosario in Argentina and the ports of Valparaiso, Ventanas, San Antonio, and Coquimbo
in Chile. The Rosario port facilities can be accessed via road or via rail transport from the Cañada Honda rail depot located at
the southern outskirts of San Juan.
Power is proposed to come from Tocota, Argentina,
north of Villa Nueva.
The city of Mendoza, probable source of fuel and
sulfur, is located approximately 200 km south-southeast (275 road km) from Calingasta. YPF operates a large 113,200-barrel-per-day crude
oil refinery and desulfurization facility just south of Mendoza at Luján de Cuyo.
Mendoza is also the location of the nearest international
airport (MDZ). Regional air service is also available from San Juan (UAQ).
The distances from the junction of the National
Route (Ruta Nacional) RN 149 with the RN 153 (south of the town of Barreal) to the Chilean ports for copper cathode export are as follows:
The entire distance is covered by paved roads,
except for approximately 37 km of gravel in Argentina, on the RN 149, in Mendoza territory, between the junction with RN 153 (San Juan/Mendoza
limit) and Uspallata (of the 55 km between RN 153 and Uspallata, 37 km are gravel and 18 km north of Uspallata are already paved). However,
this stretch of gravel is passable all year round and it is highly likely that in the short term it will be paved, prior to the project
development.
| Project Los Azules – S-K 1300 Technical Report Summary | Project No.: 21139-01 | 15-224 |
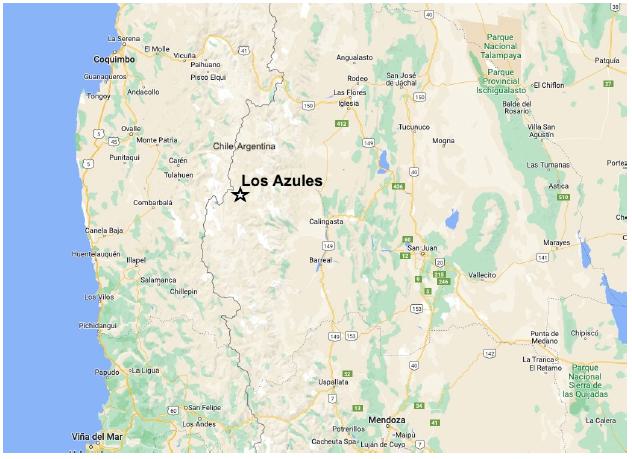
Figure 15.1: Regional Infrastructure (Google
Earth 2022)
The Los Azules Project is currently accessed from
San Juan via traveling northward on National Route (RN) 40 for 58 km, turning west on Provincial Route (RP) 436 for 23 km, then continuing
west following National Route 149 for 93 km to Calingasta.
Access continues following 120 km of gravel road
with eight river crossings and two mountain passes (both above 4,100 m elevation). This route is shown as the Exploration Road in Figure
15.2, below. This access is subject to snow accumulation, which has not been maintained over the winter. This update describes upgrading
and using an existing southern route and a potential future northern access route within a right of way requested by McEwen Copper that
is less affected by snow. Also described is an airstrip currently permitted for construction.
The city of Mendoza, probable source of fuel and
sulfur, is located approximately 200 km south-southeast (275 road km) from Calingasta. Mendoza is also the location of the nearest international
airport (MDZ). Regional air service is also available from San Juan (UAQ). Mendoza can be accessed by RN 40 from San Juan or by using
RN 149 to RP 52 to reach Mendoza.
The major Chilean population center of Santiago
is approximately 270 km south-southwest (400 km by well-developed road) from Calingasta.
| Project Los Azules – S-K 1300 Technical Report Summary | Project No.: 21139-01 | 15-225 |
Port facilities for materials and product distribution
include the inland port of Rosario in Argentina and Valparaiso, Ventanas, San Antonio, and Coquimbo in Chile. The regional map showing
access routes and infrastructure is provided in Figure 15.2. Cathodes or concentrate would travel south on RP 149 to Uspallata and from
there to Chile over RN 7 to one of the three ports. A 37 km section of RP 149 is not paved from the Mendoza province border towards Uspallata.

Figure 15.2: Existing Access & Infrastructure
(ACMSA, 2022)
Two other access routes are shown in Figure 15.2.
The Southern Access Road from Barreal to Los Azules is existing and passable but requires upgrades to make the road passable for haulage
of material to site. The Southern Access Road is much longer than either the Exploration Road (124km from Calingasta) or the Northern
Access Road (117 km from Villa Nueva) at 192 km from Barreal. The second route is the Northern Access Road, which begins in Villa Nueva
and has a preliminary design by Ruiz y Asociados of San Juan.
| Project Los Azules – S-K 1300 Technical Report Summary | Project No.: 21139-01 | 15-226 |
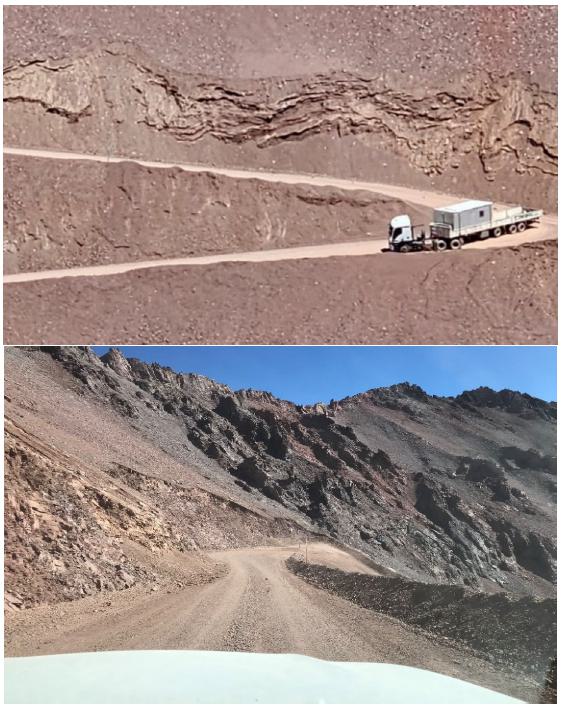
Figure 15.3: Access Roads Photos (McEwen,
2023)
| Project Los Azules – S-K 1300 Technical Report Summary | Project No.: 21139-01 | 15-227 |
The current site access, using the Exploration
Road, which largely runs through the Calingasta river ravine, turns out to be a critical corridor in terms of altitude differences, passing
through two narrow passes located at 4,170 m of altitude (Portezuelo de la Totora) and 4,300 m of altitude (Portezuelo Cabeza de León)
respectively, to later arrive at the Project location is at 3,390 m. This also forces a series of switchbacks with the complexities that
this development causes for traffic. The Exploration Road was upgraded in 2022/2023 to allow for access by larger vehicle traffic, including
trucks pulling semi-trailers and has provided safer transit as a result. The road will continue to be maintained to provide seasonal secondary
site access and support the incoming high voltage powerline routing.
The main access will be by the Southern Road route
to begin the project, this road will be upgraded for the expected year-round traffic travel to and from the site and extends approximately
192 km from the town of Barreal. The Southern Route was investigated by Ruiz y Associado Consultoras R.S.L. (RyAC) in 2023 and their preliminary
findings, designs, and costs were presented in their report, “MAIN REPORT LOS AZULES PROJECT PRELIMINARY CAPEX SOUTH ACCESS ROAD
PROV. OF SAN JUAN – REP. ARGENTINA” dated May 11, 2023. The conceptual level designs and costs for the Southern Road upgrade
were provided by Ruiz y Associados Consultoras S.R.L. (RyAC) and were estimated to be USD $138 million. These costs do not assume any
contribution from other projects in the area. The route is shown in Figure 15.5 below.
The South Access Road corresponds to one of the
three corridors that today is considered the Los Azules Project to link the road to the state road infrastructure available, mainly to
the "North-South Axis" made up of the Andean Corridor (RN 149). The South Access corridor almost entirely runs through a mountainous
environment, specifically in the Andean zone of the Department of Calingasta. It presents high complexity in several sectors of its layout,
being unprecedented in some sections, for which there are no predictions of its behavior over time (falling ground, instability of slopes,
avalanches, etc.).
The Southern Road and Exploration Road elevation
profiles are shown in Figure 15.4 below. The southern route is approximately 900 m lower in elevation at the peaks and presents an overall
better profile for continuous operations travel into and from the site.
| Project Los Azules – S-K 1300 Technical Report Summary | Project No.: 21139-01 | 15-228 |
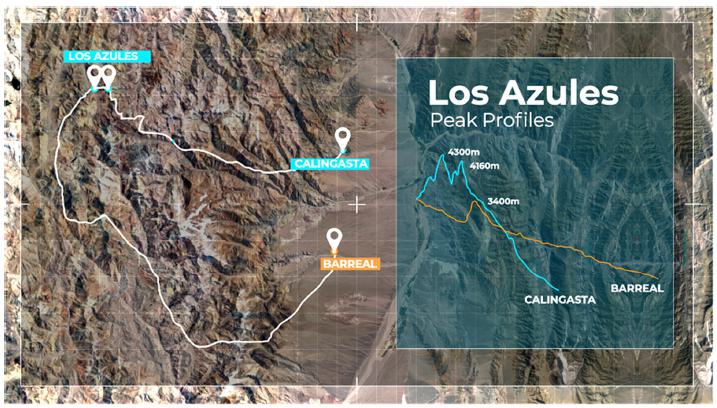
Figure 15.4: Site Access Road Profiles (McEwen)
The Southern access road route is carried out
mainly in a north-south direction through the Salinas River ravine, up to the confluence of the latter with the Verde River, along about
39 km. At this point, the road turns to the south-west through the Verde River ravine, then to the Salinas River. This provides an important
series of advantages and efficiencies, which needs to be confirmed in terms of its feasibility, through further studies. Consequently,
a moderate criterion was assumed, developing the road through the Verde, Colorado, Pantanosa, and Santa Cruz River valleys, until reaching
the confluence again with the Salinas, where both rivers make up the Blanco River. This last segment is already part of the access easement
to El Pachón, so that in certain sectors there is a road with a more developed platform. The corridor continues along the Blanco
River, corresponding to RP 402 according to the Dirección Provincial de Vialidad (Provincial Directorate of Roads (DPV)) name,
passing the El Molle area, and the crossing with the Colorado River, arriving at the “Blanco – Los Patos” confluence,
where the name of the route corresponds to RP 400. From this sector, continuing parallel to the Los Patos River, in descent, and after
passing through a rocky sector called "Las Caletas" you arrive at Barreal and RP 149.
| Project Los Azules – S-K 1300 Technical Report Summary | Project No.: 21139-01 | 15-229 |
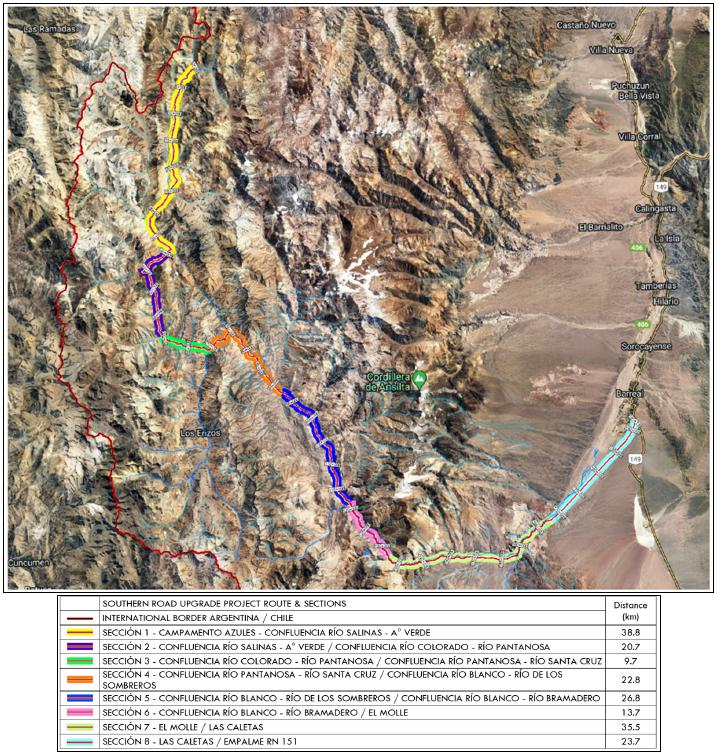
Figure 15.5: Southern Access Road Route &
Design Basis Sections (RyAC, 2023)
To reliably estimate the cost for the developments,
it was necessary to subdivide the total corridor into eight (8) “Sections” each with relatively homogeneous characteristics
in relation to the surrounding environment. Section 1 to Section 4 will be the most affected by winter aspects (snowfall, avalanches,
temperatures, etc.). As one descends through the corridor, the potential erosion in the river valleys is magnified due to the increase
in the supply drainages and basins and the potential runoffs prone to be generated by locally common torrential rains, especially during
the summer months. To complete the analysis, specific investigations must be addressed in corridors of this nature, including the imprints
of the cryogenic geoforms and periglaciers of the "Cuenca Río Blanco" established by the Argentine Institute of Nivology,
Glaciology, and Environmental Sciences (IANIGLA), for the purpose of verifying potential interferences with the route under study to avoid
occurrence.
| Project Los Azules – S-K 1300 Technical Report Summary | Project No.: 21139-01 | 15-230 |
This analysis of the route focused on soil movement,
structural package, and the drainage requirements of the work, as they are significant in these types of infrastructure, also attending
to the relative stabilization works (walls, stonework) as well as safety works (escape ramps, curbs, etc.), and complementary works in
general, all of which is detailed throughout the RyAC report.
| Table 15.1: Southern Access Road Upgrade Estimate (RyAC, 2023) |
| Southern Road Upgrades |
USD $ |
| Direct Cost |
$84,890,387 |
| Indirect Cost |
$46,881,950 |
| Total |
$131,772,337 |
| Profit 5% |
$6,588,617 |
| Project Cost |
$138,360,954 |
| |
|
| Total Length (Km) Sections 1-8 |
191.7 |
| $/Km (Direct Cost) |
$442,829 |
The northern route is a shorter, much lower route
which traverses the narrow Atutia river ravine and has only one pass to traverse at 3,800 m of altitude. Construction of this route will
require the construction of a pioneer road to allow more accurate surveying of the terrain and support construction of the final alignment.
One advantage of constructing the northern route is that it could support a pass to Chile and for that reason, provide for the recapture
of the capital cost of construction against future royalty payments. This route has been presented to the Provincial Highway Directorate,
which supports additional access to the remote upper area of the mountain range.
| 15.3 | power supply to los azules |
Power will be supplied from the Argentinian grid
via an initial 220 kV overhead transmission line approximately 120 km long and tie into the existing utility substation at Calingasta.
Due to the altitude, every overhead line must be built for a higher nominal voltage (e.g., a 500 kV line operated at 220 kV voltage level).
The lower air density reduces the breakdown voltage of the air and makes it necessary to increase the distance between phases, which in
turn increases the reactance of the line. Thus, voltage drop becomes the main design criterion. The transmission line route will be parallel
to the existing Exploration Road to Los Azules site and construction of 220 kV/175 MVA GIS substation at the site.
Initially, the Base Case project will require
approximately 89 MW, increasing to 131 MW as the processing facilities are expanded and mine power requirements increase over time. The
Alternative Case requirements increase to an initial 71 MW, increasing to 117 MW.
| Project Los Azules – S-K 1300 Technical Report Summary | Project No.: 21139-01 | 15-231 |
The expansion of the existing Rodeo and Calingasta
500 kV substations connected to the national grid will also be necessary. The work will be carried out under the initiative and responsibility
of National power provider YPF Luz. The estimated YPF investment is USD $155 million for their installation of the powerline and substation
facilities, including the site substation. The breakdown of the preliminary costs provided by YPF Luz are:
| · | Rodeo 500 kV Substation: |
USD $50 million |
| · | Calingasta 500 kV Substation: |
USD $35 million |
| · | Calingasta – Los Azules 220 kV line (120 km): |
USD $60 million |
| · | Los Azules 220 kV GIS Substation: |
USD $10 million |
YPF Luz has provided a referential rate sheet
for a Power Purchase Agreements (PPA) contract to obtain power sourced exclusively from renewable resources. The power would be sourced
from solar and hydroelectrical generation. The rate would depend on the contract term and would be a take or pay contract with a minimum
power contract under payment. A rate of $0.065/kWh based on a minimum 10-year term is considered in this IA.
YPF Luz has also signed a memorandum of understanding
to include the installation of the sub-station at Calingasta and transmission line to the site. Cost recovery specifics are still pending,
however a 3% interest on capital and overall, 5% IRR scheme has been developed to approximate this aspect of the investment cost recovery
while preserving the base power rate and included in the project financials. A commercial proposal is under development by YPF Luz.
Emergency power will be supplied through two (2)
10 MW diesel generators to provide power to the site for the offices, camps, and to maintain operation of critical systems. Solar power
augmentation and energy storage options will be evaluated in the next phase of study.
Additionally, the on-site sulfuric acid plants
will be outfitted with a steam cogeneration power plant for electricity generation from the heat and off-gasses. This will provide approximately
20% of the site requirements during operation. On-site solar power supplemental systems at the main camp and other facilities will also
serve to minimize the grid power usage.
This subsection was prepared by Jason McLennan,
McLennan Design. McLennan Design is a wholly owned subsidiary of Perkins + Will, Inc.
Initially, the project will use the existing site
all-weather modular camps and construction camp to begin operations. These facilities can accommodate up to 2,500 workers, with seasonal
constraints to 2,000 workers. Portions of the existing and future construction facilities will be periodically occupied as needed to support
ongoing construction activities at the site.
A projected camp staffing is shown in Table 15.2.
All employees and contractors will be housed in the Los Azules camp facilities.
| Project Los Azules – S-K 1300 Technical Report Summary | Project No.: 21139-01 | 15-232 |

| Table 15.2: Projected Camp Staffing Requirements |
| Site Camp Planning |
| |
Initial |
Year 16 |
Ultimate |
| Mine |
240 |
506 |
1105 |
| Process |
170 |
218 |
218 |
| G&A Site Staff |
107 |
107 |
107 |
| Contractors |
150 |
150 |
150 |
| Camp Ops/Services |
249 |
357 |
560 |
| Visitors/Executive |
30 |
40 |
50 |
| Spares |
50 |
50 |
50 |
| Total Rooms |
996 |
1428 |
2240 |
The Los Azules permanent site camp will house
and support approximately 1,000-2,500 workers at any time, with the initial camp for 1,000 and flexibility to accommodate larger as needed.
Images of the camp are shown below in Figure 15.6 and Figure 15.7. The permanent camp is currently planned for construction to support
occupancy in year 5 of the project.

Figure 15.6: Mine Camp Concept - Isometric
view showing Solar Arc
| Project Los Azules – S-K 1300 Technical Report Summary | Project No.: 21139-01 | 15-233 |
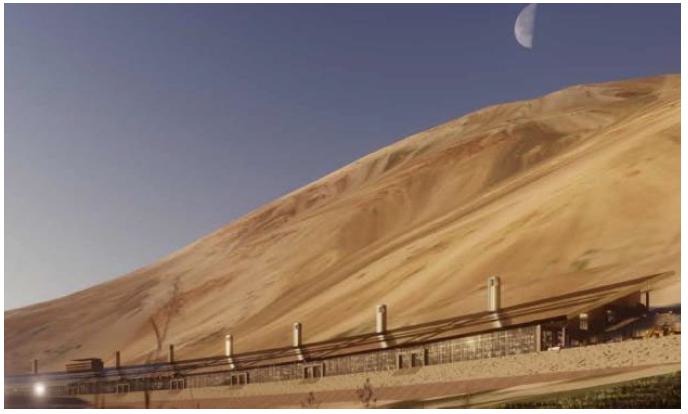
Figure 15.7: Mine Camp Concept - Oblique View
To accommodate alternate staff demands, the permanent
camp is designed for scalability and can be configured to house more than 1,000 employees if needed in various ‘neighborhood’
groupings organized in a linear fashion within the facility. The mine camp has been strategically located to optimize multiple variables.
Worker safety, comfort, well-being, proximity to mine operations, and access to the main road are major considerations.
The camp will also be designed to provide heating
and climate control, acoustics, medical, and support services. This will include recreation and medical clinic, improved air quality using
living plant systems, and water management to capture rainwater and snowmelt, retain the collected water, and naturally treat it for reuse.
The camp will pursue ILFI certification based on the alignment with the Living Building Certification “Water Petal”.
The camp will be designed to provide space for
growing food in a self-sustaining environment. Finally, the camp will provide waste management systems to provide reuse of waste materials,
either through direct reuse, recycling, composting, and elimination of single-use plastics and packaging.
Transportation of employees to the various worksites
will be provided by on-site buses and light vehicles. All management will have assigned light vehicles. Lunchtime will be taken on board
mobile equipment or at designated lunchroom facilities established at each major facility location during the construction phase. Transportation
between the Los Azules site and the city of San Juan for staff embarking on, or returning from work rotation, will be by company aircraft
or a bus service.
| Project Los Azules – S-K 1300 Technical Report Summary | Project No.: 21139-01 | 15-234 |
A longer-term solution for Los Azules is a fly-in-fly-out
operation from San Juan airport to Los Azules. Flight time is anticipated to be approximately one hour. The workers coming into rotation
arrive to the San Juan airport at 05:00 and commence their shift per normal start time at site. On finishing the shift at the end of rotation,
the workers report to the airport and are home early that same evening.
The Los Azules Development is in the high Andes
mountains of western Argentina. To the southwest of Los Azules and downstream of the proposed processing facilities the Rio Salinas Valley
broadens and straightens. It is of very low gradient and suitable for formation of an airstrip to service Los Azules. The airstrip will
be at an altitude of approximately 3,250 masl, 8 km from the proposed camp/offices facilities along the southern access road route.
A detailed topographic survey was performed during
2017. An airstrip design was completed later in 2017. A site inspection confirmed the geotechnical condition is glacial outwash sands
and gravels. The survey and geotechnical inspection indicated airstrip formation works are without complexity and suitable construction
materials are immediately available at the site by screening of in-situ materials.
The airstrip permit had been applied for to the
Argentina authority (ANAC) since approximately 2015 and granted in 2019 and still in force. Initially, a STOL (Short Take Off and Landing)
permit has been requested. The permit will allow construction of an airstrip and for planes, such as a DH-6, to land at Los Azules and
support the exploration, permitting, and early implementation phases of the Los Azules Development.
A longer-term vision is to utilize larger aircraft
at Los Azules, such as a Dash 8 type personnel transport aircraft and potentially a C-130 Hercules Transport. These aircraft will require
a longer airstrip, and a future extension to the airstrip is anticipated. The extension is to enable larger aircraft types to use the
airstrip facility and will require an easement over the affected part of the property to the south of Los Azules lands.
Navigation aids, safety and security evaluations,
and flight simulations are pending for operations. A preliminary costing for the STOL airstrip formation at Los Azules in 2017 was less
than $5M and the airstrip formation works can be completed within a single summer season.
Surface water is available on the property in
adequate amounts for McEwen Mining’s exploration activities. Preliminary hydrological and meteorological evaluations have indicated
sufficient water exists for the proposed Los Azules mining and processing facilities and to provide the necessary fresh water needed to
house employees at the mine site. For the Base Case, the estimated average consumption is approximately 154 L/s with consumption in the
initial years of 122 L/s and 165 L/s in the later years as mining progresses and processing throughputs increase.
The leaching process for recovering copper was
selected, in part, due to the lower water consumption. This was in line with our guiding principles to minimize our impact on the environment.
Selecting a hydrometallurgical process option for Los Azules would reduce effective water usage by 75% to 80% over a concentration alternative.
Given this context, the most appropriate technology selection for Los Azules to minimize water usage is a hydrometallurgical approach,
which is the basis for the project development in this Technical Report. Additionally at Los Azules, alternatives for improving precipitation/snow
capture, site dust control, reuse/recycle, and passive water treatment strategies are being developed and included in the project design.
| Project Los Azules – S-K 1300 Technical Report Summary | Project No.: 21139-01 | 15-235 |
The estimated net water consumption for the project
by usage source is presented in Table 15.3 below for the Base Case and Alternate Case Phase 1 project options.
Table 15.3: Life of Mine Average Water
Consumption by Case |
Water Usage by Major Area During Operations
(Life of Mine Average) |
| |
|
Base Case |
| Mine Area – Shops, truck wash |
L/s |
2.0 |
| Processing |
|
|
| Process Plant & Offices |
L/s |
2.0 |
| Leaching |
L/s |
101.1 |
| Site Areas |
|
|
| Camps |
L/s |
1.3 |
| Administrative |
L/s |
0.5 |
| Dust Control |
|
|
| On-Site Mine, Roads |
L/s |
3.8 |
| Off-Site Roads |
L/s |
39.7 |
| Other, Miscellaneous |
L/s |
3.3 |
| Make-up Water Required |
L/s |
153.7 |
| |
|
|
| Year 1-5 Average |
L/s |
122.2 |
| Year 1-10 Average |
L/s |
145.7 |
| Year 11-27 Average |
L/s |
165.0 |
The fresh water available at Los Azules from natural
surface streams that progressively confluence to form the Rio Salinas and groundwater from proposed pit dewatering operations exceeds
the projected water consumption demands of the project development and mining operation phases.
The envisaged mine dewatering holes for lowering
groundwater level around the mine pit will also deliver water. Future dewatering of the actual mine pit sumps will also be a source of
water, even if it is contact water.
Based on an initial project development including
copper heap leaching and copper SX/EW processing, the preliminary hydrological and meteorological evaluations have indicated sufficient
water exists for the proposed Los Azules mining and processing facilities and to provide the necessary fresh water needed to house employees
at the mine site estimated to average approximately 113 liters per second (L/s) in the initial years and 163 L/s in the later years are
mining progress and processing throughputs increase. A more detailed evaluation of available water resources will need to be undertaken
for an IA submission.
| Project Los Azules – S-K 1300 Technical Report Summary | Project No.: 21139-01 | 15-236 |
Surface water flowing from the Los Azules Development
is all contained within a single watershed. Meteorological and watershed analysis (Stantec Consulting International Ltd., 2022) estimates
average annual surface water flows 438 L/s in the Rio Salinas exiting the Los Azules watershed with calculated average monthly surface
water flows ranging from 92 L/s in March to 1316 L/s in August. Over the recent 5-year drought period, estimated average annual surface
water flow exiting the Los Azules watershed is 275 L/s. These estimates include surface availability over the entire watershed. Potential
losses or gains due to surface diversion structures or storage facilities are not accounted for in these estimates. A photo of the Rio
Salinas is shown in Figure 15.8.
Long-term mine dewatering estimated for the current
pit configuration is 525 L/s. Previous dewatering estimates ranged from 600 L/s to 800 L/s (Hatch, 2017; Ausenco, 2011), A summary of
potential water supply sources is shown in Table 15.4. The combined groundwater and surface water availability estimates for this IA are
in surplus to the 600 L per second required for long term make-up water and the surplus is further augmented when mine area dewatering
water is considered.
| Table 15.4: Estimated water supply by source. |
| Source |
Rate |
Comments |
| Average SW flows |
438 L/s |
Stantec, 2022 |
| Estimated pit dewatering |
525 L/s |
Current IA |
| SW flows – drought conditions |
275 L/s |
Stantec, 2022 |
| Pit dewatering estimate – upper range |
800 L/s |
Ausenco, 2011 |
| 2017 pit dewatering estimate |
600 L/s |
Hatch, 2017 |
The Los Azules Development has available surface
water and groundwater resources exceeding the water demand. To manage the excess water, non-contact water, such as stream flow water and
dewatering bore water, will need to be managed by a network of stream diversions, contour channels, and pipes. This will deliver the surplus
non-contact water back into the environment at a point downstream of the active project site.
| Project Los Azules – S-K 1300 Technical Report Summary | Project No.: 21139-01 | 15-237 |
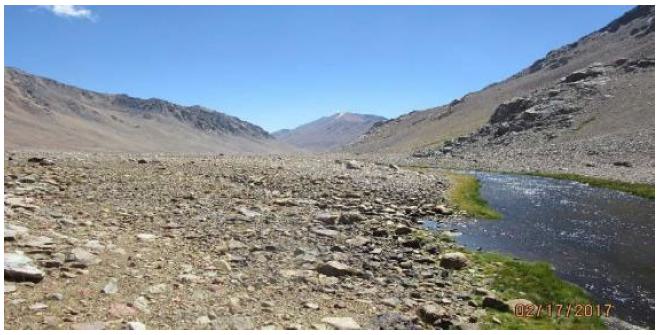
Figure 15.8: The Rio Salinas at the Proposed
Campsite.
It is recommended that more studies into water
management are performed as a part of baseline environmental assessments, including:
| · | Ground-water level measurement over a whole year, including winter. |
| · | Stream flow gauging, measured over a whole year. |
| · | Permeability testing in the area to be dewatered around the mine pit to assess probable dewatering extraction
volumes and to confirm dewatering water quality is suitable as non- contact water. |
A detailed contact water / non-contact water management
plan needs to be developed to support the IIA permitting process, including the design and location of water diversion structures, and
the staged formation of any contour channels. This will be further supported by an engineered project water balance. At the same time
as the IIA application submission, Los Azules will apply for the water rights and the associated water use permits where Los Azules is
granted to have beneficial use of its water rights.
| Project Los Azules – S-K 1300 Technical Report Summary | Project No.: 21139-01 | 15-238 |
| 16.0 | market studies and contracts |
The IA for the Los Azules deposit is based on
initial production of copper cathode from heap leaching for the 17-year life of operations. Potential recovery of gold and silver depends
on the use of alternate leaching techniques from the copper leaching residues or flotation to produce concentrates.
| 16.1 | Copper Market Outlook – Supply vs Demand |
The global copper market continues to be one characterized
by a paucity of copper orebodies in the project pipeline and worldwide demand continuing to grow. A typical project takes between 15 and
20 years to move from discovery to production, and on average a decade from the completion of a feasibility study to ramp-up to full production.
This delay in putting projects into production is due to technical, regulatory, or social issues.
Copper consumption is expected to increase over
time, greater than the historical rate of 3% per year, due to increased consumption for renewable power technologies and fuel cell and
battery electric vehicles. Increasing renewable power generation from wind turbines, solar photovoltaics, and fuel cells, combined with
the need for power storage technologies, transmission and distribution will drive more demand for copper. The increased use of fuel cell
and battery electric vehicles are an additional source of demand. These vehicles use between 30 and 435 kg of copper per vehicle, versus
today’s internal combustion vehicle, which uses 24 kg. These changes in power generation, transmission, and distribution, as well
as the end uses are critical to meet decarbonization goals set by the International Energy Agency.5
The market forecasts by S&P Global6
range between a modest deficit of supply to a significant deficit, ranging between the use of current or a best-case use of technology,
copper recycling, and mine/refinery capacity utilization (“Rocky Road” vs “High Ambition” forecast). The best-case
scenario assumes highly optimistic advances overall to achieve that production level. A comparison of the Rocky Road and High Ambition
forecasts of supply and demand are shown below in Figure 16.1, copper market outlook – supply.
5 https://openknowledge.worldbank.org/bitstream/handle/10986/38160/CMO-October-2022.pdf
6 https://www.spglobal.com/marketintelligence/en/mi/Info/0722/futureofcopper.html
| Project Los Azules – S-K 1300 Technical Report Summary | Project No.: 21139-01 | 16-239 |
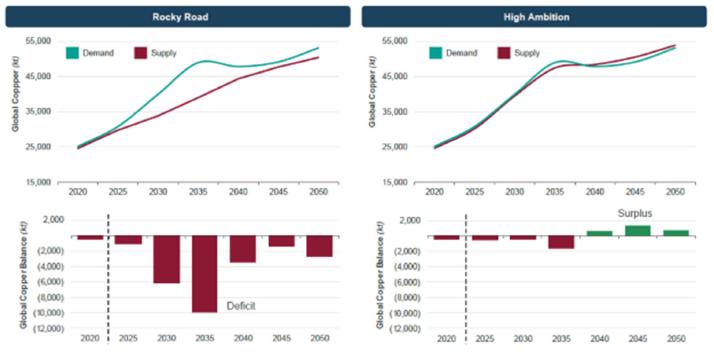
Figure 16.1: Future Copper Market Demand Scenarios
(from S&P Global)
| 16.2 | copper market outlook - Prices |
Projected copper prices to be used in the economic
analysis are based on a range of prices including consensus projections and an economist view of the long-run steady state copper spot
price.
Consensus projections for the long-term copper
prices range between $3.25 and $4.25 per pound of copper, with a mean price of $3.75 per pound of copper. This is reflected in the following
figure with the price projections and the date of those projections, below.
| Project Los Azules – S-K 1300 Technical Report Summary | Project No.: 21139-01 | 16-240 |
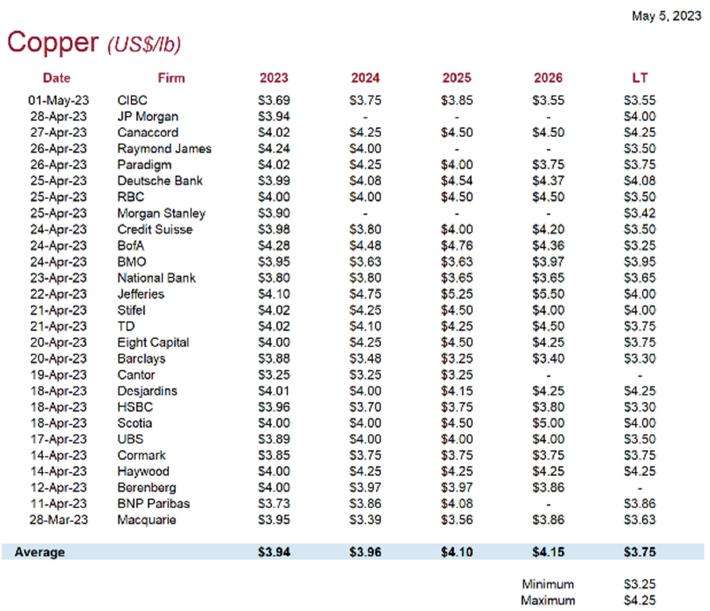
Figure 16.2: Long-term Copper Pricing (CIBC,
May 2023)
The long-run steady state copper price as estimated
by an economist uses the information in the current forward market for the metal, along with a mathematical model of how prices move towards
the long-run price over time from a current base price, to project the future.7
The steady state copper price is estimated using the Laughton-Jacoby model.
Inputs for the copper price model are weekly spot
prices traded in LME, and the base price used was as of December 1, 2022. The nominal long-run price is estimated to be $3.81 per pound.
The real or deflated dollar copper price in 2033 is expected to be $2.85.
The price selected to use for the financial model
was $3.75 per pound.
7 , Davis, G, 2022, Copper and Energy
Price Forecasting for the Los Azules Copper Project Preliminary Economic Assessment, internal report for McEwen Copper
| Project Los Azules – S-K 1300 Technical Report Summary | Project No.: 21139-01 | 16-241 |
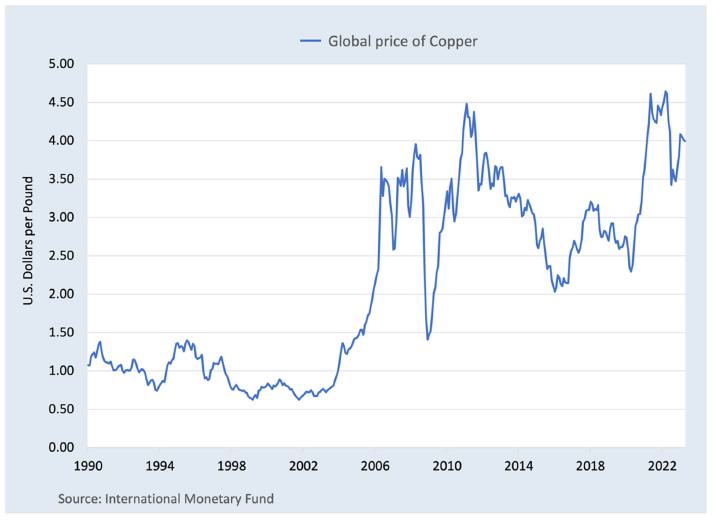
Figure 16.3: Copper Prices 1990 to Present
(source: International Monetary Fund8)
| 16.3 | Mineral Resource Estimate |
A long-term copper price of $4.00 per pound, gold
price of $1,700 per troy ounce and silver price of $20 per troy ounce were used for constraining mineable shapes, input to cutoffs, and
for establishing reasonable prospects of eventual economic extraction for Mineral Resources. Using a higher long-term price assumption
for Mineral Resources helps ensure that the Mineral Resources within the IA mine plans are a subset of those resources and gives more
flexibility to the mining engineer when determining the cutoff used. The use of a higher price assumption for Mineral Resources has become
a common industry practice.
No copper concentrate marketing plan has been
developed at this stage. It is expected that the Los Azules cathodes will be sold Free on Board at the Los Azules Project site, and that
concentrate will be a high-quality saleable concentrate and is intended to be exported through a port already exporting copper concentrates.
Exporting the Los Azules copper concentrates through an existing copper concentrate handling port has potential for cooperation, blending,
and value adding; however, this is not yet considered. Marketing to Europe will have an advantage in the current political environment
as they are currently looking for sources to replace Russian copper concentrates.
8 https://www.imf.org/en/Research/commodity-prices
| Project Los Azules – S-K 1300 Technical Report Summary | Project No.: 21139-01 | 16-242 |
| 16.5 | cathode or concentrate transportation |
Copper cathode transportation is considered in
Section 15. Product is expected to be sold FOB Los Azules, with the buyer taking responsibility for transportation from site. In the future,
a novel leaching technology or a copper concentrator could be considered for processing the underlying primary copper mineralization.
No contracts are in place related to the refining,
handling, sales and hedging, transportation of supplies or products, and forward sales contracts are currently in place.
| Project Los Azules – S-K 1300 Technical Report Summary | Project No.: 21139-01 | 16-243 |
| 17.0 | ENVIRONMENTAL STUDIES, PERMITTING AND PLANS, NEGOTIATIONS, OR AGREEMENTS WITH LOCAL INDIVIDUALS OR GROUPS |
Sections 17.1 and 17.6 have been prepared by Maria
Paula Martinez, Knight Piésold A.C.S.A. (KP) based on background information from studies conducted from 2012 to date and the exploration
environmental impact report along with its updates, available since 2010. Section 17.2 was prepared by Rob Bowell PhD, C. Chem, C. Geo,
P. Geo (NL), SRK Consulting UK Limited. Sections 17.3 to 17.5 have been prepared by W David Tyler, Registered Member SME, McEwen Copper.
| 17.1 | ENVIRONMENTAL BASELINE STUDIES |
Baseline studies to date include surface and groundwater
quality, flow measurement, climate, flora, fauna, limnology, air quality, archeology, geology, geomorphology, and glacier characterization.
All baseline data collection, except for meteorological data, has been conducted during late spring, summer, and early fall due to the
difficulty of accessing the site in winter.
The results of the baseline studies were documented
in the exploration IIA (2010), and in subsequent updates, 1st biennial exploration IIA update (2012), 2nd biennial exploration IIA update
(2014), 3rd biennial exploration IIA update (2016), 4th biennial exploration IIA update (2018), 5th biennial exploration IIA update (2021)
and 6th biennial exploration IIA update (2023). The environmental and social baseline is currently being prepared to complete the IIA
for the exploitation of the Los Azules Project.
In general, the study of each of the components
has been considered in two parts: the first corresponds to the area containing the mineral deposit, where the mine and associated infrastructure
will be developed, known as the Mine Area, and the second describes the geology of the area over which the access road to the site is
laid out, from the town of Calingasta to the valley of Río Frio, called Access Road.
Archaeology
The baseline study of the archaeology component
has integrated all the archaeological verification, prospecting and monitoring work carried out by Dr. Catalina Teresa Michieli and Carlos
E. Gómez O. in the Mine Area and the Access Road from 2012 to the present.
The archaeological prospecting and monitoring
works carried out were authorized, without exception, by Resolution issued by the Secretariat of Culture of the Ministry of Tourism and
Culture of the Province of San Juan, as the Enforcement Authority for heritage laws, Provincial Law Nº 571-F and National Law Nº
25743, and they were duly reported. These works were aimed at locating possible pre-Hispanic (indigenous) or historical archaeological
sites in the areas of potential impact, and the subsequent and periodic review of their condition (or monitoring).
From the Baseline study, it was possible to conclude
that, in general, the entire area of influence of the Los Azules Project does not have significant pre-Hispanic (or Indigenous) archaeological
sites, except for some isolated findings of undefined lithic material (remains of stone carvings) or unfinished tools that were duly reported
and rescued.
However, on the Project’s access road (Cuesta
del Gringo), there are two large rocks with unique petroglyphs (indigenous engravings on rock).
| Project Los Azules – S-K 1300 Technical Report Summary | Project No.: 21139-01 | 17-244 |
The cultural-historical sites are well represented,
both on the access road and in the mine area and are all related to the management of livestock of European origin after the Spanish conquest
(post-Hispanic).
On the western slope of the Cordillera de La Tortora
and within the Project area, these sites (simple lodges or night shelters) are linked to the settlement and transit of Chilean goat herders
("crianceros"), and are still in use today. On the eastern slopes, there are sites linked to cattle trafficking.
The most significant Chilean herders' posts, considering
their very likely ancient age, constructive complexity, size, and preservation in an almost original state without additions of current
materials, are: ‘Puesto Colorado’ (on the right bank of the Río Frío), ‘Puesto Redondo’ (on the
left bank of the Río Frío), ‘Puesto Gris’ (on the right bank of the Arroyo de la Embarrada), and ‘Puesto
de La Coipa’ (on the right bank of the Río de Las Salinas at the mouth of the Arroyo Estero de la Coipa).
Also significant are the following lodges or night
shelters used by Chilean herders in transit across the Andean passes: Alojo-A, on the right bank of the Estero Verde (now called Arroyo
Azules), and Alojo Escondido, on the left bank of the Río de Las Salinas.
Protected Areas
For the development of the baseline for this component,
the various publications, regulations, and classifications on Protected Areas within the system of natural protected areas of Argentina
and the province of San Juan were consulted, as well as categories designed by supranational organizations. The Mine Area and Access Road
were considered for the study.
The situation of Natural Protected Areas (NPAs)
at both the national and provincial levels was contextualized in detail, and the analytical criteria were established. The proximity criterion
was defined as representative since it provides specificity in the analysis of the characteristics of the study area. On this basis, the
natural protected areas included were considered, as well as areas surrounding each defined sector.
The result of the baseline analysis indicated
that the mine area does not interact with NPAs within a study area of a 45 km radius. Considering conservation interest sites, as defined
by the Territorial Regulation of Native Forests (Law No. 26331), no areas with Conservation Categories have been identified in the study
area.
The Access Road does not interact with NPAs within
the study area, considered with a 10 km buffer. Considering the conservation interest sites, as defined by the Territorial Regulation
of Native Forests (Law No. 26331), Conservation Category II zones (yellow) are identified in the first 20 km of the initial section (east)
of the access road.
The closest NPAs are Los Morrillos wildlife refuge,
Cerro Alcázar natural monument, and Estancia Don Carmelo, at approximately 80 km from the Mine Area.
In conclusion, no interactions were observed between
the study areas (Mine Area and Access Road) and protected areas, nor with areas of conservation interest based on native forest criteria.
Also, there are no RAMSAR sites, Biosphere Reserves, or other protected sites recognized by the Nation, the Province of San Juan, and/or
international treaties.
| Project Los Azules – S-K 1300 Technical Report Summary | Project No.: 21139-01 | 17-245 |
Socioeconomic Aspects
Located in the northwest of the Province of San
Juan, the Department of Calingasta is one of the 19 municipalities, and it is the department with the largest surface area. Entering the
department and following National Route 149, which crosses the department from north to south, the towns of Villa Nueva, Puchuzun, Villa
Corral, Villa de Calingasta, Alcaparrosa, Barrialito, La Isla, Tamberías, Hilario, Sorocayense, Barreal, and Villa Pituil are located.
This form of human settlement constitutes the
main population settlement feature on the longitudinal valley of Calingasta, which also follows the course of the Río Los Patos
from the south and the Río Castaño Viejo from the north, converging in the vicinity of the town of Calingasta to form the
Río San Juan.
The limits of governmental action of the municipality
coincide with the departmental boundaries, with the mayor exercising the political power and, together with the Deliberating Council,
being responsible for municipal governance.
It has three important population centers: Villa
Calingasta, Tamberías, and the conglomerate formed by Barreal and Villa Pituil. The distances between the human settlements entail
a decentralization of municipal services. Delegations are established in these three towns ensuring a certain territoriality of the Municipality,
exercising governance, control, collection of fees and taxes, performing works, providing waste collection services, and establishing
a communal presence, with Calingasta constituting a polycentric department in the management of the municipal services.
In 2010, the department had a population of 8,588
people (National Statistics Institute - INDEC) ranking fifteenth in the province with a 5%, inter-census growth and with relative importance
at the provincial level that decreased to 1.26% with respect to the previous census (1.32%) due to higher population growth in other departments.
The population structure shows 53% of males and
47% of females (National Statistics Institute - INDEC 2010) having a progressive pyramidal structure with a lower percentage of young
people in the group composed by the population from 0 to 4 years old and a slight increase in the older age groups, thus showing a slight
aging process. The 15 to 64 age group is noteworthy, with a higher number of males than females (33.35% and 29.35% respectively), totaling
62.70% of the department's population, with an average age of 28.6 years and a masculinity index of 113 men for every 100 women.
Future environmental and social work plan
During December 2022 and from early 2023, environmental
monitoring activities will focus on expanding the data set already available to capture seasonal environmental variations at the site
that are relevant to support the preparation of an environmental impact analysis and report (IIA).
In addition, the baseline that is currently being
prepared will serve to provide a complete description of the site and the social environment and economic activities in the area of influence
before the beginning of any project development activities and will also provide the company with a reference framework in the event of
any future complaints or claims of adverse impacts.
| Project Los Azules – S-K 1300 Technical Report Summary | Project No.: 21139-01 | 17-246 |
Once the baseline is fully established, and the
site is authorized and moving forward with construction, baseline data collection will be maintained for all components that show seasonal
or inter-annual variations throughout the permitting process until project development begins. Upon commencement of project development,
the established Environmental and Social Management Plan (ESMP) will be complied with. This plan is an instrument whose main objective
is to develop measures aimed at the Project's sustainable development-
The ESMP presents the measures for prevention,
mitigation, rehabilitation, restoration, or re-composition of the environment affected by the environmental impact, organized according
to stages and chronology of execution. Law 24585 addresses these measures for the following components: geomorphology, water, atmospheric
conditions and air, soil, flora and fauna, ecological processes, and sociocultural environment.
On the other hand, the actions for implementation,
follow-up, and monitoring of such measures are developed specifically for each component in the Monitoring Plan and in the Project Closure
Plan.
As part of the environmental and social management
plans, the following aspects will be considered and monitored as part of the environmental and social work plan for the future:
| Table 17.1: Summary of future environmental and social work plan |
|
Environmental and/or
social component |
Sub-component |
Project Stage |
| Construction |
Operation |
Closure |
| Geomorphology |
Control of active geological processes |
x |
x |
x |
| Cryogenic geoforms |
x |
x |
x |
| Water |
Water resources |
x |
x |
x |
| Atmospheric conditions |
Greenhouse gas emissions |
x |
x |
x |
| Meteorology and air quality |
x |
x |
x |
| Noise and vibration |
x |
x |
x |
| Soil |
Soil |
x |
x |
x |
| Flora and fauna |
Terrestrial biota protection |
x |
x |
x |
| Aquatic biota protection |
x |
x |
x |
| Control of exotic species |
x |
x |
x |
| Ecological processes |
Compensation of ecological impacts |
x |
x |
x |
| Ecological restoration of disturbed areas |
x |
x |
x |
| Socio-cultural environment |
Transport |
x |
x |
x |
| Heritage protection |
x |
x |
|
| Employment program |
x |
x |
x |
| Training and education |
x |
x |
x |
| Consultation and communication |
x |
x |
x |
| Visual impact |
x |
x |
x |
| Contribution to local development |
x |
x |
x |
| Project Los Azules – S-K 1300 Technical Report Summary | Project No.: 21139-01 | 17-247 |
Introduction
SRK (UK) have undertaken an assessment of the
environmental geochemistry of the Los Azules copper mine as part of the Initial Assessment (IA). The assessment has considered the geology
and geochemistry of the process feed material, and mineral storage facilities with respect to acid rock drainage and metal leaching potential
(ARDML).
The geochemical evaluation is in its early stages.
A review of the available geological information pertinent to the study has been undertaken, and over 100 samples have been collected
and analysis started for geochemical characterization, but not all the data was available for inclusion in the IA. This section describes
the work undertaken to date and is sufficient for the purposes of an IA level of assessment. The geochemical characterization work planned
for the Feasibility Study is also described, and preliminary geo-environmental models are presented for the deposit and mine rock storage
facilities. Based on the available information and the geo-environmental conceptual models, the main issues and potential environmental
risks as they relate to environmental geochemistry are outlined.
Site Description
The Los Azules Copper Project is in the Calingasta
department of San Juan province, Argentina. The Project is located within the Blanco River basin, which is one of the tributaries of the
San Juan River. The main mine site facilities that should be assessed with respect to ARDML risks include:
| · | North Mine Rock Storage Facility and South Mine Rock Storage Facility |
| 17.2.1.1 | Baseline Hydrochemistry and Applicable Water Quality Standards |
Hydrochemical monitoring of surface and groundwater
in tributaries and monitoring wells in and around the Project area has been undertaken by the Instituto de Investigaciones Hidraulicas
(Institute of hydraulic investigations) (IDIH) (IDIH, 2022). Previous monitoring campaigns have been undertaken in 2011 and in 2007-2008.
The Project’s monitoring network comprises 30 surface points, seven (7) groundwater points and eight (8) points for bacteriological
monitoring.
| 17.2.1.2 | Water Quality Standards |
One of the main objectives of the environmental
geochemistry program will be to estimate contact water chemistry and the water chemistry that may be discharged from the site to the environment,
or that may migrate from the site as seepage in groundwater and that may report to environmental receptors. The estimates of contact water
chemistry will be compared to baseline water quality results for the receiving waterbodies and will also need to be assessed against appropriate
water quality objectives to assess whether the mine contact waters could present a potential risk to the environment.
| Project Los Azules – S-K 1300 Technical Report Summary | Project No.: 21139-01 | 17-248 |
It is currently assumed that the water quality
objectives for discharge of mine contact waters will adopt the San Juan province water quality standards (Table 17.2), as established
in Decree No. 1.426 Law No. 24.585 The San Juan province water quality standards comprise four different standards: for human consumption;
aquatic life in fresh surface water; crop irrigation; and for stock drinking water. For total iron, the law does not define guide values;
however, the Argentinean Food Code No. 18284 and its Article 982 modification defines the tolerable limit for drinking water to be 0.3
mg/l.
The specific water quality standards that will
apply to the mine contact waters will be dependent upon the established used of the water and should be evaluated further and discussed
and agreed in consultation with the appropriate regulators.
| Table 17.2: Water Quality Standards from Decree 1.426 Law 24.585 |
| Parameter |
Unit |
Sources of
water for
human
consumption |
For protection
of aquatic life
in fresh
surface water |
For irrigation |
For stock
Drinking
water |
| pH |
pH units |
6.5 - 8.5 |
6.5 - 9.0 |
6.5 - 8.5 |
6.5 - 8.5 |
| Total Dissolved Solids (TDS) |
mg/l |
1000 |
1000 |
1000 |
1000 |
| Aluminium |
mg/l |
0.2 |
- |
5 |
5 |
| Antimony |
mg/l |
0.01 |
0.016 |
- |
- |
| Arsenic |
mg/l |
0.05 |
0.05 |
0.1 |
0.5 |
| Barium |
mg/l |
1 |
- |
- |
- |
| Boron |
mg/l |
- |
0.75 |
0.5 |
5 |
| Beryllium |
mg/l |
0.000039 |
- |
- |
0.1 |
| Cadmium |
mg/l |
0.005 |
0.0002 |
0.01 |
0.02 |
| Cyanide |
mg/l |
0.1 |
0.005 |
- |
- |
| Zinc |
mg/l |
5 |
0.03 |
2 |
0.05 |
| Cobalt |
mg/l |
- |
- |
0.05 |
1 |
| Copper |
mg/l |
1 |
0.002 |
0.2 |
1 |
| Chromium |
mg/l |
0.05 |
0.002 |
0.1 |
1 |
| Chromium (hexavalent) |
mg/l |
0.05 |
- |
- |
- |
| Fluoride |
mg/l |
1.5 |
- |
1 |
1 |
| Mercury |
mg/l |
0.001 |
0.0001 |
0.002 |
0.002 |
| Manganese |
mg/l |
- |
0.1 |
- |
- |
| Molybdenum |
mg/l |
- |
- |
0.01 |
0.5 |
| Nickel |
mg/l |
0.025 |
0.025 |
0.2 |
1 |
| Nitrate |
mg/l |
10 |
- |
- |
- |
| Nitrite |
mg/l |
1 |
- |
- |
- |
| Project Los Azules – S-K 1300 Technical Report Summary | Project No.: 21139-01 | 17-249 |
| Table 17.2: Water Quality Standards from Decree 1.426 Law 24.585 |
| Parameter |
Unit |
Sources of
water for
human
consumption |
For protection
of aquatic life
in fresh
surface water |
For irrigation |
For stock
Drinking
water |
| Gold |
mg/l |
1 |
- |
- |
- |
| Palladium |
mg/l |
- |
- |
5 |
- |
| Silver |
mg/l |
0.05 |
0.0001 |
- |
- |
| Lead |
mg/l |
0.05 |
0.001 |
0.2 |
0.1 |
| Selenium |
mg/l |
0.01 |
- |
0.02 |
0.05 |
| Uranium |
mg/l |
0.1 |
0.02 |
0.01 |
0.2 |
| Vanadium |
mg/l |
- |
0.1 |
0.1 |
0.1 |
Mine Facility Geoenvironmental Conceptual Models
Interaction of exposed mined materials with precipitation
(as rain or snowmelt) and other contact waters can release solutes that will determine the contact water chemistry released from each
of the mine waste facilities. Release of contact waters into the environment with elevated solute concentrations has the potential to
impact on local water quality.
The climate and water demand for the process feed
materials is such that water availability may constrain mine production, and it is likely that water management during operations will
seek to re-use and re-circulate as much water as possible. Therefore, the surface discharge of mine contact waters to the environment
may be limited, although potential seepage of contact waters to groundwater will need to be considered.
Post-closure, there is the potential that contact
waters could discharge to the environment as run-off or seepage to groundwater. Contact waters could be associated with any mine facilities
and include the Mine Rock Facilities, the open pit, and the heap leach pad. For this Initial Assessment, conceptual models for these components
have been developed based on SRK’s experience of similar projects, using available design details and knowledge of the general site
conditions based on background information.
Overall, the composition of contact waters is
complex and influenced by a range of factors. These include:
| · | Geochemical weathering behavior of the rock materials based on the mineralogy. |
| · | Temperature effects that influence reaction rates. |
| · | Particle size distribution of the rock material that will influence the exposed reactive surface area
of the materials. |
| · | Rainfall and hydrology that will dictate the water flow and the degree of contact/flushing of the weathering
products form zones within the waste rock, with some zones being regularly flushed by water and some zones being effectively isolated
from mobile water. |
Geoenvironmental conceptual models are presented
to highlight the main environmental risks associated with the main mine waste facilities and ARDML.
| Project Los Azules – S-K 1300 Technical Report Summary | Project No.: 21139-01 | 17-250 |
Geochemical Characterization
SRK Geochemists Rob Bowell and Brooke Clarkson
visited the Los Azules core warehouse facility in Calingasta, November 7-9, 2022, and were accompanied by Hugo Bracamonte from McEwen
Copper. The focus of the visit was to examine the drill core from the intervals selected for geochemical characterization. Field logging
included a description of the lithology, alteration, mineralogy, and structure. Abundance of key mineral species, i.e., sulfides and sulphates,
was approximated based on volumetric percentages visible in hand sample. Information from the detailed review of mineralogy related to
alteration and copper mineralization will be applied to interpret the results of geochemical characterization test work. All available
core intervals were photographed wet for later reference.
In addition to reviewing the core samples selected
in August 2022 for the first phase of geochemical characterization, additional samples were targeted to represent all material types predicted
in the conceptual pit design. The main gap in the Phase 1 sample group was the volcanic lithology and was addressed with additional samples
selected from available core. The rest of the additional samples were selected to fill spatial gaps or to capture the variability within
each material type.
Geochemical characterization with respect to ARDML
is currently ongoing. SRK is completing sample selection and collection over several phases. For all phases of sampling, consideration
was given to the main zones of lithology, alteration, and mineralization that define the material types within the open pit, as waste
rock and process feed material as follows:
| · | Lithologies – three main lithology groups were considered, as unconsolidated sediments (Cover or
Overburden), Volcanics including andesite, dacite, and rhyolite, and the porphyry complex including dacite porphyry (dacp), diorite (dio),
magnetite hydrothermal breccia (mag), porphyritic diorite (pordio), and rhyodacite porphyry (rydacp). |
| · | Alteration – in the porphyry complex, chlorotic and sericitic alteration are the dominant alteration
types, with minor amounts of potassic, phyllic, and silicic alteration. |
| · | Mineralization – five main zones of mineralization have been considered, including the leached cap
(LIX, Lixivada), a zone between the leached cap and Supergene zone (MIX), Enriched Supergene zone (SG or ENR), a transitional zone (TR)
between Supergene and Hypogene zones, and a Primary (PRI, Hypogene) zone. |
The cut-off copper-grade used to define waste
rock was 0.2 weight % copper. The first phase of sample collection was undertaken in August 2022 when a total of 65 samples were collected.
A further phase of sample selection and collection
is currently underway. This includes for the collection of an additional 143 samples which will undergo the same test work as specified
above and fills in data gaps identified in the Phase 1 samples, as well as lateral and vertical variability of the main rock types in
the proposed pit.
| Project Los Azules – S-K 1300 Technical Report Summary | Project No.: 21139-01 | 17-251 |
Future Workplan
Laboratory Testing
The first phase of samples has been completed
and much of the analysis of those samples is complete. Additional sampling has been conducted and sample collection continues, with additional
mine rock and process feed material samples currently being collected for geochemical testing. In general, all future samples will undergo
the following test work:
| · | Acid base accounting (ABA). |
| · | Net acid generation (NAG) testing. |
| · | Whole Rock Analysis/Multi-element analysis that includes 4-acid digestion followed by inductively coupled
plasma mass spectrometry (ICP-MS). Note, that results of this testing have yet to be received for any samples. |
It is also proposed that a sub-set of samples
will undergo the following test work:
| · | Shake Flask Extraction (SFE) or Meteoric water mobility procedure (MWMP – E2242-13) testing |
Overall, the sample numbers for the additional
testing are subject to change as the geochemical characterization is still in its preliminary stages. A similar approach will be applied
to tailings or to heap leach residues, dependent on the process route adopted. The samples for this would be taken from metallurgical
programs, although it may be appropriate to use process feed samples as analogues for process tails. This approach will be finalized during
the next stage of planning for the geochemical testing.
Numerical Predictions
Numerical predictions of contact water quality
will be carried out for the various mine waste facilities, combining mine site development and water balance information as well as any
additional geochemistry during the FS.
The predictions will allow assessment of the potential
impact of the mine facilities on surface water and groundwater receptors. The resulting model outputs will be compared to environmental
water quality criteria to determine if a potential impact will result from the mining activities and proposed closure scenario.
The geochemical modelling process will involve
a series of solution mixing, chemical reactions, and mineral surface adsorption steps to predict the surface water and groundwater composition
at selected locations. The United States Geological Survey (USGS) geochemical code PHREEQC (Parkhurst and Appelo, 2010) will be used for
all geochemical speciation, mixing, and reaction calculations conducted for this assessment.
The results of the impact assessment will be used
to identify management methods to mitigate against potential negative impacts that have been identified for the Los Azules Project and
particularly interaction with district wide water resources.
| Project Los Azules – S-K 1300 Technical Report Summary | Project No.: 21139-01 | 17-252 |
Summary of Geoenvironmental Risk
The main geochemical risk associated with the
Los Azules Project is the potential generation of acidic, metal, and sulfate-rich waters from surficial mine rock storage facilities and
subsequent migration to surface water and/or groundwater environments. Specific to each mine facility, the main risks are:
| · | Mine Rock Storage Facilities – potential for ARD and ML as seepage to ground and surface waters
during operations and post-closure. |
| · | Open pit – potential for ARD and ML to impact the quality of water pumped from the open pit during
operations. Post-closure, there is the potential for a pit lake to be impacted by ARD and ML. |
| · | Low grade process stockpile - potential for ARD and ML as seepage to ground and surface waters during
operations. Unlikely to be an issue post-closure on the assumption that a low-grade material stockpile will have been processed. |
| · | Heap leach pad – Pregnant Leach Solution during operations will be captured for processing. Post-closure,
the solute inventory will need to be reduced and measures put in place to prevent any discharge of acidic and/or high solute load solutions
from discharging to the environment until the acidity and solute loads reduce to appropriate levels. |
Initial indications for process feed and mine
rock samples are:
| · | Process feed material – limited acid generation from oxidized and enriched process materials but
the primary process materials have a high potential for acid generation. The extension of this is that with little buffering in the process
feed material, the heap may have some potential for acid generation, but it is likely higher in the tailing’s material. |
| · | Mine rock material - although some mined rock lithologies have potential for acid generation, reactivity
is low and so any acid generation is likely to occur after some time, potentially decades (based on experience elsewhere) into the future,
such that acid generation and potential metal leaching are more likely issues for closure rather than operations for the pit and waste
rock. Much of the mined rock can be classed as non-acid generating in potential but have limited buffering capacity so perhaps best termed
inert. These materials could potentially be used in construction on site. |
The potential risks identified will be assessed
through ongoing geochemical characterization test work and numerical predictive geochemical modelling. Risks that are identified will
then be used to inform the design process and mine planning to include appropriate mitigation measures.
| 17.3 | ENVIRONMENTAL MANAGEMENT AND MONITORING PLANS |
The environmental management and monitoring plans
required to protect the biophysical and social environments are identified in the Fifth Environmental Impact Assessment Update (EIA) prepared
for the project by Ausenco and approved by Resolutions No. 317-MM-2021 and No. 352-MM-2021 issued by the provincial mining authority.
It is anticipated that detailed environmental management plans will be required for future Project planning and development. Protection
measures are identified in the EIA for the following activities or facility/equipment operation:
| · | Development and operation of access roads, tracking and drill rigs. |
| · | Development and operation of camp facilities. |
| Project Los Azules – S-K 1300 Technical Report Summary | Project No.: 21139-01 | 17-253 |
| · | Vegetation and wildlife. |
| · | Protection of Sites/Areas of Cultural and Natural Heritage. |
| · | Operation of Machinery and Equipment. |
Project permitting is addressed in Section 3.8.
The Project is in the Province of San Juan and
the Department (municipality) of Calingasta. The Department of Calingasta consists of three principal communities: Barreal, Villa Calingasta,
and Tamberías. Their combined population was estimated at 9,641 in 2022. The population of the capital, San Juan, was estimated
at 526,000 (INDEC, 2015) based on the 2010 census, and projected population growth.
The local economies of Barreal, Calingasta, and
Tamberías are based on tourism, mining, and agricultural, respectively, although tourism is quickly increasing its contribution
to the local economies.
The Province of San Juan and the Department of
Calingasta have benefited substantially from the exploration and initial development of various large mining projects and thus remains
strongly pro-mining as mine development and exploration continues in the area. No organized anti-mining or anti- development groups or
organizations were identified by the Los Azules team in the Department of Calingasta.
The 2011 study conducted by Asesoría Ambiental
found that there was a broad appreciation for mining as the principal economic activity of the region at the time and the main driver
of economic growth. Most people interviewed during this study were generally supportive of mining development with favorable expectations
for the future economic development of the region. There has not been any additional social or community work completed since the 2011
study for the Project (pers comm. McEwen Mining).
Introduction
The general guidelines for the closure of the
Los Azules Project are presented below. The Closure Plan (CP) has been developed in accordance with the current level of development and
knowledge of the Project. It discusses activities to achieve physical and chemical stability and considers the future use of the land
after completion of mining and processing activities. The philosophy of the closure plan considers permanent McEwen Copper involvement
during the development of the closure and post-closure of the project.
Early closure design and planning is considered
of paramount importance to ensure that the environmental and social objectives defined for closure and post-closure are met. Early development
of rehabilitation and closure strategies at the conceptual level is a stage of overall Project planning and provides the basis for increased
development of rehabilitation and closure strategies as the Project progresses and the end of operation approaches.
| Project Los Azules – S-K 1300 Technical Report Summary | Project No.: 21139-01 | 17-254 |
The CP will be updated with each subsequent phase
of the project to validate the assumptions on which this CP is based, and to incorporate further project details and/or modifications
as they become available, considering the increased knowledge of environmental effects because of project operation and scientific and
technological advances associated with mine closure.
The main components of the Los Azules Project
are as follows:
| Table 17.3: Project Facilities |
| Type of facility |
Facility / components |
| Mine facilities |
Pit
Mine Rock Storage Facilities (MRSF)
Stockpile |
| Processing facilities |
Heap Leach Facility
Crusher system
Process plant |
| Ancillary and support facilities |
Camp
Site roads and Airstrip
Power line and substations
Maintenance Workshop and Warehouse
Fuel Tanks and Fuel Loading Facilities
Services (Water, Sewage effluents) |
Objectives
The overall objective of closure is to ensure
long-term physical and chemical stability, establishing a safe, stable, and predictable condition, capable of mitigating the changes and
impacts generated by the operation of the project, with low or no maintenance required after post-closure. In this sense, the Closure
Plan is intended to improve, in its post-closure stage, the environmental conditions generated during the operation of the Mine, with
a view to achieving an environmental condition compatible with the surroundings, in a manner consistent with traditional land uses.
The closure plan considers a "closure"
stage, which is related to the execution of the closure measures and actions, and a post-closure stage, which contemplates a period of
active monitoring and maintenance of the closure works and environmental conditions, with an assessment of the environmental performance
and the effectiveness of the closure measures implemented, and if necessary, the establishment of corrective actions.
For this purpose, the following closing and post-closing
objectives have been defined:
| · | Comply with environmental obligations, international standards, and applicable legislation. |
| · | Protect human health and the environment. |
| · | Recondition the mine site considering the traditional use of the land. |
| · | Develop, during the operation of the project, the progressive rehabilitation of the facilities that have
reached the end of their useful life. |
| Project Los Azules – S-K 1300 Technical Report Summary | Project No.: 21139-01 | 17-255 |
| · | Rehabilitate disturbed areas to achieve long-term physical and chemical stability, including revegetation
with native species (wherever possible). |
| · | Restore natural surface water drainage in disturbed sectors. |
| · | Eliminate or minimize requirements for active site care and maintenance during the post-closure period
(e.g., water treatment). |
| · | Develop closure plans that include information obtained from public consultations with local communities
and regulatory authorities. |
| · | Minimize local and regional socio-economic impacts. |
| · | Optimize closure and post-closure costs. |
Standards and Regulations
In the province of San Juan, there is no mine
closure legislation, and the province does not adhere to the National regulation - Res. 161/2021- General Guidelines for Mine Closure
with Financial Guarantees in the Argentine Republic.
In this sense, the applicable legal framework
is mainly provided by Law No. 24,585 on Environmental Protection for Mining Activities, incorporated to the National Mining Code under
Title XIII, Section 2, which establishes in its Article 4 that the activities included in this Title correspond to: a) prospecting, exploration,
exploitation, development, preparation, extraction, and storage of mineral substances covered by the Mining Code, including all activities
aimed at mine closure. Annex III establishes that the Environmental Management Plan must include actions related to: "cessation and
abandonment of exploitation and post-closure monitoring of operations." Provincial Law No. 6,571, on Environmental Impact Assessment,
as amended by Provincial Law No. 6,800, is also applicable.
The Los Azules Project Conceptual Closure Plan,
and its future updates, will be based on provincial and national legislation, international standards, and guidelines (ICMM - IFC, among
others), McEwen Copper policies and standards, and industry best practices.
Geo-Environmental Risk
The development of this section is based on the
information prepared by SRK Consulting (UK) Limited - Geochemical Environmental Evaluation of the Los Azules Copper Project– External
Memorandum, November 2022.
In general terms, there is the potential for acid
rock drainage (ARD) generation. Reactivity is expected to be slow, with a potential for long-term acid generation, indicating that ADR
is more likely to have an effect during closure and post-closure rather than during project operation.
The main geochemical risk associated with the
Los Azules Project is the potential generation of acidic, metal, and sulfate-rich water from surface waste rock storage facilities and
its subsequent migration to surface and/or groundwater environments. Specifically, for each mining facility, the main risks are:
| · | Mine Rock Storage Facilities (MRSF): potential for Acid Rock Drainage (ARD) and Metal Leaching (ML) in
the form of seepage to groundwater and surface water during operations and after closure. |
| Project Los Azules – S-K 1300 Technical Report Summary | Project No.: 21139-01 | 17-256 |
| · | Open Pit: The potential for ARD and ML to affect the quality of water pumped from the open pit during
operations. After closure, there is the potential for the pit lake to be affected by ARD and ML. |
| · | Low-grade process stockpile: potential for ARD and ML in the form of seepage to ground and surface water
during operations. This is unlikely to be a problem after closure assuming that the low-grade material stored in the stockpile will have
been processed. |
| · | Heap Leach Facility: The pregnant leach solution during operations will be captured for processing. After
closure, it will be necessary to reduce the solute inventory and take measures to prevent any discharge of acidic and/or high solute laden
solutions to the environment until the acidity and solute load levels are reduced to adequate levels. |
| · | Initial observations of the process feed and mine rock samples are: |
| o | Process feed materials: limited acid generation from oxidized and enriched ores, but primary mineralization material has high acid
generation potential. |
| o | Mine rock: although some mine rock lithologies have acid generation potential, reactivity is low and therefore any acid generation
is likely to occur after some time, potentially decades into the future (based on experience elsewhere). Therefore, acid generation and
potential metal leaching are more likely issues for closure than for pit and mine rock operations. |
Future studies
Potential risks identified will be evaluated by
means of geochemical characterization tests and predictive geochemical numerical models.
Closure Considerations / Criteria
Physical Stability
Post-closure, the remaining facilities (pit, mine
rock storage facilities, heap leaching facility) will be physically stable in the long term, meeting international standards.
Chemical Stability
Air, surface water, and groundwater quality after
post-closure will not be affected and will reach a condition like that described during the environmental baseline, prior to the operation
of the Project.
The contact of natural runoff water with any remaining
facilities will be avoided by means of a differential management system for contact and non-contact water. In the event of contact water
drainage, the water will be captured and stored in evaporation pools, with no discharge to the environment.
The heap leach facility will be detoxified to
a concentration of 0.5 mg/l of WAD cyanide in the drainage effluent, in line with international standards (International Finance Corporation,
International Cyanide Management Institute).
Hydrological Stability
A differential water management system will be
implemented for contact and non-contact water. Surface water flows coming from upstream the facilities will be diverted through open channels
to prevent them from entering any remaining project facilities (pit, mine rock storage facilities, and heap leach facility), without altering
the quantity of drainage water coming from upstream, or the natural hydrochemical quality of the water.
| Project Los Azules – S-K 1300 Technical Report Summary | Project No.: 21139-01 | 17-257 |
Contamination Control
Measures will be taken to ensure that the rehabilitation
works of the disturbed areas will be based on technically effective and proven engineering practices, efficient methods, and ecologically
appropriate practices. Soil affected by contaminants (chemicals and hydrocarbons) will be disposed of as hazardous waste by an authorized
operator/processor, in accordance with the Mine's waste management plan.
Revegetation
Techniques will be implemented to facilitate natural
revegetation using native species in the affected areas. The methodology to be used will be analyzed and defined in subsequent studies.
Landscape
Efforts will be made to ensure that the final
landscape and ecosystem conditions are like those of the surrounding natural landscape. Disturbed areas will be re-profiled and/or graded
to restore the natural conditions of the site.
Waste Management
Urban solid waste will be disposed of off-site
at a facility designated for this purpose, with no waste remaining in the mine area after closure.
Non-hazardous waste will be disposed of in accordance
with the mine's waste management plan, with no waste to be left in the area after closure.
Hazardous wastes and chemical agents and reagents
from the operation will be disposed of off-site by an authorized operator.
Dismantling and Demolition of Infrastructure
and Equipment
Machinery and equipment, including mobile equipment,
conveyor belts, pumps, processing equipment and other equipment, will be decontaminated and washed, and subsequently dismantled. In the
case of equipment and machinery with future usability, McEwen Copper might choose to sell and/or use them for other projects, or else
transfer them to other interested parties. Equipment with no future usability could be sold as scrap or disposed of as waste in accordance
with the mine's waste management plan.
All the Project's surface facilities will be dismantled/demolished
and surfaces graded. The dismantling and demolition of the structures will be carried out in accordance with the environmental, health,
and safety measures in force, seeking the commercialization (reuse) of those elements that do not represent a risk to human health or
the environment, if feasible.
Monitoring and Maintenance
For the post-closure period, compliance with the
site's maintenance and environmental monitoring plan will be ensured, considering a term of at least 10 years, or until closure objectives
and physical and chemical stability are achieved.
| Project Los Azules – S-K 1300 Technical Report Summary | Project No.: 21139-01 | 17-258 |
The maintenance plan will be geared towards verifying
the correct functioning of the works and closure measures.
Closure Strategy
The following closure and rehabilitation strategy
has been developed at a conceptual level. Final closure activities will commence upon completion of processing for economic purposes.
The closure strategy will be carried out considering the following stages:
| · | Progressive Rehabilitation Stage: This stage will be developed during the operation stage of the project
and includes the closure of the facilities that have reached the end of their useful life, or of the disturbed areas in disuse. |
| · | Final Closure Stage: This stage is developed at the end of the operation stage when economic processing
is completed. It comprises the closure of all the Project facilities not included in the progressive closure. |
| · | Post-closure stage: This stage involves monitoring and checking compliance with closure objectives and
the effectiveness of closure measures, identifying deviations from the objectives to adjust closure measures as required. |
Details of the progressive closure plan, and the
closure and post-closure monitoring and maintenance plan will be covered in the CP updates.
Temporary Closure
Temporary closure of the project could occur because
of various factors, such as: metal prices, policy changes, judicial or administrative actions, or other unforeseen events. This will be
a period whose duration is variable but not indefinite, because when conditions are favorable, project operation will be reactivated.
Otherwise, measures will be taken to move forward with final closure.
The objectives of the temporary closure should
be to minimize environmental and social impacts, maintain the project's infrastructure in good condition, comply with environmental and
social commitments and obligations, maintain environmental permits in force, and comply with applicable regulations.
Final Closure – Closure Measures
Closure measures are intended to achieve long-term
physical and chemical stability. The designs of the remaining facilities (pit, mine rock storage facilities, heap leach facility) are
deemed to be designed to be physically stable over the long term; however, a stability verification process will be carried out considering
the final topography of the construction of these facilities, considering the closure criteria defined based on international standards.
An ongoing maintenance plan will be required to
ensure that all enclosed facilities and closure works perform to their design and specifications.
Removal of infrastructure and rehabilitation of
these areas will occur once economic processing activities have been completed. CP updates will provide revegetation studies with native
species and methodological alternatives to be used in the rehabilitation of these enclosed facilities /areas.
| Project Los Azules – S-K 1300 Technical Report Summary | Project No.: 21139-01 | 17-259 |
Whenever possible, priority will be given to the
sale of equipment and components with resale value; otherwise, they will be sold as scrap or disposed of off-site at an authorized facility.
Post Closure Monitoring and Maintenance
The purpose of the monitoring and maintenance
plan is to verify the correct operation of the closure measures and compliance with the closure and post-closure objectives, and to identify
potential deviations to make early adjustments to the closure measures and works. A period of 3 years has been considered for closure
monitoring and maintenance and 10 years for the post-closure stage, or until physical and chemical stability is demonstrated for the long
term, in accordance with established closure objectives.
Progress reports on the closure and rehabilitation
program, including the results of environmental and engineering monitoring, will be submitted to the Enforcement Authority in accordance
with the requirements of the Resolutions or conditions included in the Environmental Impact Statement ("DIA") approving the
Project and its subsequent updates.
| Project Los Azules – S-K 1300 Technical Report Summary | Project No.: 21139-01 | 17-260 |
| 18.0 | capital and operating costs |
| 18.1 | capital cost estimation |
This section describes the basis of estimate preparation
for McEwen Copper’s Los Azules Project in the San Juan Province of Argentina. The Project includes the development of an open pit
mine with multi-stage crushing and screening, a heap leach pad, and a copper solvent extraction-electrowinning facility capable of processing
a Base Case 175,000 tpa. There is also a sulfuric acid plant and other associated infrastructure to support the operations, and in general
it includes the following facilities:
| · | Mine development and associated infrastructure |
| · | Coarse Process Storage and Handling (Crushing, Conveying, Agglomeration) |
| · | Heap Leach Pads and Conveyor Stacking Systems |
| · | Solvent Extraction-Electrowinning (SX/EW) Facility |
| · | On-Site Utilities and Ancillary Facilities including a Construction Camp |
| · | Off-Site Infrastructure: Power Transmission Line, Access Roads, and Permanent Camp |
The Project initial capital costs are based on
budgetary cost quotations estimates for major equipment, recent in-house cost information and installation factors, and regional contractor
and facilities obtained between Q4 2022 and Q1 2023. The capital costs for the Project are summarized below and should be viewed with
an expected level of accuracy for a preliminary analysis at +40%/-20% consistent with AACE International Recommended Practice No. 47R-11
Estimate Class 5. The initial project development capital costs for the Base and Alternative case options are summarized in Table 18.1.
| Table 18.1: Initial Capital Costs |
| Capital Cost Level 1 Summary |
Base Case 175 ktpa Cu |
| WBS Area |
Total (USD) |
| 100 - Mining |
$65,600,000 |
| 200 - Ore Storage & Handling |
$234,500,000 |
| 400 - Heap Leaching |
$158,500,000 |
| 500 – SX/EW Facilities |
$250,400,000 |
| 600 - Acid Plant |
$94,900,000 |
| 800 - Ancillary Facilities |
$23,300,000 |
| 900 - Site Development & Yard Utilities |
$126,700,000 |
| 2000 - OffSites |
$167,400,000 |
| Direct Costs |
$1,121,200,000 |
| Field Distributable & Services |
$17,915,000 |
| Construction Services |
$67,270,000 |
| Construction Camp & Services |
$78,093,000 |
| Freight |
$45,847,000 |
| EPCM Services |
$170,204,000 |
| Project Los Azules – S-K 1300 Technical Report Summary | Project No.: 21139-01 | 18-261 |
| Table 18.1: Initial Capital Costs |
| Capital Cost Level 1 Summary |
Base Case 175 ktpa Cu |
| WBS Area |
Total (USD) |
| Common Indirects |
$379,329,000 |
| Mine Equipment |
$190,471,000 |
| Mine Pre-Stripping |
$157,017,000 |
| Owners Other Costs |
$106,531,000 |
| Owners Cost |
$454,018,000 |
| Subtotal |
$1,954,515,000 |
| Contingency |
$493,663,000 |
| Total Capital Cost |
$2,448,178,000 |
As a recommended practice of The Association for
the Advancement of Cost Engineering (AACE) International, the Cost Estimate Classification System provides guidelines for applying the
general principles of estimate classification to project cost estimates. The capital cost is a Class 5 Order of Magnitude estimate as
defined by the AACE guidelines. Typical accuracy ranges for AACE International Class 5 estimates are -20% to -50% on the low side, and
+30% to +100% on the high side, depending on the complexity of the project.
The estimate is expressed in first quarter 2023
United States dollars and all references herein are in USD. Due to the extended nature of the study budgetary pricing ranged from third
quarter 2022 to second quarter 2023. No provision has been included to offset future escalation.
Most costs and equipment estimates were provided
on a USD basis. Where source information was provided in other currencies, these amounts have been converted at the following rates:
| · | 1 USD = 0.97 Euros (EUR) |
| · | 1 USD = 1.33 Canadian Dollar (CAD) |
| · | 1 USD = 0.81 British Pounds (GBP) |
Exclusions
Items not included in the capital estimates are
as follows:
| · | YPF Luz 220 kV power supply to site (powerline, related substations) |
| · | Sunk costs (costs prior to start of detailed design) |
| · | Permitting cost prior to detail design (costs for EIA/IIA submittal are sunk) |
| · | License and royalty fees for any technology or equipment considered |
| · | Allowance for special incentives (schedule, safety, etc.) |
| · | Interest and project financing costs |
| · | Salvage cost credits for equipment or materials |
| Project Los Azules – S-K 1300 Technical Report Summary | Project No.: 21139-01 | 18-262 |
Sustaining Costs
Sustaining capital is the periodic addition of
capital that is required for equipment purchases or construction of additional facilities required to maintain operations (outside of
the normal day-to-day operations and maintenance costs).
These capital costs, which will be incurred during
years when the plant is operational are not included in the initial capital cost estimate but are included with the economic model in
the years that the costs are anticipated to occur for the purpose of calculating the overall economic benefits of the Project.
The sustaining capital plan for the Base Case
and Alternative Case projects is presented below in Table 18.2
| Table 18.2: Base Case Sustaining Capital Plan |
| Description |
175 ktpa HG w/
YPF HV Financing |
| Mining Fleet Equipment Capital |
|
| Mine Fleet Augmentation - Year 1 |
$74,794,000 |
| Mine Fleet Augmentation - Year 2 |
$12,361,000 |
| Mine Fleet Augmentation - Year 3 |
$63,207,000 |
| Mine Fleet Augmentation - Year 4 |
$44,013,000 |
| Mine Fleet Augmentation - Year 5 |
$21,759,000 |
| Mine Fleet Augmentation - Year 6 |
$25,646,000 |
| Mine Fleet Augmentation - Year 7 |
$23,632,000 |
| Mine Fleet Augmentation - Year 8 |
$13,716,000 |
| Mine Fleet Augmentation - Year 9 |
$760,000 |
| Mine Fleet Augmentation - Year 10 |
$618,000 |
| Mine Fleet Augmentation - Year 11 |
$- |
| Mine Fleet Augmentation - Year 12 |
$- |
| Mine Fleet Augmentation - Year 13 |
$11,085,000 |
| Mine Fleet Augmentation - Year 14 |
$6,065,000 |
| Mine Fleet Augmentation - Year 15 |
$1,539,000 |
| Mine Fleet Augmentation - Year 16 |
$12,600,000 |
| Mine Fleet Augmentation - Year 17 |
$1,903,000 |
| Mine Fleet Augmentation - Year 18 |
$- |
| Sustaining Mine Fleet |
$313,697,000 |
| Heap Leach Pad |
|
| HLP - Phase 2 |
Initial Capex |
| HLP - Phase 3 |
$71,182,000 |
| HLP - Phase 4 |
$82,442,000 |
| HLP - Phase 5 |
$59,096,000 |
| HLP - Phase 6 |
$50,401,000 |
| Project Los Azules – S-K 1300 Technical Report Summary | Project No.: 21139-01 | 18-263 |
| Table 18.2: Base Case Sustaining Capital Plan |
| Description |
175 ktpa HG w/
YPF HV Financing |
| HLP - Phase 7 |
$41,851,000 |
| HLP - Phase 8 |
$55,071,000 |
| Subtotal Heap Leach Pads |
$360,043,000 |
| Processing Facilities |
|
| Acid Plant Expansion |
$174,443,000 |
| Crushing Plant Expansion |
$352,582,000 |
| Stacking System Expansion |
$80,191,000 |
| Acid Plant Expansion |
$174,443,000 |
| Crushing Plant Expansion |
$76,817,000 |
| Acid Plant Expansion |
$115,089,000 |
| SX Train |
$37,219,000 |
| Subtotal Process Facility Expansions |
$1,010,784,000 |
| “Regeneration Green Design” Permanent Camp |
$ 193,375,000 |
| TOTAL SUSTAINING COSTS |
$1,877,899,000 |
| 18.2 | Project Development Execution Plan And Schedule |
The Los Azules Project execution plan and schedule
is based on an Engineering, Procurement, & Construction Management (EPCM) execution approach allowing for multiple specialty and local
contractors to be considered. Argentina has construction companies that have constructed significant industrial facilities and heap leach
pads and that are familiar with the Project location and environment.
The initial project development is expected to
take approximately 33 months to mechanically complete from notice to proceed and point of project financing. Construction development
will prioritize the initial leach pad and ponds, crushing, and stacking systems to facilitate the placement of leach materials on the
pad during pre-striping and prior to starting the rest of the facilities start. Ramp up to full leaching capacity is expected to take
six to nine months from plant start-up, and placement of mineralized material on the pad with commercial production of copper from the
SX/EW plant is expected to be achieved in approximately 12 months from start of leaching. Finalization of the necessary permits to begin
work is expected to be completed during the proposed feasibility study timeframe. Early works will commence, once project funding is available,
with access road upgrades, site preparation, construction infrastructure, and power line.
A nine-month preliminary engineering and construction
period is considered to finalize funding and prepare for long-lead equipment purchase and construction contracts. Early works will commence
with access roads, site preparation, construction infrastructure, and power line development, much of which is initially off-site and
less access and weather dependent.
| Project Los Azules – S-K 1300 Technical Report Summary | Project No.: 21139-01 | 18-264 |
The envisioned construction approach will be a
prime contractor supplemented by local and specialty contractors. A specific contracting plan is not yet developed. Construction considers
development of the necessary temporary infrastructure for the construction activities, and the workforce is expected to peak at 2,300
workers. Off-site pre-assembly and fabrication will be used to the extent possible to minimize the on-site staff in Calingasta.
Figure 18.1 presents a conceptual Project Execution
Schedule based on regional contractor inputs and long-lead equipment and materials delivery assumptions provided by vendors. The schedule
assumes that the feasibility study work is completed as described, finalization of the IIA/DIA permitting process and other necessary
permits to begin work is completed during the proposed feasibility study, and preliminary timeframe and financing is in place to achieve
the schedule milestones.
| Project Los Azules – S-K 1300 Technical Report Summary | Project No.: 21139-01 | 18-265 |
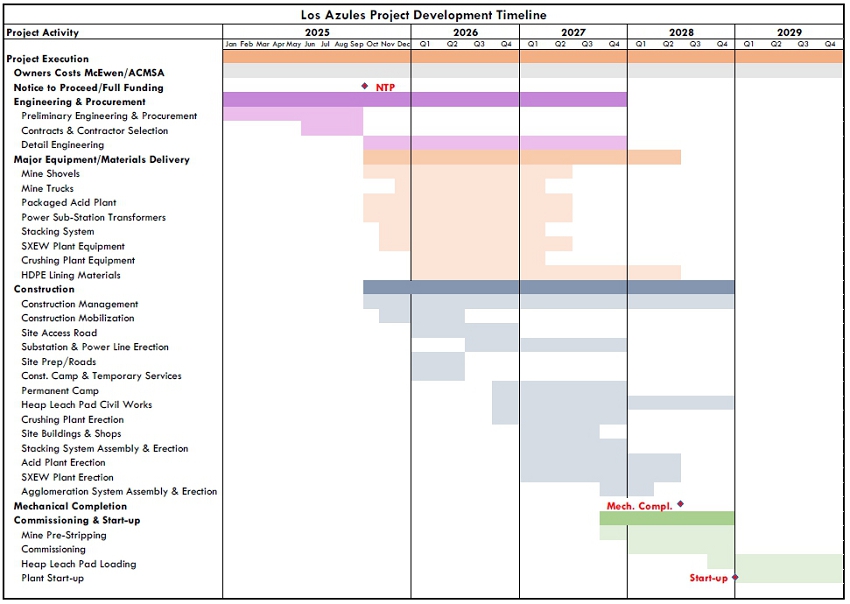
Figure 18.1: Conceptual Project Execution
Schedule
| Project Los Azules – S-K 1300 Technical Report Summary | Project No.: 21139-01 | 18-266 |
The unit processes and equipment considered for
the Los Azules operation are well known and highly developed; however, as an integrated facility, a level of complexity is also understood.
There are no similar plants in Argentina to draw experienced work forces from, although in neighboring Chile and Peru these types of facilities
are common. In terms of a McNulty Curve consideration, it is expected that this facility would fall between a Class 1 or 2 facility for
throughput related aspects, with copper production expectations directly tied to the expected leaching performance assumptions.
| 18.3 | Operating Cost Estimation |
The Project operating costs are summarized in
Table 18.3 for life-of-mine (LOM) values per tonnes of material processed and per pound of copper produced.
| Table 18.3: Life of Mine Operating Cost Summary |
| OPEX SUMMARY |
Life of Mine |
|
175ktpa
Base Case |
125ktpa Alt.
Case |
| Mining OPEX |
Per Eq. Lb Cu |
$/lb Cu |
$0.56 |
$0.57 |
| Per tonnes processed |
$/t |
$4.14 |
$4.27 |
| Processing OPEX |
Per Eq. Lb Cu |
$/lb Cu |
$0.37 |
$0.37 |
| Per tonnes processed |
$/t |
$2.73 |
$2.74 |
| SG&A |
Per Eq. Lb Cu |
$/lb Cu |
$0.15 |
$0.17 |
| Per tonnes processed |
$/t |
$0.94 |
$1.11 |
| TOTAL OPEX (C1 Costs)* |
Per Eq. Lb Cu |
$/lb Cu |
$1.07 |
$1.11 |
| Per tonnes processed |
$/t |
$7.96 |
$8.27 |
*Note: Figures may not add up
exactly due to rounding
Mining Operating Costs
Operating cost estimates for mine equipment were
developed from a combination of data from InfoMine USA, Inc’s CostMine mining cost service and Stantec Consulting International
Ltd. experience on past projects. Labor and fuel rates were applied separately to build up costs specific for Los Azules.
Mine operating costs were built up using hourly
rates for all equipment types, equipment hours, and mined tonnes on an annual basis. Costs included fuel, maintenance, wear parts, maintenance
labor, and operator labor. Diesel fuel price was USD $1.53/l, power costs of $0.065/kWh was provided by Samuel Engineering based on quotes
from YPF, and a fully burdened operator and maintenance personnel cost of USD $50,000 was used to determine a USD cost per operating hour
for each piece of equipment.
Haulage profiles were developed for each period,
and Hexagon’s MSHaulage software was used to determine truck cycle times and subsequently the number of trucks required. Loading
units were determined based on fleet match and productivity calculations and all other equipment was based on standard factors using the
number of operating trucks as a basis.
| Project Los Azules – S-K 1300 Technical Report Summary | Project No.: 21139-01 | 18-267 |
Using fleet operating costs, productivities, and
mine schedule tonnes, this resulted in the following weighted average LOM operating costs for the Base Case option:
| Table 18.4: Mine Operating Costs 175ktpa Base Case |
| Description |
OPEX ($/t) |
| Loading |
0.13 |
| Hauling |
0.81 |
| Drill and Blast |
0.36 |
| Dozing |
0.11 |
| Grading |
0.05 |
| Support Equipment |
0.21 |
| Mining G&A |
0.10 |
| Mine Support Tasks |
0.12 |
| Mining Total |
1.89 |

Figure 18.2: Mine Operating Cost Breakdown
For the Alternative Case, using the same methodologies
for fleet operating costs, productivities, and mine schedule tonnes this resulted in the following weighted average LOM operating costs.
| Table 18.5: Mine Operating Costs 125ktpa Alternative Case |
| Description |
OPEX ($/t) |
| Loading |
0.14 |
| Hauling |
0.81 |
| Drill and Blast |
0.38 |
| Dozing |
0.15 |
| Grading |
0.06 |
| Support Equipment |
0.27 |
| Project Los Azules – S-K 1300 Technical Report Summary | Project No.: 21139-01 | 18-268 |
| Table 18.5: Mine Operating Costs 125ktpa Alternative Case |
| Description |
OPEX ($/t) |
| Mining G&A |
0.11 |
| Mine Support Tasks |
0.13 |
| Mining Total |
2.05 |
Total LOM operating costs ranged from $2.52/t
to $1.36/t. Mine Support Tasks include road building, water pumping, snow clearing, access roads, electrical cable moves, and re-drilling.
Processing Operating Costs
Process operating costs (OPEX) were determined
from first principals, with the following basis:
| · | The exempt and non-exempt labor requirements were provided by McEwen Copper. |
| · | Reagent and fuel pricing costs were obtained by McEwen Copper. |
| · | The electric power cost is the current rate obtained by McEwen Copper from YPF. |
| · | General maintenance supplies were estimated by applying a percentage of the total equipment purchase cost
for a given area. |
| · | Sulfur pricing is based on regional pricing at $315/tonne delivered to site (sulfur-price.com Q4 2022
basis). |
| · | Power generated by the acid plant was used to off-set grid power |
The process operating costs are summarized in
Table 18.6 for life-of-mine (LOM) values on a cost per tonne processed and pound of copper produced basis.
| Table 18.6: Life of Mine Operating Cost Summary |
| Base Case 175 ktpa Cu |
Cost USD |
$/tonne* |
$/lb Cu |
| Labor |
$296,900,000 |
$0.43 |
$0.05 |
| Reagents |
$848,700,000 |
$1.24 |
$0.14 |
| Power |
$352,000,000 |
$0.51 |
$0.06 |
| Maintenance |
$207,400,000 |
$0.30 |
$0.03 |
| Miscellaneous |
$290,100,000 |
$0.42 |
$0.05 |
| Total Processing Costs |
$1,995,100,000 |
$2.91 |
$0.33 |
*Per tonne processed, excluding capitalized preproduction
material placement on leach pad costs
Labor costs are built up from preliminary staffing
plans and include crushing, leaching, SX/EW, and acid plant staffing on 2-week rotation/12-hour shifts for operations and process maintenance
staff, including an allowance for absenteeism. Staffing extends from Plant General Manager level and below only.
Electric power requirements and costs are net of
acid plant generation on site.
Maintenance costs include materials, consumables,
and supplies only, maintenance labor costs are included in the Labor estimates.
| Project Los Azules – S-K 1300 Technical Report Summary | Project No.: 21139-01 | 18-269 |
General & Administrative (G&A) Costs
The General and Administrative (G&A) costs
cover all costs associated with maintaining a regional office in San Juan, a geology and personnel staging area at the existing Calingasta
facilities, and necessary site administration and general services at the Los Azules mine site. Taxes and royalties are included in the
financial model separately from G&A. Labor rates assume Hays PLC 2022 survey data for Argentina and local burdens/on-costs converted
to USD and provided by McEwen Copper.
The overall combined G&A costs estimated for
these areas is approximately $40 million per year with category breakouts provided below in Table 18.7.
| Table 18.7: Consolidated G&A (San Juan, Calingasta, Los Azules Site) |
| |
Annual Costs |
Basis |
| General & Admin Labor |
$12,809,000 |
G&A Staffing Plan - all three sites |
| Materials & Supplies |
|
|
| Admin Supplies |
$144,000 |
Location based allowances |
| Safety & Health |
$192,000 |
Location based allowances |
| Equipment & Materials |
$342,000 |
Location based allowances |
| Utilities |
$264,000 |
Location based allowances |
| Fuel & Transportation |
$1,546,000 |
Staffing plan @ $5/person/day |
| Rent |
$72,000 |
Location based allowances |
| Telecommunications/Internet |
$33,000 |
Location based allowances |
| Insurances |
$60,000 |
Location based allowances |
| Sub-Contracts |
|
|
| Security |
$264,000 |
Location based allowances |
| Waste Management |
$128,000 |
Location based allowances |
| Legal Services |
$300,000 |
Location based allowances |
| Tax & Accounting |
$24,000 |
Location based allowances |
| Advertising & Recruiting |
$6,000 |
Location based allowances |
| Transportation (Buses) |
$3,600,000 |
30 buses @ $10K/month for rotations & site labor distribution |
| Janitorial (non-camp) |
$60,000 |
Location based allowances |
| Sample Transport Services |
$9,000 |
Location based allowances |
| Misc. Services/Maintenance |
$168,000 |
Location based allowances |
| Software & IT |
$1,200,000 |
All locations, $100,000/month |
| Advertising & Recruiting |
$6,000 |
Location based allowances |
| Subscriptions & Services |
$6,000 |
Location based allowances |
| Travel & Entertainment |
$120,000 |
Location based allowances |
| Misc. Operating Expenses |
$120,000 |
Location based allowances |
| Camp Operations |
$18,434,000 |
Based on staffing count @ $65/day/person |
| Consolidated G&A Total |
$39,907,000 |
|
| Project Los Azules – S-K 1300 Technical Report Summary | Project No.: 21139-01 | 18-270 |
Certain information and statements contained in
this section and in the Report are “forward looking” in nature. Forward-looking statements include, but are not limited to,
statements with respect to the economic and study parameters of the Project; Mineral Resource estimates; the cost and timing of any development
of the Project; the proposed mine plan and mining methods; dilution and extraction recoveries; processing method and rates and production
rates; projected metallurgical recovery rates; infrastructure requirements; capital, operating and sustaining cost estimates; the projected
life of mine and other expected attributes of the Project; the net present value (NPV) and internal rate of return (IRR after-tax) and
payback period of capital; capital; future metal prices; the timing of the environmental assessment process; changes to the Project configuration
that may be requested as a result of stakeholder or government input to the environmental assessment process; government regulations and
permitting timelines; estimates of reclamation obligations; requirements for additional capital; environmental risks; and general business
and economic conditions.
All forward-looking statements in this Report
are necessarily based on opinions and estimates made as of the date such statements are made and are subject to important risk factors
and uncertainties, many of which cannot be controlled or predicted. Material assumptions regarding forward-looking statements are discussed
in this Report, where applicable. In addition to, and subject to, such specific assumptions discussed in more detail elsewhere in this
Report, the forward-looking statements in this Report are subject to the following assumptions:
| · | There being no significant disruptions affecting the development and operation of the Project. |
| · | The availability of certain consumables and services and the prices for power and other key supplies being
approximately consistent with assumptions in the Report. |
| · | Labor and materials costs being approximately consistent with the assumptions in the Report. |
| · | Permitting and arrangements with stakeholders being consistent with current expectations as outlined in
the Report. |
| · | All environmental approvals, required permits, licenses and authorizations will be obtained from the relevant
governments and other relevant stakeholders. |
| · | Certain tax rates, including the allocation of certain tax attributes, being applicable to the Project. |
| · | The availability of financing for the planned development activities. |
| · | The timelines for exploration and development activities on the Project. |
| · | Assumptions made in Mineral Resource estimate and the financial analysis based on that estimate, including,
but not limited to, geological interpretation, grades, commodity price assumptions, extraction and mining recovery rates, hydrological
and hydrogeological assumptions, capital and operating cost estimates, and general marketing, political, business, and economic conditions. |
The production schedules and financial analysis
annualized cash flow table are presented with conceptual years shown. Years shown in these tables are for illustrative purposes only.
If additional mining, technical, and engineering studies are conducted, these may alter the Project assumptions as discussed in this Report
and may result in changes to the calendar timelines presented.
| Project Los Azules – S-K 1300 Technical Report Summary | Project No.: 21139-01 | 19-271 |
The Project is at the advanced exploration stage
of investigation; consequently, this study is at the scoping level of accuracy, preliminary in nature, and includes measured and indicated
mineral resources in the conceptual mine plan and the mine production schedule. Inferred mineral resources are considered too speculative
geologically to have the economic considerations applied to them that would enable them to be categorized as mineral reserves under the
standards set forth in S-K 1300. There is no certainty that the results, estimates, or projections in this Initial Assessment will be
realized.
Samuel Engineering has prepared a discounted cash
flow analysis of the Los Azules Project. Technical and cost inputs for the economic model were developed by Samuel Engineering with specific
inputs provided by McEwen Mining. These inputs have been reviewed in detail by Samuel Engineering and are accepted as reasonable.
The discounted cash flow analysis was performed
on a stand-alone project basis with annual cash flows discounted on an end-of-year basis. The economic evaluation used a real discount
rate of 8% and was performed at commencement of construction (denoted as Year minus 3 of the Los Azules Project) using Q1 2023, US dollars.
All costs prior to the start of construction are
considered as “sunk costs” and not considered in the economic analysis.
This economic analysis is a direct result of the
capital cost estimate and is therefore considered to have the same level of accuracy minus 20% to plus 40%.
| 19.3 | Financial Model Parameters |
Technical-economic parameters used in the model
are summarized in the following sections. Table 19.1 presents the model inputs used in the economic analysis based on first quarter, 2023
US dollars.
| Table 19.1: Common Model Inputs |
| Area |
Description |
Units |
Values |
| General |
Tonnes Processed |
M tonnes |
702 |
| Tonnes Waste Mined |
M tonnes |
907 |
| Strip Ratio |
|
1.29 |
| Copper Production – LOM Cu Cathode |
t x 1,000 |
2,721 |
| Nominal Cu Cathode Production |
TPY |
175,000 |
| Construction Period |
Years |
3 |
| Mine Life |
Years |
17 |
| Operating Life |
Years |
18 |
| Closure Duration |
Years |
1 |
| Metal pricing |
Copper price |
US$/lb |
$3.75 |
| Cost criteria |
Estimate basis |
US$ |
first quarter 2023 |
| Inflation/currency fluctuation |
|
None |
| Leverage |
% Equity |
100% |
| Income tax |
Argentina Corporate Income |
% Profit |
35% |
| Project Los Azules – S-K 1300 Technical Report Summary | Project No.: 21139-01 | 19-272 |
| Table 19.1: Common Model Inputs |
| Area |
Description |
Units |
Values |
| Royalties / payments |
San Juan Province |
% “Mine Mouth” |
3% |
| TNR Royalty |
% NSR |
0.4% |
| McEwen Royalty |
% NSR |
1.25% |
| Transportation, smelting, and refining charges |
Brokerage Fee |
US$/lb Copper |
$0.02 |
| Export Retentions |
Argentine Export Retention |
% NSR |
4.5% |
Capital Costs
The total capital cost is estimated at $4.44 billion,
including $2.45 billion during preproduction, $245 million for working capital, and $1.75 billion in sustaining capital over the life
of the mine. Table 19.2 summarizes the capital cost over the life of the mine.
| Table 19.2: Life of Mine Capital Cost Summary ($000s) |
| Description |
Values |
| DIRECT ON-SITE FACILITIES |
|
| Mine Area Facilities |
65,556 |
| Mining Equipment |
190,470 |
| Mine Pre-stripping |
157,017 |
| Ore Storage & Handling |
234,484 |
| Heap Leach |
158,476 |
| SX/EW Facilities |
250,367 |
| Sulfuric Acid Plant |
94,935 |
| Ancillary Facilities |
23,295 |
| Site Development & Yard Utilities |
126,692 |
| Pre-Production Operations |
31,343 |
| OFF-SITE FACILITIES |
|
| Power Supply |
0 |
| Fresh Water Supply |
1,000 |
| Permanent Camp (Camp/Offices) |
26,000 |
| Access Roads |
138,361 |
| Aviation |
2,000 |
| FIELD DISTRIBUTABLES |
163,278 |
| CONSTRUCTION MANAGEMENT / FIELD OFFICES |
92,467 |
| ENGINEERING PROCUREMENT & PROJECT MGT |
77,738 |
| OTHER INDIRECTS |
|
| Owner’s Costs |
75,188 |
| Freight |
45,847 |
| Contingency |
493,663 |
| Total Preproduction Capital |
2,448,178 |
| Sustaining |
1,750,185 |
| Project Los Azules – S-K 1300 Technical Report Summary | Project No.: 21139-01 | 19-273 |
| Table 19.2: Life of Mine Capital Cost Summary ($000s) |
| Description |
Values |
| Working Capital (Initial) |
244,994 |
| Total LOM Capital |
4,443,357 |
Operating Costs
The total LOM operating cost is estimated at $5.5
billion, or $7.99 per tonne of mineralized material processed, as summarized in Table 19.3. The Figure 19.1 show the percentage splits
of each LOM operating cost component for each of the cases.
| Table 19.3: Life of Mine Operating Cost Summary |
| Description |
| Base Case 175k tpa Cu |
| Mining |
2,832,035 |
4.13 |
0.47 |
| Processing |
1,942,691 |
2.84 |
0.32 |
| General & Administrative |
698,373 |
1.02 |
0.12 |
| LOM Operating Cost |
5,473,099 |
7.99 |
0.91 |

Figure 19.1: LOM Operating Costs per Tonne
Mineralized Material (Samuel Engineering 2023)
Note that the processing cost is slightly higher
in the economic evaluation than in the operating cost section of the report. In the economic evaluation, it has been assumed that the
cost of the electrical substation and power line are included in the unit power rate. To approximate the increase in power cost, the annualized
value of the expected capital expenditure for the electrical installations was calculated using a 10% profit on expenditure, at an annualized
interest rate of 5% over the duration of plant operation. The cost for the Base Case plant is approximately equivalent to 3 cents per
kW-hr.
| Project Los Azules – S-K 1300 Technical Report Summary | Project No.: 21139-01 | 19-274 |
Royalties and Taxes
The Los Azules Project is charged several royalties.
The Provincial (San Juan) royalty is “mine mouth” based and is calculated at 3% of the gross revenue less non-mining expenses.
A reduction of the fee is allowed for capital expenditures made for the good of the public. Those expenditures are deducted from the fees
up to 70% of the annual fee due. The project will also be charged two “NSR” based royalties, TNR at 0.4% and McEwen Mining
at 1.25%. These royalties are calculated by deducting the costs for shipping, ocean freight, smelter treatment and refining charges, process
operating costs, and general and administrative costs associated with all areas of the Project except mining from the total gross revenue
generated from the value of the metals to be shipped to the purchaser.
In addition to the royalties, Argentina imposes
a 4.5% export retention tax on the value of the metals at the point of export. In estimating this export tax, the amount of total gross
revenue less transportation, treating, and refining charges are used as the cost basis. In the economic evaluation, we have assumed that
10,000 tonnes of copper cathode will be sold within country, not requiring export tax. The 10,000 tpy represents approximately 50% of
the annual import of copper for Argentina.
Further, the Project is required to pay VAT taxes
on Initial capital and sustaining capital at a rate of 10.5% of the direct costs. During operations, we recover 95% of the VAT on initial
capital (50% in the year following, and 50% the year after) and 95% of the VAT on sustaining capital in the following year. In addition,
operating VAT is charged at a rate of 21% on all non-labor operating expenses. Operating VAT is also recovered at 95%. The portion of
VAT paid attributable to in country sales is collected in the current year while the balance is recovered in the following year.
In addition to the VAT taxes, the project is subject
to the Argentine Corporate Profit Tax of 35%, a Debit and Credit Bank tax of 1.2% of the gross “In-Country” sales, and an
Operating Bank Tax. The Operating Bank Tax is charged on non-labor related operating expenses at a rate of 1.2%. A portion of this, (0.2%
of the non-labor expenses) can be recovered in the following year.
The Project’s LOM cash flow results are
summarized in Table 19.4. The Project is at the exploration stage of investigation; consequently, this study is at the scoping level of
accuracy, preliminary in nature, and there is no certainty that the results, projects, or estimates in this Initial Assessment will be
realized.
| Table 19.4: Project Economic Summary |
| Description |
Units |
Values |
| Gross Revenue |
$000s |
22,496,301 |
| Less Transportation, TC and RC Costs |
$000s |
116,146 |
| Net Smelter Return |
$000s |
22,380,155 |
| Less Royalties |
$000s |
788,989 |
| Gross Income from Mining |
$000s |
21,591,166 |
| Less Operating Costs |
$000s |
5,473,099 |
| Less Export Retention |
$000s |
942,575 |
| Net Profit Before Depreciation/Amortization |
$000s |
15,175,492 |
| Less Depreciation/Amortization |
$000s |
4,426,708 |
| Project Los Azules – S-K 1300 Technical Report Summary | Project No.: 21139-01 | 19-275 |
| Table 19.4: Project Economic Summary |
| Description |
Units |
Values |
| Net Profit Before Taxes |
$000s |
10,748,784 |
| Less Income Taxes |
$000s |
3,762,131 |
| Net Profit After Taxes |
$000s |
6,986,653 |
| Plus Add-back Non-Cash Depreciation/Amortization |
$000s |
4,426,708 |
| Less Sustaining Capital |
$000s |
1,750,185 |
| Less Capital Costs |
$000s |
2,448,178 |
| Less Working Capital |
$000s |
1,322 |
| Plus Recapture Working Capital/Spares/First Fills |
$000s |
35,579 |
| Less VAT |
$000s |
1,322,359 |
| Plus Recapture of VAT |
$000s |
1,256,241 |
| Less Mine Reclamation |
$000s |
179,690 |
| Pre-Tax Cash Flow |
$000s |
10,765,579 |
| IRR (Pre-Tax) |
% |
27.0 |
| NPV @ 5% |
$000s |
5,534,424 |
| NPV @ 8% |
$000s |
3,747,412 |
| NPV @ 10% |
$000s |
2,881,902 |
| After-Tax Cash Flow |
$000s |
7,003,448 |
| IRR (Post-Tax) |
% |
21.5 |
| NPV @ 5% |
$000s |
3,444,788 |
| NPV @ 8% |
$000s |
2,233,605 |
| NPV @ 10% |
$000s |
1,646,712 |
| Pre-tax Pay Back Period |
Years |
3.0 |
Table 19.5 through Table 19.7 and Figure 19.2
through Figure 19.6 show the relative sensitivity of NPV and IRR as capital and operating costs and copper price change in the 175k tpa
Cu economic model.
The sensitivity analysis shows that the Project
is the most sensitive to copper price. Operating and capital costs changes have a lower impact on the Project NPV than the former variable.
| Table 19.5: Copper Price Sensitivity |
Sensitivity
(%)
/ Item |
Metal
Pricing |
Pre-Tax |
Post-Tax |
Copper
Price |
NPV |
IRR |
Payback |
NPV |
IRR |
Payback |
| Cu/lb |
$M |
% |
Years |
$M |
% |
Years |
| -50% |
$1.88 |
($835) |
2% |
13.26 |
($882) |
1% |
13.39 |
| -45% |
$2.06 |
($375) |
5% |
10.23 |
($533) |
4% |
10.50 |
| -40% |
$2.25 |
$85 |
9% |
8.33 |
($201) |
7% |
8.65 |
| Project Los Azules – S-K 1300 Technical Report Summary | Project No.: 21139-01 | 19-276 |
| Table 19.5: Copper Price Sensitivity |
Sensitivity
(%)
/ Item |
Metal
Pricing |
Pre-Tax |
Post-Tax |
Copper
Price |
NPV |
IRR |
Payback |
NPV |
IRR |
Payback |
| Cu/lb |
$M |
% |
Years |
$M |
% |
Years |
| -35% |
$2.44 |
$543 |
11% |
7.02 |
$119 |
9% |
7.38 |
| -30% |
$2.63 |
$1,002 |
14% |
5.80 |
$430 |
11% |
6.34 |
| -25% |
$2.81 |
$1,460 |
16% |
4.91 |
$736 |
13% |
5.42 |
| -20% |
$3.00 |
$1,918 |
19% |
4.27 |
$1,040 |
15% |
4.74 |
| -15% |
$3.19 |
$2,376 |
21% |
3.82 |
$1,342 |
17% |
4.24 |
| -10% |
$3.38 |
$2,833 |
23% |
3.50 |
$1,641 |
18% |
3.87 |
| -5% |
$3.56 |
$3,290 |
25% |
3.23 |
$1,937 |
20% |
3.59 |
| 0% |
$3.75 |
$3,747 |
27% |
3.00 |
$2,234 |
22% |
3.36 |
| 5% |
$3.94 |
$4,204 |
29% |
2.76 |
$2,529 |
23% |
3.15 |
| 10% |
$4.13 |
$4,661 |
31% |
2.56 |
$2,824 |
24% |
2.98 |
| 15% |
$4.31 |
$5,118 |
32% |
2.39 |
$3,119 |
26% |
2.82 |
| 20% |
$4.50 |
$5,574 |
34% |
2.25 |
$3,414 |
27% |
2.68 |
| 25% |
$4.69 |
$6,031 |
36% |
2.12 |
$3,709 |
28% |
2.55 |
| 30% |
$4.88 |
$6,487 |
38% |
2.01 |
$4,003 |
30% |
2.44 |
| 35% |
$5.06 |
$6,944 |
39% |
1.91 |
$4,298 |
31% |
2.34 |
| 40% |
$5.25 |
$7,400 |
41% |
1.82 |
$4,592 |
32% |
2.24 |
| 45% |
$5.44 |
$7,857 |
42% |
1.74 |
$4,887 |
33% |
2.16 |
| 50% |
$5.63 |
$8,313 |
44% |
1.67 |
$5,181 |
34% |
2.08 |
| Project Los Azules – S-K 1300 Technical Report Summary | Project No.: 21139-01 | 19-277 |
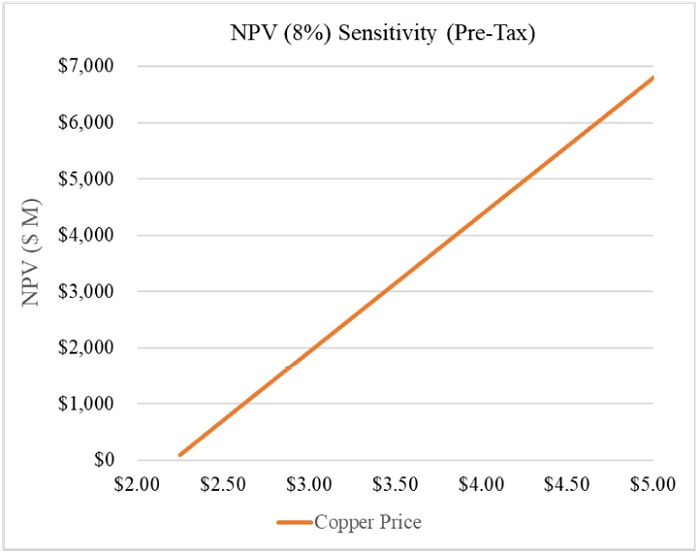
Figure 19.2: Copper Price per Pound Sensitivity
on NPV @ 8% (Pre-tax, 175k Cu Case) (Samuel Engineering 2023)
| Project Los Azules – S-K 1300 Technical Report Summary | Project No.: 21139-01 | 19-278 |

Figure 19.3: Copper Price per Pound Sensitivity
on IRR (Pre-tax) (Samuel Engineering 2023)
| Table 19.6: CAPEX Sensitivity (Initial + Sustaining) |
Sensitivity
(%)
/ Item |
Pre-Tax |
Post-Tax |
| NPV |
IRR |
Payback |
NPV |
IRR |
Payback |
| $M |
% |
Years |
$M |
% |
Years |
| -25% |
$4,511 |
36% |
2.08 |
$2,772 |
28% |
2.51 |
| -20% |
$4,358 |
34% |
2.25 |
$2,664 |
27% |
2.68 |
| -15% |
$4,205 |
32% |
2.42 |
$2,557 |
25% |
2.84 |
| -10% |
$4,053 |
30% |
2.60 |
$2,449 |
24% |
3.01 |
| -5% |
$3,900 |
28% |
2.79 |
$2,342 |
23% |
3.18 |
| 0 |
$3,747 |
27% |
3.00 |
$2,234 |
22% |
3.36 |
| 5% |
$3,595 |
26% |
3.17 |
$2,125 |
20% |
3.53 |
| 10% |
$3,442 |
24% |
3.34 |
$2,016 |
19% |
3.71 |
| 15% |
$3,289 |
23% |
3.52 |
$1,908 |
18% |
3.89 |
| 20% |
$3,137 |
22% |
3.71 |
$1,797 |
18% |
4.09 |
| 25% |
$2,984 |
21% |
3.89 |
$1,687 |
17% |
4.32 |
| Project Los Azules – S-K 1300 Technical Report Summary | Project No.: 21139-01 | 19-279 |
| Table 19.7: OPEX Sensitivity |
Sensitivity (%)
/ Item |
Pre-Tax |
Post-Tax |
| NPV |
IRR |
Payback |
NPV |
IRR |
Payback |
| $M |
% |
Years |
$M |
% |
Years |
| -25% |
$4,328 |
29% |
2.78 |
$2,617 |
23% |
3.16 |
| -20% |
$4,212 |
29% |
2.82 |
$2,541 |
23% |
3.19 |
| -15% |
$4,096 |
28% |
2.86 |
$2,464 |
23% |
3.23 |
| -10% |
$3,979 |
28% |
2.90 |
$2,387 |
22% |
3.27 |
| -5% |
$3,863 |
27% |
2.95 |
$2,310 |
22% |
3.31 |
| 0 |
$3,747 |
27% |
3.00 |
$2,234 |
22% |
3.36 |
| 5% |
$3,631 |
27% |
3.04 |
$2,157 |
21% |
3.40 |
| 10% |
$3,515 |
26% |
3.08 |
$2,080 |
21% |
3.45 |
| 15% |
$3,399 |
26% |
3.12 |
$2,003 |
20% |
3.49 |
| 20% |
$3,283 |
25% |
3.17 |
$1,927 |
20% |
3.54 |
| 25% |
$3,167 |
25% |
3.21 |
$1,850 |
20% |
3.59 |
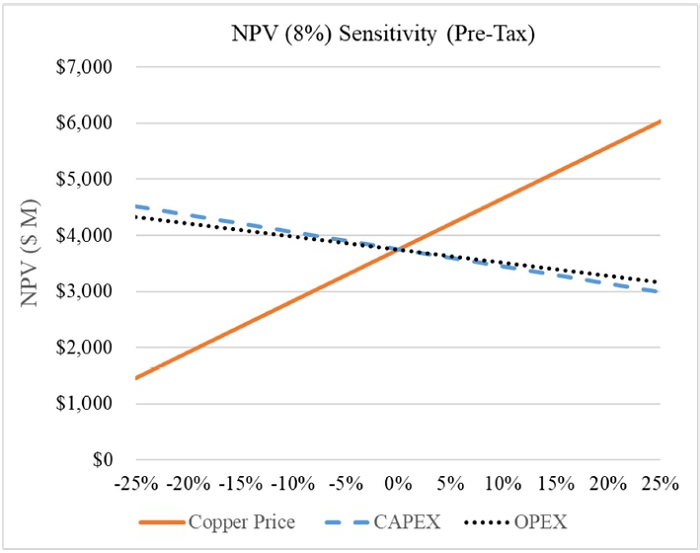
Figure 19.4: Multiple % Sensitivity on NPV
@ 8% (Pre-tax) (Samuel Engineering 2023)
| Project Los Azules – S-K 1300 Technical Report Summary | Project No.: 21139-01 | 19-280 |
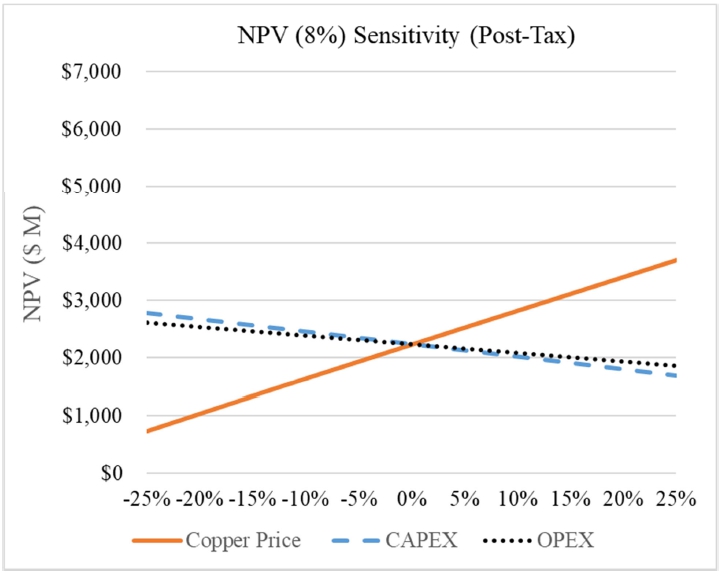
Figure 19.5: Multiple % Sensitivity on NPV
@ 8% (Post-tax) (Samuel Engineering 2023)
| Project Los Azules – S-K 1300 Technical Report Summary | Project No.: 21139-01 | 19-281 |
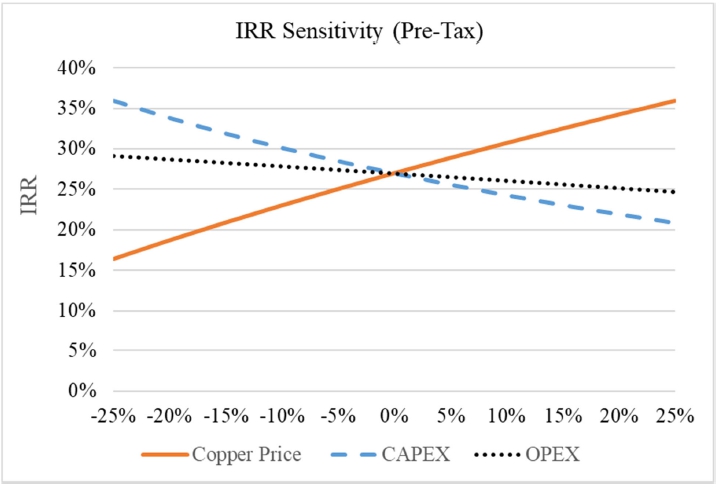
Figure 19.6: Multiple % Sensitivity on IRR
(Pre-tax) (Samuel Engineering 2023)
| 19.6 | Mine Life and Capital Payback |
The operating life of Los Azules is estimated
at 18 years, assuming a nominal production rate of 175,000 tonnes per annum of copper. This excludes a 3-year construction and preproduction
stripping period. At 175k tpa processing rate, and at a copper price of $3.75 per pound, the initial capital pre-tax payback period is
projected to be 3.0 years after the start of commercial mining.
| Project Los Azules – S-K 1300 Technical Report Summary | Project No.: 21139-01 | 19-282 |
Adjacent properties material to the Los Azules
Project include the mining properties of Fortescue, with their Rincones de Araya Project, and the Altar Project held by Aldebaran, which
are both south of the Project. The Soberanía property is surrounded by the Azul 3 and 4, Escorpio I, and the Azul Norte mining
rights and a piece of property released by Los Azules within Escorpio IV mining right to maintain the mining right itself within 3,500
ha.
The Soberanía property is currently claimed
by ACMSA and three other parties. It is north of the facilities laid out currently and is not anticipated to impact future mining at Los
Azules. The western boundary of the property is the border with Chile. Figure 20.1 shows the current property rights owners within and
adjacent to the Los Azules Project.

Figure 20.1: Regional Adjacent Properties
| Project Los Azules – S-K 1300 Technical Report Summary | Project No.: 21139-01 | 20-283 |
| 21.0 | other relevant data and information |
There is no additional information outside of
that which has already been referenced and included within the report.
| Project Los Azules – S-K 1300 Technical Report Summary | Project No.: 21139-01 | 21-284 |
| 22.0 | interpretation and conclusions |
The Technical Report Summary is prepared in accordance
with the requirements set forth by Canadian National Instrument 43-101 (S-K 1300) for the required disclosure of material information
and is intended to meet the requirements considered for an Initial Assessment (IA) level of study and disclosure as defined in the regulations
and supporting reference documents.
Based on the results of this IA, the contributing
authors and QPs have identified important interpretations, conclusions, and recommendations to advance the Project. A complete description
of these is provided in the following sub-sections. These include what is believed to be the most significant risks and opportunities
to the future development of the Los Azules Project.
| 22.1 | Overall Risks and Opportunities Summary |
Risks
| · | The Project is at the exploration stage of investigation; consequently, this study is at the scoping level
of accuracy, preliminary in nature, and includes Indicated mineral resources in the conceptual mine plan and the mine production schedule.
Inferred mineral resources are considered too speculative geologically and in other technical aspects to have the economic considerations
applied to them that would enable them to be categorized as mineral reserves under the standards set forth in S-K 1300. Reserves would
be required to establish a sound project basis. |
| · | Significant additional investigation and work is required to improve the confidence level of the analysis
to support a project development decision. There is no certainty that the results, project development plans, or estimates in this IA
will be realized. |
| · | Maintaining the necessary community and government engagement, planned project development work, and investment
plans in the Los Azules Project are necessary to maintain the mining and surface rights described. |
| · | Potential laws under consideration concerning the disturbance of vegas in Argentina is a significant risk
if enacted prior to project permitting completion. The established permitting processes consider impacts and mitigations on a case-by-case
basis within each Province, whereas a national law could restrict case by case and Provincial laws and processes. |
| · | The requirement to avoid impacting localized rock glaciers poses a risk to longer term mining opportunities,
including some of those in the Phase 2 options considered in this report. Site investigations to confirm the characterization of the known
geomorphologic structures should be completed in continued field programs to appropriately evaluate them and determine if avoidance impact
constraints should apply. |
| · | Geologic modeling of the deposit rock types, lithologies, and other aspects have been improved in the
work described in this report. However, a more robust geologic modeling effort is required to support an adequate understanding of the
deposit and next stage of study. |
| · | Limited information is available on the hydrology/hydrogeologic conditions affecting water resources and
management. This poses both a risk to the facilities considered in this document and areas for potential opportunity. |
| · | Previously limited information on the geotechnical conditions affecting the open pit, MRSF, leach pad
foundation, and other site facilities have been supplemented by additional data from the 2022/2023 site investigation. These areas pose
both a risk to the facilities considered in this document and areas for potential opportunity. |
| Project Los Azules – S-K 1300 Technical Report Summary | Project No.: 21139-01 | 22-285 |
| | · | Significant additional work is required to improve the metallurgical confidence level of the analysis
to support a project development decision, given the preliminary nature of the metallurgical and geo-metallurgical aspects of the deposit
tested and analyzed thus far. |
| · | The exact location of the project development surface facilities is yet to be finalized and requires hydrogeologic
and additional geotechnical site investigations to support final location selections and engineering design work to be performed. |
| · | Pricing and delivery estimates for equipment and materials reflect budgetary estimates considering current
conditions and impacts related to inflation, geopolitical factors, and supply chain disruptions. While some of these impacts are easing,
future impacts to market conditions are not considered in this analysis. |
| · | Inflation and future impacts are not considered in this analysis due to volatility globally and in Argentina.
Inflationary impacts may negatively impact the economic outcomes presented in this IA. |
| · | Metal price assumptions were considered based on current market conditions at the time of the report and
pose both a risk and opportunity to future economic expectations. |
Opportunities
| · | The resource is presently limited by the drilling completed at the time of this report and associated
information developed to date. Resources with limited drilling information due to access in the areas under the vegas represent an opportunity
to increase the near surface Indicated resource base within the current deposit. Additionally, opportunities for expansion of the resource
base peripherally and at depth are apparent from the work completed. These should be investigated during the feasibility study drilling
program. |
| · | The Phase 1 open pit is presently constrained by the requirement to avoid impacting localized cryogenic
geoforms. Site investigations to confirm these geomorphologic structures should be completed during field programs. A longer-term opportunity
may exist to reclassify areas where no evidence of glacial activity is found. |
| · | Within the cryogenic geoform constraints, limited information is available on the geotechnical characteristics
and hydrogeologic conditions affecting the open pit design and pit slopes. Generalized technical parameters include a variable pit slope
between 30° and 42° depending on depth. Additional work to better understand these key areas represents opportunities to reconsider
the mine design parameters, potentially reducing stripping requirements, and allow access to more of the deposit resources by extending
and deepening the open pit. |
| · | Materials inaccessible due to the surface glacier constraints should be considered in the context of alternative
mining methods to the open pit. |
| · | The project execution schedule assumes that the feasibility study work is completed as described, finalization
of the IIA/DIA process and other necessary permits to begin work is completed during the proposed feasibility study and preliminary timeframe
and financing is in place to achieve the schedule milestones. Should these happen earlier than planned, an earlier project start date
could be considered. |
| · | Pricing and delivery estimates for equipment and materials reflect current conditions and impacts related
to inflation, geopolitical factors, and supply chain disruptions. If deliveries return to more typical durations, the current execution
timeframe may be improved by 6 to 12 months. |
| Project Los Azules – S-K 1300 Technical Report Summary | Project No.: 21139-01 | 22-286 |
| 22.2 | PHASE 2 Upside Potentials |
Potential scenarios for future operations beyond
the initial phase of the Project considering the primary copper sulfide materials were developed. Two approaches were considered, one
employing NutonTM bio-leaching technology and secondly, a conventional copper concentrator is presented and discussed below.
Nuton™ Technology Opportunity
Nuton LLC is a technology venture of Rio Tinto,
one of the world’s largest mining companies, and home to a unique integration of innovative nature-based technologies, expertise,
and capabilities. At the core of Nuton is a portfolio of proprietary copper heap leach related technologies. Nuton aims to advance the
environmental, social, and governance performance of the industry whilst delivering copper growth.
As the mine progresses, there is an opportunity
to process the Primary material on a heap leach pad, utilizing the Nuton™ technology. Ongoing metallurgical work considering new
Nuton bio-leaching technological approaches is being developed to potentially replace the need for a future milling operation in favor
of continued leaching and copper cathode production for the life of the mining operations. Potential scenarios for the future operations
employing the NutonTM bio-leaching technology are presented and discussed below.
The information contained within Section 22.2.1
below was written with input from the Nuton team. As such, any recovery information detailed in this sub-section is with reference to
Total Copper (CuT) recovery.
Based on preliminary scoping testing, the Nuton™
technology offers the potential for copper recoveries of over 80% from predominantly chalcopyrite materials, depending on the specific
mineralogy make-up of the deposit. At Los Azules, Nuton™ has the potential to economically process the large primary sulfide copper
resource as an alternative to a concentrator, with low incremental capital following the oxide leach, no tailings requirement, and a smaller
environmental footprint. Producing a copper cathode from Nuton™ on-site also has the advantage of simplifying outbound logistics
for copper concentrates and offers a finished product to the domestic and regional market.
The modelled outcomes, using the Nuton proprietary
CFD model, are very encouraging and indicate that unoptimized copper recovery to cathode from primary material should range from 73% to
79%. Furthermore, Nuton recovery of secondary material is high, ranging from 80% to 86%. This provides a significant opportunity to de-risk
the mine plan and the need for selective mining, as simultaneous stacking of both secondary and primary mineralization material will not
impact on the copper recovery from either material type. Based on the current resource estimate, this could have a significant positive
impact on the expected life of mine, without significantly increasing the initial capital investment required.
| 22.2.1.1 | Nuton Economic Opportunity |
Based on the information and recommendations from
the Nuton team, preliminary cases for the potential economic opportunity represented by adding this leaching approach were developed.
The Nuton™ Economic Opportunity for the Project’s LOM cash flow results are summarized in Table 22.3.
| Project Los Azules – S-K 1300 Technical Report Summary | Project No.: 21139-01 | 22-287 |
Table 22.1 summarizes the incremental capital
cost for a 35M tpa processing rate over the life of the mine to implement the NutonTM technology as provided by Nuton.
| Table 22.1: Nuton Opportunity Capital Cost Summary for 35Mtpa Case |
| Description |
LOM Cost ($000s) |
| NUTON™ ON-SITE FACILITIES |
|
| Nuton Additives Make-up Facility |
8,000 |
| Biomass Growth Facility |
20,000 |
| Raffinate Conditioning |
30,000 |
| Raffinate Conditioning Residue Storage |
60,000 |
| Additional Aeration Infrastructure (every 3 years) |
16,000 |
The NutonTM process operating costs
provided by Nuton LLC are summarized in Table 22.2 for life-of-mine (LOM) values.
| Table 22.2: Nuton Opportunity Operating Cost Summary for 35Mpta case |
| |
OPEX $/t Placed |
| Leaching Augmentation Additives |
$0.10 |
| Biomass Growth Facility |
$0.05 |
| Raffinate Conditioning Costs |
$0.77 |
| Sulfur / Pyrite Addition |
$0.06 |
| Total Additional OPEX |
$0.98 |
Mining capacity starts at 65 Mtpa and ramps to
150 Mtpa year ten, with the crusher progressively stepping up from an initial 25 Mtpa to 50 Mtpa to keep the larger SX EW filled as grades
decrease over time. This schedule focused on keeping the Crusher/Mill circuit capacity sufficient to keep the SX/EW utilized fully to
maximize economic value through the system.
An observed outcome of this mining schedule again
was a preference to process Supergene material, using stockpiling and mining schedule to bring forward higher grade material whenever
possible. The schedule processes 4.23 billion tonnes of rock and feeds 1.7 billion tonnes of material containing 7.1 M tonnes of copper.
6.41 M tonnes of copper is recovered (89.9%), life of mine – owing to slightly lower overall operating costs per tonne and shorter
mine life for the higher production rates.
Over the life of operations of 40 years, mining
opex averaged US$1.82/t mined and Heap leach/Nuton opex averaged US$3.01/t processed. Overall operating costs averaged $1.02/lb of copper.
A second scenario leverages the PEA Alternative
Case 125k tpa Heap Leach (HL) / Solvent Extraction (SX)/ Electrowinning (EW) Plant operating for ten years, before introducing NutonTM
leaching technology from year eleven onwards.
A third scenario (3rd Case) considered
leverages the PEA Alternative Case 125 ktpa Heap Leach (HL) / Solvent Extraction (SX)/ Electrowinning (EW) Plant operating for six years,
before introducing NutonTM leaching technology from year seven onwards whilst expanding the SX/EW facilities to 175ktpa utilising
the increased copper recovery from Nuton.
| Project Los Azules – S-K 1300 Technical Report Summary | Project No.: 21139-01 | 22-288 |
To assess and more directly compare the indicative
economic potential for the Whittle options developed with the project cases, the Whittle mining information was incorporated into the
SE processing and financial models for each option. A summary of the economic cases developed based on the three Whittle mine optimization
runs is present Table 22.3 below.
| Table 22.3: Nuton™ Opportunity Economic Summaries |
| Project Metric |
Units |
Base Case-Nuton
175k tpa Cu |
Alt. Case-Nuton
125k tpa Cu |
3rd Case-Nuton
125k/175k tpa Cu |
| Mine Life |
Yr |
39 |
52 |
41 |
| Strip Ratio |
|
1.43 |
1.56 |
1.37 |
| Tonnes Processed |
Mtonnes |
1,737 |
1,651 |
1,784 |
| Copper Grade (Total) |
% Cu |
0.409 |
0.420 |
0.403 |
| Copper Production – cathode Cu |
ktonnes |
6,411 |
6,165 |
6,461 |
| Initial Capital Cost |
USD Millions |
$2,444 |
$2,203 |
$2,203 |
| Sustaining Capital Cost |
USD Millions |
$2,793 |
$2,789 |
$2,793 |
| C1 Costs (Life of Mine) |
USD/lb Cu |
$1.04 |
$1.20 |
$1.05 |
| All-in Sustaining Costs (AISC) |
USD/lb Cu |
$1.54 |
$1.70 |
$1.55 |
| After Taxes |
|
|
|
|
| Internal Rate of Return (IRR) |
% |
23.9% |
19.2% |
21.1% |
| Net Present Value (NPV) @ 8% |
USD Millions |
$3,701 |
$2,306 |
$3,214 |
| Pay Back Period |
Yr |
2.7 |
3.5 |
3.5 |
Copper Concentrator Opportunity
The future Phase 2 project modification anticipates
processing materials with predominantly primary copper mineralization and considers two potential scenarios for operations beyond Phase
1 of the Project, a preferred option employing NutonTM bio-leaching technology and secondly, a conventional copper concentrator
and tailings storage facility that produces a copper concentrate as the final product for export. A conventional mill and flotation/concentrator
option was considered to process primary copper mineralization to demonstrate economic viability employing conventional methods and support
reserves estimation confidence.
The previous heap leach project will continue
to drain down and go into closure over time. All mined Supergene material and Primary material will be fed directly to the copper concentrator
or be stacked directly on the pad when the concentrator is brought online, depending on profitability. The Los Azules copper concentrator
is to be a conventional copper flotation circuit with a daily throughput of 120,000 tpd, or 43.8M tpa at an operating availability of
85% or 7,353 operating hours.
| 22.2.1.2 | Copper Concentrator Economic Opportunity |
Initial project capital costs are consistent with
the project 125 ktpa Cu leach-SX/EW project scenario. Table 22.4 summarizes the initial capital cost for the addition of a 120,000 tpd
copper mill/concentrator. Much of the costs shown were developed considering a 50% overall escalation from the costs expressed in the
2017 PEA for this evaluation.
| Project Los Azules – S-K 1300 Technical Report Summary | Project No.: 21139-01 | 22-289 |
Crushing and stacking systems initially commissioned
for use in the heap leaching process will be repurposed to provide ball mill feed and enable filtered tailings transport/storage options.
Tailings storage management design would provide for a lined facility with filtered tailings (dry stacked) deposition for the applicable
life of mine operations to minimize environmental impacts and freshwater usage. Tailings storage facility expansions and lining for filtered
tails was included at $0.50/tonne placed over the life of the milling operations.
| Table 22.4: Copper Concentrator Opportunity Capital Cost Summary |
| AREA |
|
Total |
| Incoming Powerline Upgrade |
USD |
179,000,000 |
| Utilities and Power |
USD |
52,000,000 |
| Construction Camp/permanent camp |
USD |
20,000,000 |
| SUBTOTAL Direct Cost Fixed Items |
USD |
251,000,000 |
| |
|
|
| Crushing |
USD |
Existing |
| Milling |
USD |
607,400,000 |
| Tailings Storage Facility – Initial Area |
USD |
187,600,000 |
| Dry Stack Conveying & Stacking |
USD |
120,500,000 |
| SUBTOTAL Direct Cost Variable Items Items |
USD |
915,600,000 |
| Total Direct Costs |
USD |
1,166,600,000 |
| |
|
|
| |
|
|
| TOTAL INDIRECT COST |
USD |
648,600,000 |
| Contingency |
USD |
453,800,000 |
| Subtotal Indirect Owner & Contingency |
USD |
1,102,400,000 |
| Total Project Cost Excluding Mining Equipment |
USD |
2,268,900,000 |
| Project Los Azules – S-K 1300 Technical Report Summary | Project No.: 21139-01 | 22-290 |
Heap Leach expanding to Mill Flotation
A scenario developed leverages a smaller 125 ktpa
Heap Leach / Solvent Extraction/ Electrowinning Plant operating for six years, before introducing a four-ball mill circuit feeding a flotation
plant and producing copper concentrate from year seven onwards.
Mining capacity starts at 85 Mtpa and ramps to
150 Mtpa as the Mill comes online in year seven, which is the same timing as the crusher capacity ramps from an initial 25 Mtpa to 50
Mtpa. This schedule focused on keeping the Crusher/Mill circuit utilized fully to maximize economic value through the system.
An observed outcome of this schedule was to continue
Heap Leach operations of around 10 Mtpa after the mill starts, to process lower grade Supergene material as the unit cost to Heap Leach
is lower than Mill-Flotation. The Mill processes higher grade Supergene and Primary material types at a finer grind of 200µm with
a throughput of ~40 Mtpa. When the Heap Leach runs out of low-grade Supergene and closes, the Mill moves to a coarser grind and processes
at 50 Mtpa.
The schedule processes 4.23 billion tonnes of
rock and feeds 1.85 billion tonnes of material containing 7.29 M tonnes of copper of which 6.32 M tonnes of copper is recovered (86.8%)
with 6,415 tonnes payable after concentrate deductions.
Over the life of operations of 41 years, mining
opex averaged USD $1.80/t mined, a summary of the operating costs for the leach and milling option are shown in Table 22.5 ($/t as tonne
processed).
| Table 22.5: Life of Mine Leach/Mill OPEX ($/t processed) |
| Mining OPEX |
LOM |
$ Millions |
$7,798 |
| |
Annual Average |
$ Millions |
$190 |
| |
Per ton processed |
$/t |
$3.61 |
| |
Per Eq. Lb Cu |
$/lb Cu |
$0.55 |
| Processing OPEX |
LOM |
$ Millions |
$8,626 |
| |
Annual Average |
$ Millions |
$210 |
| |
Per ton processed |
$/t |
$4.00 |
| |
Per Eq. Lb Cu |
$/lb Cu |
$0.61 |
| SG&A |
LOM |
$ Millions |
$1,616 |
| |
Annual Average |
$ Millions |
$39 |
| |
Per ton processed |
$/t |
$0.75 |
| |
Per Eq. Lb Cu |
$/lb Cu |
$0.11 |
| TOTAL OPEX |
LOM |
$ Millions |
$18,040 |
| |
Annual Average |
$ Millions |
$440 |
| |
Per ton processed |
$/t |
$8.36 |
| |
Per Eq. Lb Cu |
$/lb Cu |
$1.28 |
After allowing an estimated US$2.3 billion capex
in years 4-6 for the Mill/Flotation circuit and initial tailings storage facility, in addition to ongoing leach SX/EW costs, an economic
analysis was completed, and summary results are presented in Table 22.6 below. Further work needs to be undertaken at a PEA level to determine
the viability of this option.
| Project Los Azules – S-K 1300 Technical Report Summary | Project No.: 21139-01 | 22-291 |
| Table 22.6: Copper Concentrator Opportunity Economic Summary |
| Project Metric |
Units |
Base Case-Mill
125k tpa Cu |
|
| Mine Life |
Yr |
41 |
|
| Tonnes Processed |
Ktonnes |
2,167 |
|
| Strip Ratio |
|
1.10 |
|
| Copper Production – cathodes |
ktonnes |
1,861 |
|
| Copper Production - concentrate |
ktonnes |
4,554 |
|
| Gold Production |
Moz |
1.11 |
|
| Silver Production |
Moz |
34.2 |
|
| Initial Capital Cost |
USD Millions |
$2,182 |
|
| Sustaining Capital Cost |
USD Millions |
$4,686 |
|
| C1 Costs (Life of Mine) |
USD/lb Cu |
$1.63 |
|
| All-in Sustaining Costs (AISC) |
USD/lb Cu |
$2.25 |
|
| Before Taxes |
|
|
|
| Internal Rate of Return (IRR) |
% |
23.5% |
|
| Net Present Value (NPV) @ 8% |
USD Millions |
$4,528 |
|
| After Taxes |
|
|
|
| Internal Rate of Return (IRR) |
% |
19.2% |
|
| Net Present Value (NPV) @ 8% |
USD Millions |
$2,685 |
|
| Pay Back Period* |
Yr |
6.8 |
|
*Note: Mill investment in Years 4-6 extends
Pay Back Period
| 22.3 | Metallurgy and Mineral Processing |
INTERPRETATIONS AND CONCLUSIONS
While reviewing and interpreting the prior and
current test work and developing the process design for the Project, the author has developed the following conclusions:
| · | Extensive metallurgical testing (batch) has been conducted on representative samples from the Resource,
indicating that the soluble copper is able to be recovered by conventional heap leaching technology with the addition of biomass. Previous
Plenge data provided an above 100% total soluble copper recovery, which is supported by the on-going SGS testwork with over 120 days of
leaching. The current test work on-going at SGS backs this data up as presented in Section 10.0. |
| · | On-going SGS testwork is only preliminary and subject to changes when final tail assays are completed,
and a calculated head grade is determined. |
| · | Extensive metallurgical testing (batch) has been conducted on representative samples (material types and
major lithologies) from the Resource indicating the Primary and Supergene material is recoverable to a rougher flotation concentrate. |
| · | Heap leach copper extraction is derived by two (2) different methods, one for leachable/soluble copper
(CuSOL) and residual copper (CuRES) as derived from sequential copper assay methodology. The projected extraction for CuSOL is 100% for
leachable/soluble recovery and 15% for CuRES. Residual copper assay is the difference between total assayed copper (CuT) and CuSOL. For
the 19mm column tests in the current program, the total copper extraction ranged from 86% to 72% in 180 days and averaged 80% overall. |
| Project Los Azules – S-K 1300 Technical Report Summary | Project No.: 21139-01 | 22-292 |
| · | Copper recovered to cathodes considers a heap efficiency and inventory factor of 90% of the long-term
extractable copper extended over a two-year leach cycle period based on general experience. Soluble copper recovery exceeding 100% implies
partial leaching of material which was not categorized as “soluble” based on the sequential assaying method and data available.
Based on the resource assay data and column results, the apparent soluble copper (CuSOL) recovery to cathodes is approximately 107%, with
total copper (CuT) recovery at 73%. |
| · | Gross acid consumption has been set at 18 kg/t material based on Plenge data and backed up by the current
bottle rolls completed at SGS. |
| · | The plant crushing/comminution circuits were designed based on 70+ samples from variability testing. This
provides enough basis for hardness calculations on the plant through the variability of time. |
| · | Multiple assays have not been completed or integrated into the Resource model. This includes the incorporation
of arsenic and other deleterious materials. |
Risks
| · | Initial metallurgical test work to date on the supergene and primary mineralized material has not included
a full variability program. The range of metallurgical performance is therefore not completely defined and average performance expectations
used in this report may not be achieved. |
| · | Phase 1 Metallurgical columns were only conducted in 3 m height columns, the heap leach pad will have
9 m lifts. This poses a risk that the leach kinetics will slow over time. |
| · | Of significance is the level of potassium in the gangue minerals. With dissolution this could likely drive
iron precipitation as potassium jarosite particularly at elevated temperatures. Additionally, significant biotite and chlorite levels
are also observed in some composites, which can lead to higher acid consumption, particularly at higher leaching temperatures and lower
pH in the leach solutions. Continued analysis and monitoring of these features is planned in the future test work. |
| · | The metallurgical test work program at SGS is still in progress for flotation concentrate for deleterious
elements that will appear in the concentrate; this includes As, Bi, Cd, Ga, In, Pb, Re, Sb, Se, Te, Ti, U, and Hg. Concentrate samples
were shipped to SGS Lakefield in November 2022 for testing to help characterize and minimize the risk if this process is considered in
the future. |
| · | While test work is still in progress on rougher flotation samples at SGS, no previous test work was utilized
to characterize the tailings. This poses a risk to closure and reclamation of the dry stack tailings, if applicable. Early in the next
phase of the Project, studying and testing of the materials to help the optimization of the proposed dry stack will help minimize the
risk. |
Opportunities
| · | The opportunity to process primary sulfides directly through a heap leach rather than building a traditional
copper concentrator in the future is the envisioned approach to the Los Azules development plan. Emerging technologies for improved leaching
of sulfide copper ores are being developed, such as a proprietary catalytic bio-heap leaching technology that may provide an alternative
approach to improving the leach performance of primary sulfide content in the leach materials considered in this report. The primary sulfides
are presently not considered economically suitable for commercial heap leaching operation. Nuton™ technology is currently being
evaluated in this capacity. This would also have the potential to unlock the primary copper resources more economically with less environmental
impact versus a mill/concentrator alternative and negate the need for a tailing storage facility. This work is currently in progress in
Melbourne, Australia and at Hazen in Golden, Colorado. |
| Project Los Azules – S-K 1300 Technical Report Summary | Project No.: 21139-01 | 22-293 |
| · | Previous analysis of the hardness and comminution parameters showed a correlation between the on-going
geotechnical work with Schmidt Hammer and point load testing (PLT). An estimated 40 to 50 additional samples would need to have hardness
and comminution parameters completed on them that also have Schmidt Hammer and PLT to provide a correlation of data. This has an opportunity
to be applied directly to the geometallurgical block model for applications such as abrasion index, bond work index, and hardness to name
a few. |
| · | Opportunity to provide thermal blanketing on top of the heap leach pad, especially during winter months
to protect drip emitters of raffinate and the inoculated biomass. This may also mean digging trenches or burying the drip emitters. |
| · | Direct inclusion of sulfur with the leaching material going to the leach pad to support acid consumption
requirements, and limit acid plant expansions is being investigated. |
| · | Further investigation of coarse particle size flotation could reduce primary grinding costs. |
| · | Newer, more efficient copper flotation collectors, such as emulsions, are being developed and should be
included in future testing programs to assess their value. |
| · | Opportunity to process copper concentrates at the Project site utilizing the existing SX/EW facility instead
of shipping the concentrate. This would produce copper cathodes at site. |
| · | The process plant and equipment layout has been designed to take advantage of the existing terrain of
the project site utilizing gravity flow of fluids where possible. The opportunity exists to optimize the plant layout to take advantage
of gravity flow between unit operations, which could potentially remove some pumps from the process reducing capital and operating costs
of the project. |
| · | Incorporation of developing leaching technologies has the potential to improve copper recovery, reduce
leaching times, and minimize acid consumption requirements. |
| · | Strategies for recovery of contained gold may add value. Preliminary leaching tests indicate that a significant
amount of gold is recoverable with conventional technology. Recovery techniques should consider separate processing of higher-grade gold
bearing materials considering pre- and post- copper leaching extraction methods. |
| · | Additional testing of microwave technology will be beneficial to understanding micro-fracturing of material,
power consumption of crushers, and acid consumption. |
| · | Primary copper mineralization resources to be mined in future can be processed by conventional mill/concentrator
methods to produce copper concentrates for sale if a suitable heap leaching technology cannot be developed. |
| 22.4 | sample preparation, analyses, and security |
INTERPRETATIONS AND CONCLUSIONS
Results from the control sample analysis indicate
that the copper and gold assay processes are under sufficient control to produce reliable sample assay data for resource estimation and
release of drill hole assay results. Inadequate standards from early field seasons were eliminated. The use of only one lab to produce
assay results improves the consistency of results. Material that was assumed to be blank but contained low copper values was replaced.
Later types of blank material improved the monitoring of potential contamination of the samples.
| Project Los Azules – S-K 1300 Technical Report Summary | Project No.: 21139-01 | 22-294 |
All past deficiencies in the QC program have been
addressed. The Los Azules sampling and assaying program appears to be producing sample information that meets industry standards for copper
and gold accuracy and reliability. The assay results are sufficiently accurate and precise for use in resource estimation and the release
of drill hole results on a hole-by-hole basis.
| 22.5 | MINERAL RESOURCE ESTIMATES |
INTERPRETATIONS AND CONCLUSIONS
The construction methodology of the geological
models is robust. It breaks the deposit down into its component events and by understanding each of the controls related to that event,
yields a greater understanding of the deposit and a more robust series of inter-related models. The modelling was carried out in Leapfrog
software and was influenced by structure – lithology-alteration – mineralization – zonation with iterative revision
and reconstruction.
Overall, modelling shows that Los Azules is a
large structurally controlled porphyry deposit, open towards the west, northwest, and at depth. The extensive supergene enriched zone
has developed down structures that transition into primary sulfide mineralization. Modelling shows multiple bornite centers within the
primary zone highlighting exploration potential at depth and along the currently modelled structures.
Risks
No portion of the present resource is classified
as Measured and approximately 35% of the known resource base (in terms of contained copper) is classified as Indicated. A key objective
for the next phase of study and drilling program is to have the material mined during Phase 1 of the project represented by all the identified
Indicated and Inferred supergene resources to be classified in the Indicated resource category and eligible to be considered for Reserves.
Given the requirements for certainty noted by
S-K 1300 for classification to Measured, it is unlikely that any material would be expected to fall in this category at the completion
of the next study.
Opportunities
Additional factors preventing drilled areas from
being classified as Indicated or Measured are the presence of the vegas and cryogenic geoforms. McEwen Mining is continuing to conduct
site investigations exploring the possibility of getting the known geoforms reclassified or identified as a non-water source for the region.
If this is successful, material presently classified as Inferred due to environmental concerns can be upgraded to Indicated and Measured
based on other factors.
The deposit is very much drill limited. It is
open to the north, north-west, and at depth. Recent drilling has been concentrated on infill to upgrade Inferred tonnes to Indicated.
More drilling needs to be completed to address areas under the Vegas and some internal “islands” of Inferred material, but
at the same time a step out program of exploratory drilling would almost certainly bring additional resource into the Project.
| Project Los Azules – S-K 1300 Technical Report Summary | Project No.: 21139-01 | 22-295 |
The structural controls of the original porphyry
intrusions and subsequent enrichment of mineralization are well understood and used for the creation of the geological model on which
the resource is based. With multiple periods of exploratory work by several firms, the logging and sampling procedures have varied significantly.
Re-visiting previously logged core and using a consistent code system would strengthen knowledge of the geologic nuances of the deposit
and potentially increase confidence of our understanding.
Interpretations and Conclusions
The suggested slopes for the pit are based on
limited geotechnical information. Preliminary drilling focused on the mineral resource and not the pit walls and has typically been within
vertical holes. Preliminary drilling has been recently supplemented by 2022/2023 site investigation which included collection of pit wall
geotechnical data. Below surface discontinuity and structural data is being assessed, and kinematic assessments are planned. Stability
analysis has been carried out to consider rock mass controlled stability.
Gaps in the knowledge base are anticipated to
be addressed through investigation programs leading up to the feasibility study, including inclined holes oriented into the proposed pit
walls, televiewing of holes, geotechnical logging, laboratory testing, triple tube coring, and hydrogeological investigations.
Slope angles presented assume a low consequence
of failure, with an associated target factor of safety of 1.2. This assumption is based on the planned outwardly extending pit shell,
which gives opportunity to adapt the pit wall slope angles based on prior performance. The assumption is that pit wall failures may not
sterilize significant processable materials, as failures can be excavated, and post failure pit walls adapted accordingly. Outwardly expanding
walls can be replanned based on actual conditions encountered.
| · | Investigations reveal the rock (intact strength, rock mass strength, alternation, structure, weathering)
influencing stability of the pit walls is worse than assumed, resulting in shallower design slopes. |
| · | Faults and other structure causes issues with some orientations of the pit walls. |
| · | The phreatic surface/pore pressure behind the pit walls is worse than assumed, due to regional hydrogeology
or ineffective dewatering of the pit walls. This may result in potential for shallower slopes. |
| · | A seismic event triggers slope failure (seismic stability will be reviewed in feasibility once there is
adequate information regarding the pit wall rock; however, there could be an event larger than the design event). |
| · | Slope failure due to structural or rock mass concerns, not identified during investigations. While impending
slope failure may be identified through planned pit wall monitoring and performance reviews during operation, and therefore may not affect
worker safety, instabilities can sterilize processable materials and/or slow operations within the pit. |
| · | Natural geohazards, such as landslides, adversely affect the pit walls, or interfere with safe pit operation.
There has been some debate to date over interpretation of natural slides or glacial features on the mountain forming the east wall. |
| Project Los Azules – S-K 1300 Technical Report Summary | Project No.: 21139-01 | 22-296 |
| · | Poor blasting techniques result in bench scale issues. |
| · | Low consequence of failure is no longer appropriate, and a higher target factor of safety is required,
resulting in shallower pit slopes. |
| · | Pit slope failure damages infrastructure. The latest PEA infrastructure plan shows the primary crusher
very close to the pit crest; this may not be accounted for in the agreed low consequence designation and associated target factor of safety.
Regardless of the consequence classification, and FOS adopted, pit failures do occur in practice and factor of safety does not eliminate
probability of failure. A pit failure at this location could impact the primary crusher. |
| · | Overburden is thicker than the average assumed by the pit designers. This would reduce the overall slope
angles further. Overburden thickness is currently under investigation. |
| · | Waste rock facility (WRF) failure results in flow of waste rock into the pit, impacting safety and production.
The WRF run-out distance for the PEA has been assumed from an empirical average for dry slopes. Whilst there is some buffer off-set in
addition to the predicted run-out zone, empirical data shows scatter and wet/partially wet conditions may exist, which may increase run-out
distance. |
| · | The WRF triggers pit wall instability. Stability analyses conducted by the WRF team indicate target FOS
are achieved for WRF to pit failure. |
| · | The pit slopes are potentially very high, and the rock is poor quality. There is little global published
empirical performance data for similar rock conditions and pit slope heights, which is a risk for the project. |
| · | Investigations reveal the rock (intact strength, rock mass strength, alternation, structure, weathering)
influencing stability of the pit walls is better than assumed, resulting in steeper design slopes. Pit wall rock may be less fractured
and/or stronger than rock hosting the resource (investigated to date) and /or enhanced geotechnical investigations may promote better
recovered rock quality. |
| · | Televiewer data indicates the structure is not adversely oriented and/or the rock is less fractured in-situ
than recovered in core, allowing steeper slopes. |
| · | Laboratory testing reveals the intact rock is stronger than previously assumed. To date, there have only
been 24 UCS tests and reliance for intact compressive strength has been on point load testing with the absence of a site-specific, unit-specific
conversion to UCS. |
| · | Overburden is thinner than the average assumed by the pit designers. This would reduce the overall slope
angles further. Overburden thickness is currently under investigation; estimates to date are largely based on commencement of coring rather
than bedrock interface. |
| · | The phreatic surface/pore pressure behind the pit walls is lower than assumed, due to regional hydrogeology
or more effective dewatering of the pit walls. This may result in potential for steeper slopes. |
| · | Investigations reveal the rock (intact strength, rock mass strength, alternation, structure, weathering)
influencing stability of the pit walls is better that assumed, and further review by the WRF team reduces the run-out zone of the WRF,
resulting in the potential to reduce the WRF offset to the pit. |
| Project Los Azules – S-K 1300 Technical Report Summary | Project No.: 21139-01 | 22-297 |
| 22.7 | MINE PLAN AND MINING METHODS |
Interpretations and Conclusions
The pit optimization presented in this S-K 1300
was based on Indicated resources. No material in the block model was classified as a Measured resource. Mine planning and scheduling is
on an annual (yearly) basis and requires more detailed analysis to ensure it is achievable with the given geological block model.
In addition to the general risks encountered by
a mining operation of this scale, the following risks were identified specific to Los Azules.
Very poor rock quality: this risk was addressed
in detail in the Geotechnical section, but also poses significant safety and economic risks from the perspective of the mining operation.
If, for example, the target bench face angle cannot be achieved, over time the design slope angle will not be achieved. This will either
lead to material loss during a specific phase (or at the end of mine life) or result in significantly more waste rock that would have
to be stripped to expose the planned processable material. Both scenarios would impact the economics of the operation.
High altitude: although not unusual in mining
in the high Andes, Los Azules is located at a high altitude, and this will certainly affect people and machines. To counter the loss in
efficiency in diesel equipment, certain adjustments will have to be made and a percentage of power will still be forfeited. The proposed
incorporation of battery and electrical equipment will mitigate this risk to the extent that it is implemented.
The mine schedule relies on a stockpiling strategy
that requires more detailed analysis to see if it is achievable on a shorter time scale. This could result in periods within a year where
there is not enough mineralized material being mined and periods within a year where there is more than planned mineralized material being
mined. Additionally, the grade distribution at a bench scale needs to be better understood to have full confidence in the stockpiling
strategy used for the IA.
The mine design and plan are based on pit shells
and not detailed pit designs that include interim and final access ramps. The inclusion of this information can potentially lead to more
waste needing to be mined to establish or maintain access to mining areas within the pit.
Waste material characterization has not been taken
into consideration and potentially acid generating material may require certain placement considerations that could impact the mine plan
and schedule.
Identify ways to mine the open pit with low carbon
material handling options to reduce emissions and greater productivity and reduce operating costs.
Improvements to the geological block model with
better grades and/or more mineralized material tonnes. This could also impact changes to pit optimization inputs such as costs, selling
price, recoveries, and slope angles.
| Project Los Azules – S-K 1300 Technical Report Summary | Project No.: 21139-01 | 22-298 |
| 22.8 | ENVIRONMENTAL STUDIES, PERMITTING AND SOCIAL OR COMMUNITY IMPACT |
No interactions were observed between the study
areas (Mine Area and Access Road) and protected areas, nor with areas of conservation interest based on native forest criteria. Also,
there are no RAMSAR sites, Biosphere Reserves, or other protected sites recognized by the Nation, the Province of San Juan, and/or international
treaties.
| 22.9 | PIT DEWATERING AND WATER AVAILABILITY |
Groundwater
| 22.9.1.1 | Interpretations and Conclusions |
Pit dewatering and groundwater availability estimates
are based on limited site-specific data. Hydraulic conductivity for these estimates is based on the following testing.
| · | Short duration pneumatic slug testing conducted in five piezometers. |
| · | Air lift testing conducted in one exploration boring. |
| · | Limited Lugeon packer testing. |
This testing provides hydraulic conductivity estimates
in the near vicinity of the borehole and may not provide representative estimates of aquifer storage parameters, such as specific storage
and specific yield.
The current conceptual model for groundwater flow
in the region of the proposed pit suggests that groundwater flow may be highly influenced by faulting. Long duration pumping testing will
be required for DFS design to provide more reliable estimates of hydraulic conductivity and other hydrogeologic parameters. This testing
will also show the degree to which faulting influences groundwater flow, pit dewatering, and potential groundwater supply.
Given the current uncertainty in hydrogeologic
parameters and influence of faulting on groundwater flow, dewatering requirements may be larger than estimated.
Given the current uncertainty in hydrogeologic
parameters and influence of faulting on groundwater flow, available groundwater may not be sufficient to meet process supply requirements.
Given the current uncertainty in hydrogeologic
parameters and influence of faulting on groundwater flow, dewatering requirements may be smaller than estimated.
Surface Water
| 22.9.1.4 | Interpretations and Conclusions |
Surface water availability estimates are based
on local and regional meteorological parameters extended and completed until 2021, which may vary in the future. The meteorological data
from the Los Azules station has some anomalous readings indicating quality issues with the data. A QA/QC check of the data should be performed
for all parameters.
| Project Los Azules – S-K 1300 Technical Report Summary | Project No.: 21139-01 | 22-299 |
Surface water availability estimates flowing from
the Los Azules development is all contained within a single watershed. Potential losses or gains due to surface diversion structures or
storage facilities are not accounted for in these estimates. Site-specific surface flow monitoring data is limited periodic measurements.
To reduce uncertainty, continuous stream flow gauging stations are suggested to be installed in the project area.
Over the recent 6-year drought period (2016-2021),
the estimated average annual surface water flow exiting the Los Azules watershed is 60% of historical water availability (2001-2021).
Climate change projections indicate that rainfall will decrease, and temperature will increase in the following years, diminishing surface
runoff. It was further observed that monthly surface water availability varies frequently over seasonal ranges with minimal or nonexistent
flows occurring in some months over the available measurement periods.
Climate change may decrease the availability of
surface water for future mining operations.
Current surface water availability estimates assume
that all winter snowpack sublimates and is not included in the estimates. Snowmelt runoff may add significantly to water available for
mine processes and potable water supply.
Climate change may increase the availability of
surface water for future mining operations.
| 22.10 | MINE ROCK STORAGE FACILITIES |
Interpretations and Conclusions
Based on preliminary geotechnical assessments,
overall end slopes of 2.5H:1V for the mine rock storage facilities (MRSFs) were found to meet the geotechnical stability criteria. The
slope stability results showed that stability was controlled by seismic loading. The preliminary geotechnical assessments were based on
limited site information available at this stage of the study, comprised mainly of data from test pitting, geotechnical index testing,
historical drilling, and surface mapping. Gaps in the data are anticipated to be addressed through the recently completed and planned
geotechnical site investigations, which includes boreholes, test pits, surface geophysics, and laboratory testing tailored to characterize
the foundations of the proposed MRSFs.
The geotechnical analyses were completed based
on limited data available.
Flow slide runout, particularly from high un-benched
MRSFs, has the potential to impact downslope infrastructure.
| Project Los Azules – S-K 1300 Technical Report Summary | Project No.: 21139-01 | 22-300 |
Rock rollout is expected to be a common occurrence
that requires management particularly during active construction of the MRSFs.
Wetlands typically host fine-grained sediments
with low shear strengths, high groundwater surfaces, and potential for liquefaction.
With vertical thickness up to 240 m, the materials
at the base of the proposed MRSFs will experience high stresses. At such stress levels, materials can experience particle crushing and
deformation, potentially resulting in reduced shear strength and decreased permeability. These factors will influence the performance
of the MRSFs in the long term, including post-closure.
As the proposed MRSFs are constructed to their
design elevation, snow deposited over steep slopes could potentially create additional avalanche risk in the downstream areas. Intermediate
berms / benches could help mitigate this risk.
As the MRSFs in some areas are planned to fill
valleys with major natural drainages, the potential exists for buildup of pore pressures and/or groundwater in the MRSFs, which would
generate instability in the short or long term. Diversion channels are often used for sidehill fill and heaped rock storage facilities;
however, these are usually difficult to incorporate into valley or cross-valley fills unless topography and gradients are such that most
of the stream flows can be intercepted upstream of the dump and channelized on the valley slope beside the dump.
The selection of 2.5H:1V overall slopes was based
on the results of the preliminary slope stability assessment, which showed that the stability was controlled by seismic loading. The seismic
loading cases were modelled using the pseudo-static loading method, which serves as a screening method. If it is controlling, it should
be supplemented by a more comprehensive evaluation of the seismic effects using a deformation analysis. Preliminary deformation analyses
indicate that acceptable factors of safety (FOS) are likely to be returned for overall slopes that are shallower than 2H:1V, but steeper
than 2.5H:1V.
Potential also exists that optimized MRSF designs
may include lower seismic FOS stability cases that manage seismic deformation risk using larger infrastructure offsets, additional catch
benches, toe berms, catchment trenches, or other approaches.
Initial site investigation results indicate that
the phreatic surface / pore pressure is lower than assumed, which may result in improved stability.
To account for the effects of high vertical stresses,
the strength of the mine rock was modelled using a conservative shear strength function. A comprehensive review supported by site investigation
and laboratory testing results may bring about an improvement of the shear strength for the mine rock, resulting in potentially steeper
design slopes.
Generally, the most economic means of disposal
is adopted for the construction of MRSFs. However, for adequate long-term stability, a controlled construction methodology should be adopted,
such as using sectors with low-quality mine rock placed at the back of the facilities and high-quality rock placed at the face slope.
Implementation of regular UAV photogrammetry could be an innovative solution for tracking the PSD in the MRSF over its construction period.
Controlled handling and placement of mine rock can also be used to separate materials that are potentially acid forming from those that
are non-acid forming.
| Project Los Azules – S-K 1300 Technical Report Summary | Project No.: 21139-01 | 22-301 |
| 23.1 | Overall recommendations |
This subsection was prepared by J. Sorensen, FAusIMM,
Samuel Engineering and reviewed by the respective QPs for each subsection area.
Based on the results of this Initial Assessment,
contributing authors recommend that McEwen Mining / McEwen Copper complete additional work to further de-risk the Project, including more
advanced stages of drilling to complete the work necessary for a Feasibility Study based Technical Summary Report.
Given the maturity of the resource development
and project technical and permitting basis to date, a Preliminary Feasibility Study is considered an optional step and a Feasibility level
of project definition is recommended to expedite the project development timeline to comply with the requirements of the property ownership
agreements with the Mining Ministry. As of the effective date of this report, initial Feasibility resource drilling and metallurgical
test work were started and in progress.
It is recommended that McEwen Copper now focuses
on further de-risking the Los Azules Project by moving to a more robust knowledge base in several critical areas. The Priority Next Steps
should be:
| · | Enhance the definition of the mineralized material by infill drilling programs over two years supported
by geological and geophysical work to develop a significant “Measured and Indicated resource” at Los Azules with particular
focus to the initial 5-year mine pit. |
| · | The performance of all studies, monitoring, and engineering related to interactions between the Los Azules
Project and naturally occurring water. |
| · | The performance of the environmental baselining work in conjunction with specific engineering enabled
the IIA submission to the San Juan authorities in April 2023 with the objective of receiving the permitting for the development of Los
Azules during the second half of 2024. |
A Feasibility Study level of definition is estimated
to take approximately 18 to 20 months to complete, overview provided in Figure 23.1. Based on current information from work in progress,
the estimated cost is approximately $232 million including estimates for McEwen Copper/ACMSA costs (Table 23.1). The recommended technical
program to complete the work deemed necessary to support the completion of a Feasibility Study is as follows:
| · | Complete an in-fill resource definition drilling program targeting Measured resource classification for
the initial five years of the project and areas within the initial project supergene resource to Indicated classification as considered
in this IA. The program delineated for execution includes an additional 32,000 meters of diamond drilling. |
| · | Complete the site geotechnical, seismic, glacier, hydrology and hydrogeologic investigations to a feasibility
study level of definition. The program delineated included 16,000 meters of geotechnical drilling, 9,250 meters of hydrogeologic drilling,
9,700 meters of condemnation and other miscellaneous drilling, reestablishment of local surface water monitoring and field surveys. |
| · | Complete confirmatory metallurgical test work and geometallurgical definition for the initial project
process. The program delineated includes approximately 15,000 meters of additional metallurgical PQ core drilling and sampling of approximately
90 tonnes of materials, additional column leaching metallurgical testing for both conventional and augmented bio-leaching technologies.
The metallurgical work includes site testing of the leach concepts with materials from the bulk sampling campaign. Additional testing
on primary mineralization materials for potential milling options is also considered. |
| Project Los Azules – S-K 1300 Technical Report Summary | Project No.: 21139-01 | 23-302 |
| · | Update resource/geologic models and estimations, mine plans and schedules based on the additional data
collected. |
| · | Update leach pad, processing and site/off-site infrastructure facilities designs to feasibility level
development and support ongoing permitting requirements. Finalize concepts for power supply, site access and logistics. |
| · | Update execution plans, costs and financial estimates and assumptions based on the updated project definition. |

Figure 23.1: Feasibility Study Development
Timeline
| Project Los Azules – S-K 1300 Technical Report Summary | Project No.: 21139-01 | 23-303 |
| Table 23.1: Expected Costs for Feasibility Study Development |
| Cost Category (USD Millions) |
2023 |
2024 |
TOTAL |
| Corporate |
$5.1 |
$3.1 |
$8.2 |
| Roads* |
$15.8 |
$4.2 |
$20.0 |
| McEwen Copper/ACMSA |
$16.6 |
$13.4 |
$30.0 |
| Camp/Site Services* |
$15.1 |
$5.8 |
$20.9 |
| ESG/Permitting |
$3.7 |
$3.8 |
$7.4 |
| Exploration* |
$48.3 |
$32.8 |
$81.1 |
| Feasibility Study - Engineering |
$9.8 |
$13.5 |
$23.3 |
| Calingasta Development |
$1.5 |
$0.1 |
$1.6 |
| Contingency |
$2.0 |
$8.0 |
$10.0 |
| Cost |
$117.9 |
$84.7 |
$202.6 |
| Estimated VAT* |
$18.8 |
$10.9 |
$29.8 |
| Total |
$136.8 |
$95.6 |
$232.4 |
| * Items account for costs only attributable to the Feasibility Study and do not extend through December 2024. |
| 23.2 | metallurgy and mineral processing |
Recommendations
Based on the results to date and positive economic
potential of the project, the QP recommends advancing the project to a Feasibility study level of definition.
Further Work
Continued and further metallurgical testing should
be done to refine acid consumption and copper recoveries by source (lithologies and spatial variability) to support the metallurgical
and geo-metallurgical understanding to support a Feasibility Study. The current metallurgical program is developed in three (3) phases
based on sample availability to support this PEA and continuing in parallel to support future study and objectives. The Phase 1 program
is complete and pending some final analysis at the time of this report and considered for the PEA analysis along with the historical information.
The Phase 2 and 3 programs are started, and metallurgical sampling and sample preparation is in progress.
A substantial metallurgical sampling program has
been delineated to support the Feasibility Study metallurgical program. Drill core programs includes 6,000 meters of additional metallurgical
PQ core drill core (and/or equivalent HQ core) and sampling to obtain approximately 90 tonnes of material, additional column leaching
metallurgical testing for both conventional and augmented bio-leaching technologies. The metallurgical work includes site testing of the
leach concepts with materials from the bulk sampling campaign. Additional testing on primary mineralization materials for potential milling
options is also considered.
| Project Los Azules – S-K 1300 Technical Report Summary | Project No.: 21139-01 | 23-304 |
Continued and further metallurgical testing should
be done to refine parameters for NutonTM bio-leaching technology and to define acid consumption and copper recoveries by source
(lithologies and spatial variability). This would include:
| · | Completion of the NutonTM technology testing at their Bundoora and Hazen testing facilities
on small columns and characterization testing. |
| · | Continued testing in a Phase 2 metallurgical testing program, using large amounts of bulk samples for
the anticipated heap lift height (columns of 10 m height) to simulate leaching of material types and lithologies to support a feasibility
study inclusion. |
| · | Test the potential benefits for direct addition of elemental sulfur to the leach materials to generate
acid, if required. |
| · | Future larger scale testing of the technology and selected parameters at the Los Azules Site to demonstrate
the process at altitude and site conditions. |
Recommendations
A second geotechnical open pit drill program is
recommended to supplement findings of the 2022/2023 drilling program. The program should include:
| · | Inclined holes into the proposed pit walls. |
| · | Televiewing of all holes. |
| · | Triple tubing to enhance recovery. |
| · | Hydrogeological investigations. |
Further resource drilling should also help support
future geotechnical pit assessments.
Further Work
The following work items are recommended for the
next stages of geotechnical pit assessment once further data is obtained through investigation.
| · | Review of newly acquired data. |
| · | Inclusion of newly acquired data into pit slope geotechnical assessment. |
| · | Further development of a structural model. |
| · | Inclusion of faulting / structure into pit slope geotechnical assessment. |
| · | Establishment of geotechnical pit domains and sectors. |
| · | Review of failure modes, including structurally controlled and rock mass failure modes. |
| · | Consideration of bench scale, inter-ramp scale, and overall scale for stability assessment. |
| · | Inclusion of modeled hydrogeology to input the phreatic surface behind the pit walls. |
| · | Consideration of pit dewatering to achieve pit wall slope optimization. |
| · | Seismic assessment of slope stability. |
| · | Development of a geotechnical risk register. |
| · | Inclusion of waste dump loading and waste dump in pit slope geotechnical assessment. |
| · | Development of monitoring plans. |
| · | Geohazard assessment of the potential natural landslides that may affect pit wall stability and/or impact
the pit. |
| Project Los Azules – S-K 1300 Technical Report Summary | Project No.: 21139-01 | 23-305 |
| · | Review of overburden thickness and nature across pit. |
| · | Additional investigation, as required, depending on findings of first geotechnical investigation. Questions
/ uncertainties / points of clarification may emerge during the assessment, which may need additional drilling the following season. |
Pit Wall Monitoring and Performance Recommendations
Monitoring plans should be developed as the design
evolves into FS. Monitoring plans should be based on best monitoring practice (Sharon, 2020). This should include:
| · | Verification of the slope design. This is an iterative process whereby slopes are monitored, actual conditions
determined, as-built plans generated and compared to predicted conditions and mine plan assumptions. Slope designs may be modified throughout
operation. |
| · | Surface Deformation monitoring using prisms and radar and including development of Trigger Action Response
Plans. |
| · | Consideration of InSAR monitoring to review overlying geohazards. |
| · | Sub-surface deformation monitoring, which may include Shape Accel Arrays (SAAs) and Time Domain Reflectometers
(TDRs). |
| · | Monitoring of climatic conditions. |
| · | Formal inspections, performance reviews and third-party review. |
| · | Ongoing Pit survey capture to include topography and pit wall mapping. |
| 23.4 | PIT DEWATERING AND WATER AVAILABILITY |
Groundwater
Dewatering test wells and associated monitoring
wells should be installed in the northeast area of the proposed pit where faults may influence groundwater flow, and in the central and
southern areas of the proposed pit. Long-term, high-capacity pumping tests should be conducted in these wells to reduce the uncertainty
in hydrogeologic parameters.
Surface Water
It is recommended that monitoring continue with
the Los Azules meteorological station since it is the only representative station in the study area. It is also recommended that an additional
weather station be installed at the site to have backup data in case of Los Azules station malfunction.
The project water balance should be updated to
include potential surface water gains and losses due to diversion structures.
Continuous recording surface water flow monitoring
stations should be installed on the Rio Salinas where it exits the Project and in the major sub watersheds.
| Project Los Azules – S-K 1300 Technical Report Summary | Project No.: 21139-01 | 23-306 |
The calculation of water availability should be
developed using a more refined and discretized methodology and considering climate change, the project facilities, water management structures,
and water demands.
A detailed contact water / non-contact water management
plan needs to be developed, including the design and location of water diversion structures and the staged formation of any contour channels.
This needs to be further supported by an engineered project water balance.
| 23.5 | MINE ROCK STORAGE FACILITIES |
The geotechnical analyses should be revisited
based on the results of the ongoing geotechnical site investigations.
Flow slide runout assessment should be completed
for the proposed MRSFs and stockpiles as the designs are refined at the DFS stage.
Guidelines should be established for operational
management of rock rollout using catch benches, berms, trenches, offsets, and/or clear and close procedures.
The wetlands within the footprints of the proposed
MRSFs should be characterized in the site investigation and laboratory testing.
It is recommended that the degradation of the
material properties be considered in the geotechnical design and be confirmed by advanced laboratory characterization methods such as
large scale, high pressure triaxial testing.
The haulage routes to the proposed MRSFs should
be assessed for snow avalanche risk.
The applicability of diversion channels and/or
underdrainage systems should be evaluated during later stages of design.
| Project Los Azules – S-K 1300 Technical Report Summary | Project No.: 21139-01 | 23-307 |
ANDES CORPORACION MINERA S.A., 3rd Actualizacion
biannual informe de impacto ambiental etapa de exploracion, expte no. 1100-0162-A-10, Proyecto Los Azules, Departamento Calingasta, Provincia
de San Juan”, April 2016.
BATTLE MOUNTAIN GOLD, (1999), Los Azules Project,
San Juan, Argentina. Informe Inédito.
CANADIAN NATIONAL INSTRUMENT 43-101 Technical
Report in Support of the Preliminary Assessment on the Development of the Los Azules Project, San Juan Province Argentina prepared by
Randolph P. Schneider, MAusIMM, Samuel Engineering, Inc. Greenwood Village, Colorado USA effective March 19, 2009.
CANADIAN NATIONAL INSTRUMENT 43-101 Technical
Report Updated Preliminary Assessment Los Azules Project, San Juan Province, Argentina prepared by Kathleen Altman, PhD, PE, Samuel Engineering,
Inc. Greenwood Village, Colorado USA effective December 16, 2010.
CANADIAN NATIONAL INSTRUMENT 43-101 Technical
Report Los Azules Porphyry Copper Project, San Juan Province, Argentina prepared by Samuel Engineering, Inc. Greenwood Village, Colorado
USA effective August 1, 2013.
CANADIAN NATIONAL INSTRUMENT 43-101 Technical
Report Los Azules Porphyry Copper Project, San Juan Province, Argentina prepared Hatch effective September 1, 2017.
CANADIAN NATIONAL INSTRUMENT 43-101 Preliminary
Economic Assessment Los Azules Copper Project, San Juan Province, Argentina prepared Samuel Engineering Inc., Stantec Consulting International
Ltd. and others, effective May 9, 2023.
CIM Definition Standards for Mineral Resources
and Reserves, November 2010.
DePANGHER, M., (2008), Spectrum Petrographics,
Minera Andes Petrographic Report # URC, Informe Inédito.
EMMONS, W.H., (1940), The Principles of Economic
Geology. McGraw-Hill.
GONZALEZ, E., y otros, (2005), Informe de Actividades
de Exploraciones, Informe Técnico. Informe Inédito.
GORDILLO, D., (2009), Minera Andes base de datos
Perforaciones Los Azules. Archivo inédito.
GUSTAFSON, L. and Hunt, P., (1975), The Porphyry
copper deposit at El Salvador, Chile, Economic Geology, v.70, p 857-912.
Hatch, 2017. S-K 1300 Technical Report-Preliminary
Economic Assessment Update for the Los Azules Project, Argentina. H354895-00000-200-230-0001, Rev. 0. October 16, 2017.
INDEC 2010 Census, Calingasta Department.
| Project Los Azules – S-K 1300 Technical Report Summary | Project No.: 21139-01 | 24-308 |
Instituto de Investigaciones Hidraulicas “Ing.
Manuel S. Garcia Wimer”, 2022. Análisis Hidroquimica Campana de Monitoreo de Aguas, Abril 2022, Proyecto Minero “Los
Azules”.
IZAP, LY, (2007), Estudio Petrográfico,
Noviembre 2007.
JEMIELITA, R., (2010), Los Azules Porphyry Copper
Deposit, San Juan Province, Argentina. Unpublished report for Minera Andes Inc.
John D.A., Ayuso R.A., Barton, M.D., Blakeley
R.J., Bodnar R.J., Dilles J.H., Gray F., Graybeal F.T., Mars J.C., McPhee D.K., Seal R.R., Taylor R.D., Vikre P.G., Porphyry Copper Deposit
Model, Chapter B of Mineral Deposit Models for Resource Assessment. United States Geological Survey.
JOURNEL AND HUIJBREGTS, Mining Geostatistics,
1978.
KUTER, J., (2003), Data presentation of geophysics
at Los Azules-Minera Andes: Xstrata and MIM Argentina Exploraciones S.A. Informe Inédito.
KUTER, J, (2003), Xstrata Los Azules Interpretación
Geológica-Geofísica. Informe Inédito.
LASRY, A., (2005), Estudio de Alteración
Hidrotermal. Rojas y Asociados-Minera Andes. Internal Report.
Lowell, J.D., and Guilbert, J.M., 1970, Lateral
and vertical alteration-mineralization zoning in porphyry ore deposits: Economic Geology, v. 65, p. 373–408.
MEGLIOLI, A (2012), Identificación y Caracterización
de Geoformas Glaciares y Peri- glaciares, Proyecto Los Azules, San Juan, Argentina. Unpublished consultant report.
MORTIMER, S., (2022), Interpretation Criteria
and Geological Modelling of the Los Azules Deposit. Unpublished consultant report.
ORICA, (2016), Evaluacion Preliminar de Paramtros
de Perforacion Y Voladura, Proyecto Los Azules, Argentina, Technology Solutions Latin America, Summary presentation.
PANTELEYEV, A., (1995), Porphyry Cu+/-Mo+/-Au
in Selected British Columbia Mineral Deposit Profiles, Volume 1 - Metallics and Coal, Lefebure, D.V. and Ray, G.E., Editors, British Columbia
Ministry of Energy of Employment and Investment, Open File 1995-20, pages 87- 92.
PLENGE, Metallurgical Investigation No. 6976-6991/7026-7027
Minera Andes Incorporated Los Azules Copper Project Metallurgical Scoping Study, July 21, 2008.
PLENGE, Metallurgical Investigation No. 7028 Minera
Andes Incorporated Los Azules Copper Project Composite No. 3, September 12, 2008.
PLENGE, Metallurgical Investigation No. 7652-54
Minera Andes Incorporated Los Azules Copper Project Copper Gold Project, 31 March 2010.
PLENGE, Metallurgical Investigation No. 9247-69
Minera Andes Incorporated Los Azules Copper Project Flotation Variability and Optimization, Copper Bioleaching HIPOX of Concentrate, November
30, 2012.
| Project Los Azules – S-K 1300 Technical Report Summary | Project No.: 21139-01 | 24-309 |
PRATT, W., (2010), Los Azules Porphyry Cu Project,
San Juan, Argentina. Unpublished company report for Minera Andes, APrimaryl, 2010. 26 p.
ROJAS, N., (2006), Los Azules Project, drilling
completed in 2006: Geological report. Informe Inédito.
ROJAS, N., (2007), Plan De Exploraciones en Proyecto
Los Azules, Provincia de San Juan, Argentina. Período 2007-2009. Unpublished report for Minera Andes Inc.
ROJAS, N, (2008), Technical Report on Los Azules
Project andean Cordillera Region, Calingasta Department, San Juan, Province, Argentina Informe Inédito.
ROJAS, N, 2010. Informe técnico proyecto
Los Azules, temporadas 2007-2008. Provincia de San Juan, Argentina. Unpublished report for Minera Andes.
ROJAS, Nivaldo (February 2008), S-K 1300 Technical
Report on Los Azules Project andean Cordillera Region, Calingasta Department, San Juan Province, Argentina.
SEC S-K 229.1304 INITIAL ASSESSMENT INDIVIDUAL
DISCLOSURE FOR THE LOS AZULES PROJECT, ARGENTINA, prepared by Mining Plus US Corporation with an effective date of April 01, 2021.
SELMAR International Services LTDA (August 2016),
Copper Concentrates Marketing Assumptions Input for a Scoping Study for the Los Azules Project in San Juan Province Argentina.
SGS Lakefield Flotation Test Results, Project
15832-001, August 2016. SGS Santiago SMC Test Report, JKTech Job No. 17004/P12, June 2017.
SIEYE, Hugo Gil Figueroa & Asoc (September
2008), Preliminary Feasibility Study, Electric Energy Supply Study –– Preliminary Report #2.
SILLITOE R., (2014), Los Azules Porphyry Copper
Deposit, Argentina: Geological Model and Exploration Potential. Unpublished report for McEwen Mining Inc.
SILLITOE, R., (2010), Porphyry Copper Systems
Society of Economic Geologists, Inc., Economic Geology, v. 105, p 3–41.
SILLITOE, Richard H. and PERELLO, Jose, (2005)
Andean Copper Province: Tectonomagmatic Settings, Deposit types, Metallogeny, Exploration and Discovery. Economic Geology 100th Anniversary
Volume. Pp. 845-890.
SIM, R. and Davis, B., (2015), Review of the New
Geologic Interpretation at Los Azules. Unpublished report for McEwen Mining Inc.
SNL Mine Economics Market Intelligence 2016 Data.
SUMAY, C. and Meissi, E., (2006), Estudio petro-calcográfico:
Examina, Agosto 2006, San Juan, Argentina. Informe Inédito.
| Project Los Azules – S-K 1300 Technical Report Summary | Project No.: 21139-01 | 24-310 |
TSCHABRUN, D. B., Sim, R., Davis, B. (Revised
January 8, 2009), S-K 1300 Technical Report, Los Azules Copper Project, San Juan Province, Argentina.
ULRIKSEN, C., (2004), (2007), Los Azules drilling
campaign. Geological Report, Rojas y Asociados, S.A. Informe Inédito.
ULRIKSEN, C., (2007), Geological Report-Los Azules
(2007 campaign). Geological report: Rojas y Asociados, S.A. Informe Inédito.
VÀZQUEZ, P., (2015), Los Azules: Porphyry
Copper Deposit – Geologic Model. Unpublished report for McEwen Mining.
XSTRATA COPPER, Antapaccay Project. Online presentation
dated September 18, 2011. Accessed online at http://www.glencore.com/assets/media/doc/speeches_and_presentations/xstrata/2011/xcu- speech-201109184-analystvisitperu.en2.pdf
ZURCHER, L., (2008a), Geology of the Los Azules
Porphyry Copper Project, San Juan, Argentina (Preliminary Progress Report): August 3 (revised August 25), 2008 internal Minera Andes,
Inc. report, ESMI, Tucson, AZ, 12 pages.
ZURCHER, L., (2008b), Geochemistry of Rocks from
the Los Azules Porphyry Deposit, San Juan, Argentina (Addendum to ESMI August 25, 2008 Report): October 27, 2008 internal Minera Andes,
Inc. progress report, ESMI, Tucson, AZ, 14 pages.
ZURCHER, L., (2008c), U-Pb Geochronology of Rocks
from the Los Azules Porphyry Deposit, San Juan, Argentina (Addendum to ESMI August 25, 2008 Report): October 30, 2008 internal Minera
Andes, Inc. progress report, ESMI, Tucson, AZ, 8 pages.
ZURCHER, L., (2009), Interpretative Basement Geology
(Map). Los Azules Project.
ZURCHER, L., Hall, D., Gordillo, D. and Valle,
N., (2008), Geology of the Los Azules Porphyry Copper Project, San Juan, Argentina (PowerPoint Presentation): October 14, 2008, internal
Minera Andes, Inc. report, ESMI, Tucson, AZ, 18 pages.
| Project Los Azules – S-K 1300 Technical Report Summary | Project No.: 21139-01 | 24-311 |
| 25.0 | Reliance on information provided by the registrant |
This report section has been prepared for McEwen
Mining by the respective QPs referred to in Table 2.1. The information, conclusions, opinions, and estimates contained herein are based
on:
| · | Information available to the QPs at the time of preparation of this report, including the 2017 Initial
Assessment. |
| · | Assumptions, conditions, and qualifications as set forth in this report. |
| · | Data, reports, and other information supplied by McEwen Copper. |
For this report, the QPs have relied on property
ownership information provided by McEwen Mining through a legal review and opinion report titled “Incorporation and good standing
status of Andes Corporación Minera S.A. (ACMSA) and of its mining rights” dated January 11, 2023, by Abogado Jose Vargas
Gei of Vargas & Galindez (V&G), a Mendoza based legal firm. Samuel Engineering has not independently researched property title
or mineral rights for the Los Azules property and expresses no independent opinion as to the ownership status of the property.
Metal pricing assumptions are derived from information
provided by CIBC and the IMF.
McEwen Copper has provided the basis of the calculations
for all associated royalties and taxes including Argentine Income, VAT and Credit and Debit Bank Tax.
A draft copy of the Report has been reviewed for
factual errors by McEwen Mining. Any representations, statements and opinions expressed in this document are given in good faith and in
the belief that such statements and opinions are not false or misleading at the date of this Report.
| Project Los Azules – S-K 1300 Technical Report Summary | Project No.: 21139-01 | 25-312 |
| 26.1 | Appendix A – units of measure and abbreviations and acronyms |
Units of Measure
| Table 26.1: Units of Measure |
| Above Mean Sea Level |
- amsl |
| Ampere |
- A |
| Amperes per Square Meter |
- ASM |
| Annum (Year) |
- a |
| Argentine Peso |
- AR$ |
| Billion |
- B |
| British Thermal Unit |
- BTU |
| Centimeter |
- cm |
| Cubic Centimeter |
- cm3 |
| Cubic Feet Per Minute |
- cfm |
| Cubic Feet Per Second |
- ft3/s |
| Cubic Foot |
- ft3 |
| Cubic Inch |
- in3 |
| Cubic Meter |
- m3 |
| Cubic Yard |
- yd3 |
| Coefficients Of Variation |
- CVs |
| Day |
- d |
| Days Per Week |
- d/wk |
| Days Per Year (Annum) |
- d/a |
| Dead Weight Tonnes |
- DWT |
| Decibel Adjusted |
- dBa |
| Decibel |
- dB |
| Degree |
- ° |
| Degrees Celsius |
- °C |
| Diameter |
- ø |
| Dollar (American) |
- US$ |
| Dollar (Canadian) |
- CDN$ |
| Dry Metric Ton |
- dmt |
| Foot |
- ft |
| Gallon (US) |
- gal |
| Gallons Per Minute (US) |
- gpm |
| Gigajoule |
- GJ |
| Gigapascal |
- GPa |
| Gigawatt |
- GW |
| Gram |
- g |
| Project Los Azules – S-K 1300 Technical Report Summary | Project No.: 21139-01 | 26-313 |
| Table 26.1: Units of Measure |
| Grams Per Litre |
- g/L |
| Grams Per Tonne |
- g/t |
| Greater Than |
- > |
| Hectare (10,000 M2) |
- ha |
| Hertz |
- Hz |
| Horsepower |
- hp |
| Hour |
- h |
| Hours Per Day |
- h/d |
| Hours Per Week |
- h/wk |
| Hours Per Year |
- h/a |
| Inch |
- in |
| Kilo (Thousand) |
- k |
| Kilogram |
- kg |
| Kilograms Per Cubic Meter |
- kg/m3 |
| Kilograms Per Hour |
- kg/h |
| Kilograms Per Square Meter |
- kg/m2 |
| Kilometer |
- km |
| Kilometers Per Hour |
- km/h |
| Kilopascal |
- kPa |
| Kiloton (1,000 Tonnes) |
- kt |
| Kilovolt |
- kV |
| Kilovolt-Ampere |
- kVA |
| Kilovolts |
- kV |
| Kilowatt |
- kW |
| Kilowatt Hour |
- kWh |
| Kilowatt Hours Per Tonne |
- kWh/t |
| Kilowatt Hours Per Year |
- kWh/a |
| Less Than |
- < |
| Liter |
- L |
| Liters Per Minute |
- L/m |
| Liters Per Second |
- L/s |
| Megabytes Per Second |
- Mb/s |
| Megapascal |
- MPa |
| Megavolt-Ampere |
- MVA |
| Megawatt |
- MW |
| Meter |
- m |
| Meters Above Sea Level |
- masl |
| Meters Per Minute |
- m/min |
| Meters Per Second |
- m/s |
| Micron |
- μm |
| Milligram |
- mg |
| Milligrams Per Liter |
- mg/L |
| Project Los Azules – S-K 1300 Technical Report Summary | Project No.: 21139-01 | 26-314 |
| Table 26.1: Units of Measure |
| Milliliter |
- mL |
| Millimeter |
- mm |
| Million |
- M |
| Million Bank Cubic Meters |
- Mbm3 |
| Million Bank Cubic Meters Per Annum |
- Mbm3/a |
| Million Tonnes |
- Mt |
| Minute (Plane Angle) |
- ' |
| Minute (Time) |
- min |
| Month |
- mo |
| Ounce |
- oz |
| Pascal |
- Pa |
| Centipoise (MPa·S) |
- cP |
| Parts Per Million |
- ppm |
| Parts Per Billion |
- ppb |
| Percent |
- % |
| Pound(S) |
- lb |
| Pounds Per Square Inch |
- psi |
| Revolutions Per Minute |
- rpm |
| Second (Plane Angle) |
- " |
| Second (Time) |
- s |
| Short Ton (2,000 Lb) |
- st |
| Short Tons Per Day |
- st/d |
| Short Tons Per Year |
- st/y |
| Specific Gravity |
- SG |
| Square Centimetre |
- cm2 |
| Square Foot |
- ft2 |
| Square Inch |
- in2 |
| Square Kilometre |
- km2 |
| Square Metre |
- m2 |
| Three-Dimensional |
- 3D |
| Tonne (1,000 Kg) (Metric Ton) |
- t |
| Tonnes Per Day |
- t/d |
| Tonnes Per Hour |
- t/h |
| Tonnes per annum |
- t/a |
| Tonnes Seconds Per Hour Metre Cubed |
- ts/hm3 |
| United States Dollar |
- USD |
| Volt |
- V |
| Week |
- wk |
| Weight/Weight |
- w/w |
| Wet Metric Ton |
- wmt |
| Year |
- yr |
| Project Los Azules – S-K 1300 Technical Report Summary | Project No.: 21139-01 | 26-315 |
Abbreviations and Acronyms
| Table 26.2: Abbreviations and Acronyms |
| Acid Generating |
- AG |
| Acid Rock Drainage |
- ARD |
| Alternating Current |
- AC |
| Ammonium Nitrate Fuel Oil |
- ANFO |
| Association for the Advancement of Cost Engineering |
- AACE |
| Andes Corporación Minera S.A. |
- ACMSA |
| Autogenous/Ball Mill/Crushing |
- ABC |
| Battle Mountain Gold |
- BMG |
| Bond Ball Mill Work Index |
- BWi |
| Inductively Coupled Plasma |
- ICP |
| Canadian Institute of Mining, Metallurgy and Petroleum |
- CIM |
| Certificate Of Approval |
- CofA |
| Close-Circuit Fully Autogenous Grinding Milling |
- FAC |
| Conceptual Closure and Rehabilitation Plan |
- CRP |
| Construction Quality Assurance |
- CQA |
| Direct Current |
- DC |
| Diorite (Pre-Mineral Pluton) |
- DIO / PMP |
| Enrichment Ratio |
- ER |
| Environmental Impact Assessment |
- EIA |
| Environmental Impact Review |
- EIR |
| Environment, Social & Government |
- ESG |
| Exploratory Data Analysis |
- EDA |
| Early Mineral Porphyry |
- EMP |
| Ground Engaging Tools |
- GET |
| Hydrothermal Breccia |
- HBX |
| Hypogene (Primary Zone) |
- HYP |
| Induced Polarization |
- IP |
| Internal Rate of Return |
- IRR |
| International Organization for Standardization |
- ISO |
| In-The-Hole |
- ITH |
| Inverse Distance-Weighted |
- ID |
| Inter Mineral Porphyry |
- IMP |
| Leach Zone |
- LIX |
| Lerchs-Grossman |
- LG |
| Life-Of-Mine |
- LOM |
| Load-Haul-Dump |
- LHD |
| Project Los Azules – S-K 1300 Technical Report Summary | Project No.: 21139-01 | 26-316 |
| Table 26.2: Abbreviations and Acronyms |
| Los Azules Mining, Inc |
- LAMI |
| Magmatic Hydrothermal Breccia |
- MAG HYD BX |
| Magneto Telluric |
- MT |
| Million Years Ago |
- Mya |
| Mine Block Intrusion |
- MBI |
| Minera Andes S.A. |
- MASA |
| Minimum Environmental Protection Standard Laws |
- MEPSL |
| Mount Isa Mines |
- MIM |
| Canadian National Instrument 43-101 |
- S-K 1300 |
| Nearest Neighbor |
- NN |
| Net Acid Generating/Generation |
- NAG |
| Net Present Value |
- NPV |
| Net Smelter Return |
- NSR |
| New York Stock Exchange |
- NYSE |
| Ordinary Kriging |
- OK |
| Overburden Zone |
- OVB |
| Portable Infrared Spectrometer |
- Pima |
| Preliminary Economic Assessment |
- PEA |
| Primary Zone |
- PR |
| Qualified Persons |
- QPs |
| Quality Assurance |
- QA |
| Quality Control |
- QC |
| Relative Bulk Strength |
- RBS |
| Reverse Circulation |
- RC |
| Rock Quality Designation |
- RQD |
| Run-Of-Mine |
- ROM |
| Selective Mining Unit |
- SMU |
| Semi-Autogenous |
- SAG |
| Semi-Autogenous/Ball Mill/Crushing |
- SABC |
| SGS Lakefield Research Ltd. |
- SGS |
| Solitario Argentina S.A. |
- SASA |
| Specific Gravity |
- SG |
| Standard Reference Material |
- SRM |
| Supergene Zone |
- SS |
| Tailings Storage Facility |
- TSF |
| Toronto Stock Exchange |
- TSX |
| Unidirectional Solidification Texture |
- UST |
| Project Los Azules – S-K 1300 Technical Report Summary | Project No.: 21139-01 | 26-317 |
| Table 26.2: Abbreviations and Acronyms |
| United Nations Development Program |
- UNDP |
| Volcanics |
- VOLCS |
| Waste Rock Storage Facility |
- WRSF |
| World Meteorological Organization |
- WMO |
| Project Los Azules – S-K 1300 Technical Report Summary | Project No.: 21139-01 | 26-318 |
| X |
- DefinitionBoolean flag that is true when the XBRL content amends previously-filed or accepted submission.
| Name: |
dei_AmendmentFlag |
| Namespace Prefix: |
dei_ |
| Data Type: |
xbrli:booleanItemType |
| Balance Type: |
na |
| Period Type: |
duration |
|
| X |
- DefinitionFor the EDGAR submission types of Form 8-K: the date of the report, the date of the earliest event reported; for the EDGAR submission types of Form N-1A: the filing date; for all other submission types: the end of the reporting or transition period. The format of the date is YYYY-MM-DD.
| Name: |
dei_DocumentPeriodEndDate |
| Namespace Prefix: |
dei_ |
| Data Type: |
xbrli:dateItemType |
| Balance Type: |
na |
| Period Type: |
duration |
|
| X |
- DefinitionThe type of document being provided (such as 10-K, 10-Q, 485BPOS, etc). The document type is limited to the same value as the supporting SEC submission type, or the word 'Other'.
| Name: |
dei_DocumentType |
| Namespace Prefix: |
dei_ |
| Data Type: |
dei:submissionTypeItemType |
| Balance Type: |
na |
| Period Type: |
duration |
|
| X |
- DefinitionAddress Line 1 such as Attn, Building Name, Street Name
| Name: |
dei_EntityAddressAddressLine1 |
| Namespace Prefix: |
dei_ |
| Data Type: |
xbrli:normalizedStringItemType |
| Balance Type: |
na |
| Period Type: |
duration |
|
| X |
- DefinitionAddress Line 2 such as Street or Suite number
| Name: |
dei_EntityAddressAddressLine2 |
| Namespace Prefix: |
dei_ |
| Data Type: |
xbrli:normalizedStringItemType |
| Balance Type: |
na |
| Period Type: |
duration |
|
| X |
- Definition
+ References
+ Details
| Name: |
dei_EntityAddressCityOrTown |
| Namespace Prefix: |
dei_ |
| Data Type: |
xbrli:normalizedStringItemType |
| Balance Type: |
na |
| Period Type: |
duration |
|
| X |
- DefinitionISO 3166-1 alpha-2 country code.
| Name: |
dei_EntityAddressCountry |
| Namespace Prefix: |
dei_ |
| Data Type: |
dei:countryCodeItemType |
| Balance Type: |
na |
| Period Type: |
duration |
|
| X |
- DefinitionCode for the postal or zip code
| Name: |
dei_EntityAddressPostalZipCode |
| Namespace Prefix: |
dei_ |
| Data Type: |
xbrli:normalizedStringItemType |
| Balance Type: |
na |
| Period Type: |
duration |
|
| X |
- DefinitionName of the state or province.
| Name: |
dei_EntityAddressStateOrProvince |
| Namespace Prefix: |
dei_ |
| Data Type: |
dei:stateOrProvinceItemType |
| Balance Type: |
na |
| Period Type: |
duration |
|
| X |
- DefinitionA unique 10-digit SEC-issued value to identify entities that have filed disclosures with the SEC. It is commonly abbreviated as CIK. Reference 1: http://www.xbrl.org/2003/role/presentationRef
-Publisher SEC
-Name Exchange Act
-Number 240
-Section 12
-Subsection b-2
| Name: |
dei_EntityCentralIndexKey |
| Namespace Prefix: |
dei_ |
| Data Type: |
dei:centralIndexKeyItemType |
| Balance Type: |
na |
| Period Type: |
duration |
|
| X |
- DefinitionIndicate if registrant meets the emerging growth company criteria. Reference 1: http://www.xbrl.org/2003/role/presentationRef
-Publisher SEC
-Name Exchange Act
-Number 240
-Section 12
-Subsection b-2
| Name: |
dei_EntityEmergingGrowthCompany |
| Namespace Prefix: |
dei_ |
| Data Type: |
xbrli:booleanItemType |
| Balance Type: |
na |
| Period Type: |
duration |
|
| X |
- DefinitionCommission file number. The field allows up to 17 characters. The prefix may contain 1-3 digits, the sequence number may contain 1-8 digits, the optional suffix may contain 1-4 characters, and the fields are separated with a hyphen.
| Name: |
dei_EntityFileNumber |
| Namespace Prefix: |
dei_ |
| Data Type: |
dei:fileNumberItemType |
| Balance Type: |
na |
| Period Type: |
duration |
|
| X |
- DefinitionTwo-character EDGAR code representing the state or country of incorporation.
| Name: |
dei_EntityIncorporationStateCountryCode |
| Namespace Prefix: |
dei_ |
| Data Type: |
dei:edgarStateCountryItemType |
| Balance Type: |
na |
| Period Type: |
duration |
|
| X |
- DefinitionThe exact name of the entity filing the report as specified in its charter, which is required by forms filed with the SEC. Reference 1: http://www.xbrl.org/2003/role/presentationRef
-Publisher SEC
-Name Exchange Act
-Number 240
-Section 12
-Subsection b-2
| Name: |
dei_EntityRegistrantName |
| Namespace Prefix: |
dei_ |
| Data Type: |
xbrli:normalizedStringItemType |
| Balance Type: |
na |
| Period Type: |
duration |
|
| X |
- DefinitionThe Tax Identification Number (TIN), also known as an Employer Identification Number (EIN), is a unique 9-digit value assigned by the IRS. Reference 1: http://www.xbrl.org/2003/role/presentationRef
-Publisher SEC
-Name Exchange Act
-Number 240
-Section 12
-Subsection b-2
| Name: |
dei_EntityTaxIdentificationNumber |
| Namespace Prefix: |
dei_ |
| Data Type: |
dei:employerIdItemType |
| Balance Type: |
na |
| Period Type: |
duration |
|
| X |
- DefinitionLocal phone number for entity.
| Name: |
dei_LocalPhoneNumber |
| Namespace Prefix: |
dei_ |
| Data Type: |
xbrli:normalizedStringItemType |
| Balance Type: |
na |
| Period Type: |
duration |
|
| X |
- DefinitionBoolean flag that is true when the Form 8-K filing is intended to satisfy the filing obligation of the registrant as pre-commencement communications pursuant to Rule 13e-4(c) under the Exchange Act. Reference 1: http://www.xbrl.org/2003/role/presentationRef
-Publisher SEC
-Name Exchange Act
-Number 240
-Section 13e
-Subsection 4c
| Name: |
dei_PreCommencementIssuerTenderOffer |
| Namespace Prefix: |
dei_ |
| Data Type: |
xbrli:booleanItemType |
| Balance Type: |
na |
| Period Type: |
duration |
|
| X |
- DefinitionBoolean flag that is true when the Form 8-K filing is intended to satisfy the filing obligation of the registrant as pre-commencement communications pursuant to Rule 14d-2(b) under the Exchange Act. Reference 1: http://www.xbrl.org/2003/role/presentationRef
-Publisher SEC
-Name Exchange Act
-Number 240
-Section 14d
-Subsection 2b
| Name: |
dei_PreCommencementTenderOffer |
| Namespace Prefix: |
dei_ |
| Data Type: |
xbrli:booleanItemType |
| Balance Type: |
na |
| Period Type: |
duration |
|
| X |
- DefinitionTitle of a 12(b) registered security. Reference 1: http://www.xbrl.org/2003/role/presentationRef
-Publisher SEC
-Name Exchange Act
-Number 240
-Section 12
-Subsection b
| Name: |
dei_Security12bTitle |
| Namespace Prefix: |
dei_ |
| Data Type: |
dei:securityTitleItemType |
| Balance Type: |
na |
| Period Type: |
duration |
|
| X |
- DefinitionName of the Exchange on which a security is registered. Reference 1: http://www.xbrl.org/2003/role/presentationRef
-Publisher SEC
-Name Exchange Act
-Number 240
-Section 12
-Subsection d1-1
| Name: |
dei_SecurityExchangeName |
| Namespace Prefix: |
dei_ |
| Data Type: |
dei:edgarExchangeCodeItemType |
| Balance Type: |
na |
| Period Type: |
duration |
|
| X |
- DefinitionBoolean flag that is true when the Form 8-K filing is intended to satisfy the filing obligation of the registrant as soliciting material pursuant to Rule 14a-12 under the Exchange Act. Reference 1: http://www.xbrl.org/2003/role/presentationRef
-Publisher SEC
-Name Exchange Act
-Section 14a
-Number 240
-Subsection 12
| Name: |
dei_SolicitingMaterial |
| Namespace Prefix: |
dei_ |
| Data Type: |
xbrli:booleanItemType |
| Balance Type: |
na |
| Period Type: |
duration |
|
| X |
- DefinitionTrading symbol of an instrument as listed on an exchange.
| Name: |
dei_TradingSymbol |
| Namespace Prefix: |
dei_ |
| Data Type: |
dei:tradingSymbolItemType |
| Balance Type: |
na |
| Period Type: |
duration |
|
| X |
- DefinitionBoolean flag that is true when the Form 8-K filing is intended to satisfy the filing obligation of the registrant as written communications pursuant to Rule 425 under the Securities Act. Reference 1: http://www.xbrl.org/2003/role/presentationRef
-Publisher SEC
-Name Securities Act
-Number 230
-Section 425
| Name: |
dei_WrittenCommunications |
| Namespace Prefix: |
dei_ |
| Data Type: |
xbrli:booleanItemType |
| Balance Type: |
na |
| Period Type: |
duration |
|
McEwen Mining (NYSE:MUX)
Historical Stock Chart
From Sep 2024 to Oct 2024

McEwen Mining (NYSE:MUX)
Historical Stock Chart
From Oct 2023 to Oct 2024
